
SOCY3700 Selected Overheads Prof. Backman Spring 2008 Update history.
111
SOCY3700 Selected Overheads Prof. Backman Spring 2008 Update history
-
Upload
osborne-flynn -
Category
Documents
-
view
213 -
download
0
Transcript of SOCY3700 Selected Overheads Prof. Backman Spring 2008 Update history.
SOCY3700 Selected Overheads
Prof. BackmanSpring 2008
Update history
Central Limit Theorem
If repeated random samples of size n are drawn from any population with mean μ and standard deviation δ, the sampling distribution of sample means will be normal as n gets large, with mean μ and standard deviation δ/√n (also known as the standard error of the mean) .
Hence, the standard deviation of the means drawn from many, many samples reflects 1) the standard deviation of the population, and 2) the sample size
Probability Sampling
• Probability sampling is any method of drawing a sample of elements from a population such that the probability that any element or set of elements will be included in the sample is known and is not zero
• The chief advantage of probability sampling is that the accuracy (or lack thereof) of estimates of population parameters from the sample can be estimated
Finite Populations and Sampling
• Sampling error estimation depends on the Central Limit Theorem
• The Central Limit Theorem applies to infinite populations– Infinite populations are easy to do in
theory, but rare in practice
• If you sample everyone in a finite population, the sampling error would be 0– The closer you get to sampling
everyone, the smaller your error should be
– Central Limit Theorem says error is proportional to δ/√n
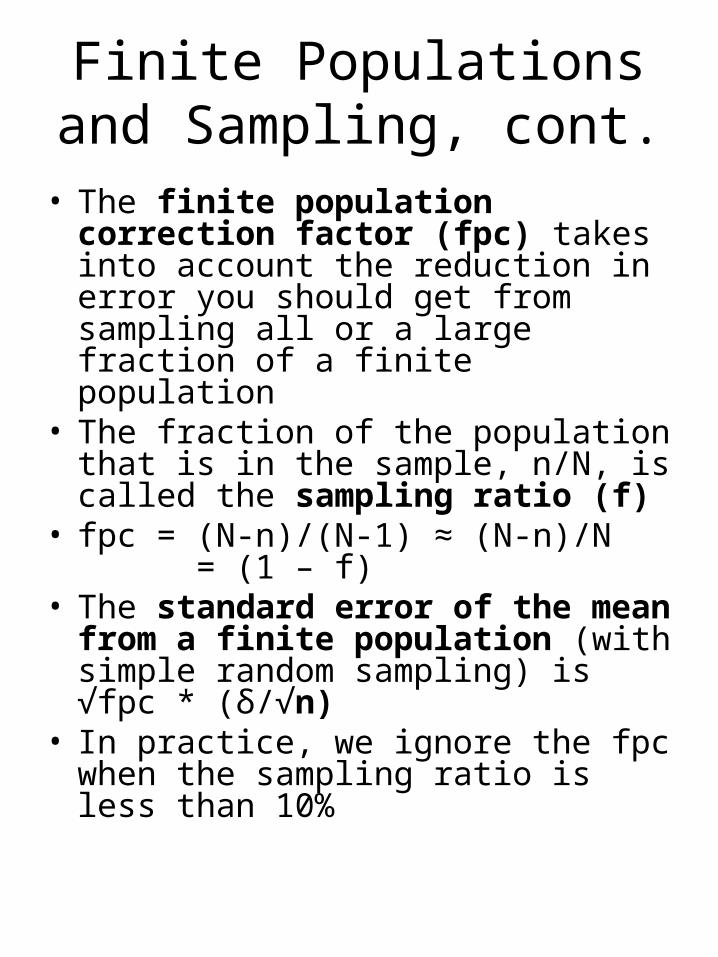
Finite Populations and Sampling, cont.
• The finite population correction factor (fpc) takes into account the reduction in error you should get from sampling all or a large fraction of a finite population
• The fraction of the population that is in the sample, n/N, is called the sampling ratio (f)
• fpc = (N-n)/(N-1) ≈ (N-n)/N = (1 – f)
• The standard error of the mean from a finite population (with simple random sampling) is√fpc * (δ/√n)
• In practice, we ignore the fpc when the sampling ratio is less than 10%
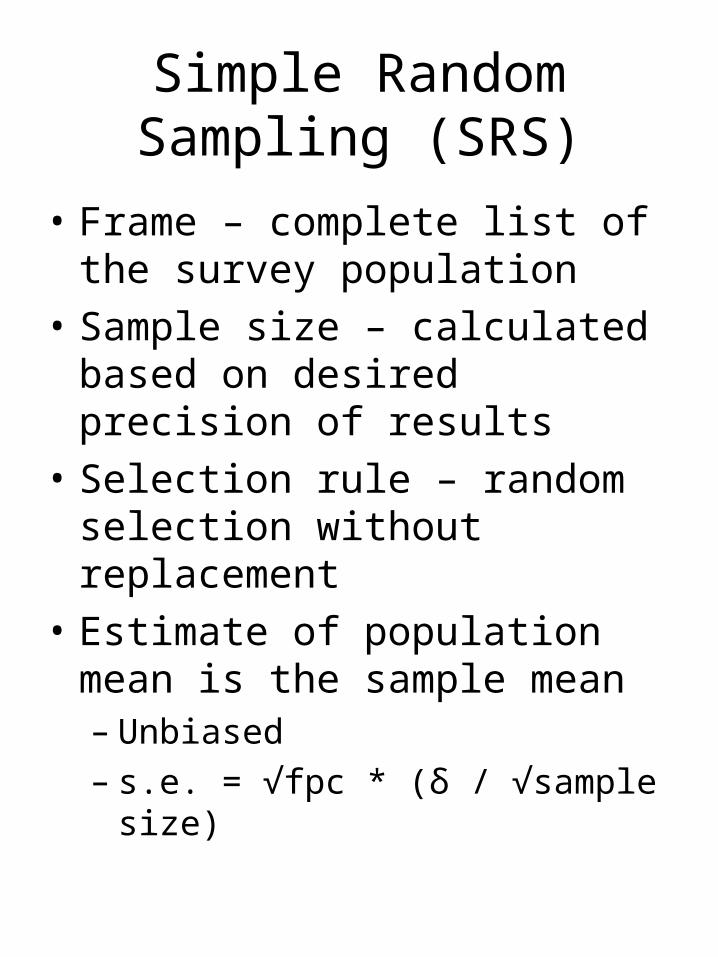
Simple Random Sampling (SRS)
• Frame – complete list of the survey population
• Sample size – calculated based on desired precision of results
• Selection rule – random selection without replacement
• Estimate of population mean is the sample mean– Unbiased– s.e. = √fpc * (δ / √sample size)
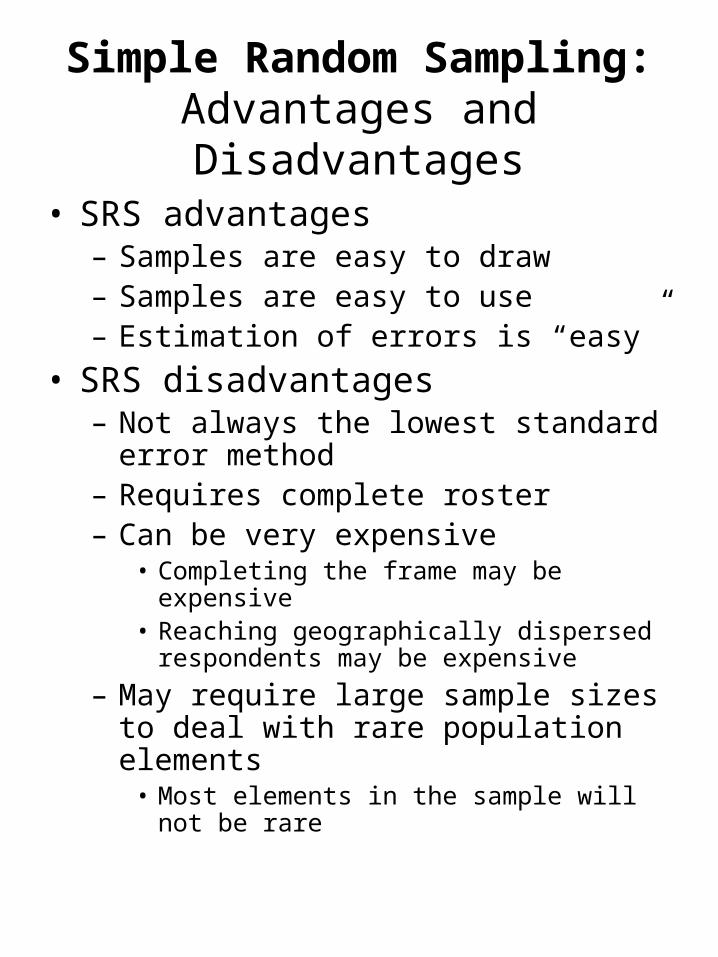
Simple Random Sampling: Advantages and Disadvantages
• SRS advantages– Samples are easy to draw– Samples are easy to use– Estimation of errors is “easy”
• SRS disadvantages– Not always the lowest standard error
method– Requires complete roster– Can be very expensive
• Completing the frame may be expensive• Reaching geographically dispersed
respondents may be expensive
– May require large sample sizes to deal with rare population elements
• Most elements in the sample will not be rare
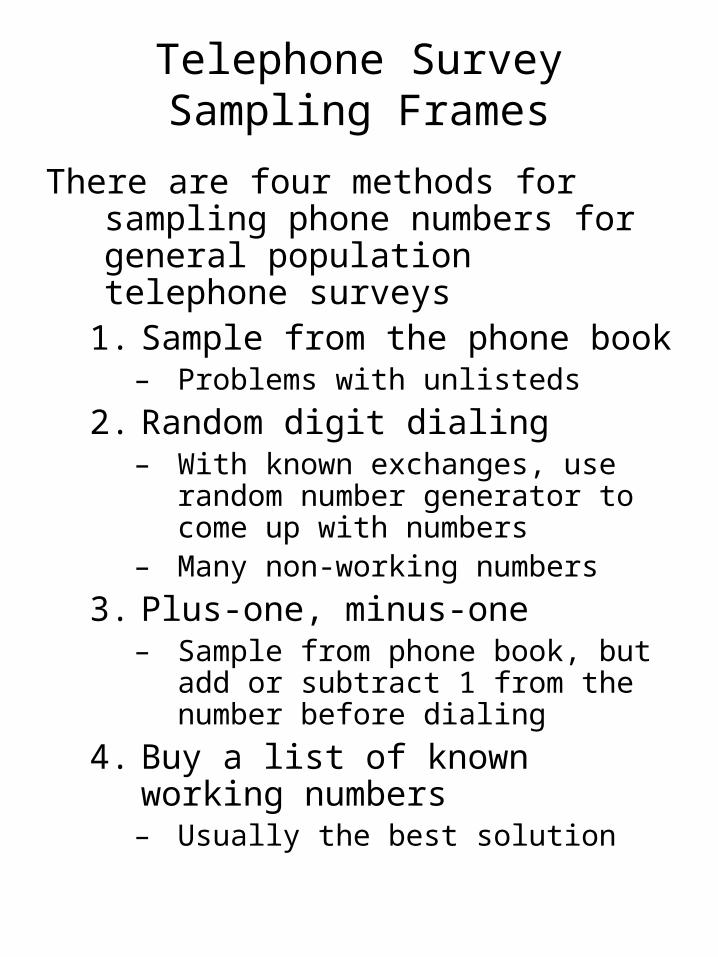
Telephone Survey Sampling Frames
There are four methods for sampling phone numbers for general population telephone surveys
1. Sample from the phone book– Problems with unlisteds
2. Random digit dialing– With known exchanges, use
random number generator to come up with numbers
– Many non-working numbers
3. Plus-one, minus-one– Sample from phone book, but add
or subtract 1 from the number before dialing
4. Buy a list of known working numbers– Usually the best solution
Stratified Sampling
• Frame– Usual SRS frame except broken
into exhaustive, mutually exclusive groups
– Requires knowledge ahead of time about how many elements in the population there are in each group
– Each group is a stratum (plural strata)
• Sample size - calculated based on desired precision of results– Calculations more complex than
with SRS because there are more alternatives
Stratified Sampling (2)
• Selection rules– Cases are drawn from each
stratum– Cases within strata are drawn by
SRS– Two alternatives for number
drawn with each stratum• Proportionate to size – every
element in the population has an equal chance of being drawn into the sample, regardless of stratum
• Disproportionate – some strata will have a larger proportion of the sample than they will of the population
Stratified Sampling (3)
• Proportionate sampling is technically known as probability proportionate to size selection, or PPS
• Disproportionate sampling is non-PPS selection
• Disproportionate sampling can be used to get enough “rare elements” into a sample to allow analysis of such elements with a reasonable level of confidence
Stratified Sampling (4)
• Estimation of the mean– If proportionate to size selection is
used, the sample mean is an unbiased estimate of the population mean
– If disproportionate selection is used, weights must be used to obtain an unbiased estimate of the population mean
– Standard error of the mean will ordinarily be lower than the standard error from a simple random sample of the same size
– The more homogeneous the elements are within strata, the more efficient stratified sampling will be
Stratified Sampling: Advantages and Disadvantages
(compared with Simple Random Sampling)
• Advantages– Reduced standard errors of estimate
over SRS– Can thus get the same precision as
SRS with smaller sample size– If proportionate selection is used,
unweighted sample statistics can be used to estimate population parameters
– Disproportionate selection can be used to get sufficient numbers of members of rare populations
• Disadvantages– Requires advanced knowledge about
stratum sizes– Disproportionate selection requires
use of weights in making estimates of parameters
Cluster Sampling• Most complex method. Often used
in conjunction with stratification and SRS; this is called multi-stage sampling
• Frame– Broken into groups called clusters– Complete frame is needed only for
clusters that are selected• It is necessary to know the size of clusters
that are not selected
• Sample size – usually calculated based on explicit tradeoff between costs and precision of results– Calculations more complex than with
SRS or stratification because there are more alternatives
Cluster Sampling (2)
• Selection rules– A sample of the clusters is drawn
by simple random sampling– Within each cluster either all the
elements or a simple random sample of the elements are drawn
– When possible, sample sizes within clusters are drawn proportionate to size
– NOTE that in cluster sampling only some of the clusters are used, while in stratified sampling, all of the strata are
Cluster Sampling (3)• Estimation of the mean
– If clusters and elements within clusters were drawn so that all elements in the population had equal probabilities of selection, the sample mean is an unbiased estimate of the population mean. This rarely is possible
– In the likely case of unequal probabilities of selection, weights must be used to obtain an unbiased estimate of the population mean
– Standard error of the mean will ordinarily be higher than the standard error from a simple random sample of the same size
– The more heterogeneous the elements are within strata, the more efficient cluster sampling will be
• To the extent possible, each cluster should be representative of the entire population
Cluster Sampling:Advantages and Disadvantages
(compared with Simple Random Sampling)
• Advantages– Cost control
• In general, the only reason to use clustering is to reduce financial or time costs
– Can be used with stratification of clusters to help control standard errors
– If proportionate selection is used, unweighted sample statistics can be used to estimate population parameters
• Disadvantages– Sampling consultant probably needed– Larger standard errors than with SRS– Parameter and error estimation
usually requires use of weights
Sample Pathologies
• Biggest, most common problem: non-response– Estimation of parameters and
errors assumes that data were collected from every element in the sample
• Limitations on generalizability due to mismatch between the population of interest (target population) and the frame (survey population)– Called coverage error
Surveys and the US Census
The Census has numerous benefits for survey researchers– The decennial census is mostly a mail
survey• Therefore, the Census Bureau sponsors a
great deal of research on writing questions and other aspects of mail surveys
– Census information is often used in developing stratified and cluster samples, where knowledge of population counts is necessary
– Census information is often used to evaluate how well a sample covers a population
• Especially when there is nonresponse, comparing demographic data from the sample with demographic data from the census can give some idea of who the nonrespondents were
Sampling Review
• Rule of thumb sampling error of a proportion at the 95 percent confidence level = 1 / square root (sample size)– If size = 400, error = 1/20 = 5%
• The Central Limit Theorem is important for social science research because it provides the mathematical basis for using probability samples 1) to make estimates of parameters from large populations using small samples and 2) to estimate the precision of those estimates
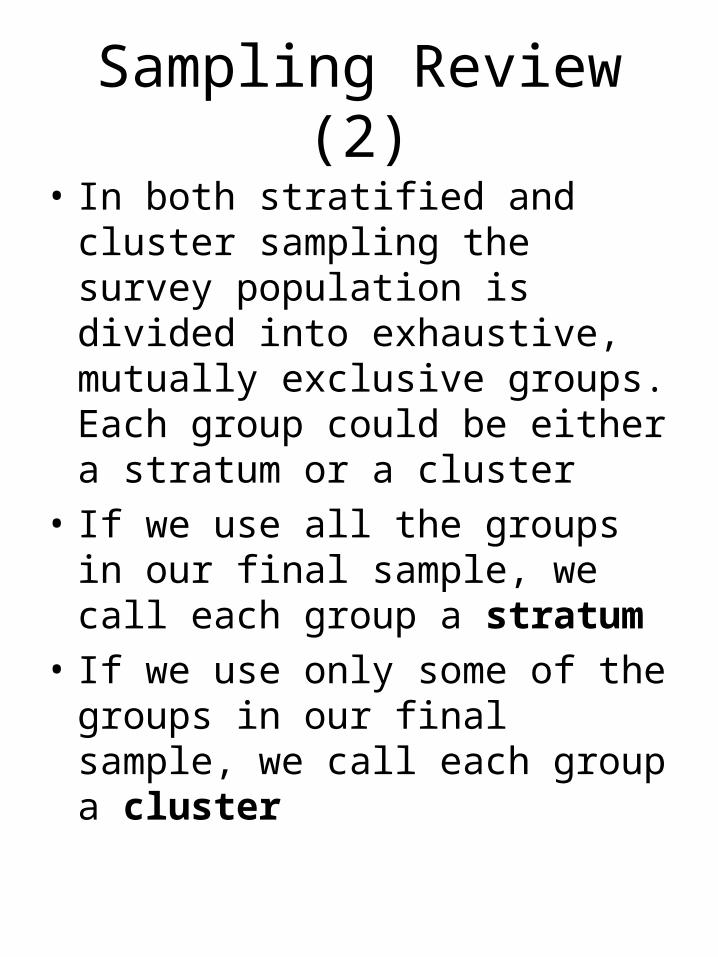
Sampling Review (2)
• In both stratified and cluster sampling the survey population is divided into exhaustive, mutually exclusive groups. Each group could be either a stratum or a cluster
• If we use all the groups in our final sample, we call each group a stratum
• If we use only some of the groups in our final sample, we call each group a cluster
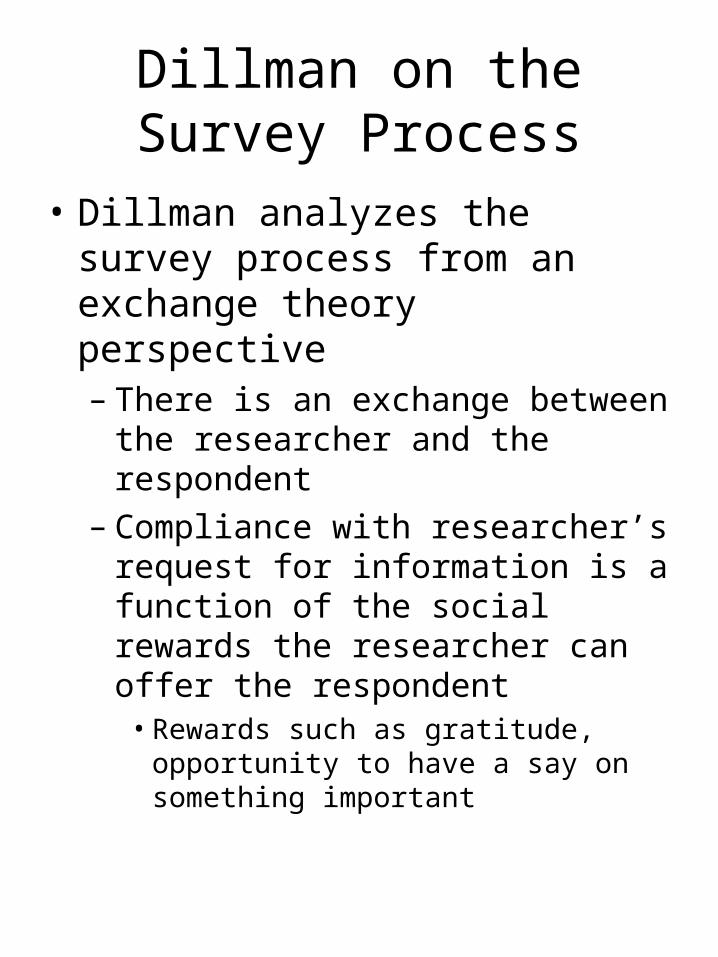
Dillman on the Survey Process
• Dillman analyzes the survey process from an exchange theory perspective– There is an exchange between
the researcher and the respondent
– Compliance with researcher’s request for information is a function of the social rewards the researcher can offer the respondent
• Rewards such as gratitude, opportunity to have a say on something important
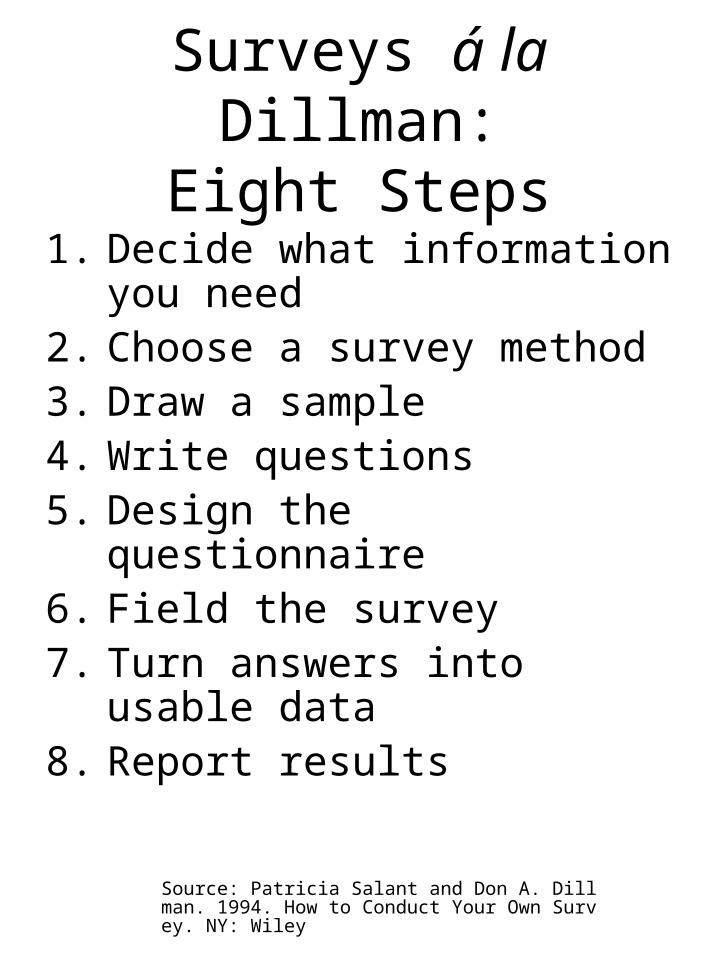
Source: Patricia Salant and Don A. Dillman. 1994. How to Conduct Your Own Survey. NY: Wiley
Surveys á la Dillman:Eight Steps
1. Decide what information you need
2. Choose a survey method3. Draw a sample4. Write questions5. Design the questionnaire6. Field the survey7. Turn answers into usable
data8. Report results
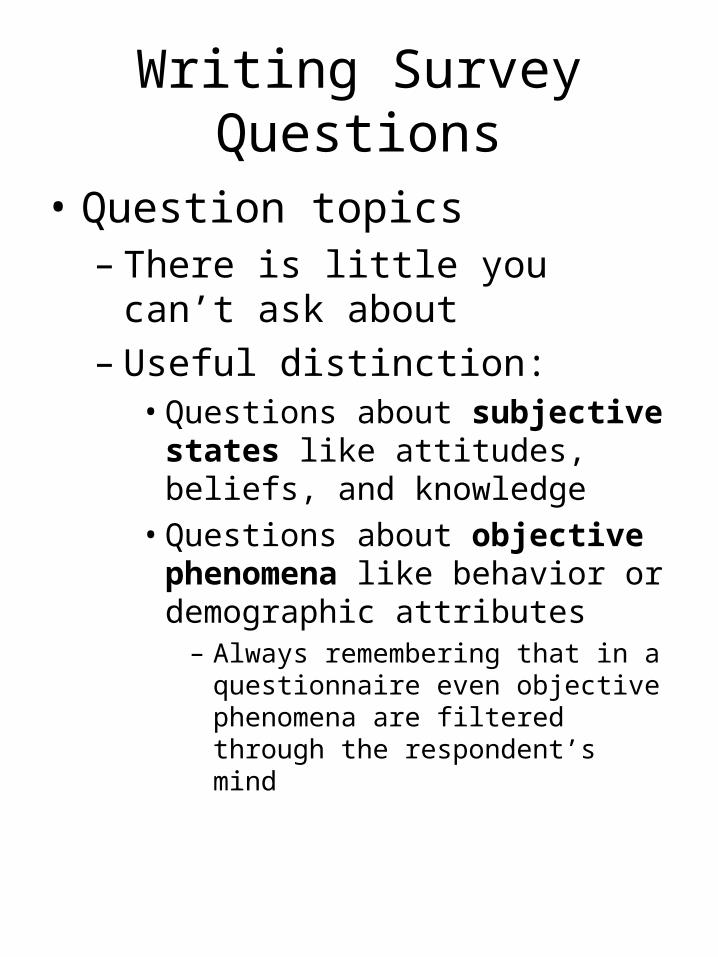
Writing Survey Questions
• Question topics– There is little you can’t ask about– Useful distinction:
• Questions about subjective states like attitudes, beliefs, and knowledge
• Questions about objective phenomena like behavior or demographic attributes
– Always remembering that in a questionnaire even objective phenomena are filtered through the respondent’s mind
Pp. 177ff in W.L. Neuman. 2007. Basics of Social Research. 2nd ed. Boston: Pearson
Writing Survey Questions (2):
Question Form• Two basic question forms:
open-ended and closed-ended
• Open-ended questions are questions to which respondents can give any answer
• Closed-ended questions both ask a question and provide the respondent with preset answers to the question to choose among
Writing Survey Questions (3):
Closed-ended Questions• Questions with ordered
categories– E.g., Likert scale items– When there is an order, be sure
to use it
• Questions with unordered categories
• Partially closed-ended– One option is something like
“Other (please specify) ____”
Pp. 170-3 in W.L. Neuman. 2007. Basics of Social Research. 2nd ed. Boston: Pearson
Writing Survey Questions:Neuman’s
Dirty Dozen Don’ts1. Avoid jargon, slang, and
abbreviations
2. Avoid ambiguity, confusion, and vagueness
a. Whatever
3. Avoid emotional languagea. Can evoke frames that
effectively hijack the intent of the question
4. Avoid prestige bias
Pp. 170-3 in W.L. Neuman. 2007. Basics of Social Research. 2nd ed. Boston: Pearson
Writing Survey Questions:Neuman’s
Dirty Dozen Don’ts (2)5. Avoid double-barreled
questions
6. Do not confuse beliefs with reality
7. Avoid leading questions
8. Avoid asking questions that are beyond respondents’ capabilities
Pp. 170-3 in W.L. Neuman. 2007. Basics of Social Research. 2nd ed. Boston: Pearson
Writing Survey Questions:Neuman’s
Dirty Dozen Don’ts (3)9. Avoid false premises
10.Avoid asking about intentions in the distant future
11.Avoid double negatives
12.Avoid overlapping or unbalanced response categories
Questionnaire Layout (1)
• Very important– Reflects your professionalism in the
eyes or ears of your respondents and the eyes of your interviewers
– Affects the likelihood of measurement error through respondent or interviewer error
– Affects response rate
• In mail surveys designed primarily with respondent in mind
• In telephone and face-to-face surveys, designed with both interviewer and respondent in mind
Questionnaire Layout (2):Mail Surveys
• Overall objectives– Minimize perceived (and real)
respondent burden– Don’t confuse respondent– Simplify later data entry
• Make a booklet– Questions are enclosed inside a
booklet made of folded legal sized (8.5 x 14 inch) paper
– No questions on the front or back of the booklet
Questionnaire Layout (3):Mail Surveys
• Front page of booklet:– Title of study– Some graphic stuff– Sponsor– Return address
• Back page– Request for comments– Thank you– Return address and telephone
contact information
Questionnaire Layout (4):Mail Surveys
• Overall question sequence– Start easy
• First question must grab attention, reflect the issues in the cover letter, and not be too difficult or threatening
– Start on topic– Group like questions together
• Makes writing transitions easier
– Keep threatening questions until later in the questionnaire
– Get your demographics last• That’s probably least important to
you and apparently least relevant to respondent
Questionnaire Layout (5):Mail Surveys
• Layout of individual pages– Use white space
• What counts is not how many pages the survey is, but rather how long it seems to be to respondents
– Use fonts consistently to distinguish questions, answers, and instructions
• Dillman likes to use bold for questions, all caps for answers, unbolded for transitions, and unbolded in parentheses for instructions
– Establish a vertical flow– Precode the answers, usually on
the left margin
Source: Salant and Dillman
Fielding Mail Surveys (1)
Overview
1. We’re always trying to increase response rates
2. Respondents are most likely to respond if they think benefits outweigh their costs
3. We need to keep respondents engaged from the opening of the mail through the returning of the completed questionnaire
Source: Salant and Dillman
Fielding Mail Surveys (2)
Bottom lines1. Mail survey response rates depend very much on the number of contacts2. Mail surveys require advanced planning
- Be sure you have the resources to meet the schedule
3. What really matters is the overall look and feel of the questionnaire
- It’s a lot like buying (or selling!) a car
Fielding Mail Surveys (3)
• First mailout – advanced notice letter– Sent to the entire sample– Mailed first class– Handwritten signature– Explains why there will be a
survey– Explains why participation will be
appreciated
• Put yourself on the mailing list for this and all other mailings
Source: Salant and Dillman
Fielding Mail Surveys (4)
• Second mailout – cover letter, questionnaire, and return envelope– Sent one week after advanced
notice– Cover letter
• Personalized• Explains survey purpose• Explains ID# on the questionnaire
and promises confidentiality• Reinforces importance of
everyone’s participation• Specifies who should complete the
questionnaire• Thanks respondent for participation• Hand signed
Fielding Mail Surveys (5)[Second mailout, cont]
• Questionnaire – with ID number
• Return envelope is stamped, addressed, and ready for use
Fielding Mail Surveys (6)
• Third mailout – postcard followup– 4 to 8 days later– Personalized– Reminding and thanking
• Fourth mailout – new cover letter, questionnaire, and return envelope– Three weeks after the second
mailout (the first one with a copy of the questionnaire)
– Sent only to addresses that have not yet returned the survey
Fielding Mail Surveys (7)
• The four mailings should yield a final response rate of 50 – 60 percent
• To further increase response rate, one can:– Send another follow up like the
fourth mailing– Send the follow up as certified or
express mail– Telephone
• Often you will discover that people shouldn’t have been in the sample in the first place
Experiments: Overview• Experiments are particularly
important in microsociological research, i.e., social psychology– It is difficult to have enough
control over the setting to do macrosociological experiments
• We can do quasi-experiments• We can observe natural
experiments
• In an experiment we create a believable environment
• In experiments we try to control “everything”– Ceteris paribus – all other things
being equal
Levels of Involvement in Observational Research
• There are several types of involvement of the researcher and the people he is trying to study
1. Outside observation – studying a group entirely from the outside, perhaps through intensive interviews
2. Overt complete observation – observing from within the group and known by the group to be there as an observer
Levels of Involvement in Observational Research (2)
3. Participating observer -- mostly an observer but also participating in the activities of the group
4. Observing participant -- mostly a group member but also observing the activities of the group
Participating observer and observing participant are types of participant observation

Street Corner Society: The Social Structure of
an Italian Slum
William Foote Whyte, 1943 (third edition, 1981)

Whyte Bio
• Educated middle class upbringing• Loved to write• Attended Swarthmore in suburban
Philadelphia• Engaged in some reform activities
in college, but engaged even more in writing
• Wrote a novel, decided it was lousy because he didn’t have enough to say
• Got a Junior Fellowship at Harvard – three years just to hang around and do whatever research took his fancy (sort of)
The Research Problem• Whyte came to Harvard knowing
mainly that he wanted to study slums and somehow improve the world
• Social scientific literature was just beginning to appear. He read lots of it
• Other folks at Harvard had done similar work and were developing some theoretical ideas about group process– One would not think one would go to a
slum to study group process, but in the end that was a big part of what Whyte did
• Many of the ideas Whyte when he started his work came to naught– “We set out on the frontiers of our
personal knowledge and began exploring beyond those frontiers” (Whyte 1984:63)
“Cornerville”
• In the usual fashion, Whyte gave his city and neighborhood a psuedonym. Cornerville refers to the slum, now known to be Boston’s North End. He called Boston “Eastern City.”
• At the time (around 1937) Cornerville was suffering the effects of The Great Depression
• Predominately Italian in a city whose big politicians were mostly Irish
• Many residents spoke only Italian
Getting In• Wandered around Boston,
settled on Cornerville because it “looked like” his vision of a slum
• Could observe from the outside, but wanted to observe from the inside
• After various failed schemes, introduced to Doc by the social worker in charge of girls’ programs at the local settlement house
• Moved into the neighborhood
Doc
• Doc (a psuedonym for Ernest Pecci) is probably the most famous informant in sociology– A pretty good sociologist himself
for someone who never had a sociology course
• Late 20s, mostly unemployed guy from the neighborhood
• Informal leader of a group of similarly underemployed age mates
• Interested in making things better
Doc and Bill
• Doc’s famous response to Whyte’s first rambling description of what Whyte was trying to do in Cornerville: “Do you want to see the high life or the low life?”
• Doc served as Whyte’s sponsor, guide, and “member validator”– Having a sponsor can be a problem in
settings with a great deal of conflict, as you may be seen as being on your sponsor’s side
– “Member validator”: insider who reviews the sociologist’s analysis from an insider’s point of view
Getting On
• Whyte moved into Cornerville, taking a room with a family
• Whyte tried to learn Italian– Though never got proficient, he
felt his efforts gave him a great deal of credibility, especially with the older generation
• Joined various clubs, becoming secretary of at least one
• Hung out with Doc’s gang• Returned regularly to Harvard
for baths and brainstorming with other social scientists
Going Native• When you start to act like and
especially to think like the people you are studying, you have gone native– Quite common occurrence– It is difficult to completely go native
• Whyte’s efforts to swear like the other guys weren’t successful, partly because they wanted him to be himself
– Can get you in trouble• Whyte voted illegally• Whyte almost inadvertently got
engaged because he didn’t understand as much of native practice as he thought
– The natives aren’t always grateful
Street Corner Society: Sources
Whyte, William F. [1943] 1981. Street Corner Society. 3rd ed. Chicago, IL: University of Chicago Press.
Whyte, William F. 1984. Learning From the Field: A Guide from Experience. Newbury Park, CA: Sage.
Whyte, William F. nd. Various personal and classroom communications.

Bernard on Unstructured Interviews
• H. Russell Bernard – cultural anthropologist from U of Florida, author of a research methods text I have used in advanced research methods courses– As surveys are to sociologists, so
unstructured (and semi-structured) interviews are to cultural anthropologists
– As a researcher, journal editor, and methods text author, Bernard has been given credit for strengthening the rigor of anthropological research
Source: Bernard, H. Russell. 1995. Research Methods in Anthropology: Qualitative and Quantitative Approaches. 2nd ed. Walnut Creek, CA: AltaMira. Mostly Chapter 10, pp. 208-36.
Bernard on Unstructured Interviews (2):
Continuum of Interview Situations
Since the researcher is an outsider, the locals will generally be aware that any contact is likely to involve information gathering
• Continuum of situations based on how much the interviewer controls the situation
1. Informal interview – more or less normal conversation
- Typical early in research- Useful for rapport- Useful later for finding topics that might
have been overlooked
Bernard on Unstructured Interviews (3):
Continuum of Interview Situations (2)
2. Unstructured interview – not just normal conversation, but with minimal control over the responses of the interviewee
3. Semi-structured – like unstructured but with an interview guide
- Interview guide: written list of topics, probes, etc. intended to be covered in the interview
- More formal than unstructured
4. Structured – questions (and often answer choices) established ahead of time by the interviewer
- For example, standard survey interviews, self-administered questionnaires
Bernard on Unstructured Interviews (4):
Starting the Interview
• Assure anonymity
• Explain their importance to your understanding
• Ask for permission to record the interview and to take notes– The value of the interview much
lower if you can’t record or take notes
– Even with recorder it helps to take occasional notes
Bernard on Unstructured Interviews (5):
Let the Informant Lead
Rule # 1: get an informant on the topic and get out of the way– You pick the topic, interviewee
provides the content– In general, it is the interviewee’s
ideas you are interested in, not yours
• This rule is not always slavishly followed– Interviewee may stray off topic– You may have ideas you want
responded to

Bernard on Unstructured Interviews (6):
Probes
• Use probes to guide interview• Probe (Bernard definition):
stimulating an informant to give more information without injecting yourself so much into the interaction that you get only a reflection of yourself in the data– There are many types of probes– Our textbook definition: a neutral
request to clarify an ambiguous answer, to complete an incomplete answer, or to obtain a relevant response (p. 192 in Neuman 2007)
Bernard on Unstructured Interviews (6):
Types of Probes 1
• Silent probe – don’t say anything when the interviewee stops– Difficult to do appropriately– Culturally sensitive since
different cultures have different rules about silence
• Echo probe – repeat the last thing the interviewee said– Signals that you are interested in
what was said without saying why or suggesting what to say
Bernard on Unstructured Interviews (7):
Types of Probes 2
• Uh-huh (neutral) probe – make regular affirmative noises, as one often does in normal conversation to indicate you are still listening and are interested– Keeps the interviewee talking
Rule #2: In general, more talking by the respondent is better– Hence, longer responses are
better
Bernard on Unstructured Interviews (8):
Types of Probes 3
• The long question probe – instead of keeping a question short and to the point, asking a long roundabout question– You’re modeling the kind of long
answer you want to get back– The trick is not to guide the
answer as you ask the question
Bernard on Unstructured Interviews (9):
Types of Probes 4
• Probe by leading – ask a leading question as a way of focusing provoking the interviewee– Usually we try not to lead, but
sometimes respondents seem to be avoiding a topic or conclusion
– Can be used to ask about more specific incidents or about what happens when things don’t work out as expected
– Often based on earlier interviews
Bernard on Unstructured Interviews (10):
Types of Probes 5
• Phased assertion (baiting) probe – you take some information that may or may not be true and ask questions as if it were true– For example, “I guess Hilary and
Barak are friends again. I wonder why.”
– This is a favorite ploy of gossip-mongers

Bernard on Unstructured Interviews (11):
Verbal Respondents; Equipment
• Verbal respondents – don’t be afraid to interrupt a long winded respondent who is wandering away from your topic. Try to be graceful about it
• Equipment – always make sure that your tape recorder is ready before the interview (fresh tapes and batteries)
Bernard on Unstructured Interviews (12):
Uses of Unstructured Interviews
• A primary source of raw data• Preparation for semi-structured
interviews• To get info from people unlikely
to give more formal interviews• Developing rapport• Studying sensitive topics
– E.g., hot political topics, sexuality, racial prejudice
– Conflict: you can get wide range of information from multiple interviewees
Bivariate Relationships with
Integer-level Variables
Preliminaries to multiple regression
Steps in Analysis of Bivariate Relationships
Between Integer-level Variables
• Look at scatterplot– Dependent variable as the Y
(vertical) axis– Independent variable as the X
(horizontal) axis
• Make best-fit line– Since it is a line, we call it linear
regression– Since we have only one
independent variable, we call it simple linear regression
• Calculate slope (b)• Calculate goodness of fit (r)
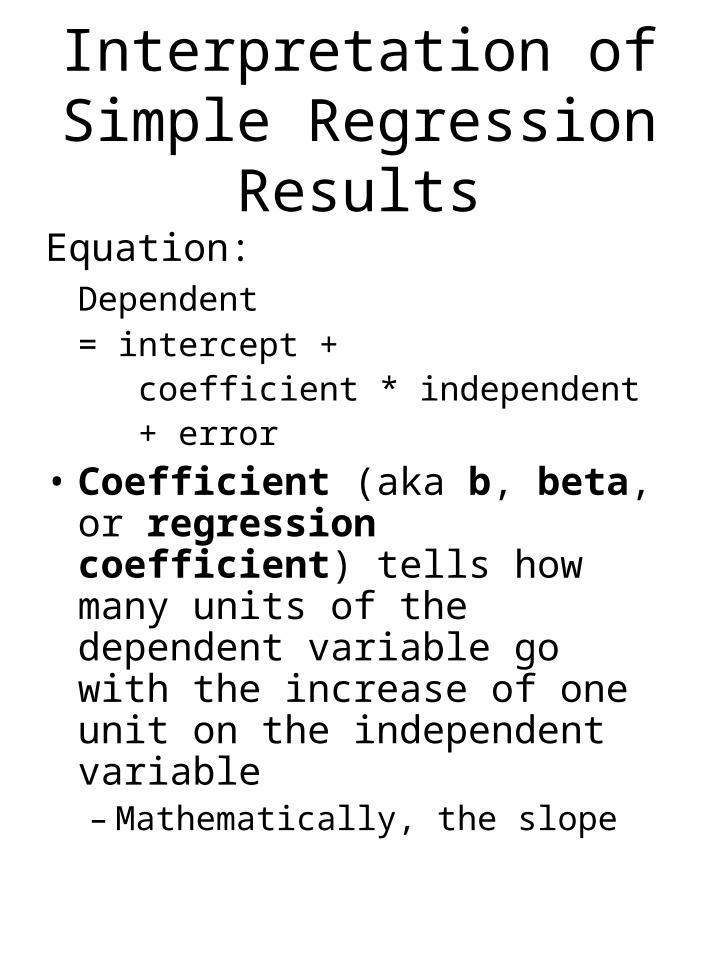
Interpretation of Simple Regression Results
Equation: Dependent
= intercept + coefficient * independent + error
• Coefficient (aka b, beta, or regression coefficient) tells how many units of the dependent variable go with the increase of one unit on the independent variable– Mathematically, the slope
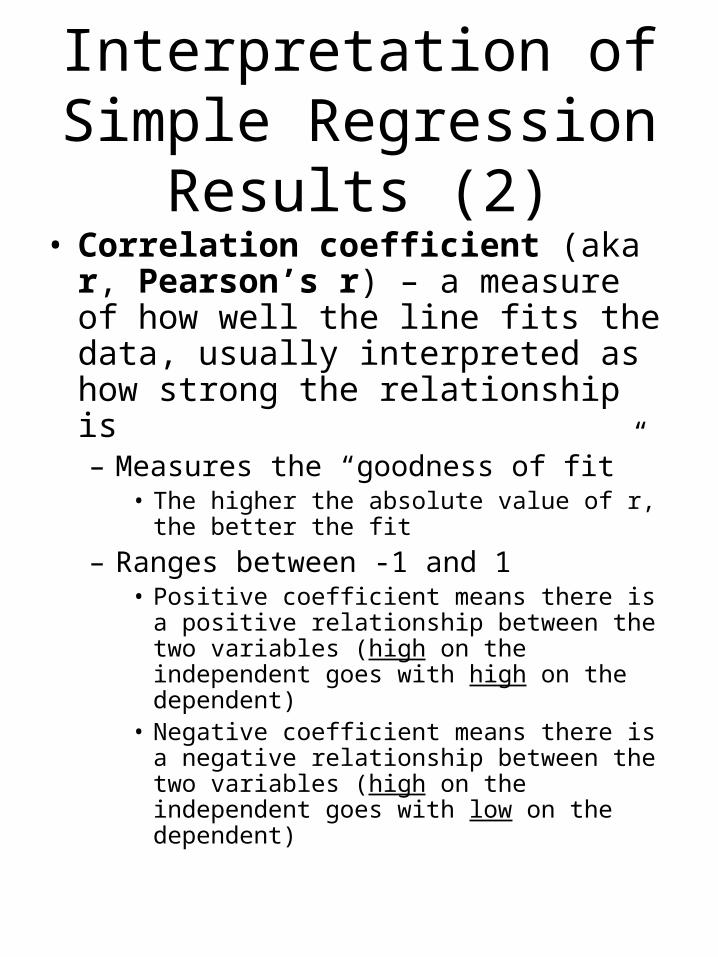
Interpretation of Simple Regression Results (2)
• Correlation coefficient (aka r, Pearson’s r) – a measure of how well the line fits the data, usually interpreted as how strong the relationship is– Measures the “goodness of fit”
• The higher the absolute value of r, the better the fit
– Ranges between -1 and 1• Positive coefficient means there is a
positive relationship between the two variables (high on the independent goes with high on the dependent)
• Negative coefficient means there is a negative relationship between the two variables (high on the independent goes with low on the dependent)
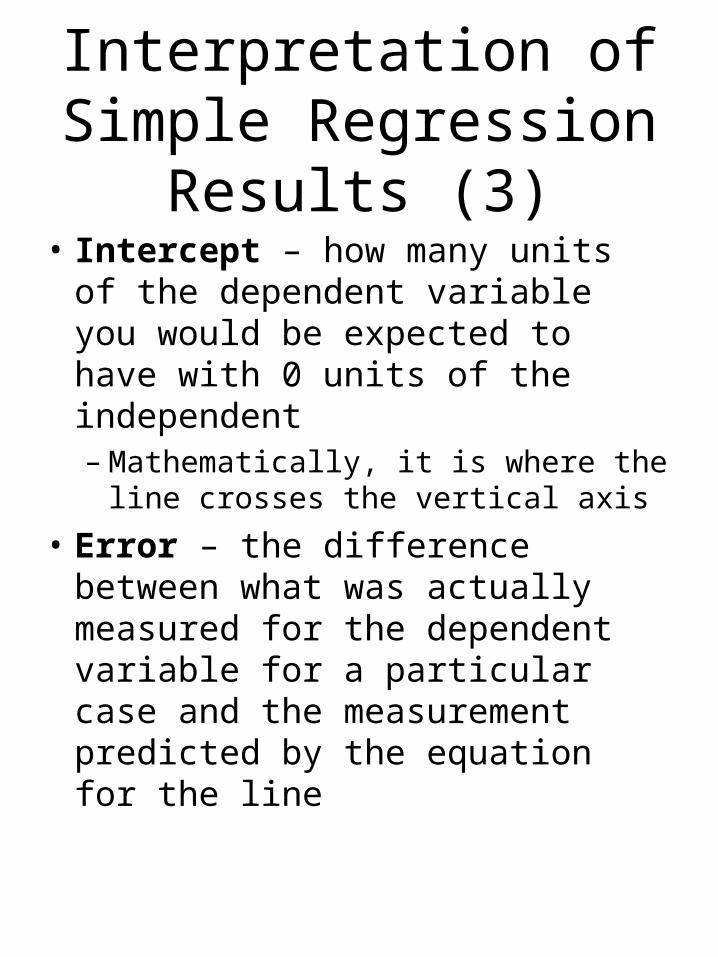
Interpretation of Simple Regression Results (3)
• Intercept – how many units of the dependent variable you would be expected to have with 0 units of the independent– Mathematically, it is where the
line crosses the vertical axis
• Error – the difference between what was actually measured for the dependent variable for a particular case and the measurement predicted by the equation for the line
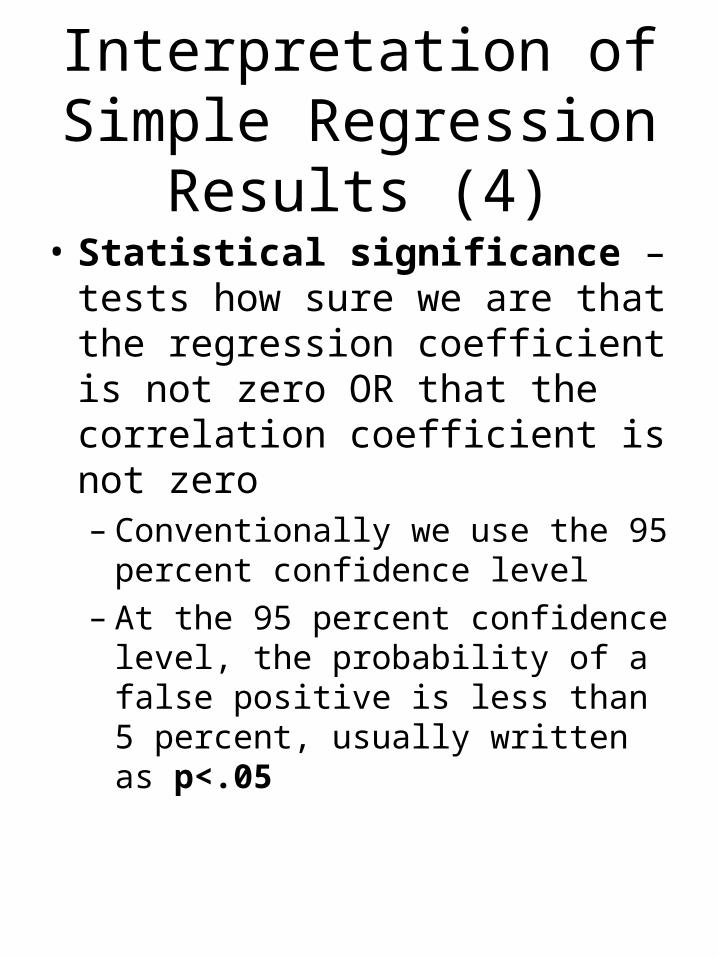
Interpretation of Simple Regression Results (4)
• Statistical significance – tests how sure we are that the regression coefficient is not zero OR that the correlation coefficient is not zero– Conventionally we use the 95
percent confidence level– At the 95 percent confidence
level, the probability of a false positive is less than 5 percent, usually written as p<.05
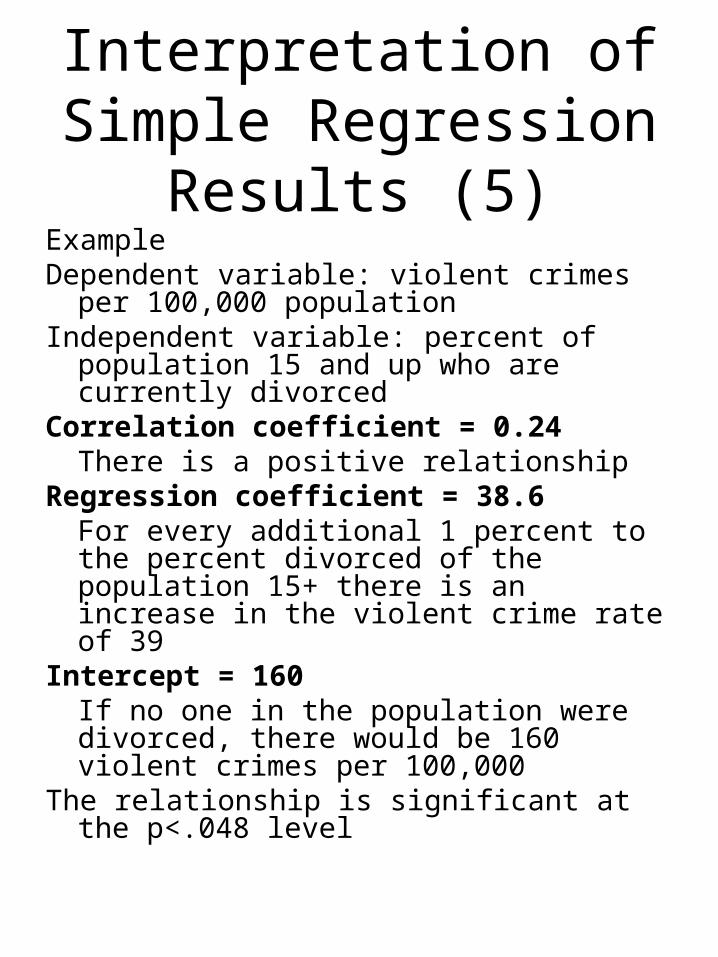
Interpretation of Simple Regression Results (5)
ExampleDependent variable: violent crimes per
100,000 populationIndependent variable: percent of population
15 and up who are currently divorcedCorrelation coefficient = 0.24
There is a positive relationshipRegression coefficient = 38.6
For every additional 1 percent to the percent divorced of the population 15+ there is an increase in the violent crime rate of 39
Intercept = 160If no one in the population were divorced, there would be 160 violent crimes per 100,000
The relationship is significant at the p<.048 level
Multiple Regression
• Multiple regression is multiple because it allows the use of more than one independent variable– This is nice since so much of
social life has multiple causes
• Multiple regression is probably the most important statistical tool in use in sociology today
• There are many similarities between simple regression and multiple regression
Multiple Regression (2):
Similarities with Simple Regression
• The key mathematical operation is fitting a line to the data points– The method is the same: choose the
line that minimizes the squared distances between the points and the line
• Called the method of least squares; the line is sometimes called the least squares line. Sometimes it is called the ordinary least squares (OLS) line
• There is a statistic for the overall fit of the line to the data points
• Each independent variable gets its own regression coefficient
Multiple Regression (3):
Differences from Simple Regression
• Scatterplots are in hyperspace– That is, for each variable, including the
dependent, there is another dimension in the graph
• They’re really hard to draw!
• The goodness of fit statistic doesn’t tell you the direction of the relationships– We use R (not r) as its symbol– Actually, we usually use R2
– R2 tells us the proportion of variation in the dependent variable that is accounted for by the independent variables
Multiple Regression (4):
Interpretation of Regression Coefficients
• New term: ceteris paribus – all other things being equal
• A regression coefficient tells us how much change in the dependent variable is associated with a change of one unit in the coefficient’s independent variable, ceteris paribus
Multiple Regression (5):
The Regression Equation
• Multiple regression is based on the matrix equation
Y = XB + e
where Y is the dependent variable, X is the matrix of dependent variables, B is a vector of regression coefficients (and the intercept), and e is the error
Multiple Regression (6):
Varieties of Multiple Regression
• Ordinary regression makes certain assumptions about the relations between the independent variables and about the errors– These assumptions are not always
met
• Ordinary regression is limited to only one dependent variable
• There are a large number of modifications to ordinary regression that overcome some of its limitations and to loosen the assumptions
Multiple Regression (7):
The General Linear Model
• The collection of modifications and extensions to ordinary regression is called the general linear model– The GLM is based on the equation
given earlier– It brings together a wide range of
statistical methods, some of which had been invented independently
• The GLM is a conceptual and methodological breakthrough paralleled in its importance for quantitative social science only by the discovery of sampling theory
Steps in the Research Process
• Neuman’s Seven Steps1. Select topic
2. Focus question
3. Design study
4. Collect data
5. Analyze data
6. Interpret data
7. Inform others
• Adapted from pp. 9-10 in Neuman (the textbook)

Steps in the Research Process:1. Select Topic

Steps in the Research Process:2. Focus the question
Steps in the Research Process:3. Design the study
1. Decide what you want to know
2. Decide how to measure concepts you’re working with
3. Decide what information you will need
4. Decide which method of data collection to use
- Using information from this class
5. Determine what kind of support you will need
Steps in the Research Process:3. Design the study:
Types of Support
• There are two kinds of support a researcher may need:– money– permissions
• Money (funding) is absolutely necessary for some research– If you are a consultant for hire, money
is why you are doing the research– Grant writing is its own art
• It can be its own profession• It is a fact of life for many social workers
since grant money is the lifeblood of many social service organizations
• Writing grant proposals is a common assignment in courses like SOCY3700

Steps in the Research Process:3. Design the study:
Permissions (1)
• If you are going to do research directly with live people, you will probably need to obtain some kind of permission
• Human subjects – research at a university working directly with people must usually be approved by the university’s institutional research board (IRB)– To ensure the research meets
ethical standards
Steps in the Research Process:3. Design the study:
Permissions (2)
• Informed consent – Contemporary ethical standards
require that research subjects be made aware of the nature of the research and be given the opportunity to choose not to participate
• Particularly if the research process may directly affect them and/or may pose some level of risk
• Children, the mentally ill, and others may not be able to give informed consent; it must be obtained from guardians
Steps in the Research Process:3. Design the study:
Permissions (3)
• Access – to observe the people or things you are interested in, you may have to go through intermediaries– Access to subjects: studying students
can require working with school districts; studying workers can require going through management
– Access to sites: making observations in “owned” natural settings like bars or even public parks can require making arrangements with owners or their staff

Steps in the Research Process:4. Collect data

Steps in the Research Process:5. Analyze the data

Steps in the Research Process:6. Interpret the data
Steps in the Research Process:7. Inform others: sponsored
research
• For sponsored research, present findings to client– Perhaps as a presentation– More often as a written report
• Reports generally include an executive summary – a brief summary of the findings
• The executive summary may be the only thing the client actually reads

Steps in the Research Process:7. Inform others: scholarly
research
• Scholarly research usually appears in one of three places:– scholarly journals– books– conference presentations
• Journals are the most important outlet– Having your work published in a
journal can be very difficult– Most important journals in
sociology reject more papers than they publish

Method of Hypothesis and Deduction
Deduction and Induction
• In deduction we use logical processes to develop hypotheses from existing theory
• In induction we develop hypotheses (and theory) on the basis of observations
False Positives and False Negatives
• False Positive: when something you say is true is actually false– Examples: an innocent man is found
guilty. The hurricane you predicted does not happen. Medicine that you think will help doesn’t.
• False Negative: when something you say is false is actually true– Examples: a guilty woman is found not
guilty. The hurricane that you said would not happen, happens. You decide that medicine that is actually helping you is not necessary.
False Positives and False Negatives (2)
• If we always knew the truth, then there would be no false negatives or false positives.
• When there is uncertainty, any time we say yes or no, we raise the possibility of a false positive or false negative. WHICH IS WORSE?
• The conventions of science say that false positives are the more important to avoid– That is, we’re more worried about
claiming something is true when it isn’t than about saying that something is false when it is actually true
Requirements for Establishing Causality
1) Time order: the cause must come before the effect
2) Correlation: the cause and effect must be correlated. That is, changes in the value of the cause must generally be accompanied by changes in the value of the effect
3) Non-spuriousness: there must not be some other factor that explains the correlation. If there is, then the original relationship is spurious
Operationalization
• Operationalization – the process of moving from the conceptual definition of a construct [theoretical idea] to a set of specific activities or measures that allow a researcher to observe it empirically (i.e., its operational definition) [Neuman 2nd, p. 370]
• Operational definition – the definition of a variable in terms of the specific activities to measure or indicate it with empirical evidence [Neuman 2nd, p. 370]
• Operationalization is a key link in the connection between theory and observation

Measurement Reliability
Measurement Validity
• Measurement validity is the extent to which a measure measures whatever it is intended to measure
• Three types of measurement validity– Face validity – does the
measure seem (“on its face”) like it measures what it’s supposed to (often tested by asking experts and others)
Measurement Validity, cont.
– Content validity - the extent to which the measure covers the full range of the concept
• The richer the concept (say, religiosity or feminism), the more likely that multiple indicators will be needed
– Criterion validity – the extent to which the measure is supported by other accepted measures
• Concurrent validity – how well the measure correlates with other measures of the concept
• Predictive validity – how well the measure correlates with other concepts its should be related to
Levels of Measurement
• Nominal – values identify categories only– Do not have arithmetic meaning– Also called categorical variables– When there are only two
categories, called dichotomies or binary variables
– Two technical requirements for categories:
• Exhaustive ( every observation fits into some category)
– Leads to lots of “Others”• Mutually exclusive (every
observation fits in exactly one category)
Levels of Measurement, cont.
• Ordinal – same characteristics as nominal PLUS the fact that categories can be ranked from lower to higher– Mathematical operation of subtraction
makes no sense, but > and < do– Most common: Likert
• Interval – same characteristics as ordinal PLUS the fact that the arithmetic difference between any two values makes sense– That is, the usual subtraction
operation makes the usual arithmetic sense
• Ratio – same characteristics as interval PLUS the fact that there is a sensible zero value– Thus division and ratios make sense

Abbreviations often used for “Other” categories
• NA – no answer or not answered
• DK – don’t know
• NAP – not applicable. Often this means the question was not even asked
• nec or n.e.c.– not elsewhere classified. Typically in the category title, “Other, nec”

Scales and Indexes (Indices)
Ecological and Reductionist Fallacies
• Unit of analysis – level (individual or some kind of aggregate) addressed by your theory or hypothesis
• Unit of observation – level (individual or some kind of aggregate) from which data are collected
• Ecological fallacy – drawing conclusions about individuals based on data from aggregates
• Reductionist fallacy – drawing conclusions about aggregates based on data from individuals
Writing About Crosstabulations From a Sample
• Lead with what is important– What’s important?
• The fate of your hypotheses (if you have stated some)
• The overall pattern for the dependent variable, especially if it is striking or surprising. Then look at deviations from the pattern in the categories of your independent variable
• Big differences between categories of your independent variable
• Things of interest to your audience
– Remember, the usual point of a crosstab is to display differences between categories of the independent variable
Writing About Crosstabulations From a Sample, cont.
• Do not use raw counts; use percents
• Use the correct percents– Do not confuse row, column, and total
percents• Be sure to specify the base for
percents– Usually something like, “… x percent
of [the base] …” or “Of all [bases] surveyed, x percent responded…”
• Round percents in your text (but not necessarily in your tables) to integers
• Be ready to convert percents to simple fractions– For example, 23 percent could be
called “nearly a quarter” or “about one in four”
Writing About Crosstabulations From a Sample, cont.
• Do not confuse percentage differences and percentage point differences– Percentage differences cannot
be calculated by simple subtraction
• Be ready to collapse categories– For example, to combine
“Strongly agree” and “Agree” responses into one category
• Be ready to calculate cumulative percents