![Electronic Supplementary Information Magnesium β ... · 1 Electronic Supplementary Information Magnesium β-Ketoiminates as CVD Precursors for MgO Formation Elaheh Pousaneh[a], Tobias](https://static.fdocument.org/doc/165x107/60651f68f5d4f347af3c4c60/electronic-supplementary-information-magnesium-1-electronic-supplementary.jpg)
Simulation of the second half of the 20th Century using the MGO AGCM P.V. Sporyshev, V.P. Meleshko,...
20
Simulation of the second Simulation of the second half of the 20th Century half of the 20th Century using the MGO AGCM using the MGO AGCM P.V. Sporyshev, V.P. Meleshko, P.V. Sporyshev, V.P. Meleshko, T.V. Pavlova T.V. Pavlova Voeikov Main Geophysical Voeikov Main Geophysical Observatory, St.Petersburg, Observatory, St.Petersburg, Russia Russia
-
Upload
marshall-mason -
Category
Documents
-
view
213 -
download
0
Transcript of Simulation of the second half of the 20th Century using the MGO AGCM P.V. Sporyshev, V.P. Meleshko,...
Simulation of the second Simulation of the second half of the 20th Century half of the 20th Century
using the MGO AGCMusing the MGO AGCM
P.V. Sporyshev, V.P. Meleshko, T.V. P.V. Sporyshev, V.P. Meleshko, T.V. PavlovaPavlova
Voeikov Main Geophysical Observatory, Voeikov Main Geophysical Observatory, St.Petersburg, RussiaSt.Petersburg, Russia
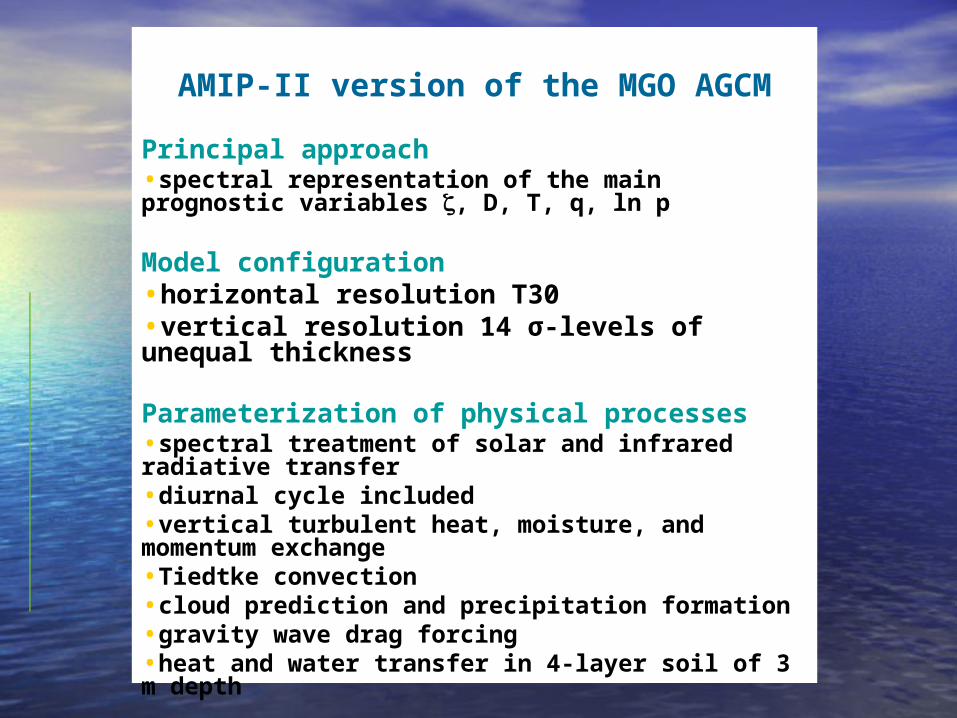
AMIP-II version of the MGO AGCM
Principal approach•spectral representation of the main prognostic variables , D, T, q, ln p
Model configuration•horizontal resolution T30 •vertical resolution 14 σ-levels of unequal thickness
Parameterization of physical processes•spectral treatment of solar and infrared radiative transfer•diurnal cycle included•vertical turbulent heat, moisture, and momentum exchange•Tiedtke convection•cloud prediction and precipitation formation •gravity wave drag forcing •heat and water transfer in 4-layer soil of 3 m depth
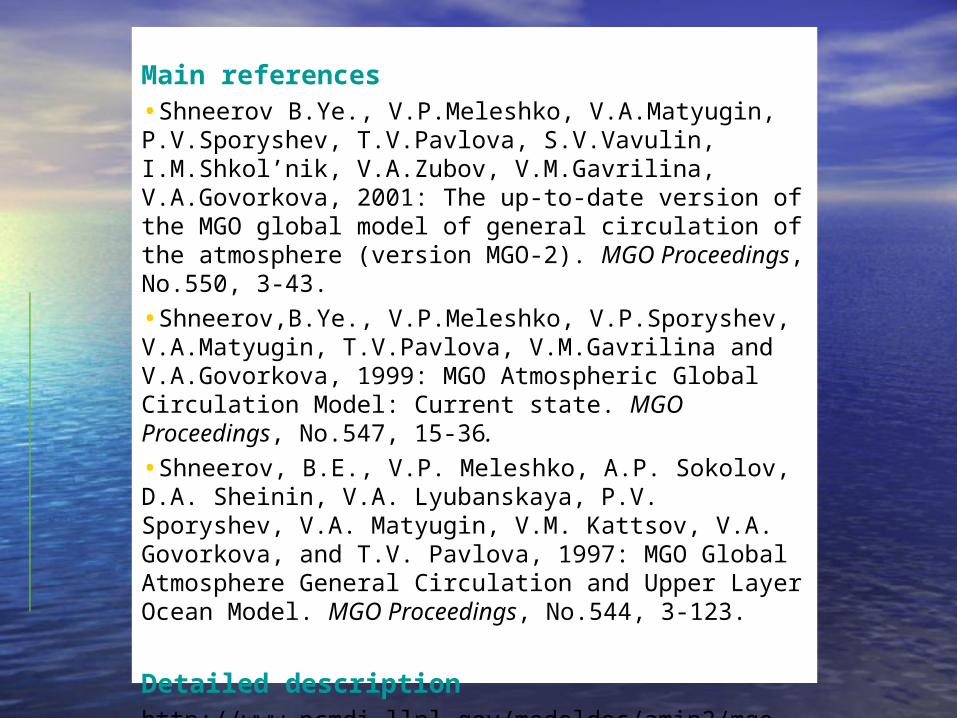
Main references•Shneerov B.Ye., V.P.Meleshko, V.A.Matyugin, P.V.Sporyshev, T.V.Pavlova, S.V.Vavulin, I.M.Shkol’nik, V.A.Zubov, V.M.Gavrilina, V.A.Govorkova, 2001: The up-to-date version of the MGO global model of general circulation of the atmosphere (version MGO-2). MGO Proceedings, No.550, 3-43.
•Shneerov,B.Ye., V.P.Meleshko, V.P.Sporyshev, V.A.Matyugin, T.V.Pavlova, V.M.Gavrilina and V.A.Govorkova, 1999: MGO Atmospheric Global Circulation Model: Current state. MGO Proceedings, No.547, 15-36.
•Shneerov, B.E., V.P. Meleshko, A.P. Sokolov, D.A. Sheinin, V.A. Lyubanskaya, P.V. Sporyshev, V.A. Matyugin, V.M. Kattsov, V.A. Govorkova, and T.V. Pavlova, 1997: MGO Global Atmosphere General Circulation and Upper Layer Ocean Model. MGO Proceedings, No.544, 3-123.
Detailed descriptionhttp://www-pcmdi.llnl.gov/modeldoc/amip2/mgo-01a/mgo-01a.html
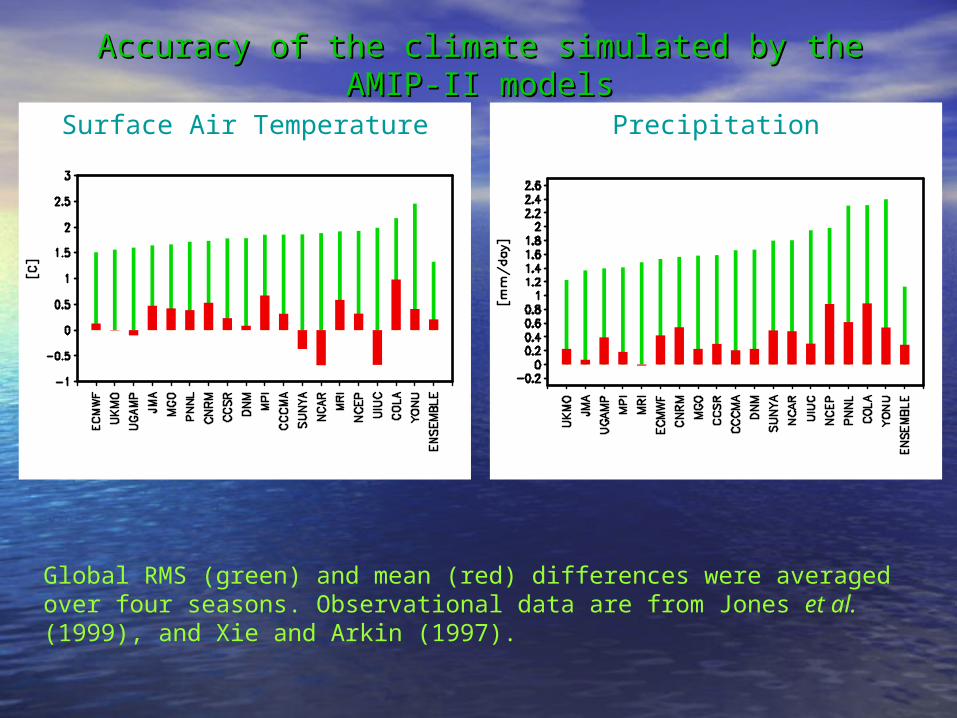
Accuracy of the climate simulated by the AMIP-II modelsAccuracy of the climate simulated by the AMIP-II models
Surface Air Temperature Precipitation
Global RMS (green) and mean (red) differences were averaged over four seasons. Observational data are from Jones et al. (1999), and Xie and Arkin (1997).
Accuracy of the climate simulated by the AMIP-II modelsAccuracy of the climate simulated by the AMIP-II models
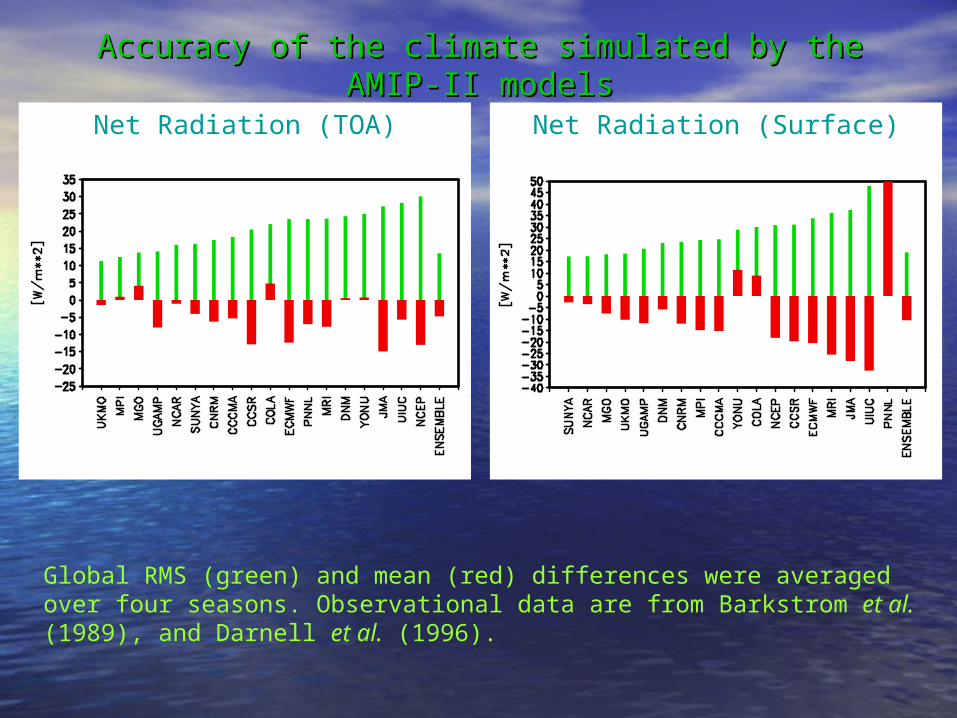
Net Radiation (TOA) Net Radiation (Surface)
Global RMS (green) and mean (red) differences were averaged over four seasons. Observational data are from Barkstrom et al. (1989), and Darnell et al. (1996).
Experiment design
•The MGO AGCM at T30L14 resolution was integrated for the period 1949 to 1999 •Eleven model simulations with different initial conditions were performed•The model was forced by the HadISST1.1dataset (Rayner et al., 2002)•For the Caspian and Aral seas, climatic sea temperature and ice cover were used•Observed change of greenhouse gazes (CO2 equivalent) was used. CO2 concentration was 300 ppmv at January 1949, and it linear increased by 3 ppmv per year •Radiative forcings from changes of ozone and volcanic aerosols were not included
Datasets used in the analysis
•NCEP Reanalysis (Kalnay et al., 1996)
•CRU surface Air Temperature and Precipitation (Jones et al.,1999; Hulme et al., 1998)
•Climatologically Aided Interpolation (CAI) of Terrestrial Air Temperature and Precipitation (Willmott and Robertson, 1995; Legates and Willmott, 1990)
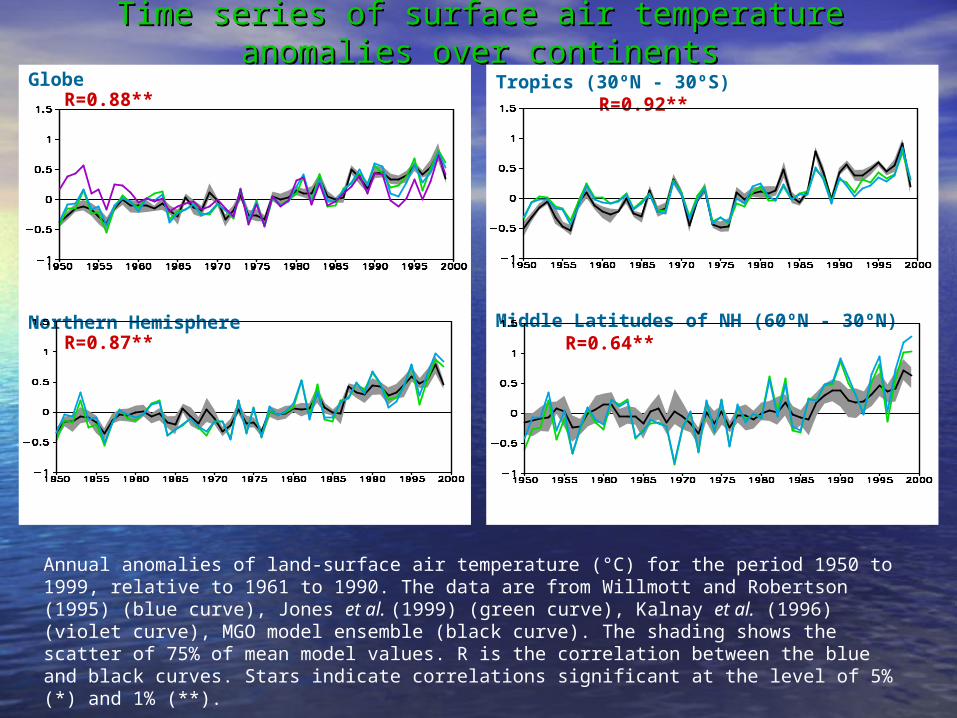
Time series of surface air temperature anomalies over continentsTime series of surface air temperature anomalies over continentsGlobe
R=0.88**
Northern Hemisphere R=0.87**
Tropics (30ºN - 30ºS) R=0.92**
Middle Latitudes of NH (60ºN - 30ºN) R=0.64**
Annual anomalies of land-surface air temperature (°C) for the period 1950 to 1999, relative to 1961 to 1990. The data are from Willmott and Robertson (1995) (blue curve), Jones et al. (1999) (green curve), Kalnay et al. (1996) (violet curve), MGO model ensemble (black curve). The shading shows the scatter of 75% of mean model values. R is the correlation between the blue and black curves. Stars indicate correlations significant at the level of 5% (*) and 1% (**).
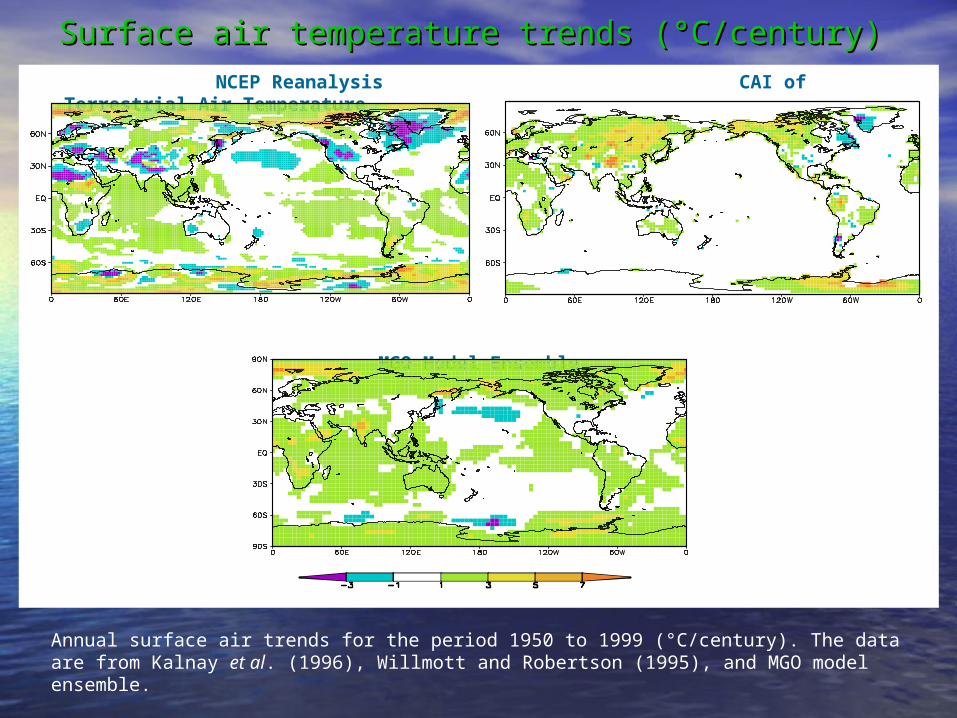
Surface air temperature trends (Surface air temperature trends (°C/century)°C/century)
NCEP Reanalysis CAI of Terrestrial Air Temperature
MGO Model Ensemble
Annual surface air trends for the period 1950 to 1999 (°C/century). The data are from Kalnay et al. (1996), Willmott and Robertson (1995), and MGO model ensemble.
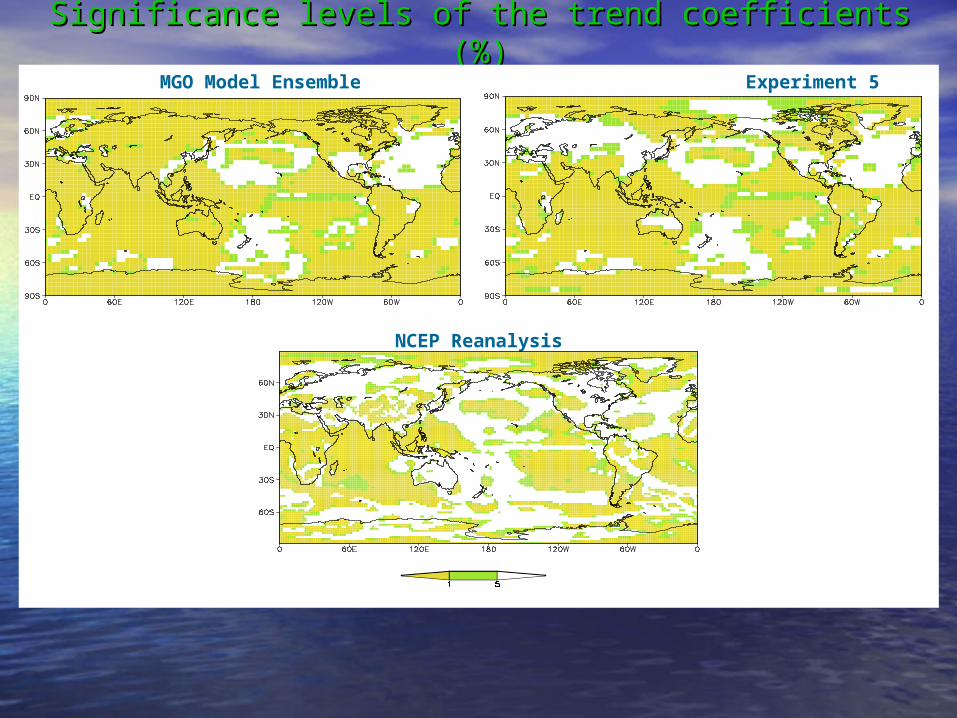
Significance levels of the trend coefficients (%)Significance levels of the trend coefficients (%)
MGO Model Ensemble Experiment 5
NCEP Reanalysis
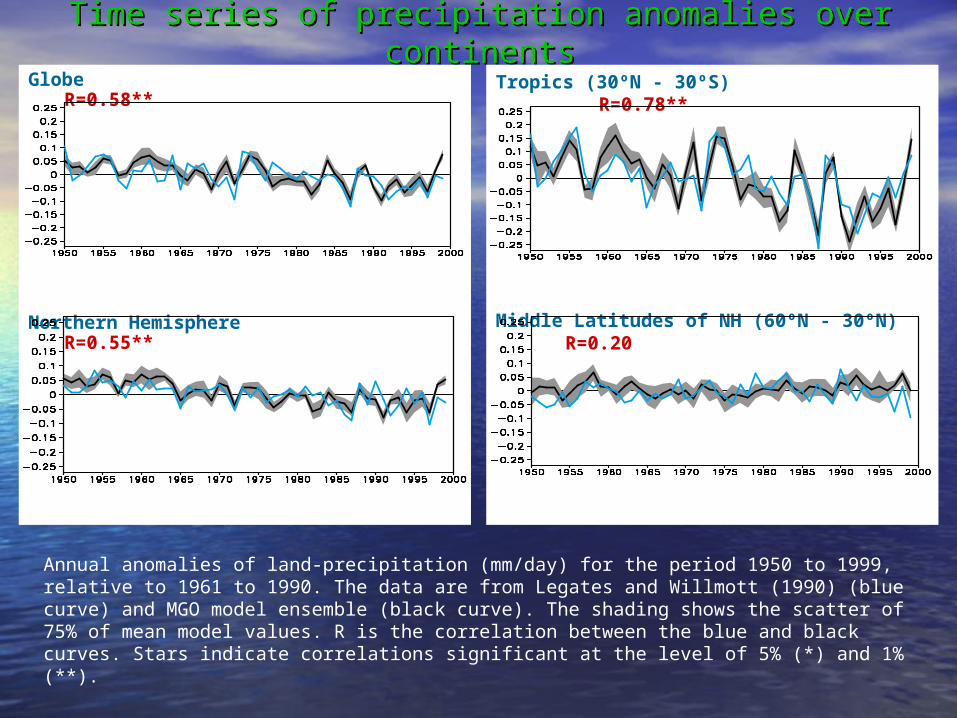
Time series of precipitation anomalies over continentsTime series of precipitation anomalies over continentsGlobe
R=0.58**
Northern Hemisphere R=0.55**
Tropics (30ºN - 30ºS) R=0.78**
Middle Latitudes of NH (60ºN - 30ºN) R=0.20
Annual anomalies of land-precipitation (mm/day) for the period 1950 to 1999, relative to 1961 to 1990. The data are from Legates and Willmott (1990) (blue curve) and MGO model ensemble (black curve). The shading shows the scatter of 75% of mean model values. R is the correlation between the blue and black curves. Stars indicate correlations significant at the level of 5% (*) and 1% (**).
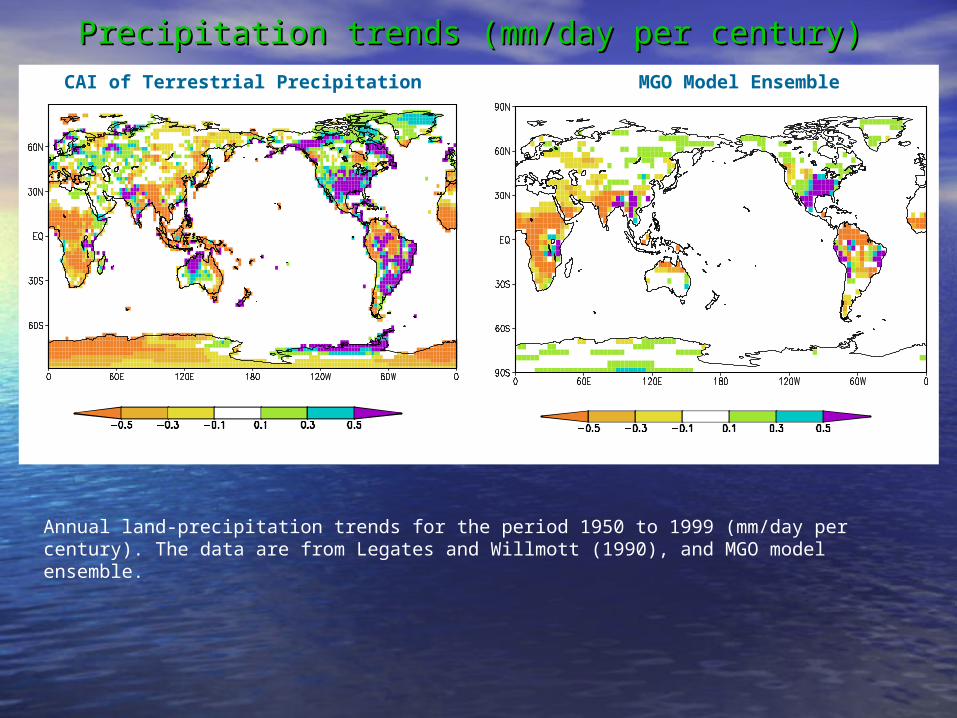
Precipitation trends (mm/day per centuryPrecipitation trends (mm/day per century))
CAI of Terrestrial Precipitation MGO Model Ensemble
Annual land-precipitation trends for the period 1950 to 1999 (mm/day per century). The data are from Legates and Willmott (1990), and MGO model ensemble.
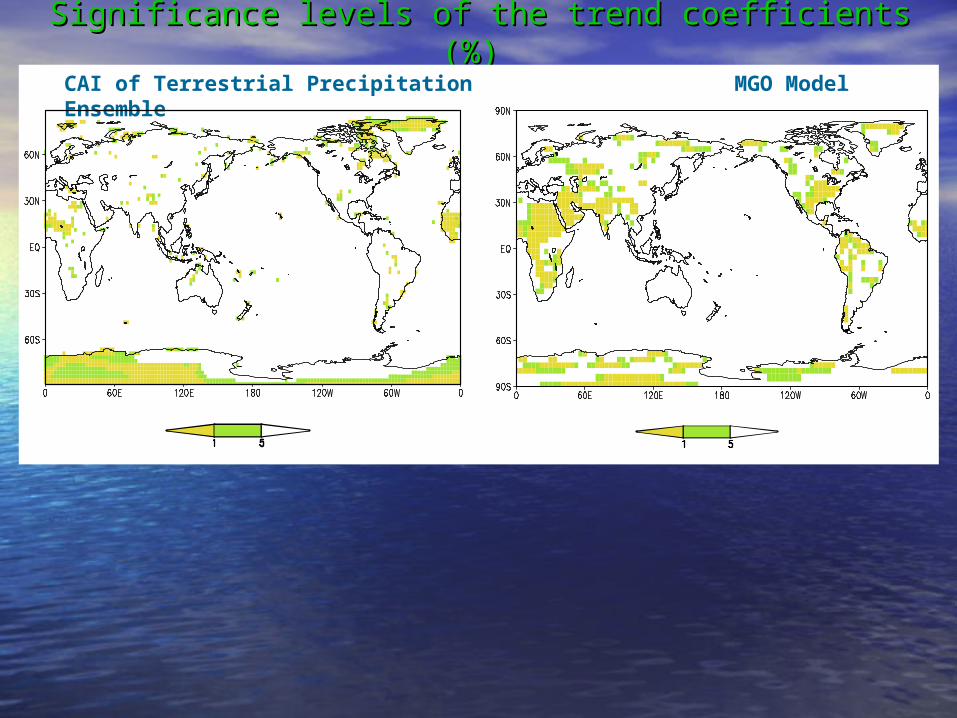
Significance levels of the trend coefficients (%Significance levels of the trend coefficients (%))
CAI of Terrestrial Precipitation MGO Model Ensemble
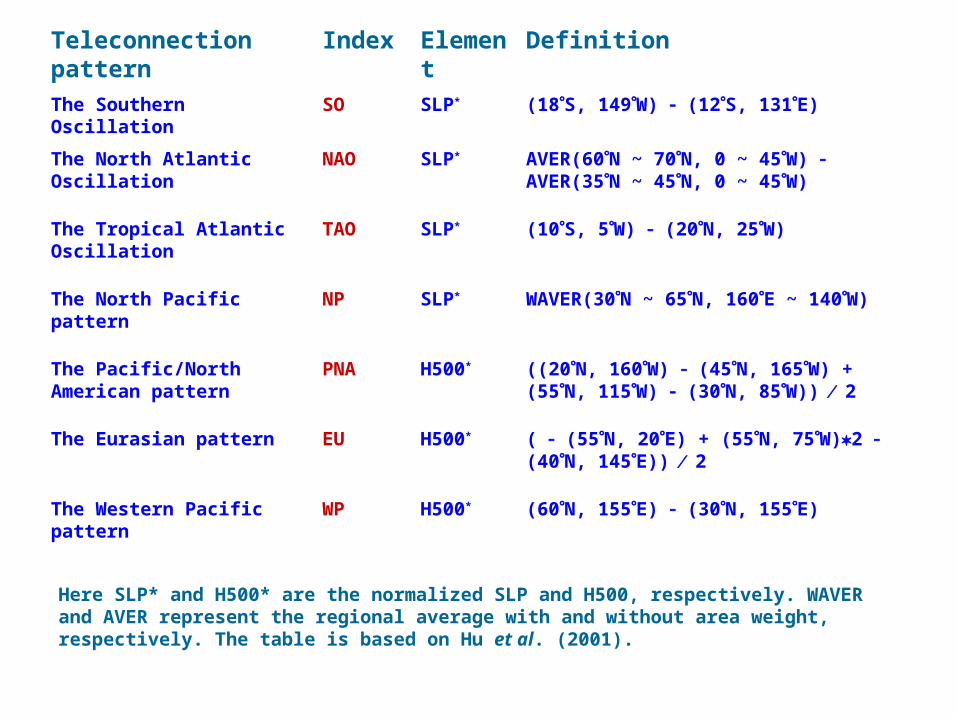
Teleconnection pattern Index Element Definition
The Southern Oscillation SO SLP* (18S, 149W) (12S, 131E)
The North Atlantic Oscillation NAO SLP* AVER(60N ~ 70N, 0 ~ 45W) AVER(35N ~ 45N, 0 ~ 45W)
The Tropical Atlantic Oscillation
TAO SLP* (10S, 5W) (20N, 25W)
The North Pacific pattern NP SLP* WAVER(30N ~ 65N, 160E ~ 140W)
The Pacific/North American pattern
PNA H500* ((20N, 160W) (45N, 165W) + (55N, 115W) (30N, 85W)) 2
The Eurasian pattern EU H500* ( (55N, 20E) + (55N, 75W)2 (40N, 145E)) 2
The Western Pacific pattern WP H500* (60N, 155E) (30N, 155E)
Here SLP* and H500* are the normalized SLP and H500, respectively. WAVER and AVER represent the regional average with and without area weight, respectively. The table is based on Hu et al. (2001).
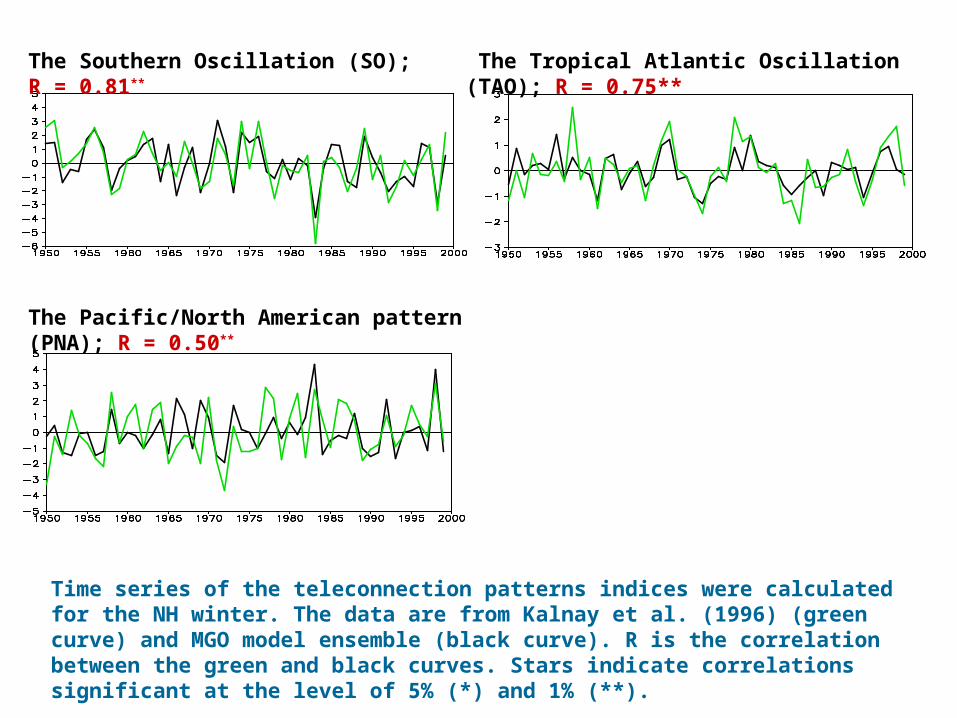
The Southern Oscillation (SO); R = 0.81** The Tropical Atlantic Oscillation (TAO); R = 0.75**
The Pacific/North American pattern (PNA); R = 0.50**
Time series of the teleconnection patterns indices were calculated for the NH winter. The data are from Kalnay et al. (1996) (green curve) and MGO model ensemble (black curve). R is the correlation between the green and black curves. Stars indicate correlations significant at the level of 5% (*) and 1% (**).
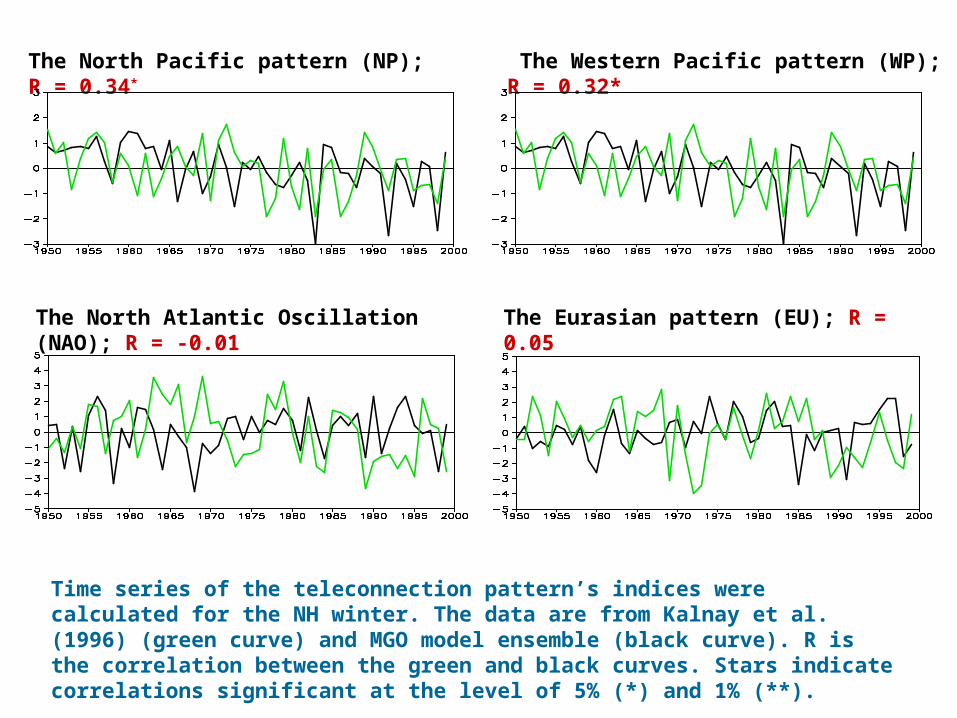
The North Pacific pattern (NP); R = 0.34* The Western Pacific pattern (WP); R = 0.32*
The North Atlantic Oscillation (NAO); R = -0.01 The Eurasian pattern (EU); R = 0.05
Time series of the teleconnection pattern’s indices were calculated for the NH winter. The data are from Kalnay et al. (1996) (green curve) and MGO model ensemble (black curve). R is the correlation between the green and black curves. Stars indicate correlations significant at the level of 5% (*) and 1% (**).
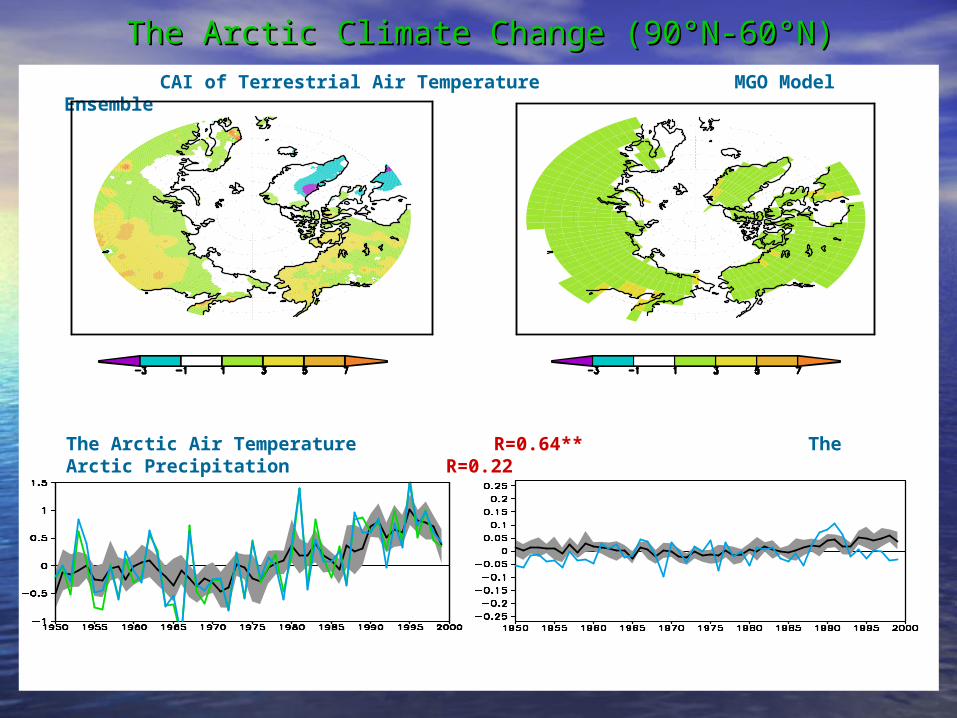
The Arctic Climate Change (90The Arctic Climate Change (90°N-60°N)°N-60°N)
CAI of Terrestrial Air Temperature MGO Model Ensemble
The Arctic Air Temperature R=0.64** The Arctic Precipitation R=0.22
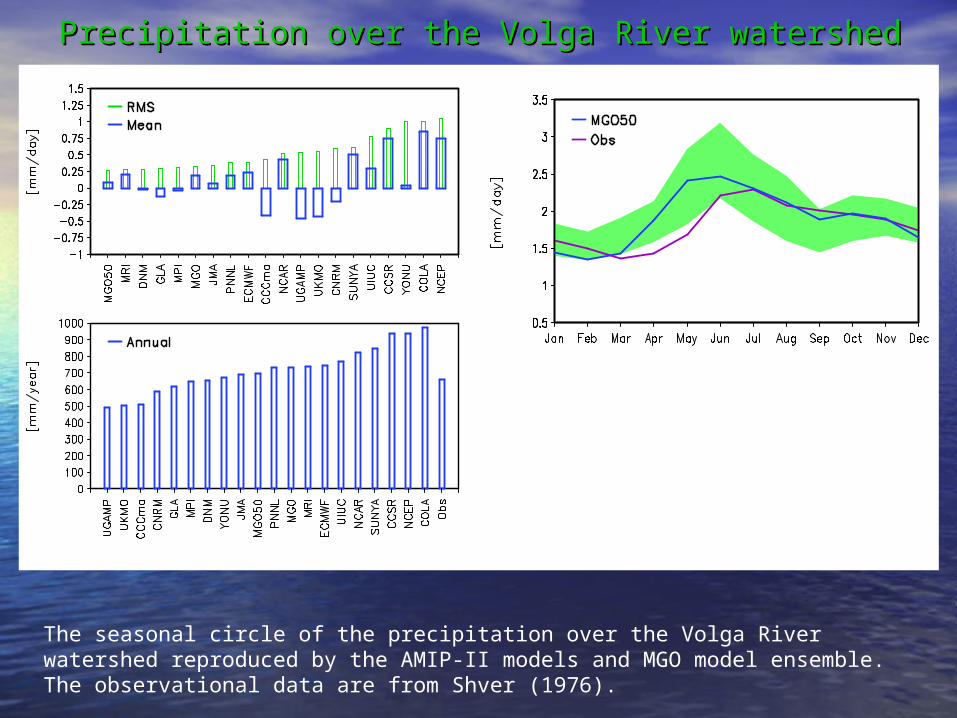
Precipitation over the Volga River watershedPrecipitation over the Volga River watershed
The seasonal circle of the precipitation over the Volga River watershed reproduced by the AMIP-II models and MGO model ensemble. The observational data are from Shver (1976).
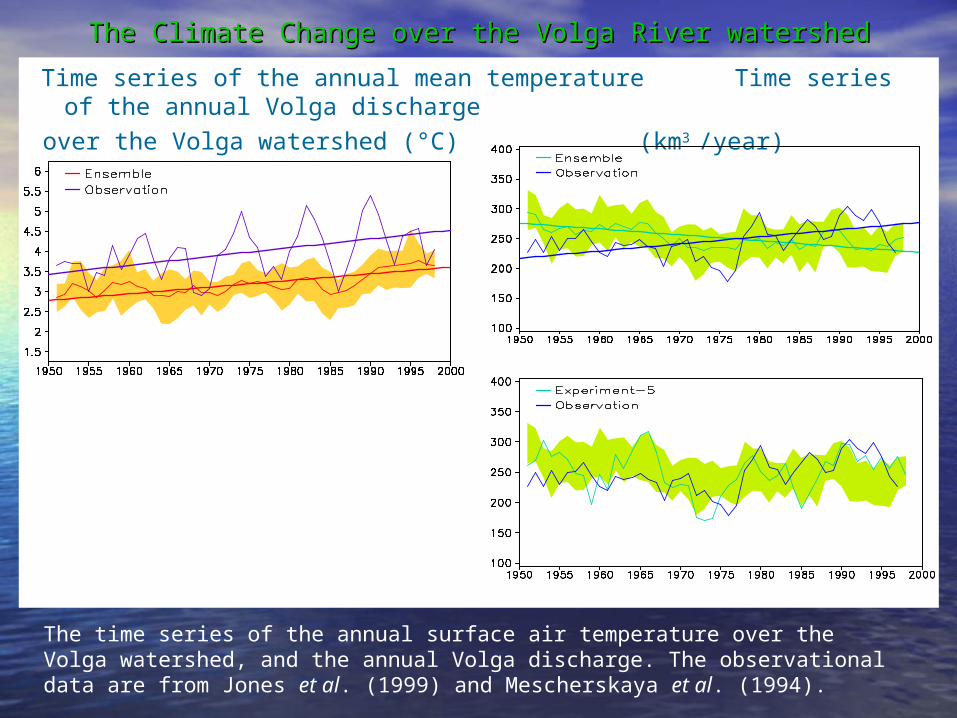
The Climate Change over the Volga River watershedThe Climate Change over the Volga River watershed
Time series of the annual mean temperature Time series of the annual Volga discharge
over the Volga watershed (°C) (km3 /year)
The time series of the annual surface air temperature over the Volga watershed, and the annual Volga discharge. The observational data are from Jones et al. (1999) and Mescherskaya et al. (1994).
Conclusions
•In this study, we analysed the MGO model climate and climate variability in relation to observations and reanalysis datasets. We focused on the model ability to reproduce the observed trends in surface air temperature and precipitation. •The model results are consistent with the observations. In particular, the model realistically reproduces the observed temperature rise over continents. The precipitation trends are statistically insignificant over most of the continents with exception for Central Africa and Northern Greenland. But the model trends resemble that observed in the Tropics. •An estimation of the model accuracy in simulation of the main Northern Hemisphere teleconnection patterns in the pressure fields was performed as well. The model realistically reproduces the dynamics of the oscillation systems in the Tropics, but it is not so good in the Middle Latitudes. •Particular attention was given to the regions of special interest (such as the High Latitudes and the Caspian Sea drainage basin). The model realistically reproduces the observed temperature increase in the regions. But it could not catch the observed regional precipitation variations.