Shear modulus of a saturated granular soil derived from...
13
33. Acta Geotechnica Slovenica, 2017/2 Abstract is paper presents the results of 120 determinations of the shear modulus (G) of a saturated granular soil (20–40 Ottawa sand) in different conditions of relative density (D r ), effective consolidation pressure (σ’ c ) and level of torsional excitation (T e ). e equipment used was a resonant-column apparatus manufactured by Wykeham Farrance and the tests were performed with relative density values of 20, 40, 60 and 80%, effective consolidation pres- sures of 50, 100, 150, 200, 250 and 300 kPa, and torsional excitations of 0.025, 0.05, 0.1, 0.2 and 0.4 volts (V), leading to shear strains (γ) between 0.002% and 0.023%. e results led to very simple empirical expressions for the shear modulus as a function of the angular strain for different effective consolidation pressures and void-ratio values. 1 INTRODUCTION e dynamic behaviour of granular soils has been intensively studied around the world for several decades now and the results obtained from various research programs are disseminated through the proceedings of international conferences and indexed journals related to geotechnical engineering. Since there is abundant information on the dynamic behaviour of granular soils and many of the topics dealt with are commonplace; this paper will only focus on references directly related to resonant-column tests, either from the point of view of the development of the test itself or from their utilization to obtain shear-wave velocities, shear-stiffness moduli and damping ratios. e resonant column was first used by Ishimato and Iida (1937) [1] and Iida (1938, 1940) [2, 3] to test Japanese soils, and then nearly two decades later by Bishop (1959) [4]. Since the 1960s, this technique has been widely used in many countries and has been subjected to countless modifications in the restraints applied to the speci- men ends. Some of the many works on this matter are described below. For the sake of clarity, the references have been grouped by the main objective of the research rather than following a chronological order. Appearing first are the most relevant analyses of the test apparatus itself and of how to use the resonant column. Wilson and Dietrich (1960) [5] used one of the most novel – at that time – resonant columns in the USA to test clay samples. Hall and Richard (1963) [6] designed and developed a “fixed–free” resonant-column apparatus, i.e., the specimen is fixed at the base and free at the upper end, therefore allowing the soil samples to be subjected to torsional and longitudinal vibrations. Drnevich et al. (1966, 1967) [7, 8] developed equipment for hollow SHEAR MODULUS OF A SATURATED GRANULAR SOIL DERIVED FROM RESONANT- COLUMN TESTS H. Patiño Universidad Politécnica de Madrid (UPM) Madrid, Spain E. Martínez Universidad Politécnica de Madrid (UPM) Madrid, Spain Jesús González Universidad Politécnica de Madrid (UPM) Madrid, Spain E-mail: [email protected] A. Soriano Universidad Politécnica de Madrid (UPM) Madrid, Spain Keywords resonant column; resonant frequency; shear modulus; relative density; effective consolidation pressure; dynamic shear modulus
Transcript of Shear modulus of a saturated granular soil derived from...
33.Acta Geotechnica Slovenica, 2017/2
Abstract
This paper presents the results of 120 determinations of the shear modulus (G) of a saturated granular soil (20–40 Ottawa sand) in different conditions of relative density (Dr), effective consolidation pressure (σ’c) and level of torsional excitation (Te). The equipment used was a resonant-column apparatus manufactured by Wykeham Farrance and the tests were performed with relative density values of 20, 40, 60 and 80%, effective consolidation pres-sures of 50, 100, 150, 200, 250 and 300 kPa, and torsional excitations of 0.025, 0.05, 0.1, 0.2 and 0.4 volts (V), leading to shear strains (γ) between 0.002% and 0.023%. The results led to very simple empirical expressions for the shear modulus as a function of the angular strain for different effective consolidation pressures and void-ratio values.
1 INTRODUCTION
The dynamic behaviour of granular soils has been intensively studied around the world for several decades now and the results obtained from various research programs are disseminated through the proceedings of international conferences and indexed journals related to geotechnical engineering. Since there is abundant information on the dynamic behaviour of granular soils and many of the topics dealt with are commonplace; this paper will only focus on references directly related to resonant-column tests, either from the point of view of the development of the test itself or from their utilization to obtain shear-wave velocities, shear-stiffness moduli and damping ratios.
The resonant column was first used by Ishimato and Iida (1937) [1] and Iida (1938, 1940) [2, 3] to test Japanese soils, and then nearly two decades later by Bishop (1959) [4]. Since the 1960s, this technique has been widely used in many countries and has been subjected to countless modifications in the restraints applied to the speci-men ends. Some of the many works on this matter are described below. For the sake of clarity, the references have been grouped by the main objective of the research rather than following a chronological order. Appearing first are the most relevant analyses of the test apparatus itself and of how to use the resonant column. Wilson and Dietrich (1960) [5] used one of the most novel – at that time – resonant columns in the USA to test clay samples. Hall and Richard (1963) [6] designed and developed a “fixed–free” resonant-column apparatus, i.e., the specimen is fixed at the base and free at the upper end, therefore allowing the soil samples to be subjected to torsional and longitudinal vibrations. Drnevich et al. (1966, 1967) [7, 8] developed equipment for hollow
SHEAR MODULUS OF A SATURATED GRANULAR SOIL DERIVED FROM RESONANT-COLUMN TESTS
H. Patiño Universidad Politécnica de Madrid (UPM) Madrid, Spain
E. Martínez Universidad Politécnica de Madrid (UPM) Madrid, Spain
Jesús González Universidad Politécnica de Madrid (UPM) Madrid, SpainE-mail: [email protected]
A. Soriano Universidad Politécnica de Madrid (UPM) Madrid, Spain
Keywords
resonant column; resonant frequency; shear modulus; relative density; effective consolidation pressure; dynamic shear modulus
34. Acta Geotechnica Slovenica, 2017/2
H. Patiño et al.: Shear modulus of a saturated granular soil derived from resonant-column tests
cylindrical soil specimens, to determine the shear modu-lus and the damping ratio under large deformations; the reason for using hollow specimens being related to the difficulty in obtaining a representative value of the angular strain in solid samples. In addition, they developed the theory in which the interpretation of the results obtained from the resonant column test is based. The operational principle of resonant-column equip-ment, the calibration recommendations, the processing of the data and the interpretation of the results were clearly described by Drnevich et al. (1978) [9]. Menq (2003) [10] developed a resonant-column apparatus that allows testing of specimens up to 15 cm in diameter that was used to study the dynamic properties of sand and gravel. Clayton et al. (2009) [11] used aluminium rods of various diameters to evaluate the polar moment of inertia of the excitation system (Io) and found that this value depended on the stiffness of the rod employed in calibrating their apparatus. However, calibrating the resonant column employed for our research led to a constant Io value. Clayton (2011) [12] refers to some in-situ and laboratory methods to estimate the stiffness and analysed in detail factors influencing the stiffness value obtained from very-small-strain tests, like the range of strains, anisotropy and velocity of loading.
Recently, some manufacturers of equipment for obtain-ing dynamic parameters have marketed relatively sophis-ticated models for resonant column tests that allow better control and better simulation during execution of the tests; among others Wykeham Farrance in the UK, which made the device used for this investigation. A detailed description of the equipment is presented later on.
In general, the resonant column test is the most commonly used laboratory technique to measure the dynamic properties of soils subjected to a low level of deformation. The various designs developed so far imply the application of axial or torsional harmonic loads to solid or hollow specimens by means of electro-magnetic systems capable of accurately controlling the frequency and amplitude of the different types of waves that can be generated. On the other hand, Al-Sanad and Aggour (1984) [13] applied random loads and Tawfig et al. (1988) [14], impulsive loads.
Resonant-column tests also make it possible to deter-mine the velocity of shear waves and to analyse their influence on other test parameters. Some researches on this point are presented below. Hardin and Richart (1963) [15] measured the shear-wave propagation veloc-ity in samples prepared with Ottawa sand, with crushed quartz sand and with crushed quartz silts, subjected to small strains, and they proposed empirical correlations to calculate the shear modulus as a function of the void
ratio and the effective consolidation pressure. Hardin (1965) [16], based on the theory of linear vibrations of a cylindrical rod, presents an expression to calculate the shear wave propagation velocity (Vs) as a function of the resonant frequency, the polar moment of inertia, the height of the specimen and the polar moment of inertia of the system. Richart et al. (1970) [17] proved mathematically that proportionality exists between the resonant frequency of the specimen and the correspond-ing shear-wave propagation velocity. Santamarina and Cascante (1996) [18] used a resonant column apparatus capable of applying both compressive and tensile devia-toric stresses to measure the velocity of shear and damp-ing waves under small strains. These velocities turned out to depend mainly on the isotropic stress, while the deviatoric stress played a lesser role.
Probably, the factor most often analysed with this equip-ment has been the shear modulus, obtained in cyclic shear tests.
Kuribayashi et al. (1975) [19] found that the shear modulus of several materials is not a function of the relative density, but rather of the void ratio. Iwasaki et al. (1978) [20] present the average variation trend of the shear modulus in eight different types of sand as a function of the angular strain. In addition, they found that in the case of Toyura sand, within a wide range of deformations, a linear relationship exists between the shear modulus and the effective consolidation pressure. Tatsuoka et al. (1979) [21] determined that the shear modulus, within a wide range of deformations, is not affected by the initial structure of the tested specimens. Alarcón-Guzmán et al. (1989) [22] investigated the effect of the principal stress ratio on the shear modulus, concluding that this factor has a less important effect on the determination of the maximum shear modulus, but drastically affects the secant shear modulus. Saxena et al. (1989) [23] extensively reviewed empirical relations for obtaining Gmax and the damping (D) under small strain and conducted resonant-column tests on Monterey No. 0 Sand and showed that published relations overestimated Gmax and underestimated D for this sand. Lo Presti et al. (1997) [24] evaluated the influence of the strain rate in the determination of the shear modulus of granular soils, and found that this factor has a very small effect on the maximum shear modulus. Díaz-Rodríguez and López-Flores (1999) [25] proposed an empirical function (a potential expression) between the shear modulus and the isotropic consolidation stresses (σ c̀). Wichtmann and Triantafyllidis (2004) [26] analysed the influence of the history of dynamic loading on the properties of dry sands; the results thus obtained indicated that a dynamic pre-stressing moderately affects the shear modulus under small deformations. Gu et al. (2013) [27] used bender
35.Acta Geotechnica Slovenica, 2017/2
H. Patiño et al.: Shear modulus of a saturated granular soil derived from resonant-column tests
elements to test three different sands subjected to small strains and found that both Go (shear modulus) and M0 (constraint modulus) increase with the density and the confining pressure. They found Go to be more sensitive to E0 (Young’s modulus) and proposed empirical rela-tions between the Poisson ratio and Go and M0.
Finally, some works are presented that analyse how the soil identification properties (grading, particle shape, etc.) influence results.
Chang and Ko (1982) [28] tested 23 samples of Denver sand and found that the maximum shear modulus is – to a large extent – a function of the coefficient of unifor-mity, whereas the effect of the mean size of the particles is minimal. Koono et al. (1993) [29] executed what can be regarded as a field resonant-column test in a gravel deposit. Wichtmann and Triantafyllidis (2009, 2013 and 2014) [30, 31, 32] evaluated the influence of the coef-ficient of uniformity and of the grain size distribution for 27 types of clean sand in the determination of the maximum shear modulus: the results obtained indicate that for equal values of the void ratio and of the effective consolidation pressure, the maximum shear modulus decreases as the coefficient of uniformity increases, whereas it does not change with the mean particle size. Martínez (2012) [33] studied the influence of the soil index properties on the determination of the dynamic parameters of a saturated granular soil. Senetakis et al. (2012) [34] tested sands with different grading curves, particle origin and shape under very small strains. Volcanic sands showed significantly lower Go values than those of quartz sands, whereas their D0 were only slightly lower compared to quartz sands.
Yang and Gu (2013) [35] found that, in the range of small strains, the shear modulus varies very little in terms of particle size.
Senetakis and Madhusudhan (2015) [36] tested quartz sands and angular-grained gravels and they proposed potential functions to relate Go with p’. The exponent nG was shown to be dependent on the specimen preparation procedure. Finally, Payan et al. (2016) [37, 38] observed that the published formulae cannot accurately relate the shear modulus under small strain with the void ratio and confining pressure, probably because the particle shape was not taken into account. Based on critical-state theories, they propose a new expression, including the effect of grading curves and particle shapes.
Taking into account the background information presented above, the objective of this investigation is an in-depth study of the influence of the relative density, effective consolidation pressure and torsional excitation
values on the shear modulus of a saturated granular sand and to develop simple empirical functions to correlate these parameters.
2 MATERIAL USED
The tests were performed on 20–40 Ottawa sand (maxi-mum, minimum and average particle sizes are 0.85, 0.43 and 0.64 mm, respectively). It is a standard material employed in many other investigations into the behav-iour of granular soil. Its main characteristics are: very hard, uniform particles (the coefficient of uniformity turned out to be Cu = 1.35), fine and rounded grains and nearly pure quartz in composition.
The index properties of particles passing mesh 20 and retained in mesh 40 are as follows: specific gravity Gs = 2.669, maximum void ratio emax= 0.754, and mini-mum void ratio emin = 0.554. The initial properties of the specimens tested are presented in Table 1.
2.2 Description of the equipment used
The resonant-column apparatus consists of a forced oscillation system with a single torsional degree of free-dom that makes the specimen vibrate within a range of frequencies in which its first natural mode can be found. In this particular investigation, the specimen remained fixed at its base and was free to vibrate at its upper end.
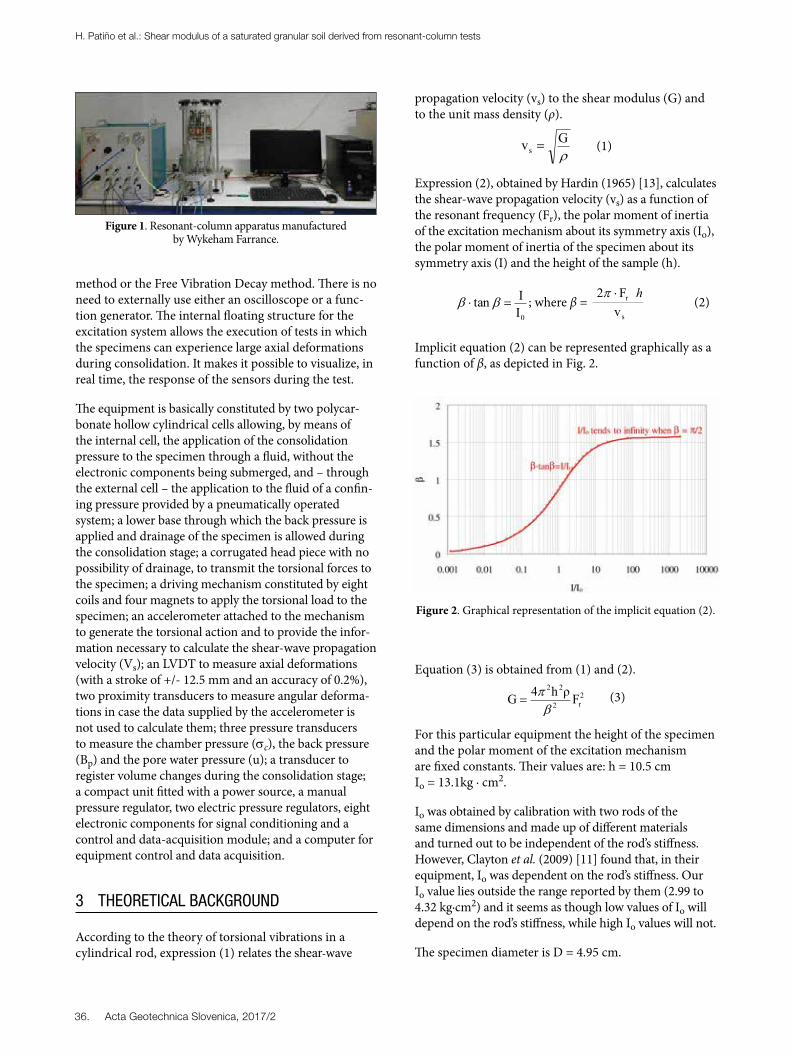
Testing was performed with the resonant-column device manufactured by Wykeham Farrance, Fig. 1. The frequency of the resonant-column tests is higher than 10 Hz, while in cyclic torsional shear mode the equipment typically operates at frequencies below 2 Hz. In this research, the frequency range was between 74 Hz and 140 Hz.
This instrumented and automated equipment provides a series of advantages, among which mention can be made of the following. It combines resonant-column and simple torsional shear functions. It determines automati-cally the resonant frequency, the shear-wave velocity, the shear modulus, the angular strain and the damping ratio, this latter parameter by using the Half-Power
Relative density, Dr, %
Height, H,
mm
Diameter, D,
mm
Mass, g
Dry density ρd,
g/cm3
Void ratio, e
20 105 49.5 314.59 1.557 0.714
40 105 49.5 322.13 1.594 0.674
60 105 49.5 330.05 1.633 0.63480 105 49.5 338.36 1.675 0.594
Table 1. Properties of specimens tested.
36. Acta Geotechnica Slovenica, 2017/2
H. Patiño et al.: Shear modulus of a saturated granular soil derived from resonant-column tests
Figure 1. Resonant-column apparatus manufactured
by Wykeham Farrance.
method or the Free Vibration Decay method. There is no need to externally use either an oscilloscope or a func-tion generator. The internal floating structure for the excitation system allows the execution of tests in which the specimens can experience large axial deformations during consolidation. It makes it possible to visualize, in real time, the response of the sensors during the test.
The equipment is basically constituted by two polycar-bonate hollow cylindrical cells allowing, by means of the internal cell, the application of the consolidation pressure to the specimen through a fluid, without the electronic components being submerged, and – through the external cell – the application to the fluid of a confin-ing pressure provided by a pneumatically operated system; a lower base through which the back pressure is applied and drainage of the specimen is allowed during the consolidation stage; a corrugated head piece with no possibility of drainage, to transmit the torsional forces to the specimen; a driving mechanism constituted by eight coils and four magnets to apply the torsional load to the specimen; an accelerometer attached to the mechanism to generate the torsional action and to provide the infor-mation necessary to calculate the shear-wave propagation velocity (Vs); an LVDT to measure axial deformations (with a stroke of +/- 12.5 mm and an accuracy of 0.2%), two proximity transducers to measure angular deforma-tions in case the data supplied by the accelerometer is not used to calculate them; three pressure transducers to measure the chamber pressure (σc), the back pressure (Bp) and the pore water pressure (u); a transducer to register volume changes during the consolidation stage; a compact unit fitted with a power source, a manual pressure regulator, two electric pressure regulators, eight electronic components for signal conditioning and a control and data-acquisition module; and a computer for equipment control and data acquisition.
3 THEORETICAL BACKGROUND
According to the theory of torsional vibrations in a cylindrical rod, expression (1) relates the shear-wave
propagation velocity (vs) to the shear modulus (G) and to the unit mass density (ρ).
Gvs = (1)
Expression (2), obtained by Hardin (1965) [13], calculates the shear-wave propagation velocity (vs) as a function of the resonant frequency (Fr), the polar moment of inertia of the excitation mechanism about its symmetry axis (Io), the polar moment of inertia of the specimen about its symmetry axis (I) and the height of the sample (h).
0IItan = ; where β =
s
r
vF2 h
(2)
Implicit equation (2) can be represented graphically as a function of β, as depicted in Fig. 2.
Figure 2. Graphical representation of the implicit equation (2).
Equation (3) is obtained from (1) and (2).
2r2
22
Fh4G = (3)
For this particular equipment the height of the specimen and the polar moment of the excitation mechanism are fixed constants. Their values are: h = 10.5 cm Io = 13.1kg · cm2.
Io was obtained by calibration with two rods of the same dimensions and made up of different materials and turned out to be independent of the rod’s stiffness. However, Clayton et al. (2009) [11] found that, in their equipment, Io was dependent on the rod’s stiffness. Our Io value lies outside the range reported by them (2.99 to 4.32 kg∙cm2) and it seems as though low values of Io will depend on the rod’s stiffness, while high Io values will not.
The specimen diameter is D = 4.95 cm.
37.Acta Geotechnica Slovenica, 2017/2
H. Patiño et al.: Shear modulus of a saturated granular soil derived from resonant-column tests
The densities of the samples used for this experiment range from
ρsat(min)=1.974 gr/cm3 to ρsat(max)=2.048 gr/cm3 or ρsat = 2.011 ± 0.037 gr/cm3
For the central value, ρsat = 2 gr/cm3, the value of the polar moment of inertia of the specimen is:
I = 321 D4 h = 1.24 kg cm2 (4)
The corresponding value of β; obtained from equation (2)
tg = 13.11.24 = 0.0946 is = 0.303 rd ( = 17.4º)
The shear-wave velocity can be obtained from the reso-nant frequency, Fr, measured during the test
vs = hF2 r = 2.18 Fr sm (Fr en Hz) (5)
and the corresponding value of the shear modulus G = vs
2 · ρ = 9.51 Fr
2 kN/m2 (Fr en Hz).
3.1 Experimental program
This investigation was aimed at determining the effect of the relative density, the effective consolidation pressure and the magnitude of the torsional excitation on the shear modulus.
A total of 120 determinations of the resonant frequency for saturated specimens were made in specimens measuring 49.5 millimetres in diameter and 105 milli-metres in height. They all had a height-to-diameter ratio equal to 2.12, thus eliminating the uncertainty related to the slenderness of the specimens; the ratio specimen diameter to particle diameter was of about 120, therefore eliminating the scale effect.
The total number of tests is a result of the combination of relative densities equal to 20, 40, 60 and 80%, effective consolidation pressures equal to 50, 100, 150, 200, 250 and 300 kPa and amplitudes of sinusoidal waves equal to 0.025, 0.05, 0.1, 0.2 and 0.4 volts. The frequency varied between 74 Hz and 140 Hz, which corresponds to angular deformations between 0.002% and 0.023%. The backpressure was equal to 400 kPa for all the tests.
3.2 Preparation and setting of specimens
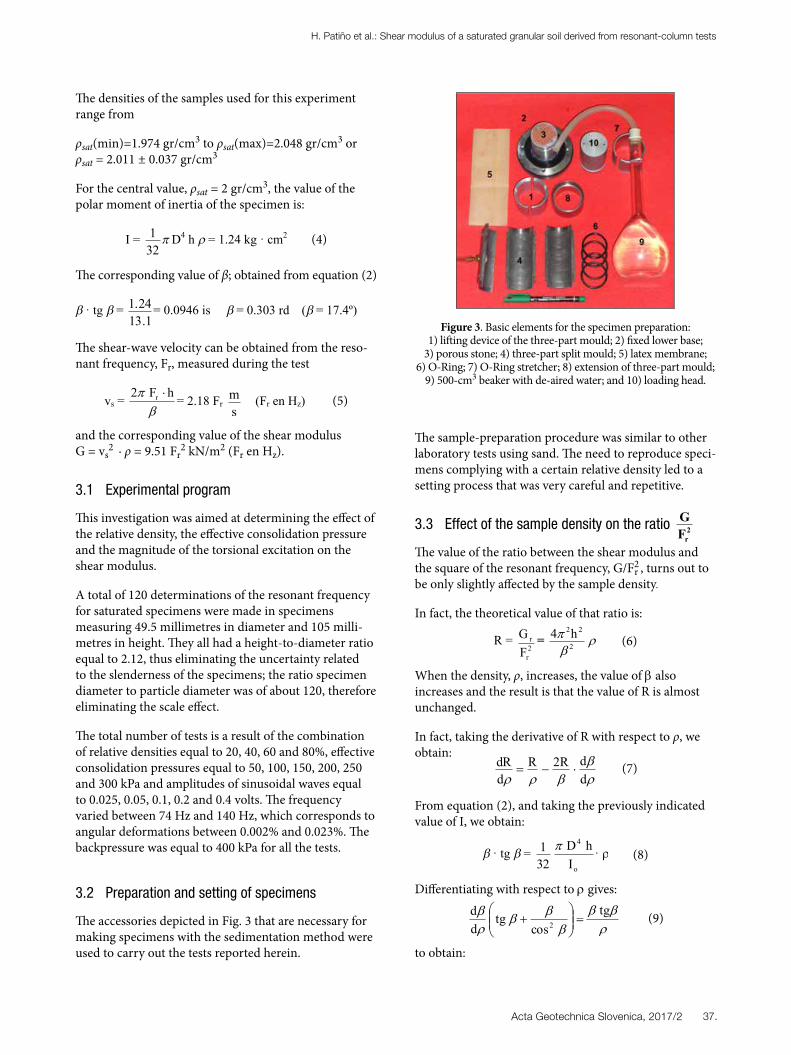
The accessories depicted in Fig. 3 that are necessary for making specimens with the sedimentation method were used to carry out the tests reported herein.
Figure 3. Basic elements for the specimen preparation: 1) lifting device of the three-part mould; 2) fixed lower base;
3) porous stone; 4) three-part split mould; 5) latex membrane; 6) O-Ring; 7) O-Ring stretcher; 8) extension of three-part mould;
9) 500-cm3 beaker with de-aired water; and 10) loading head.
The sample-preparation procedure was similar to other laboratory tests using sand. The need to reproduce speci-mens complying with a certain relative density led to a setting process that was very careful and repetitive.
3.3 Effect of the sample density on the ratio
The value of the ratio between the shear modulus and the square of the resonant frequency, G/F2
r , turns out to be only slightly affected by the sample density.
In fact, the theoretical value of that ratio is:
R = 2r
r
FG = 2
22h4 (6)
When the density, ρ, increases, the value of β also increases and the result is that the value of R is almost unchanged.
In fact, taking the derivative of R with respect to ρ, we obtain:
ddR2R
ddR = (7)
From equation (2), and taking the previously indicated value of I, we obtain:
tg = o
4
IhD
321 (8)
Differentiating with respect to ρ gives:tg
costg
dd
2 =+ (9)
to obtain:
2rF
G
38. Acta Geotechnica Slovenica, 2017/2
H. Patiño et al.: Shear modulus of a saturated granular soil derived from resonant-column tests
+=
11
dd ; being =
2sen2
(10)
and, with the help of equation (7)
+=
11d
RdR (11)
With α > 1, any increase in the density always produces an increase in the value of R.
For the particular case of ρsat = 2 gr/cm3 equations (10) and (11) are: =
2sen2 = 1.064 and
RdR = 0.032 d .
The amplitude of the range of densities for this experimental program is =
2037.0 = 0.019 and, as a
consequence, the relative variation of R is: RR 0.00061.
Thus, the rationale for normalizing G with respect to Fr2
is that, for practical purposes and for the density range of the samples tested in this investigation, the ratio G/Fr
2 can be considered to be a constant that depends on the equipment characteristics, but it does not depend on the density of the sample being tested.
4 RESULTS
The results of the 120 determinations of the resonant frequency, the angular strains measured and the values of the shear modulus G thus obtained are presented in tables 2 and 3.
Table 2. Results corresponding to relative densities equal to 20 and 40%.
σ'c TeDr = 20% Dr = 40%
Fr G γ Fr G γkPa V Hz MPa % Hz MPa %50 0.025 85.5 69.2 0.004 86.6 72.2 0.00550 0.05 84.4 67.5 0.006 85.7 70.6 0.00750 0.1 82.6 64.6 0.009 84.1 68.1 0.01150 0.2 80.1 60.8 0.014 82.0 64.7 0.01750 0.4 74.7 52.8 0.019 77.2 57.4 0.023
100 0.025 105.0 104.0 0.002 107.0 110.0 0.005100 0.05 104.0 102.0 0.004 106.0 107.0 0.007100 0.1 102.0 98.1 0.008 106.0 107.0 0.011100 0.2 99.7 94.1 0.014 103.0 101.0 0.016100 0.4 95.0 85.5 0.022 99.0 94.0 0.023150 0.025 116.0 128.0 0.003 119.0 135.0 0.004150 0.05 115.0 126.0 0.005 118.0 132.0 0.007150 0.1 113.0 122.0 0.009 117.0 131.0 0.010150 0.2 111.0 117.0 0.014 115.0 126.0 0.015150 0.4 107.0 108.0 0.022 111.0 117.0 0.022200 0.025 125.0 147.0 0.003 128.0 155.0 0.004200 0.05 123.0 144.0 0.005 126.0 152.0 0.006200 0.1 122.0 142.0 0.009 126.0 151.0 0.010200 0.2 120.0 137.0 0.014 123.0 145.0 0.015200 0.4 117.0 129.0 0.020 120.0 137.0 0.020250 0.025 131.0 163.0 0.003 135.0 172.0 0.004250 0.05 130.0 160.0 0.005 134.0 170.0 0.006250 0.1 128.0 156.0 0.009 133.0 168.0 0.009250 0.2 127.0 153.0 0.014 131.0 162.0 0.014250 0.4 123.0 143.0 0.019 127.0 154.0 0.017300 0.025 137.0 178.0 0.003 141.0 188.0 0.003300 0.05 136.0 175.0 0.005 140.0 185.0 0.005300 0.1 135.0 174.0 0.009 139.0 183.0 0.009300 0.2 133.0 167.0 0.014 137.0 178.0 0.014300 0.4 129.0 158.0 0.017 134.0 171.0 0.016
σ'c TeDr = 60% Dr = 80%
Fr G γ Fr G γkPa V Hz MPa % Hz MPa %50 0.025 87.4 73.4 0.005 88.8 74.7 0.00350 0.05 84.9 69.3 0.007 87.7 72.8 0.00650 0.1 84.1 68.1 0.010 86.6 71.1 0.00950 0.2 80.9 63.0 0.015 83.4 66.0 0.01450 0.4 77.7 58.0 0.022 79.0 59.2 0.020
100 0.025 104.0 104.0 0.004 109.0 113.0 0.004100 0.05 104.0 103.0 0.007 108.0 111.0 0.006100 0.1 103.0 101.0 0.011 107.0 108.0 0.009100 0.2 100.0 96.3 0.016 104.0 103.0 0.014100 0.4 96.4 88.8 0.023 100.0 94.9 0.021150 0.025 117.0 131.0 0.004 121.0 140.0 0.004150 0.05 117.0 129.0 0.007 120.0 136.0 0.006150 0.1 116.0 127.0 0.010 118.0 132.0 0.009150 0.2 114.0 123.0 0.015 117.0 130.0 0.014150 0.4 110.0 115.0 0.022 113.0 120.0 0.021200 0.025 126.0 152.0 0.004 131.0 163.0 0.003200 0.05 126.0 150.0 0.006 130.0 159.0 0.006200 0.1 125.0 148.0 0.010 128.0 155.0 0.009200 0.2 123.0 144.0 0.015 127.0 153.0 0.013200 0.4 120.0 136.0 0.020 123.0 144.0 0.019250 0.025 134.0 170.0 0.004 138.0 181.0 0.003250 0.05 133.0 168.0 0.006 137.0 179.0 0.005250 0.1 131.0 163.0 0.009 136.0 174.0 0.009250 0.2 130.0 161.0 0.014 134.0 171.0 0.013250 0.4 126.0 151.0 0.018 131.0 163.0 0.017300 0.025 140.0 187.0 0.003 145.0 198.0 0.003300 0.05 139.0 184.0 0.006 143.0 195.0 0.005300 0.1 138.0 180.0 0.009 142.0 191.0 0.008300 0.2 137.0 177.0 0.014 141.0 188.0 0.013300 0.4 133.0 167.0 0.016 136.0 175.0 0.015
Table 3. Results corresponding to relative densities equal to 60 and 80%.
39.Acta Geotechnica Slovenica, 2017/2
H. Patiño et al.: Shear modulus of a saturated granular soil derived from resonant-column tests
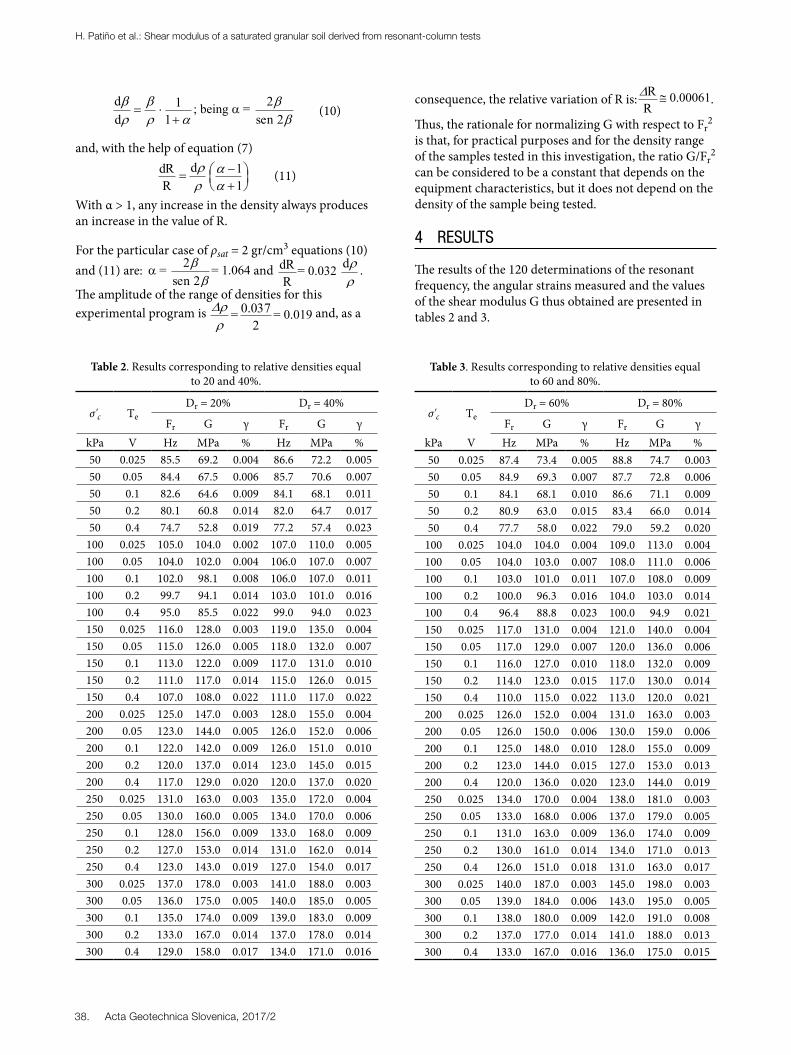
Fig. 6 shows the variation trends of the shear modulus as a function of the angular strains for effective consolida-tion pressures varying from 50 to 300 kPa and a relative density of 20%. It can be observed that in the range of small deformations (0.002–0.023%) the degradation of the shear modulus (or an increase of the inverse value of G) can be approximated as a linear function of the angu-lar strain. This linear-type degradation recurs within the range of relative densities and effective consolidation pressures studied herein.
As these variation trends are similar, only the graphics corresponding to the relative densities equal to 20% have been included.
Although the void ratio or the sample density is little modified under the static conditions of consolidation, at low pressures, this effect was taken into account in this research. In fact, the software implemented in the equipment evaluates the G-module from the conditions of the specimens at the end of the consolidation phase and obviously using equation (3).
The results obtained make it possible to evaluate the effect of factors such as angular strain, effective consoli-dation pressure and relative density in the determination of the shear modulus through the execution of the resonant-column test.
4.1 Shear modulus versus angular strain
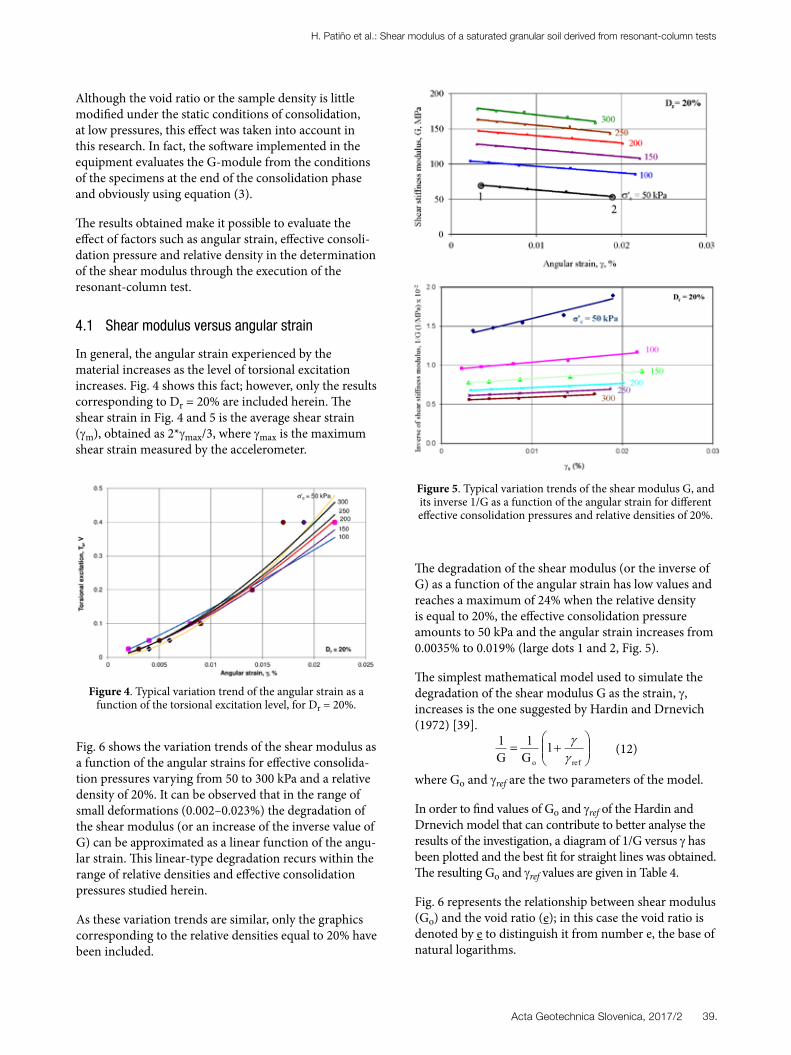
In general, the angular strain experienced by the material increases as the level of torsional excitation increases. Fig. 4 shows this fact; however, only the results corresponding to Dr = 20% are included herein. The shear strain in Fig. 4 and 5 is the average shear strain (γm), obtained as 2*γmax/3, where γmax is the maximum shear strain measured by the accelerometer.
Figure 4. Typical variation trend of the angular strain as a function of the torsional excitation level, for Dr = 20%.
Figure 5. Typical variation trends of the shear modulus G, and its inverse 1/G as a function of the angular strain for different effective consolidation pressures and relative densities of 20%.
The degradation of the shear modulus (or the inverse of G) as a function of the angular strain has low values and reaches a maximum of 24% when the relative density is equal to 20%, the effective consolidation pressure amounts to 50 kPa and the angular strain increases from 0.0035% to 0.019% (large dots 1 and 2, Fig. 5).
The simplest mathematical model used to simulate the degradation of the shear modulus G as the strain, γ, increases is the one suggested by Hardin and Drnevich (1972) [39].
+=refo
1G1
G1 (12)
where Go and γref are the two parameters of the model.
In order to find values of Go and γref of the Hardin and Drnevich model that can contribute to better analyse the results of the investigation, a diagram of 1/G versus γ has been plotted and the best fit for straight lines was obtained. The resulting Go and γref values are given in Table 4.
Fig. 6 represents the relationship between shear modulus (Go) and the void ratio (e); in this case the void ratio is denoted by e to distinguish it from number e, the base of natural logarithms.
40. Acta Geotechnica Slovenica, 2017/2
H. Patiño et al.: Shear modulus of a saturated granular soil derived from resonant-column tests
Value of Go (MPa)
DrConsolidation pressure σ’c (kPa)
50 100 150 200 250 30020 75.8 107.5 133.3 151.5 166.7 185.240 78.1 116.3 140.9 161.3 178.6 192.360 78.7 109.9 137.0 158.7 175.4 192.380 80.0 119.1 144.9 166.7 185.2 204.1
Value of γref (%)
DrConsolidation pressure σ’c (kPa)
50 100 150 200 250 30020 0.045 0.092 0.100 0.124 0.122 0.11840 0.068 0.103 0.114 0.124 0.114 0.14760 0.062 0.104 0.124 0.141 0.118 0.12280 0.060 0.085 0.106 0.124 0.130 0.107
Table 4. Values of Go and γref that best fit the test results.
Figure 6. Value of shear modulus Go vs void ratio (e).
As we can see in Table 4, the fact that Go is sometimes even larger in samples with Dr = 40% than in samples with Dr = 60% is due to the narrow range of variation coupled with the unavoidable experimental scatter of results. The low sensitivity of Go can be attributed to the nature of the sand, made of hard quartz grains (rounded and very uniform in size), which implies only little vari-ation between the maximum and minimum void ratios.
4.2 Increase of Go with σ’c
The values of the shear modulus for small strains, Go, obtained as indicated in the previous paragraph, are given in Table 4. It is clear that for each value of the relative density, the value of Go increases as the consoli-dation pressure increases. See Fig. 7. Usually, the relation among these values (Go and σ’c) is thought to be of the type.
o
N
o
co p
p'
KG = (13)
where K is a “modulus number”, N is an “exponent number” and po is the value of a standard reference pressure. For this particular investigation a value of po = 98.1 kPa is used.
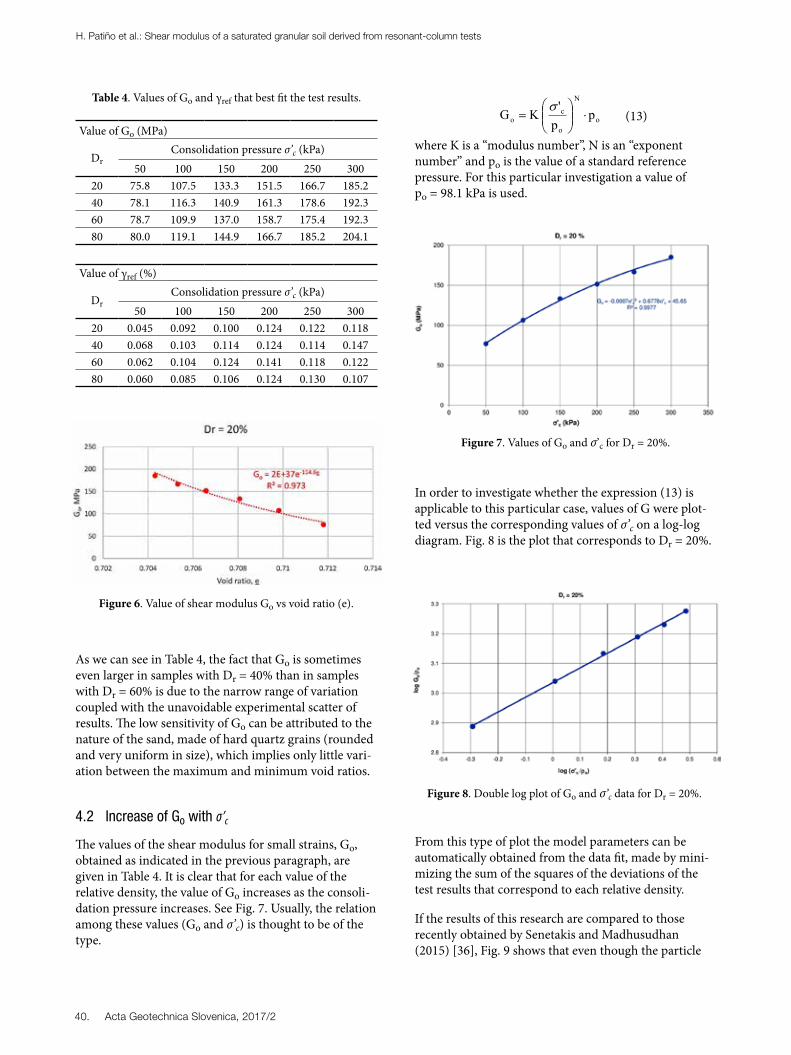
In order to investigate whether the expression (13) is applicable to this particular case, values of G were plot-ted versus the corresponding values of σ’c on a log-log diagram. Fig. 8 is the plot that corresponds to Dr = 20%.
Figure 7. Values of Go and σ’c for Dr = 20%.
Figure 8. Double log plot of Go and σ’c data for Dr = 20%.
From this type of plot the model parameters can be automatically obtained from the data fit, made by mini-mizing the sum of the squares of the deviations of the test results that correspond to each relative density.
If the results of this research are compared to those recently obtained by Senetakis and Madhusudhan (2015) [36], Fig. 9 shows that even though the particle
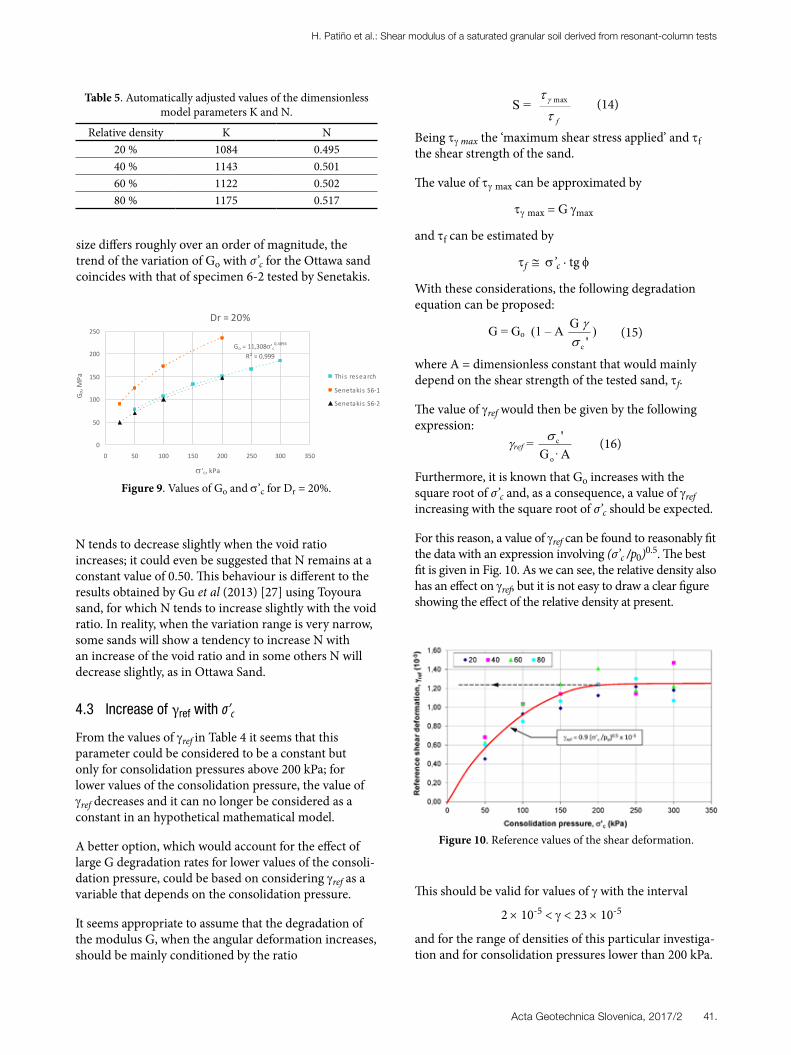
41.Acta Geotechnica Slovenica, 2017/2
H. Patiño et al.: Shear modulus of a saturated granular soil derived from resonant-column tests
size differs roughly over an order of magnitude, the trend of the variation of Go with σ’c for the Ottawa sand coincides with that of specimen 6-2 tested by Senetakis.
Relative density K N20 % 1084 0.49540 % 1143 0.50160 % 1122 0.50280 % 1175 0.517
Table 5. Automatically adjusted values of the dimensionless model parameters K and N.
Dr=20%
Go=11,308s'c0,4894
R²=0,999
0
50
100
150
200
250
0 50 100 150 200 250 300 350
s'c,kPa
G o,M
Pa This research
Senetakis S6-1
Senetakis S6-2
N tends to decrease slightly when the void ratio increases; it could even be suggested that N remains at a constant value of 0.50. This behaviour is different to the results obtained by Gu et al (2013) [27] using Toyoura sand, for which N tends to increase slightly with the void ratio. In reality, when the variation range is very narrow, some sands will show a tendency to increase N with an increase of the void ratio and in some others N will decrease slightly, as in Ottawa Sand.
4.3 Increase of γref with σ’c
From the values of γref in Table 4 it seems that this parameter could be considered to be a constant but only for consolidation pressures above 200 kPa; for lower values of the consolidation pressure, the value of γref decreases and it can no longer be considered as a constant in an hypothetical mathematical model.
A better option, which would account for the effect of large G degradation rates for lower values of the consoli-dation pressure, could be based on considering γref as a variable that depends on the consolidation pressure.
It seems appropriate to assume that the degradation of the modulus G, when the angular deformation increases, should be mainly conditioned by the ratio
Figure 9. Values of Go and σ’c for Dr = 20%.
S = f
max (14)
Being τγ max the ‘maximum shear stress applied’ and τf the shear strength of the sand.
The value of τγ max can be approximated by
τγ max = G γmax
and τf can be estimated by
τf ≅ σ’c · tg φ
With these considerations, the following degradation equation can be proposed:
G = Go (1 – A '
G
c
) (15)
where A = dimensionless constant that would mainly depend on the shear strength of the tested sand, τf.
The value of γref would then be given by the following expression:
ref = AG'
o
c (16)
Furthermore, it is known that Go increases with the square root of σ’c and, as a consequence, a value of γref increasing with the square root of σ’c should be expected.
For this reason, a value of γref can be found to reasonably fit the data with an expression involving (σ’c /p0)0.5. The best fit is given in Fig. 10. As we can see, the relative density also has an effect on γref, but it is not easy to draw a clear figure showing the effect of the relative density at present.
This should be valid for values of γ with the interval
2 × 10⁻⁵ < γ < 23 × 10-5
and for the range of densities of this particular investiga-tion and for consolidation pressures lower than 200 kPa.
Figure 10. Reference values of the shear deformation.

42. Acta Geotechnica Slovenica, 2017/2
H. Patiño et al.: Shear modulus of a saturated granular soil derived from resonant-column tests
4.4 Influence of void ratio on the shear modulus
Four nominal values of the relative densities are used to prepare the samples for testing. These are relatively precise data, since the volume of the sample and the associated mass are known with a margin of error of about 0.1%.
During the process of consolidation some reduction in the volume takes place that increases the relative density. This change of relative density has been investigated by running an oedometer test on a sample prepared with an initial relative density of 20%. The results are given in Fig. 11.
Figure 11. Increase of relative density. Oedometer test.
In resonant-column tests the consolidation pressure is applied in three directions and, as a consequence, changes in the relative density should be expected to be higher than the ones taking place in the oedometer tests, where the consolidation pressure σ’c is only applied directly in the vertical direction. The theoretical relation of the volume changes between one-dimensional and three-dimensional consolidation is R = 3/(1+2 ko). For this particular case and assuming an approximate value of ko = 0.5, a factor R = 1.5 is obtained.
The real relative densities of the samples after consolida-tion are greater than the nominal values used in this investigation. Now, in order to better approach the effect of specimen densities, somewhat larger values of the relative densities are used.
It is known that the void ratio is a better parameter to analyze the dynamic moduli of sands than the relative density. Two different sands that have similar void ratios could have quite similar shear moduli even if their rela-tive densities were quite different. In the same manner, two sands with equal relative densities could have quite different shear moduli.
Since the void ratio is a better parameter, the values of the relative density have been translated into void-ratio values. For this particular sand, with values of emax= 0.754 and emin. = 0.554, the following relation exists between the relative densities and the void ratios:
Dr = minmax
max
eeee =
554.0754.0e754.0 =
20.0e754.0
(17)
Based on this expression and taking into consideration the small increase of the relative densities during the consolidation process of the samples, the values of the void ratios to represent the expected value of each test are given in Table 6.
Relative densityDr
Normal value
Relative densityDr*
Expected after consolidation
Void ratioe
during the test
20% 22% 0.7140% 42% 0.6760% 62% 0.6380% 82% 0.59
Table 6. Values of the void ratio for each test series.
Figure 12. Value of the model modulus number K vs. void ratio, e.
Figure 13. Value of the model modulus exponent, N, vs. void ratio, e.
43.Acta Geotechnica Slovenica, 2017/2
H. Patiño et al.: Shear modulus of a saturated granular soil derived from resonant-column tests
Variations of the parameters K and N obtained in previ-ous paragraphs are now plotted in Fig. 12 and Fig. 13 as a function of the void ratio.
5 DISCUSSION
The interpretation of the data obtained by testing the 120 samples of 20–40 Ottawa sand leads to proposing the following value for the shear modulus:
G = o
N
o
c
1
ref
pp
'k1+ (18)
where the main variables are:
γ = angular deformation. σ’c = consolidation pressure
In this expression, po is a reference pressure with the value, po = 98.1 kPa = 1 kp/cm2.
The values of the dimensionless parameters are:
ref = 0.95,0
o
c
p' 10-3 1.26 10-3 (19)
k = 1000 (1.54 - 0.63e)
N = 0.5 (1.22 - 0.33e) where e = void ratio.
Senetakis and Madhusudhan (2015) [36] remarked that when relating Go with p’ through a potential func-tion, the exponent nG decreases slightly as the relative density increases. This research has also found that Go can be related to σ’c through potential functions with an exponent N that increases slightly with relative density. As mentioned, the trend in the variation of N would not necessarily be the same, as many factors are different in the various research tests. Moreover, the ranges of varia-tion for the exponent N are very narrow. This model is considered to be valid for the range of consolidation pressures, the angular deformation and the void ratio covered for this investigation.
Those ranges are:
σ’c : 50 to 300 kPa γmax : 2 × 10⁻⁵ to 23 × 10-5
e: 0.59 to 0.71
Most authors, among them Richart et al. (1970) [11], Prakash (1981) [40], Das (1983) [41], accept that round grained sands, tested in the resonant column device in dry conditions, have a shear modulus that can be estimated using the following expression:
G = 697 5.0
o
co
2
p'
pe1
)e17.2(+
(20)
where e = void ratio; po = reference pressure (0.1 MPa) and σ’c = consolidation pressure.
This quite famous correlation was first established by Hardin and Richart (1963) [12] and does apply to dry sands tested under resonant-column conditions with shear deformations of the order of γmax = 10-3 rd.
For the central value of the void ratio of this investiga-tion, e = 0.65 and σ’c = 150 kPa, the above expression yields the following results:
G = 1.207∙po = 118 MPa
From the results of this investigation it can be obtained, for the same conditions (σ’c = 150 kPa, e = 0.65).
G = 1
ref
1+ 137 MPa (21)
γref = 1.11 × 10⁻³
It can be seen that both results would coincide if the value of γ is:
γ = 1.8 × 10⁻⁴
It can be concluded that the approach given in this paper agrees quite closely, at least for the central value of G, with the established practice.
This investigation deals with saturated sands, whereas the one used to make the comparison, Hardin and Richart (1963) [15], deals with dry soil. This may lead us to conclude that the effect of saturation on the value of the shear modulus could be quite small, practically negligible.
But there is one difference in respect to the influence of the void ratio on the value of the shear modulus. According to the old reference considered in this discussion [7], changing the void ratio from e = 0.71 to e = 0.59 (extreme values in this research) increases the shear modulus by 26%, irrespective of the other test variables. However, according to this investigation, the change in the modulus depends on the consolidation pressure, but it is, in any case, less than 16%.
This discrepancy could be considered as an artifact of the unavoidable imprecision of laboratory tests or it could be a real difference in behavior due to the effect of the sample saturation.
44. Acta Geotechnica Slovenica, 2017/2
H. Patiño et al.: Shear modulus of a saturated granular soil derived from resonant-column tests
6 CONCLUSIONS
A total of 120 saturated specimens of Ottawa sand were tested in a resonant-column apparatus under angular strains (γ) of 0.002 to 0.023%, relative densities ranging from 20 to 80% and effective consolidation pressures (σ’c) between 50 and 300 kPa. The obtained shear modu-lus (G) was related to the other intervening parameters. The main conclusions derived are as follows:
1. Relative density is the factor with the least influence on the obtained shear modulus. Following in impor-tance are the angular strains.
2. The greatest influence in the value of the shear modulus is the effective consolidation pressure.
3. A simple empirical expression is proposed for G as a function of γ and σ’c , for the range of γ tested.
4. For the same γ and Dr, the variation trend of G, as a function of σ’c , can be fit to a potential function with a correlation coefficient practically equal to unity.
5. A simple expression (18) is proposed for G, also taking into account the void ratio (e) values. This research has explored a somewhat narrow range of e and therefore this proposal could be less precise than those made to consider other effects.
6. Although the material used was saturated Ottawa sand, the model defined in this paper might be valid in the case of other uniform granular soils with fine to medium rounded grains and quartz origin.
REFERENCES
[1] Ishimato, M., Iida, K. 1937. Determination of elastic constants of soils by means of vibration methods. Part 2. Modulus of rigidity and Poisson’s ratio. Bulletin of the Earthquake Research Insti-tute, Tokyo Imperial University, 15, 67-85.
[2] Iida, K. 1938. The Velocity of Elastic Waves in Sand. Bulletin of the Earthquake Research Insti-tute, Tokyo Imperial University, 16, 131-144.
[3] Iida, K. 1940. On the Elastic Properties of Soil Particularly in Relation to its Water Contents. Bulletin of the Earthquake Research Institute, Tokyo Imperial University, 18, 675-690.
[4] Bishop, K.E. 1959. Forced torsional vibration of system with distributed mass and internal and external damping. Transactions of the ASME, 8-12.
[5] Wilson, S.D., Dietrich, R.J. 1960. Effect of consoli-dation pressure on elastic and strength properties of clay. Proceedings of the Research Conference on Shear Strength of Cohesive Soils, ASCE, Boulder, Colorado, pp. 419-435.
[6] Hall, J.R., Richard, F.E. 1963. Discussion of elastic
wave energy in granular soils. ASCE, Journal of the Soil Mechanics and Foundations Division 89, 6, 27-56.
[7] Drnevich, V.P., Hall, J.R., Richart, F.E., University of Michigan, U.S. Army Engineer, Waterways Experiment Station. 1966. Large Amplitude Vibration Effects on the Shear Modulus of Sand. Vicksburg, Miss: Waterways Experiment Station. USA.
[8] Drnevich, V.P., Hall, J.R., Richart, F.E. 1967. Effect of amplitude of vibration on the shear modulus of sand. Proceedings of the International Symposium on Wave Propagation and Dynamic Properties of Earth Materials, Albuquerque, USA, pp 189-199.
[9] Drnevich, V.P., Hardin, B.O., Shippy, D.J. 1978. Modulus and damping of soils by the resonant-column method. Dynamic Geotechnical Testing, American Society for Testing and Materials 91-125.DOI: http://dx.doi.org/10.1520/STP35673S
[10] Menq, F. 2003. Dynamic properties of sandy and gravelly soils. Doctor of Philosophy Dissertation, University of Texas, Austin.
[11] Clayton, C.R.I., Priest, J.A., Bui, M., Zervos, A., Kim, S. G. 2009. The Stokoe resonant column apparatus: effects of stiffness, mass and specimen fixity. Geotechnique 59, 5, 429-437. DOI: http://dx.doi.org/10.1680/geot.2007.00096
[12] Clayton, C.R.I. 2011. Stiffness at small strain: research and practice. Geotechnique 61, 1, 5-37. DOI: http://dx.doi.org/10.1680/geot.2011.61.1.5
[13] Al-Sanad, H., Aggour, M.S. 1984. Dynamic soil properties from sinusoidal and random vibrations. Proceeding, 8th World Conference on Earthquake Engineering 3, San Francisco, pp. 15-22.
[14] Tawfiq, K.S., Aggour, M.S., Al-Samad, H.A. 1988. Dynamic properties of cohesive soils from impulse testing. Proceedings, 9th World Conference on Earthquake Engineering 3, Tokyo, pp. 11-16.
[15] Hardin, B.O., Richart, F.E. 1963. Elastic wave velocities in granular soils. ASCE, Journal of the Soil Mechanics and Foundations Division 98, 1, 33-65.
[16] Hardin, B.O. 1965. The nature of damping in sands. ASCE, Journal of the Soil Mechanics and Founda-tions Division 91, 1, 63-97.
[17] Richart, F.E., Hall, J.R., Woods, R.D. 1970. Vibra-tion of Soils and Foundations. Prentice Hall, Englewood Cliffs, New Jersey.
[18] Santamarina, J. C., Cascante, G. 1996. Stress anisot-ropy and wave propagation: a micromechanical view. Canadian geotechnical Journal 33, 770-782. DOI: 10.1139/t96-102-323
[19] Kuribayashi, E., Iwasaki, T., Tatsuoka, F. 1975. Effects of stress-strain conditions on dynamic properties of sands. Proceedings of the Japan Soci-ety of Civil Engineers 242, 105-114. DOI: http://
45.Acta Geotechnica Slovenica, 2017/2
H. Patiño et al.: Shear modulus of a saturated granular soil derived from resonant-column tests
dx.doi.org/10.2208/jscej1969.1975.242_105[20] Iwasaki, T., Tatsuoka, F., Takagi, Y. 1978. Shear
moduli of sands under cyclic torsional shear loading. Soils and Foundations 18, 1, 39-56. DOI: http://dx.doi.org/10.3208/sandf1972.18.39
[21] Tatsuoka, F., Iwasaki, T., Yoshida, S., Fukushima, S., Sudo, H. 1979. Shear modulus and damping by drained tests on clean sand specimen reconsti-tuted by various methods. Soils and Foundations 19, 1, 39-54. DOI: http://dx.doi.org/10.3208/sandf1972.19.39
[22] Alarcón-Guzmán, A., Chameau, J.L., Leonards, G.A., Frost, J.D. 1989. Shear modulus and cyclic undrained behavior of sands. Soils and Founda-tions 29, 4, 105-119.
[23] Saxena, S., Reddy, K. 1989. Dynamic moduli and Damping ratios for Monterrey No. 0 sand by resonant column test. Soils and Founda-tions 29, 2, 37-51. DOI: http://doi.org/10.3208/sandf1972.29.2_37
[24] Lo Presti, D.C.F., Jamiolkowski, M., Pallara, O., Cavallaro, A., Pedroni, S. 1997. Shear modulus and damping of soils. Géotechnique 37, 3, 603-617. DOI: http://dx.doi.org/10.1680/geot.1997.47.3.603
[25] Díaz-Rodríguez, J.A., López-Flores, L. 1999. A study of microstructure using resonant-column tests. Proceeding of the Second International Conference on Earthquake Geotechnical Engi-neering, Lisbon, Portugal, pp. 89-94.
[26] Wichtmann, T., Triantafyllidis, T. 2004. Influ-ence of a cyclic and dynamic loading history on dynamic properties of dry sand, part I: Cyclic and dynamic torsional prestraining. Soil Dynamics and Earthquake Engineering 24, 127-147. DOI: http://dx.doi.org/10.1016/j.soildyn.2003.10.004
[27] Gu, X.Q., Yang, J., Huang, M.S. 2013. Laboratory measurements of small strain properties of dry sands by bender element. Soils and Foundations, 53, 5, 735-745. DOI: http://dx.doi.org/10.1016/j.sandf.2013.08.011
[28] Chang, N.Y., Ko, H.Y., University of Colorado at Denver. Geotechnical Engineering Division. 1982. Effect of Grain Size Distribution on Dynamic Properties and Liquefaction Potential of Granular Soils. University of Colorado, Department of Civil and Urban Engineering, Geotechnical Engineering Division. USA.
[29] Koono, T., Suzuki, Y., Tateishi, A., Ishihara, K., Akino, K., Satsuki, I. 1993. Gravelly soil properties by field and laboratory tests. Proceedings of the 3rd International Conference on Case Histories in Geotechnical Engineering, St Louis, Missouri, 1, pp. 575-594.
[30] Wichtmann, T., Triantafyllidis, T. 2009. Influence of the Grain-Size Distribution Curve of Quartz Sand on the Small Strain Shear Modulus Gmax.
ASCE, Journal of Geotechnical and Geoenviron-mental Engineering 135, 10, 1404-1418. DOI: http://dx.doi.org/10.1061/(ASCE)GT.1943-5606.0000096
[31] Wichtmann, T., Triantafyllidis, T. 2013. Effect of Uniformity Coefficient on G/Gmax and Damping Ratio of Uniform to Well-Graded Quartz Sands. Journal of Geotechnical and ASCE, Geoenviron-mental Engineering 139, 1, 59-72. DOI: http://dx.doi.org/10.1061/(ASCE)GT.1943-5606.0000735
[32] Wichtmann, T., Triantafyllidis, T. 2014. Stiffness and Damping of Clean Quartz Sand with Various Grain-Size Distribution Curves. ASCE, Journal of Geotechnical and Geoenvironmental Engineer-ing, Technical Note 140, 1-4. DOI: http://dx.doi.org/10.1061/(ASCE)GT.1943-5606.0000977
[33] Martínez, E. 2012. Influencia de la densidad rela-tiva, índice de poros, presión de consolidación y amplitud de excitación en los parámetros dinámi-cos de una arena saturada (Máster tesis). Universi-dad Complutense de Madrid.
[34] Senetakis, K., Anastasiadis, A., Pitilakis, K. 2012. The Small-Strain Shear Modulus and Damping Ratio of Quartz and Volcanic Sands. Geotechnical Testing Journal 35, 6, 964-980. DOI: http://dx.doi.org/10.1520/GTJ20120073
[35] Yang, J., Gu, X.Q. 2013. Shear stiffness of granular material at small strains: Does it depend on grain size. Géotechnique 63, 2, 165-179. DOI: http://dx.doi.org/10.1680/geot.11.P.083
[36] Senetakis, K., Madhusudhan, B. N. 2015. Dynam-ics of potential fill–backfill material at very small strains. Soils and Foundations 55, 5, 1196-1210. DOI: http://dx.doi.org/10.1016/j.sandf.2015.09.019
[37] Payan, M., Khoshghalb, A., Senetakis, K., Khalili, N. 2016. Effect of particle shape and validity of Gmax models for sand: A critical review and a new expression. Computers and Geotechnics 72, 28-41. Dynamics of potential fill–backfill material at very small strains. DOI: http://dx.doi.org/10.1016/j.compgeo.2015.11.003
[38] Payan, M., Denetakis, K., Khoshghalb, A., Khalili, N. 2016. Influence of particle shape on small-strain damping ratio of dry sands. Géotechnique 66, 7, 610-616. DOI: http://dx.doi.org/10.1680/jgeot.15.T.035
[39] Hardin, B.O., Drnevich, V.P. 1972. Shear Modulus and Damping in Soils: Design Equations and Curves. ASCE, Journal of the Soil Mechanics and Foundations Division 98, 7, 667-692.
[40] Prakash, S. 1981. Soil Dynamics. McGraw-Hill Book Company. USA
[41] Das, B M. 1983. Fundamentals of Soil Dynamics. Elsevier Science Publishers. USA.