
Separation of S–wave pseudoscalar and pseudovector ... · R. Kamin´ski, L. Le´sniak and K....
40
arXiv:hep-ph/9606362v2 11 Feb 1997 Separation of S –wave pseudoscalar and pseudovector amplitudes in π − p ↑ → π + π − n reaction on polarized target R. Kami´ nski, L. Le´ sniak and K. Rybicki Henryk Niewodnicza´ nski Institute of Nuclear Physics, PL 31-342Krak´ow, Poland February 7, 2008 Abstract A new analysis of S –wave production amplitudes for the reaction π − p ↑ → π + π − n on a transversely polarized target is performed. It is based on the results obtained by the CERN–Cracow–Munich collab- oration in the ππ energy range from 600 MeV to 1600 MeV at 17.2 GeV/c π − momentum. Energy–independent separation of the S –wave pseudoscalar amplitude (π exchange) from the pseudovector amplitude (a 1 exchange) is carried out using assumptions much weaker than those in all previous analyses. We show that, especially around 1000 MeV and around 1500 MeV, the a 1 exchange amplitude cannot be neglected. The scalar–isoscalar ππ phase shifts are calculated using fairly weak assumptions. Below the K K threshold we find two solutions for the π − π phase shifts, for which the phases increase slower with the effective π − π mass than the P-wave phases. Both solutions are consistent with a broad f 0 (500) but only one is similar to the well-known ”down” solution. We find also the third solution (with a somewhat puzzling behavior of inelasticity) which exhibits a narrow f 0 (750) claimed by Svec. All the solutions undergo a rapid change at the K K threshold. Above 1420 MeV the phase shifts increase with energy faster than those obtained without the polarized-target data. This phase behavior as well as an increase of the modulus of the a 1 -exchange amplitude can be due to the presence of the f 0 (1500). 1
Transcript of Separation of S–wave pseudoscalar and pseudovector ... · R. Kamin´ski, L. Le´sniak and K....
arX
iv:h
ep-p
h/96
0636
2v2
11
Feb
1997
Separation of S–wave pseudoscalar and
pseudovector amplitudes in π−p↑ → π+π−nreaction on polarized target
R. Kaminski, L. Lesniak and K. Rybicki
Henryk Niewodniczanski Institute of Nuclear Physics,PL 31-342 Krakow, Poland
February 7, 2008
Abstract
A new analysis of S–wave production amplitudes for the reactionπ−p↑ → π+π−n on a transversely polarized target is performed. It isbased on the results obtained by the CERN–Cracow–Munich collab-oration in the ππ energy range from 600 MeV to 1600 MeV at 17.2GeV/c π− momentum. Energy–independent separation of the S–wavepseudoscalar amplitude (π exchange) from the pseudovector amplitude(a1 exchange) is carried out using assumptions much weaker than thosein all previous analyses. We show that, especially around 1000 MeVand around 1500 MeV, the a1 exchange amplitude cannot be neglected.The scalar–isoscalar ππ phase shifts are calculated using fairly weakassumptions.
Below the KK threshold we find two solutions for the π − π phaseshifts, for which the phases increase slower with the effective π − π
mass than the P-wave phases. Both solutions are consistent with abroad f0(500) but only one is similar to the well-known ”down” solution.We find also the third solution (with a somewhat puzzling behavior ofinelasticity) which exhibits a narrow f0(750) claimed by Svec. All thesolutions undergo a rapid change at the KK threshold. Above 1420MeV the phase shifts increase with energy faster than those obtainedwithout the polarized-target data. This phase behavior as well as anincrease of the modulus of the a1-exchange amplitude can be due to thepresence of the f0(1500).
1
1 Introduction
Study of scalar mesons is one of the central points of light quark spec-troscopy. In addition to ordinary qq mesons, some KK bound states [1, 2] andlowest–lying glueballs are expected as well [3, 4, 5, 6, 7]. Unfortunately, theexperimental situation is still far from being clear [8, 9, 10, 11]. In the effec-tive mass region above 1000 MeV, a rich spectrum of scalar mesons has beenrecently proposed and discussed in many experimental [12, 13] and theoreti-cal [6, 7, 14] papers. Generally, the proposed scalar states have a coupling tothe ππ channel strong enough to manifest themselves through energy depen-dence of the ππ interaction amplitudes. In the past few years scalar resonancef0(1500) related to a hypothetical lowest lying glueball state was announced[3, 4, 5, 15]. Thus, a study of the ππ interaction near 1500 MeV is importantalso in this context. Below 1000 MeV the status of scalar mesons is also un-clear since the existence of a broad σ or f0(750) meson still remains an openquestion [2, 16, 17, 19].
One of the main sources of information on the production of scalar statesis the ππ partial wave analysis (PWA) yielding the S–wave. It should bestressed that study of S–wave objects does require the partial wave analysisto ”subtract” contributions of leading mesons ρ(770) , f2(1270) and ρ3(1690)which dominate the total cross section. Virtually all PWA’s were based onthe old CERN–Munich experiment [20] which supplied 3×10⁵ events of thereaction
π−p→ π+π−n (1)
at 17.2 GeV/c. The number of observables provided by such experiment ismuch smaller than the number of real parameters needed to describe the partialwaves. Consequently, the dominance of pseudoscalar exchange, equivalent tothe absence of pseudovector exchange and several other physical assumptionshave been made in previous studies [20]–[25].
In this paper we use results of PWA performed in the energy range from600 MeV to 1600 MeV (in 20 MeV bins) obtained with the help of the polarizedtarget experiment. This experiment, performed 20 years ago by the CERN–Cracow–Munich collaboration, provided 1.2×10⁶ events of the reaction
π−p↑ → π+π−n (2)
also at 17.2 GeV/c [26]. Combination of results of both experiments yieldsa number of observables sufficient for performing a quasi–complete and en-ergy independent PWA without any model assumptions. This analysis is onlyquasi–complete because of an unknown phase between two sets of transversity
2
amplitudes. Nevertheless, intensities of partial waves could be determined ina completely model–independent way. This removed ambiguities appearing inearlier studies, except for the old ”up–down” ambiguity [21]. The ”up” solu-tion contains an S–wave resonance just under the ρ(770) and of similar width,while the ”down” S–wave modulus stays high and nearly constant all the wayto the f0(980) . It was only Svec[16, 17] who argued persistently in favour ofthe ”up” solution, using both the 17.2 GeV data as well as data on the reac-tion π+p↑ → π+π−p at 5.85 and 11.98 GeV/c. However, general belief (see e.g.[27], [28]) was that the ”up–down” ambiguity had been resolved definitely infavour of the ”down” solution. We disagree with this belief since all the pre-vious studies of the full 17.2 GeV/c data were consistent with both the ”up”and ”down” solutions. The same is true for the present analysis. We stressthis point because the mini–reviews in the last RPP editions (see e.g. Ref.[29]) contained the sentence ”BECKER 79B [30] excluded a narrow resonancebehaviour for δ0
0 ...” , contrary to what is stated explicitly in another paper ofthe same collaboration (see Sect. 6 of [26]): ”...our results do not give a clearanswer to this ambiguity...”.
In this paper we make another step in the analysis of 17.2 GeV/c dataattempting to bridge two sets of transversity amplitudes. The phase of eachS–wave transversity amplitude is fixed by requiring the phase of the leading P ,D, F–waves to follow roughly the phase of the Breit–Wigner amplitudes of theρ(770) , f2(1270) and ρ3(1690) resonances in the low, medium and high massregion respectively. This fairly reasonable assumption allows us to separateexplicitly for the first time the pseudoscalar and pseudovector amplitudes inthe S–wave.
In Sect. 2 we present mathematical formalism needed to separate theone–pion and a1 exchange amplitudes for the reaction on a polarized target.Section 3 contains a short description of the PWA done by the CERN–Cracow–Munich collaboration for reaction (2). In Sect. 4 we present our analysisyielding pseudoscalar and pseudovector reaction amplitudes. Further on, fromthe pseudoscalar amplitude we extract the I = 0, S–wave amplitude describingthe ππ elastic scattering amplitude. Our results are discussed in Sect. 4 andsummarized in Sect. 5.
2 Amplitudes describing pion pair production
in the I = 0, S–wave
a) Separation of pseudoscalar and pseudovector exchange amplitudes
Let us denote by f0 a system of two pions in a relative S–wave isospin
3
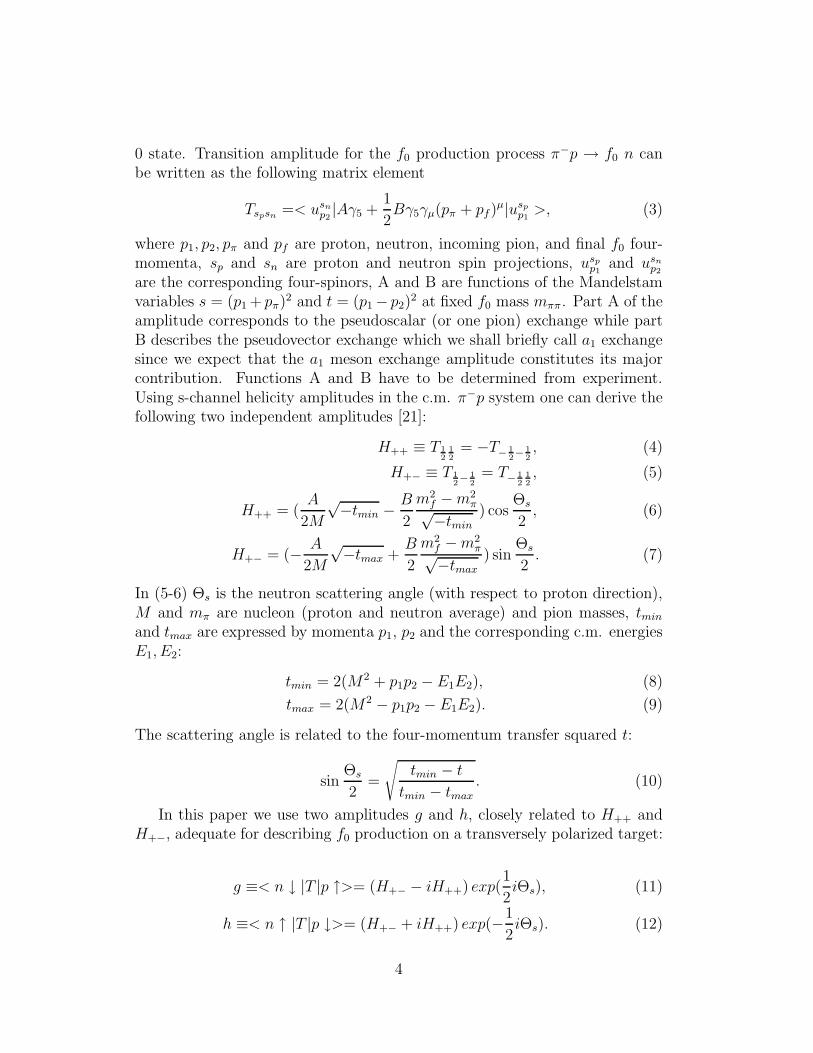
0 state. Transition amplitude for the f0 production process π−p → f0 n canbe written as the following matrix element
Tspsn=< usn
p2|Aγ5 +
1
2Bγ5γµ(pπ + pf)µ|usp
p1>, (3)
where p1, p2, pπ and pf are proton, neutron, incoming pion, and final f0 four-momenta, sp and sn are proton and neutron spin projections, usp
p1and usn
p2
are the corresponding four-spinors, A and B are functions of the Mandelstamvariables s = (p1 + pπ)2 and t = (p1 − p2)2 at fixed f0 mass mππ. Part A of theamplitude corresponds to the pseudoscalar (or one pion) exchange while partB describes the pseudovector exchange which we shall briefly call a1 exchangesince we expect that the a1 meson exchange amplitude constitutes its majorcontribution. Functions A and B have to be determined from experiment.Using s-channel helicity amplitudes in the c.m. π−p system one can derive thefollowing two independent amplitudes [21]:
H++ ≡ T 1
2
1
2
= −T− 1
2− 1
2
, (4)
H+− ≡ T 1
2− 1
2
= T− 1
2
1
2
, (5)
H++ = (A
2M
√−tmin − B
2
m2f −m2
π√−tmin
) cosΘs
2, (6)
H+− = (− A
2M
√−tmax +
B
2
m2f −m2
π√−tmax
) sinΘs
2. (7)
In (5-6) Θs is the neutron scattering angle (with respect to proton direction),M and mπ are nucleon (proton and neutron average) and pion masses, tmin
and tmax are expressed by momenta p1, p2 and the corresponding c.m. energiesE1, E2:
tmin = 2(M2 + p1p2 − E1E2), (8)
tmax = 2(M2 − p1p2 − E1E2). (9)
The scattering angle is related to the four-momentum transfer squared t:
sinΘs
2=
√
tmin − t
tmin − tmax
. (10)
In this paper we use two amplitudes g and h, closely related to H++ andH+−, adequate for describing f0 production on a transversely polarized target:
g ≡< n ↓ |T |p ↑>= (H+− − iH++) exp(1
2iΘs), (11)
h ≡< n ↑ |T |p ↓>= (H+− + iH++) exp(−1
2iΘs). (12)
4
In this case, nucleon spin is quantized along the vector n = p1 × p2 normal tothe production plane (in (11) and (12), arrows ↑ and ↓ denote spin projectionsparallel or antiparallel to n). It can be shown that the remaining two matrixelements vanish:
< n ↑ |T |p ↑>=< n ↓ |T |p ↓>= 0. (13)
Separation of invariant amplitudes A and B for the reaction π−p → f0 nfor fixed values of t and mππ can be done in the following way. Using (6,7)and (11,12) we define components gA, gB and hA, hB of amplitudes g and h asfollows:
g ≡ gA + gB, gA ≡ A
2MU gB ≡ B
2rV, (14)
h ≡ hA + hB, hA ≡ A
2MU∗ hB ≡ B
2rV ∗, (15)
where
U = (b− a)cs+ i(bc2 + as2), (16)
V = (1/a− 1/b)cs− i(s2/a+ c2/b) (17)
with the following shorthand notation: a =√−tmax, b =
√−tmin,r = m2
f −m2π, c = cos(1
2Θs), s = sin(1
2Θs).
From (14,15) one can obtain the desired amplitudes A2M
and B2r:
A
2M=
1
W(gV ∗ − hV ), (18)
B
2r =
1
W(−gU∗ + hU), (19)
whereW = UV ∗ − U∗V. (20)
Solutions (18,19) are well suited for the analysis of experimental data takenwith narrow t-bins. The CERN-Cracow-Munich data [26] have been, however,averaged over a relatively wide t-range:
t1 = −0.2 (GeV/c)2 < t < t2 = −0.005 (GeV/c)2. (21)
Therefore, we need amplitudes g and h averaged over this t-range, where
g ≡ 1
t2 − t1
∫ t2
t1
g(t) dt (22)
5
with similar equation for h. Then according to (14-15) we write
g =1
2MAU +
1
2rBV (23)
h =1
2MAU∗ +
1
2rBV ∗, (24)
where symbols AU,BV etc. are defined as in (22).In order to proceed further we have to assume some t-dependence of func-
tions A and B allowing for complete freedom in the effective mass dependence.Thus, we write
A(mππ, t) = A0(mππ)p(mππ, t) (25)
andB(mππ, t) = B0(mππ)q(mππ, t), (26)
where p(mππ, t) and q(mππ, t) are postulated functions of t (which may alsodepend on mππ), A0(mππ) and B0(mππ) depend on mππ only and their be-haviour should be determined from experiment. A possible parametrization ofp(mππ, t) is:
p(mππ, t) =ea(mππ)t
m2π − t
, (27)
which is equal to the pion propagator multiplied by the exponential form factorwith parameter a(mππ) being an a priori unknown function of mππ. This shapeof functional dependence has been introduced in many pion exchange models.For q(mππ, t) we have used four different parametrizations: 1, t, exp(bt) andt exp(bt) with b=4 GeV−2. As we shall show later, separation of averagedamplitudes g and h into a sum of averaged parts gA + gB and hA + hB asin (14-15) and (23-24) is largely insensitive to the form of parametrization offunction q(mππ, t). Functions gA, hA, gB and hB are linear combinations ofamplitudes g and h:
gA = c1g + c2h, (28)
hA = d1g + d2h, (29)
gB = d2g − c2h, (30)
hB = −d1g + c1h, (31)
where the complex coefficients are
c1 = qV ∗ pU/D, (32)
c2 = −qV pU/D, (33)
d1 = qV ∗ pU∗/D, (34)
d2 = −qV pU∗/D (35)
6
andD = pU qV ∗ − pU∗ qV . (36)
Having functions g and h experimentally determined, Eqs (28-36) make it pos-sible to calculate the unknown functions A0(mππ) and B0(mππ) in the followingway:
A0(mππ)
2M=
gA
pU(37)
andB0(mππ)
2r =
gB
qV. (38)
From (25-26) we then obtain the desired functions A and B, so that separationof amplitude (3) into pseudoscalar and pseudovector parts is finally achieved.
b) Determination of scalar-isoscalar pion-pion interaction ampli-tude
Separation of the pseudoscalar amplitude, dominantly corresponding tothe one pion exchange contribution to the π−p → f0 n process, is the firststep in the determination of the scalar-isoscalar pion-pion amplitude a0. Thisamplitude can be calculated if both the S–wave π+π− → π+π− amplitude aS
and the I=2 S–wave amplitude a2 are known:
a0 = 3 aS − 1
2a2 (39)
(see [21] p.12 and notice that the I=1, S=0 contribution vanishes). AmplitudeaS is closely related to A0/2M given by (37) since A0 is a factor responsiblefor the ππ interaction in (25):
aS = − pπ√sqπ f
mππ
√
2 · g2
4π
A0
2M, (40)
where pπ is the incoming π− momentum in the π−p c.m. frame, qπ is thefinal pion momentum in the f0 decay frame, g2/4π = 14.6 is the pion-nucleoncoupling constant, and f is the correction factor. In this factor the averagedt-dependence of the pion- nucleon vertex function and the off-shellness of theexchanged pion are included, which allows us to apply this formula to theanalysis of the data taken in a wide t-region.
When writing (40) we have assumed that absorption effects due to thefinal state interaction of the ππ with the outgoing neutron can be neglected.This assumption is supported by the results obtained in studies of absorptioneffects using the Regge phenomenology ([31]). The point is that in the case of
7
dominance of the nucleon helicity flip amplitude, final state interaction effectsare relatively weak. Thus, we can expect that errors caused by those effectsare smaller than experimental errors.
Amplitude a2 can be measured in the process π+ p → π+π+ n, providedthe partial wave analysis is done and a similar separation of pseudoscalar andpseudovector contributions is performed. Although studies of π+π+ and π−π−
systems were in the past [32], the above–mentioned separation, which requirespolarization measurements, has never been performed. Therefore, we have torely on determination of the I=2 amplitude based on the assumption thatone-pion exchange dominates in the process under discussion. The I=2 S–wave amplitude has been calculated using the data of [32] and the pion-pionseparable potential model previously applied to the description of the coupledchannel ππ and KK I=0, S–wave interactions [2]. Here for the I=2 channelwe use a very simple two-parameter pion-pion potential of rank one:
Vπ(p, p′) = λG(p)G(p′), (41)
where λ is a constant and
G(p) =
√
4π
mπ
1
p2 + β2(42)
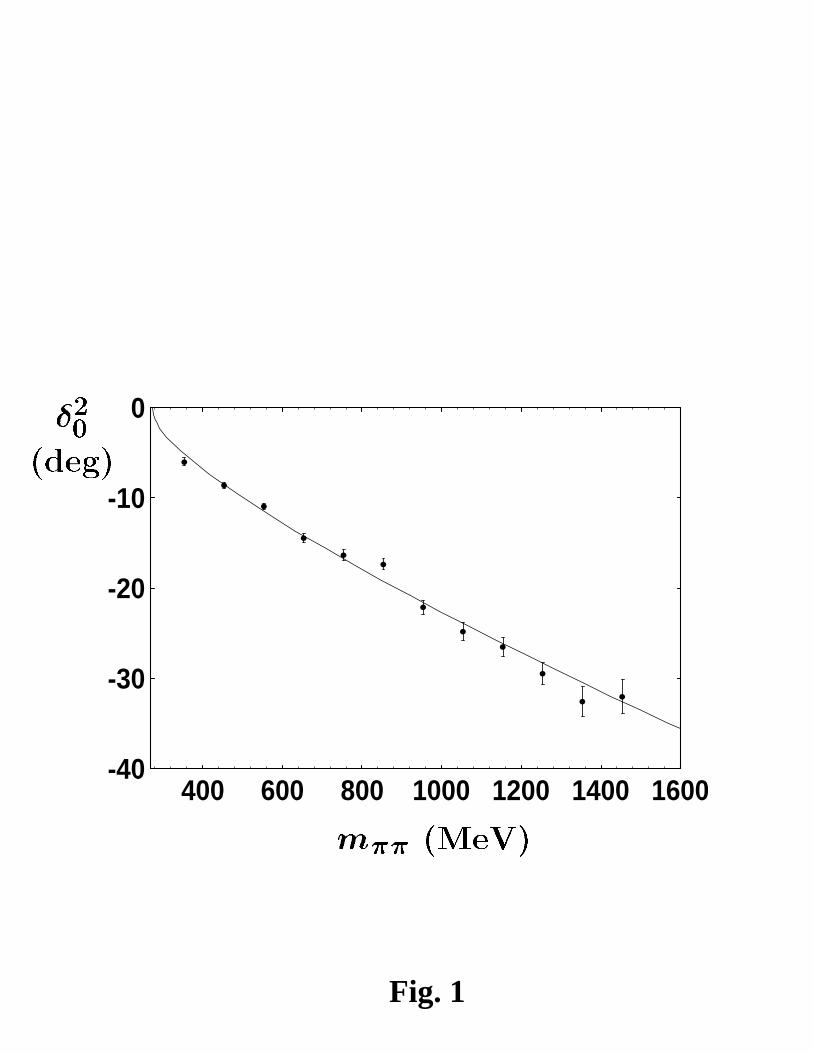
is a form factor with one range parameter β; p and p′ are pion c.m. mo-menta in the initial and final states respectively. The calculated phase shiftsδ2 corresponding to the amplitude
a2 = sin δ2exp(iδ2) (43)
for Λ ≡ λ2β3 = −0.1309 and β = 3.384 GeV are shown in Fig. 1. The analytical
form of the amplitude a2 can be found in Appendix A of [2]. This amplitude,along with aS obtained from (40), was used to calculate a0 given by (39).Amplitude a2, being generally smaller than aS, cannot be, however, neglectedin (39) as shown in Sect. 4 d. Amplitude a0 is normalized to Argand’s form:
a0 =ηe2iδ − 1
2 i, (44)
where δ is the I=0, S=0 phase shift and η is the inelasticity coefficient.
3 Model-independent determination of partial-
wave amplitudes
This section is a short recapitulation of what was extensively described inthe old papers of the CERN-Cracow-Munich collaboration [26, 30, 33, 34], towhich the reader is referred for more details.
8
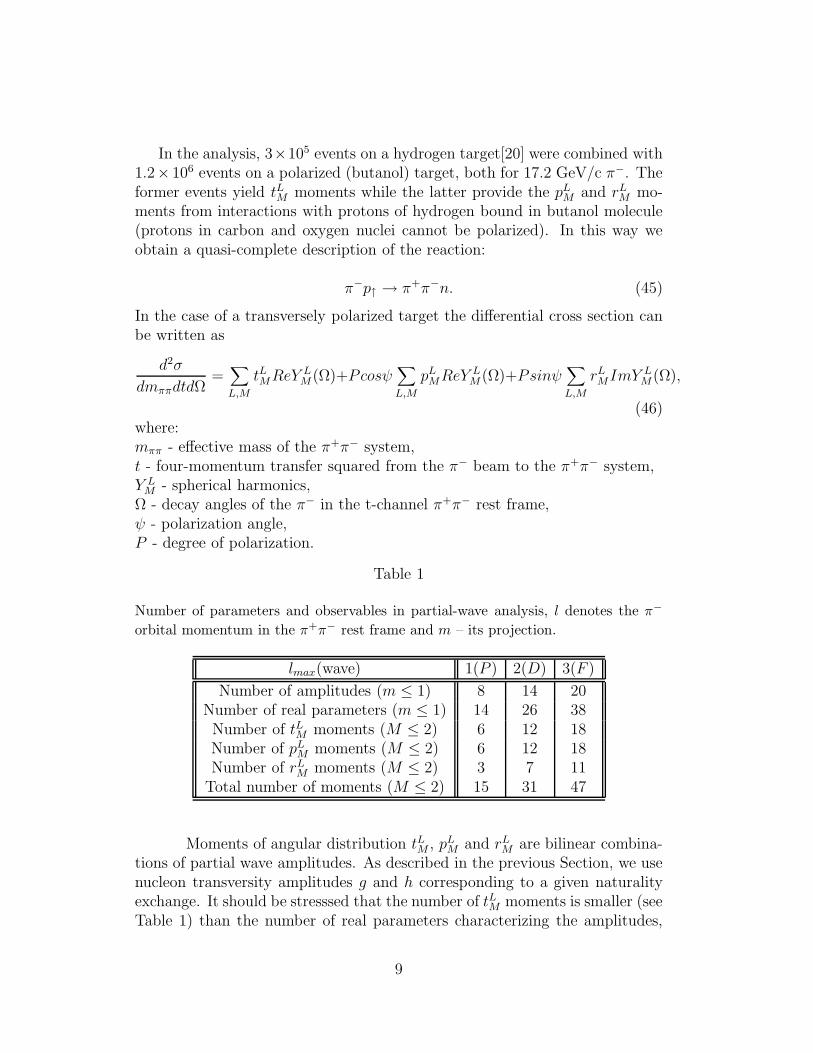
In the analysis, 3×10⁵ events on a hydrogen target[20] were combined with1.2× 106 events on a polarized (butanol) target, both for 17.2 GeV/c π−. Theformer events yield tLM moments while the latter provide the pL
M and rLM mo-
ments from interactions with protons of hydrogen bound in butanol molecule(protons in carbon and oxygen nuclei cannot be polarized). In this way weobtain a quasi-complete description of the reaction:
π−p↑ → π+π−n. (45)
In the case of a transversely polarized target the differential cross section canbe written as
d2σ
dmππdtdΩ=∑
L,M
tLMReYLM(Ω)+Pcosψ
∑
L,M
pLMReY
LM(Ω)+Psinψ
∑
L,M
rLMImY
LM(Ω),
(46)where:mππ - effective mass of the π+π− system,t - four-momentum transfer squared from the π− beam to the π+π− system,Y L
M - spherical harmonics,Ω - decay angles of the π− in the t-channel π+π− rest frame,ψ - polarization angle,P - degree of polarization.
Table 1
Number of parameters and observables in partial-wave analysis, l denotes the π−
orbital momentum in the π+π− rest frame and m – its projection.
lmax(wave) 1(P ) 2(D) 3(F )
Number of amplitudes (m ≤ 1) 8 14 20Number of real parameters (m ≤ 1) 14 26 38
Number of tLM moments (M ≤ 2) 6 12 18Number of pL
M moments (M ≤ 2) 6 12 18Number of rL
M moments (M ≤ 2) 3 7 11Total number of moments (M ≤ 2) 15 31 47
Moments of angular distribution tLM , pLM and rL
M are bilinear combina-tions of partial wave amplitudes. As described in the previous Section, we usenucleon transversity amplitudes g and h corresponding to a given naturalityexchange. It should be stresssed that the number of tLM moments is smaller (seeTable 1) than the number of real parameters characterizing the amplitudes,
9
and therefore model-independent partial–wave analysis is not possible. Con-sequently, all π+π− phase shift studies that do not use polarized target datawere based on non-trivial physical assumptions like vanishing of spin-nonflipamplitudes (in our language this corresponds to gi ≡ hi, where i denotes l,m)in the unnnatural spin-parity amplitudes and phase coherence between them = 0 and m = 1 amplitudes. It was shown in [18, 26, 30] that these assump-tions are badly broken by the polarized-target data. Unfortunately, this facthas been ignored in all subsequent ππ studies with the notable exception ofSvec papers [17, 18].
On the other hand, additional knowledge of pLM and rL
M moments yieldsthe total number of observables which, as seen in Table 1, slightly exceeds thenumber of real parameters. Since the present analysis is restricted to low t, wecan ignore all m > 1 amplitudes as all M > 2 moments vanish (for a high–tstudy see [35]).
Terms appearing in amplitude combinations are of the type |gi|2, |hi|2,Re(gig
∗j ) or Re(hih
∗j ) but there is no mixed term like Re(gih
∗j ). Consequently,
we cannot determine the relative phase between the g and h amplitudes ina model-independent way but the transversity amplitudes can be completelydetermined independently within each set. This includes moduli and relativephases with the warning that all the relative phases within each set can bemultiplied by −1.
In the analysis we expect to find some discreet ambiguities that arise frombilinearity of the equations. In order not to lose any solution, great effort wasdevoted to providing many different starting points to the MINUIT program[36]. They were as follows (see [33] for details):i) exact analytical solutions (possible for lmax = 1 only),ii) approximate analytical solution assuming that intensity of the P0 wave ismuch smaller than that of the S and D0–waves (for lmax = 2),iii) approximate analytical solution assuming phase coherence (for lmax = 2and lmax = 3),iv) several sets of random values,v) results of the fit from neighbouring bins.It should be stressed that approximations in ii) and iii) were used for findingthe starting values only; it was always the exact formulae that were fitted. In[26] such fits were done in 40 MeV bins for
580 MeV < mππ < 1780 MeV0.01 GeV2/c2 < |t| < 0.20 GeV2/c2.
Later, similar analysis was performed in finer mass bins (∆ mππ = 20 MeV)in a slightly different kinematical region, i.e.
10
600 MeV < mππ < 1600 MeV0.005 GeV2/c2 < |t| < 0.200 GeV2/c2.
The fits became more difficult and time-consuming as higher partial waveswere included; therefore, the MINOS error analysis (see [36] for details) wasrequired for all parameters for lmax = 1 only. For higher masses, when morewaves were needed, the MINOS errors were calculated for the leading m = 0waves only. The solution was considered to be acceptable only if the MINOSerror analysis was possible; the χ2 values, being generally good, were hardlyhelpful in selecting solutions. Quite often there was only one such solution ina given bin, although many different starting points were used. However, inthe mass region below f0(980) there are two branches of solutions, best seenin the moduli of the S-wave g and h amplitudes around 900 MeV. This reflectsthe old ”up-down” ambiguity.
Intensities Ii = |gi|2+|hi|2 of partial waves obtained in the 20 MeV analysiswere published in [34], in fact they still represent the most accurate measure-ments of the f2(1270) parameters [29]. Moduli and relative phases of transver-sity amplitudes are used in this paper for the first time.
4 Results
a) Determination of the S–wave
In Figs 2–4 we show the experimental results obtained by the CERN–Cracow–Munich collaboration as described in the previous Section. Indepen-dent variables used in their partial wave analysis were: the sum |g|2 + |h|2(Fig. 2a), the ratio |g|/|h| (Fig. 2b), as well as the phase differences ϑL
g − ϑL′
g
and ϑLh − ϑL
′
h (L,L′ = S, P,D, F ) (Figs 3 and 4). In our analysis we haveassumed that phases of the partial waves are described mainly by phases ofthe final state interaction amplitude of the ππ system. It means in particularthat phases of the P , D and F–waves follow phases of ρ(770) , f2(1270) andρ3(1690) decay amplitudes into ππ . Our PWA has been done in three mππ
effective mass regions from 600 MeV to 1600 MeV.
i) 600 MeV – 980 MeV
In this region one can safely assume that only the S and P–waves contributesince the D–wave is weak even at the upper limit of this region. It is only inthis region that fully analytical solutions of the PWA equations are possible
11
[33]. The PWA analysis however, yields two solutions (”up” and ”down”)which are distinctly different in the mππ region from 800 MeV to 980 MeV. Inthe ”up” solution the sum | g |2 + | h |2 exhibits a maximum for mππ ≈ 770MeV, but in the ”down” solution the moduli of | g |2 and | h |2 are roughlyconstant from about 750 MeV to 980 MeV. The shape of the S–wave ”up”modulus was used by Svec to claim the existence of the f0(750) meson [16, 17].
S–wave phases of reaction (2) have been determined from phase differencesbetween S and P–waves. In addition to the ”up–down” ambiguity in themoduli of the g and h transversity amplitudes, there is also a phase ambiguityin each mππ bin. This ambiguity comes from the mathematical structure of thePWA equations from which only cosines of the relative phases of the partialwaves of reaction (2) can be obtained. In our analysis we present two arbitrarychoices of the S–wave phases which form data sets shown in Figs 3 and 4. Inthe first set, called ”steep”, S–wave phases grow faster than P–wave phases.In the other set, called ”flat”, increase in S–wave phases is slower than that forP–waves.Thus two sets of possible phases (”flat” or ”down”) combined withtwo branches of moduli (”up” and ”down”) lead us to consideration of foursolutions for the amplitudes g and h which can be called ”up-steep”,”down-steep”, ”up-flat” and ”down-flat”. Following this splitting of the amplitudesalso the π − π phase shifts which will be derived from them will be similarlylabelled. In order to avoid a possible future confusion let us remark herethat in many papers in past the words ”up” and ”down” served mainly todistinguish the S-wave phase-shifts: the values of the phase shifts ”up” werelarger than the corresponding values of the solution ”down”. However, in themodels in which the a1 exchange has been neglected and the S-wave amplitudewas assumed elastic, the modulus of the ”up” amplitude π−p → π−π+n wassmaller than the modulus of the amplitude ”down” for the effective π−π+ masslarger than about 800 MeV. The reason of this correlation can be understoodif we remember that the phase shifts of the ”down” solution were close to 90
while the phase shifts of the ”up” solution were considerably larger in thateffective mass range and the modulus of the amplitude was proportional to| sin δ |. In our case, however, we do not neglect an important contribution ofthe a1 exchange, so we have more combinations of the possible solutions forthe amplitudes g and h.
ii) 980 MeV – 1460 MeV
Here, the S, P and D–waves have been included in the PWA analysis. Inthis region the f2(1270) production is very strong so the D–wave dominatesand the S–wave phases have been evaluated from phase differences betweenthe S and D–waves. In our model we have assumed that in the 980 MeV –1460 MeV region differences between the P and D–wave are positive since the
12
phase of the ρ(770) meson decay amplitude into two pions is larger than thecorresponding phase of the f2(1270) meson amplitude. This allowed us to fixthe sign of phase difference between the S and D–waves in each energy bin,thus avoiding phase ambiguity present in the first region.
iii) 1460 MeV – 1600 MeV
Here, the S, P , D and F (dominated by the ρ3(1690) meson) waves havebeen included in the PWA analysis. Consequently, the S–wave phases havebeen calculated from phase differences between the S and F–waves. The sign ofeach difference has been fixed by the assumption that phase differences betweenthe P and F–waves as well as between the D and F–waves are positive.
In each of the three regions production amplitudes of the ρ(770) , f2(1270)and ρ3(1690) resonances follow the Breit-Wigner parametrisation of [26, 34],namely
M =√Amππ√q
√2l + 1mRxRΓ
m2R −m2
ππ − imRΓ, l = 1, 2, 3, (47)
where
Γ = ΓR
(
q
qR
)2l+1Dl(qRr)
Dl(qr), (48)
and the Blatt–Weisskopf functions Dl(qr) have the form:
D1(qr) = 1 + (qr)2 for P–wave,
D2(qr) = 9 + 3(qr)2 + (qr)4 for D–wave,
D3(qr) = 225 + 45(qr)2 + 6(qr)4 + (qr)6 for F–wave. (49)
In (47) A is a normalization constant , mR, ΓR and xR are mass, width andinelasticity of the resonance R (R=ρ(770) , f2(1270) or ρ3(1690) ), q is mo-mentum of any pion in the ππ rest system, and qR stands for momentum q formππ = mR. Range parameter r for ρ(770) is equal to 4.8 GeV−1 for the ”up”solution, and 5.3 GeV−1 for the ”down” solution [34]. For the f2(1270) andρ3(1690) resonances r equals 10 GeV−1 and 3 GeV−1 respectively [26].
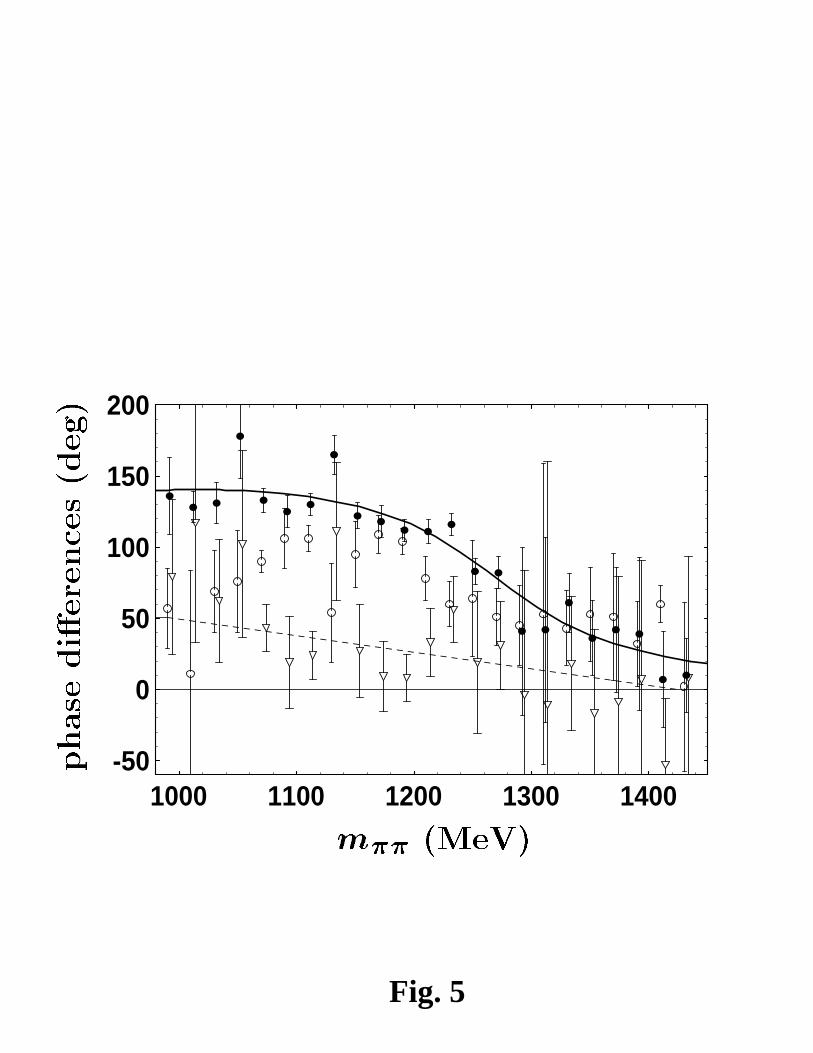
Simultaneous presence of the P and D–waves for mππ > 980 MeV allowedus to check the validity of parametrisation of the P and D–wave phases byresonant amplitudes (47). In Fig. 5 we have shown phase differences betweenthe P and D waves for g and h transversity amplitudes. The P and D–wavesin the h transversity amplitude are well described by the ρ(770) and f2(1270)resonant amplitudes but in the case of the g amplitude such parametrisationis not sufficient.
Since in the PWA analysis there is no phase relation between the g and htransversity amplitudes, we have defined the S–wave phases in the following
13
way:
ϑSg =
ϑSg − ϑP
g + θρ(770) for 600 MeV ≤ mππ ≤ 980 MeV,ϑS
g − ϑDg + θf2(1270) + ∆ for 980 MeV ≤ mππ ≤ 1460 MeV,
ϑSg − ϑF
g + θρ3(1690) for 1460 MeV ≤ mππ ≤ 1600 MeV,(50)
ϑSh =
ϑSh − ϑP
h + θρ(770) + ∆ for 600 MeV ≤ mππ ≤ 980 MeV,ϑS
h − ϑDh + θf2(1270) + ∆ for 980 MeV ≤ mππ ≤ 1460 MeV,
ϑSh − ϑF
h + θρ3(1690) for 1460 MeV ≤ mππ ≤ 1600 MeV(51)
In (50) and (51) θρ(770), θf2(1270) and θρ3(1690) are phases of the resonant ampli-tudes defined in (47). Function ∆ has the form:
∆ =
50.37 for 600 MeV ≤ mππ ≤ 990 MeV,50.37 − 0.116(mππ − 990 MeV) for 990 MeV ≤ mππ ≤ 1420 MeV,
0 for mππ ≥ 1420 MeV.(52)
Function ∆ has been introduced in order to parametrize the differences between(ϑP
h − ϑDh ) and (ϑP
g − ϑDg ). We have determined this function empirically from
a linear fit in the range of 980 MeV ≤ mππ ≤ 1300 MeV.
b) Separation of the S–wave into pseudoscalar- and pseudovector-exchange components
Transversity amplitudes g and h have been averaged over t as it wasdescribed in Sect. 2. Coefficients c1, c2, d1 and d2 depend on averages pU andqV , and therefore they also depend on the form of functions p(t) and q(t). Wehave checked the dependence of amplitudes gα, hα (α = A,B) and A, B onthe value of parameter a (Eq. 27) for 0 ≤ a ≤ 4 GeV−2. For both ”up” and”down” solutions and for both ”flat” and ”steep” sets of the S–wave phasesbelow 1000 MeV, the differences in moduli and phases of amplitudes gA, hA
and gB, hB are not higher than 3% for 600 MeV ≤ mππ ≤ 1600 MeV. In thecase of the A amplitude the differences between different solutions can reach10%. We have evaluated parameter a to be 3.5 GeV−2 from experimental data[30] in the mass range of 710 MeV < mππ < 830 MeV. Since we do not knowits mass dependence outside this region, we have kept it fixed to 3.5 GeV−2 inthe whole mππ range.
We have also checked the dependence of pseudoscalar and pseudovectorexchange amplitudes on the form of function q(t) for the following functions:q(t) = 1, t, ebt and q(t) = tebt, where b = 4 GeV−2. The second and fourthforms come from parametrization of the Regge propagator for the a1 exchange
14
at t ≈ 0 [31]. Differences in moduli and phases of the A, gA, hA, gB and hB
amplitudes caused by different functional forms of q(t) are smaller than 5%.Very small changes of amplitude B (smaller than 0.5%) are due to the strongfactorization of the average qV ≃ qV . Therefore, in the numerical calculationswe have chosen q(t) = 1.
Parameter f introduced in (40) has an influence on amplitudes a0 and aS
defined in Sect. 2. We have evaluated this parameter by minimizing differences1 − η for 600 MeV ≤ mππ ≤ 990 MeV for each solution (”up” and ”down”)combined with the phase set (”flat” and ”steep”) separately.
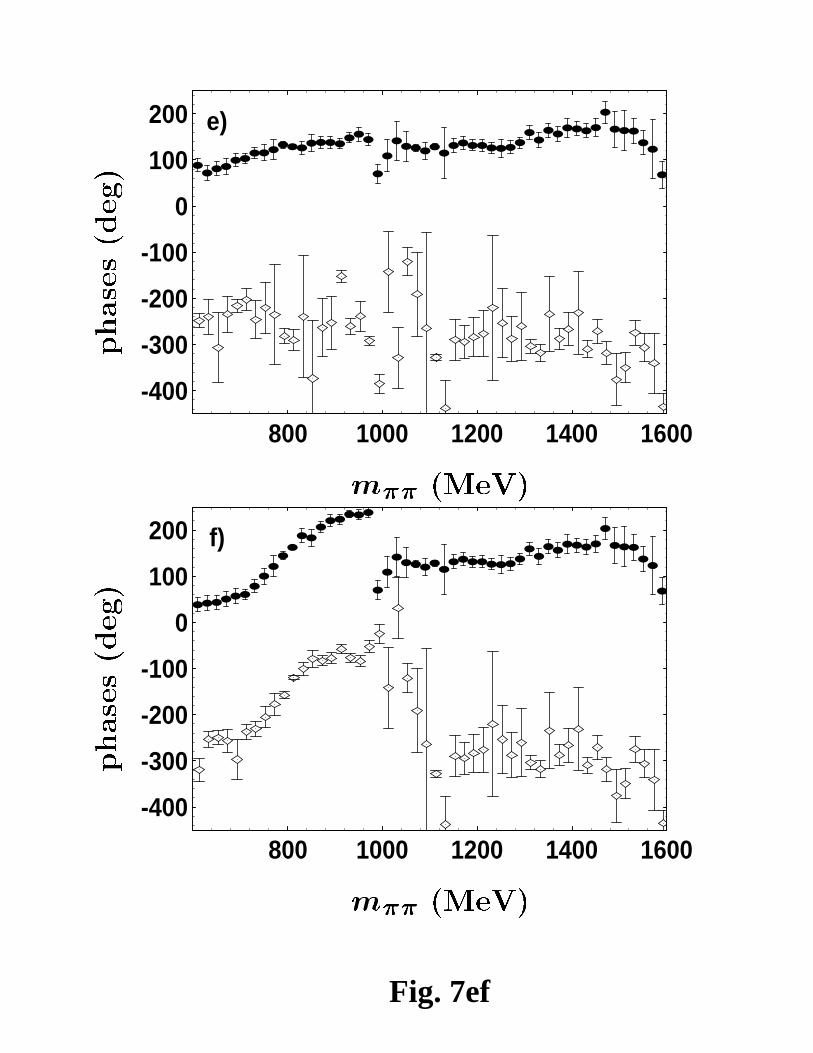
Since the dependence of transversity amplitudes gα and hα (α = A,B)on the shape of functions p(t) and q(t) is weak, we have used them to separatecontributions of one–pion and a1 exchanges. Amplitudes gα and hα depend onmoduli and relative phases of amplitudes g and h . Since for mππ < 980 MeVthere are two solutions for moduli (”up” and ”down”) and two solutions forrelative phases (”flat” and ”steep”), we obtain four combinations of amplitudeswhich will be further labelled ”up–flat” , ”up–steep” , ”down–flat” and ”down–steep” . In Fig. 6 and 7 the moduli and phases of these four amplitudes areshown.
c) Properties of pseudoscalar- and pseudovector-exchange ampli-tudes
Separation of amplitudes leads to the equality of corresponding moduli:| hA |=| gA | and | hB |=| gB | (see Eqs 14 and 15). However, phases of hA
and hB differ from the corresponding phases of gA and gB . Their differences,being functions of the effective mass, are related to the phases of complexcoefficients ci and di (i = 1, 2 in Eqs 28–35). The first phase difference, definedas the phase of hA minus the phase of gA, increases monotonically from about10 to 50 in the effective mass range from 600 MeV to 1600 MeV. The secondphase difference, defined as the phase of hB minus the phase of gB, is almostconstant (≈ −174) in the whole region of the effective mass. This behaviourfollows from the fact that the imaginary part of coefficient U (Eq. 16) ismuch smaller than the real part of U , and the imaginary part of coefficientV dominates over its real part (Eq. 17). Since we assume that functions p(t)and q(t) are real, the phase of amplitude A is the arithmetic average of thegA and hA phases while that of amplitude B is the arithmetic average ofthe gB and hB phases (compare Eqs 14 and 15). Their values differ stronglybetween four sets of solutions. The gA phases systematically increase forthe ππ effective mass between 600 MeV and about 980 MeV. Sudden phasechange and strong reduction of the gA moduli for mππ ≃ 1000 MeV resultsfrom the appearance of the narrow resonance f0(980) . Similarly decrease inthe phases and moduli of amplitudes gA for mππ > 1400 MeV can be related
15
to the presence of another scalar resonance of mass between 1400 MeV and1500 MeV. In most cases, errors of the phases and moduli of gA are smallerthan the corresponding errors for gB .
The a1 exchange amplitude gB amounts on average to about 20% of thepion exchange amplitude but around 1000 MeV and 1500 MeV it is of thesame order as gA . A slight increase in the gB modulus and a decreasein the gA modulus for the effective mass above 1420 MeV (seen in Figs 6a,b and 7 a,b) can be related to the presence of a scalar resonance f0(1500)coupled to channels such as ππ, ηη, ηη′ and 4π (or σσ) [5], [10] – [12]. Onthe basis of the pp→ 5π0 annihilation data, S. Resag from the Crystal BarrelCollaboration [11] suggested a possible coupling of the f0(1500) to π(1300)π,where π(1300) couples in turn to (ππ)Sπ with (ππ)S denoting the ππ pair inthe I = 0, S–state. The possible enhancement of the | gB | amplitude seen inFigs 6 and 7 above 1400 MeV can be, however, attributed to another decaymode of f0(1500) , namely to a system a1π, where a1 → (ππ)Sπ. However, thesmall value of the partial decay width of a1 into (ππ)Sπ, which – accordingto the Particle Data Group [29] – is equal to 0.3% of the total a1 width, isquestionable. This number follows from just one analysis [37] related to thenot well confirmed four–quark model of Jaffe [38]. The data gathered by theACCMOR collaboration [39] for reaction π−p → 3πp indicate a much largera1 coupling to (ππ)Sπ (even several tens in percent of the total a1 width).In reaction π−p → π+π−n a possible subprocess is the a1 exchange followedby interaction π−a1 → (π+π−)S in the isoscalar state. It seems therefore thepseudovector exchange process can also contribute to possible production ofthe f0(1500) scalar resonance in the reaction under consideration.
d) Pseudoscalar I = 0, S–wave amplitudes
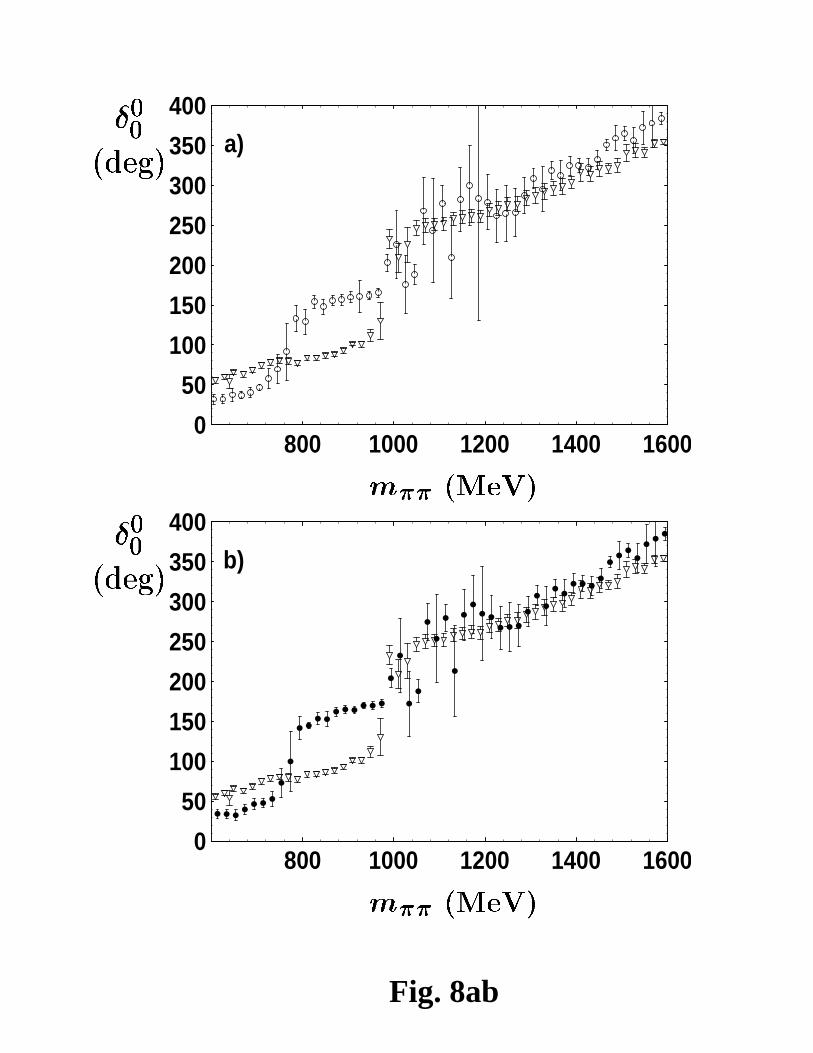
Finally, let us extract the ππ scalar–isoscalar amplitude a0 from pseu-doscalar amplitude gA just separated from pseudovector amplitude gB . We useformulae (37) and (39)–(44) to obtain phase shifts δ and inelasticity coefficientη corresponding to a0. In Fig. 8 we show the dependence of those parameterson the effective mass for solutions labelled ”steep” (corresponding to a fairlysteep behaviour of the phases of amplitudes g and h ). For both solutions(”up–steep” and ”down–steep” ) we observe a characteristic fast increase ofphase shifts near 760 MeV (see Figs 8 a,b). Now all the solutions have to passa test connected with the fitting of the complex coefficient f =| f | eiϕ tothe requirement that the inelasticity coefficient η = 1 in the whole mass rangefrom mππ = 600 MeV to the KK production threshold.
It appears immediately that the the ”down-steep” solution fails this test.Such an attempt leads to unnacceptably high χ2/NDF = 80/17 value ob-tained in the best case for | f |= 0.78 and ϕ = −8.4. In addition, there
16
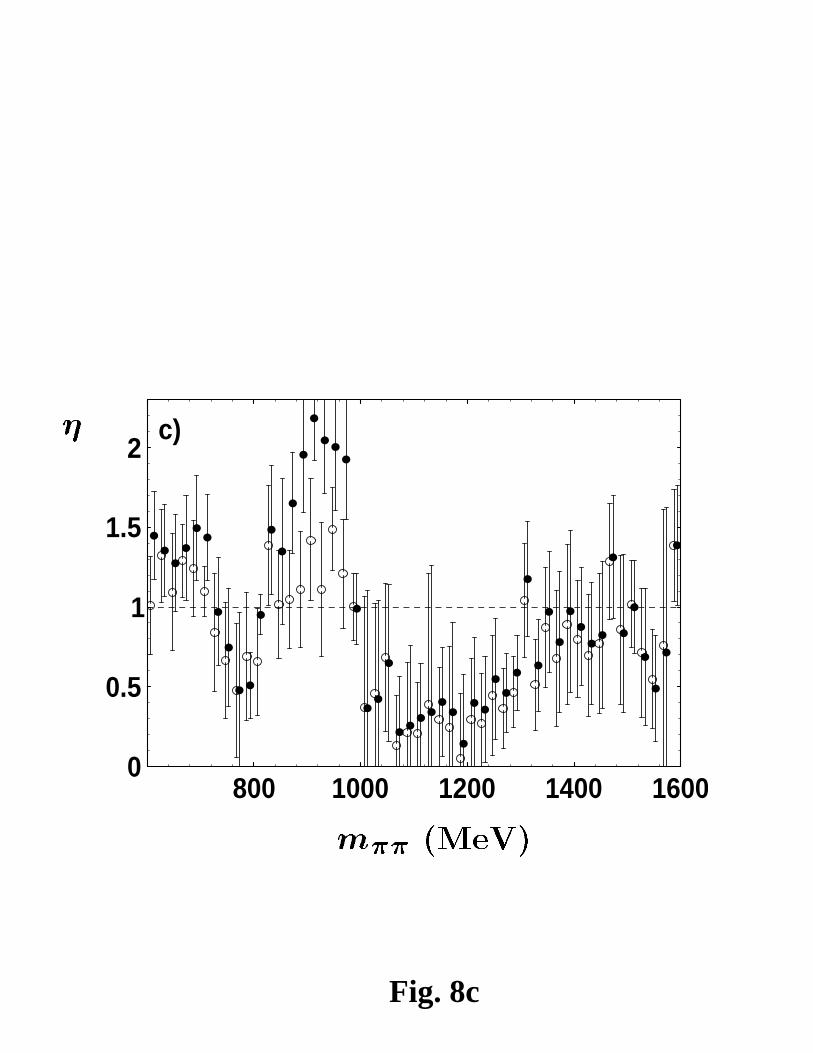
is a strange behavior of η i.e. a clear violation of unitarity constraint belowmππ < 720 MeV and above 820 MeV while η < 1 between these two values(see Fig. 8 c). It should be noted that if we changed normalization to keepη ≤ 1 in the whole mass range in question we would deal with a puzzling largeinelasticity between mππ = 720 MeV and 820 MeV. Therefore, in our opinionthe ”down-steep” solution is nonphysical and should be excluded.
The situation is different for the ”up-steep” solution, for which we can finda constant factor such that η does not deviate from unity (χ2/NDF = 15/17)for | f |= 0.73 and ϕ = −9.2. However, also here we observe a puzzling be-haviour with η systematically exceeding unity for mππ < 720 MeV and abovemππ = 820 MeV but staying below 1 in the intermediate mass range.
On the other hand both ”flat” solutions exhibit natural behavior with ηfluctuating around unity. In addition, minimizing the η − 1 differences be-low the KK production threshold we obtain reasonable values of f close to1, namely | f |= 0.89, ϕ = −4.4 for the solution ”up” and | f |= 0.84,ϕ = −17.8 for the solution ”down”. Thus we are left with two favoured, nicelybehaving, solutions (”up-flat” and ”down-flat”) and one, somewhat queer, butstill acceptable ”up-steep” solution. Let us remark that only the last solution isconsistent with the relatively narrow f0(750) meson 1 claimed by Svec [17, 18]on the basis of moduli of transversity amplitudes determined with the help ofthe polarized-target data.
In all solutions there is a sudden drop in η for the effective mass near 1000MeV, caused by an opening of a new KK channel. Another decrease of η canbe seen above 1500 MeV.
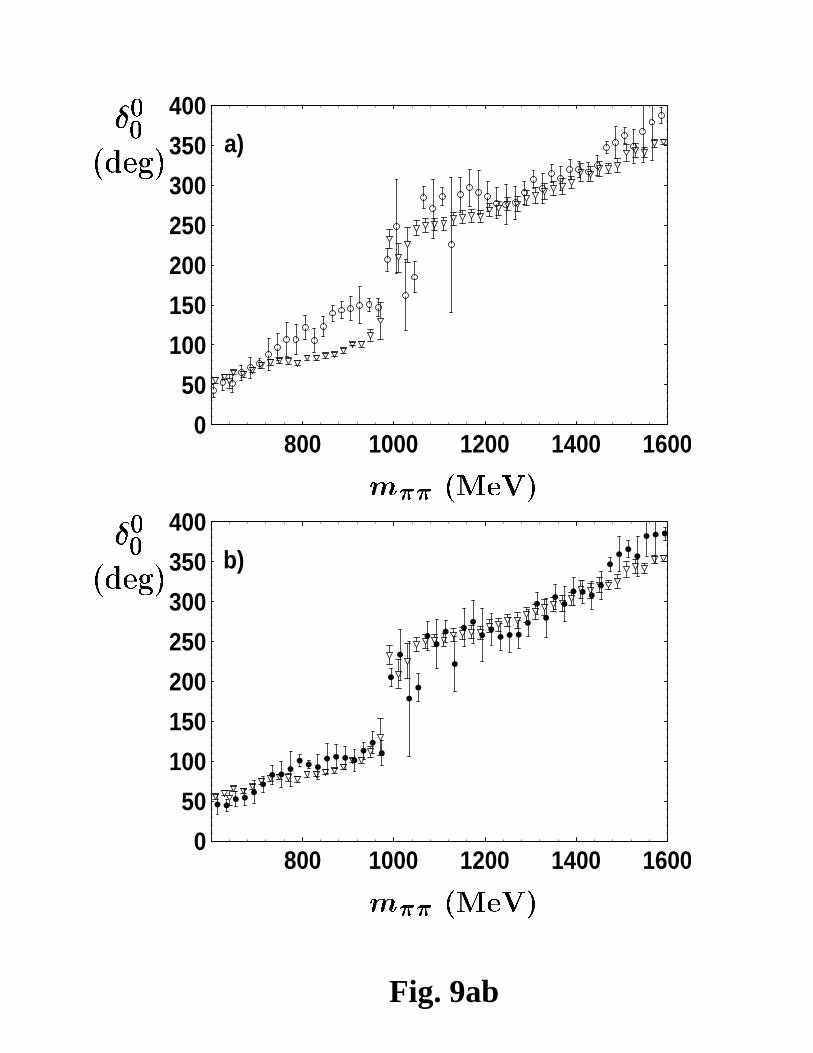
In Figs. 8 a,b and 9 a,b the phase shifts δ for all solutions have been com-pared with those obtained from the analysis of the π−p → π+π−n reactionon an unpolarized target [20] (solution B), where separation of the π-exchangeand a1-exchange amplitudes was impossible. In Fig. 9 b in the mass regionfrom 600 MeV to about 1400 MeV we see only minor differences between phaseshifts corresponding to the ”down-flat” solution and the results of [20]. In the”up-flat” solution around 900 MeV, however, the values of δ are higher thanthose of ref.[20] by several tens of degrees as seen in Fig. 9 a (a qualitativelysimilar difference led many years ago to the ”up-down” nomenclature). The”up-steep” solution (see Fig. 8 a) with a narrow resonance is entirely differentfrom the results of ref.[20]. Let us notice that the characteristic ”jump” of the”up-steep” phase shifts at 980 MeV is smaller (about 100) than those in thethe ”up-flat” (≈ 120) and ”down-flat” (≈ 140) solutions.
Finally let us comment on the behaviour of the phase shifts at highereffective masses, well above the KKthreshold. Here the different solutions
1Following the PDG convention we call this object f0(750) instead of σ(750) used in theoriginal papers.
17

are quite close each other. This follows from our assumption about the phasedifference between the D- and S-waves (formulated in Sect. 4a ii) and rathersmall differences between the phases ϕ of the factor f (eq. 40).
A short comment on the comparison of errors obtained for the phase shiftsin this study and errors obtained in [20] is in order here. Errors in the partialwave analysis [34] have been obtained from the MINOS subroutine of theMINUIT program used to fit data independently in each effective mass bin.Although the errors of the B analysis in [20] are smaller, they do not includesystematic effects corresponding to simplifying assumptions like, for example,dominance of the s-channel nucleon helicity flip amplitude and phase coherenceof unnatural spin-parity exchange amplitudes with helicity 0 and 1. In ouranalysis we avoid these assumptions which have been found to be badly brokenby the polarized target data already in [26],[30],[34].
Finally, let us note that the I = 2, S–wave amplitude a2 plays an importantrole in the determination of amplitude a0 (Eq. 39). In particular, especially athigh effective masses, it influences the inelasticity parameter η very much. Asdescribed above, phases of amplitude a2 have been obtained in the experimenton an unpolarized target [32]. Thus, they contain some unknown errors relatedto the unknown contribution of the a1 exchange. We feel, however, that thoseerrors can be less important than other errors of amplitude aS calculated fromgA (Eqs 40 and 37).
e) Resonance interpretation of results
Let us now discuss behaviour of phase shifts and inelasticity coefficientsin terms of the scalar I=0 resonances, both already known and those newlypostulated (see Figs 8 and 9).
Systematic increase in phase shifts below 1000 MeV can be related to theexistence of a broad σ meson which we have found in [2] and called f0(500).In [2] we analysed data obtained on an unpolarized target. Applying nowthe same model to the ”down–flat” and ”up–flat” solutions obtained for thepolarized target we obtain parameters of the f0(500) meson very similar tothose given in [2]. In this way, presence of f0(500) is reinforced. We shouldmention here that N. A. Tornqvist and M. Roos [19] also support the existenceof the σ meson naming it tentatively f0(400− 900). The σ meson of mass 555MeV has also been reported recently by Ishida et al. ([40]) in an analysis ofthe ππ phase shifts especially near the pion-pion threshold. The thresholdbehaviour of the scalar I=0 scattering amplitudes is very much influenced bythe presence of the f0(500) state (see [41]). The σ meson plays also a veryimportant role in nuclear physics and in the description of nucleon-nucleoninteractions. For example, in [42] typical value of 550 MeV has been used forits mass, which is in agreement with the above findings.
18
Since our ”up-steep” solution (see Sec. 5d) corresponds to the narrowf0(750) claimed by Svec on the basis of (mainly) the same data let us commenton the similarities and differences of two approaches. Svec uses an ”analyticalsolution+Monte Carlo” method to extract amplitudes from experimental mo-ments while our amplitudes come from the standard χ2 minimization method.The advantage of the latter is an applicability to higher mass range wheremore partial waves contribute and analytical solution is not possible. In thevery recent draft[18] he compares both methods for mππ < 900 MeV findingan excellent agreement between two methods. But there is an important dif-ference in the further analysis. Svec finds narrow f0(750) in only one of twotransversity amplitudes and argues against summing the squares of two ampli-tude moduli, which - according to him - distorts or even hides the f0(750). Inour analysis we extract the dominating π-exchange amplitude and weaker butnon-negligible a1-exchange amplitude from connecting both transversity ampli-tudes. Studying the pure π-exchange amplitude we find one, less favoured butstill possible, solution exhibiting the narrow f0(750). A simple Breit-Wignerfit with the energy-independent background yields m = (770 ± 8) MeV andΓ = (120±9) MeV, well consistent with m = (753±19) MeV and Γ = (108±53)MeV in Ref. [18]. This solution, however, cannot be well described by theabove-mentioned model of Ref. [2] without a substantial modification of thepion-pion interaction.
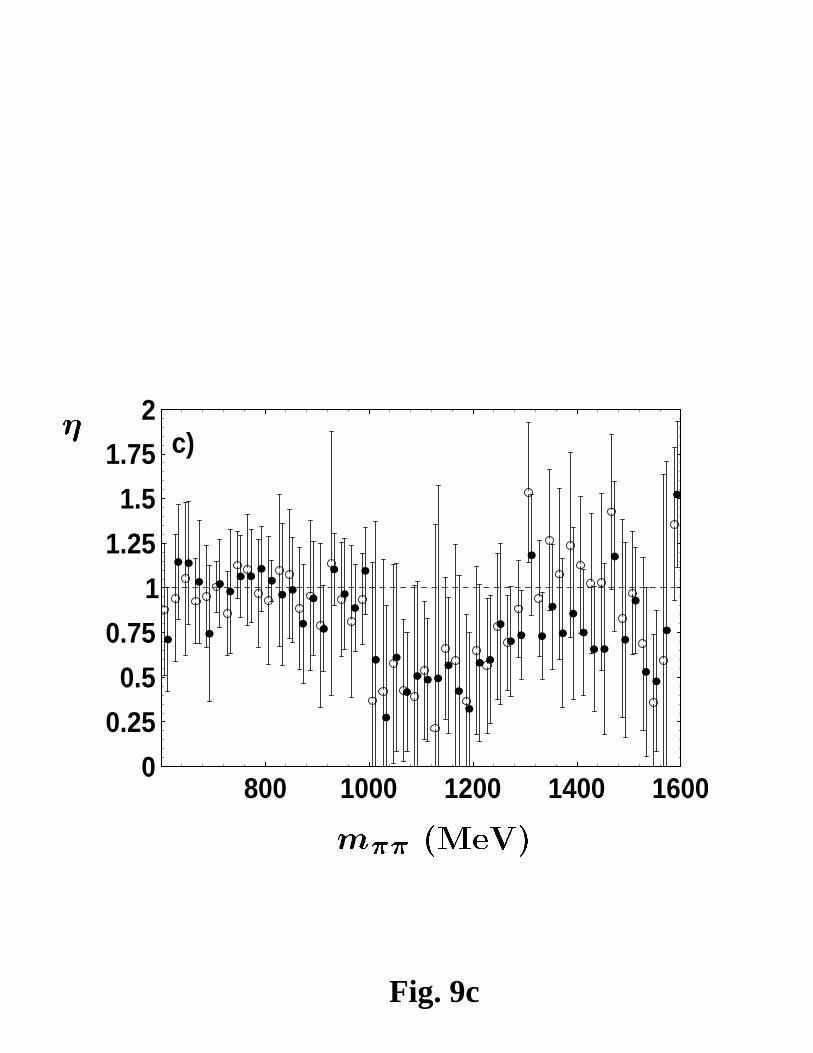
As can be seen in Fig. 9 c, a sudden drop in inelasticity for the effectivemass near 1000 MeV is caused by the opening of a new KK channel. Thisfact, along with a characteristic jump of phase shift δ coupled with a rapiddecrease in elasticity η near 1000 MeV (Fig. 9 a,b), is due to the narrowf0(980) resonance [2, 29]. We stress that this jump, although smaller thanin two ”flat” solutions, is seen also in the “up-steep” solution, since in someolder studies the “up” solution was rejected as inconsistent with the narrowf0(980) . Analysing the polarized target data Svec has shown that an intensityof one S-wave transversity amplitude can be simultaneously parametrized interms of two interfering resonances f0(750) and f0(980) [18].
Another decrease in η near 1500 MeV – 1600 MeV can be related to theopening of further channels like 4π ( σσ or ρρ ), ηη′ or ωω. For mππ largerthan 1470 MeV, phase shifts for both solutions (”up–flat” and ”down–flat” )show a systematically steeper increase than phase shifts corresponding to dataobtained on the unpolarized target. Both facts may be related to the possibleexistence of the f0(1500) resonance [4, 5], [10]–[12].
19
5 Summary
A formalism permitting extraction and separation of the S–wave pseu-doscalar and pseudovector exchange amplitudes in the reaction π−p↑ → π+π−non a transversely polarized target has been presented. A new analysis of theCERN–Cracow–Munich collaboration data obtained with 20 MeV bins at 17.2GeV/c π− beam momentum on the polarized target has been performed inthe ππ energy range from 600 MeV to 1600 MeV. Already at the level ofmoduli this analysis yields two solutions between 600 MeV and 980 MeV (the“up-down” ambiguity).
Due to the lack of information on the relative phases between transversityamplitudes g and h we have assumed that the relative phases of both S–wave transversity amplitudes g and h are generally governed by the phasebehaviour of the dominant resonant P , D and F partial wave amplitudescorresponding to the ρ(770), f2(1270) and ρ3(1690) resonances decaying to theππ pairs and interfering with the S–wave. This leads to an additional twofoldambiguity since the relative phases can be either added or subtracted. Thus wehave ”down-flat”, ”down-steep”, ”up-flat” and ”up-steep” solutions. Howeverthe ”down-steep” solution is shown to violate unitarity and can be ignored.The remaining three solutions are acceptable although the the ”up-steep” oneexhibits a peculiar behavior of inelasticity.
The a1 exchange amplitudes are especially important at 1000 MeV and 1500MeV and cannot be neglected with respect to the π exchange amplitudes. Thisputs in serious doubt all the PWA results which assumed absence of the a1
exchange.Separation of the π–exchange from the a1–exchange allowed us to calculate
the I = 0, S–wave ππ amplitudes in a weakly–model–dependent manner. Inthe low–mass region both ”flat” solutions are consistent with f0(500) whilethe phase behavior of the ”up-steep” one agrees with the narrow f0(750). Upto the energy of about 1420 MeV, phase shifts of our ”down-flat” solutionagree within the errors with the one obtained without the polarized-targetdata. However, above 1420 MeV the phase shifts in all solutions increase withenergy faster than those obtained without the polarized-target data. Thisphase behavior as well as an increase of the a1-exchange amplitude can be dueto the presence of the f0(1500).
Acknowledgements. We thank L. Gorlich, J. Kwiecinski, B. Loiseau, M.Rozanska and J. Turnau for enlightening discussions and communications. Weare also grateful to Dr. Svec for sending us his papers prior to publication andfor calling our attention to the narrow f0(750) meson.
This work has been partially supported by the Polish State Committee for
20
Scientific Research (grants No 2 P03B 231 08, 2 P03B 043 09) and by theMaria Sk lodowska–Curie Fund II (No PAA/NSF–94–158).
References
[1] J. Weinstein and N. Isgur: Phys. Rev. D27 (1983) 588
[2] R. Kaminski, L. Lesniak and J.-P. Maillet: Phys. Rev. D50 (1994) 3145
[3] V. V. Anisovich et al. (Crystal Barrel Coll.): Phys. Lett. B323 (1994)233
[4] C. Amsler: in Proceedings of XXVII International Conference on HighEnergy Physics, Glasgow 1994, eds P. Bussey and I. G. Knowles, Bristol:Institute of Physics Publishing, Ltd 1995 p. 199
[5] C. Amsler and F. E. Close: Phys. Rev. D53 (1996) 295
[6] G. Bali et al.: Phys. Lett. B309 (1994) 29
[7] J. Sexton, A. Vaccarino and D. Weingarten: ”Numerical evidence for theobservation of a scalar glueball”, IBM preprint IBM-HET-95-2; see alsoD. Weingarten, Nucl. Phys. B34 (Proc. Suppl.) (1994) 29
[8] N. A. Tornqvist: ” Summary of Gluonium ’95 and Hadron ’95 confer-ences”, talk given at the International Europhysics Conference on HighEnergy Physics, Brussels, July 27 –August 2, 1995, hep-ph/9510256
[9] M. R. Pennington: report No DPT-95/86, to appear in Proceedings of6th International Conference on High Energy Physics (HADRON ’95),Manchester, England, 10–14 July 1995, hep-ph/9510229
[10] D. V. Bugg et al.: to appear in Proceedings of 6th International Conferenceon High Energy Physics (HADRON ’95), Manchester, England, 10–14July 1995
[11] S. Resag: to appear in Proceedings of 6th International Conference onHigh Energy Physics (HADRON ’95), Manchester, England, 10–14 July1995
[12] C. Amsler et al., (Crystal Barrel Coll.): Phys. Lett. B291 (1992) 347,Phys. Lett. B322 (1994) 431, Phys. Lett. B342 (1995) 433, Phys. Lett.B353 (1995) 571, Phys. Lett. B355 (1995) 425
[13] F. Antinori et al., (WA91 Coll.): Phys. Lett. B353 (1995) 589
21
[14] N. A. Tornqvist: Zeit. Phys. C68 (1995) 647
[15] V. V. Anisovich et al.: Phys. Lett. B364 (1995) 195
[16] M. Svec, A. de Lesquen and L. van Rossum: Phys. Rev. D46 (1992) 949
[17] M. Svec, Phys. Rev. D53, 2343 (1996).
[18] M. Svec, ”Mass and Width of σ(750) Scalar Meson from Measurementsof πN → π−π+N on Polarized Targets”, hep-ph/9607297.
[19] N. A. Tornqvist and M. Roos: Phys. Rev. Lett. 76 (1996) 1575
[20] G. Grayer et al.: Nucl. Phys. B75 (1974) 189
[21] B.R. Martin, D. Morgan and G. Shaw: in Pion-pion interactions in par-ticle physics. London: Academic Press 1976
[22] V. Srinivasan et al.: Phys. Rev. D12 (1975) 681
[23] B. Hyams et al.: Nucl. Phys. B100 (1975) 205
[24] P. Estabrooks and A. D. Martin: Nucl. Phys. B79 (1974) 301
[25] W. Ochs: Nuovo Cim. 12A (1972) 724
[26] H. Becker et al.: Nucl. Phys. B151 (1979) 46
[27] M. R. Pennington and S. D. Protopopescu: Phys. Rev. D7 (1973) 2591
[28] D. Morgan: Nuovo Cim. 107A (1994) 1883
[29] Particle Data Group: Phys. Rev. D54 (1996) 1
[30] H. Becker et al.: Nucl. Phys. B150 (1979) 301
[31] A. C. Irving and R. P. Worden: Phys. Rep. 34 C (1977) 118
[32] W. Hoogland et al.: Nucl. Phys. B69 (1974) 266, Nucl. Phys. B126 (1977)109
[33] G. Lutz and K. Rybicki: ”Nucleon polarization in the reaction π−p↑ →π+π−n”, MPI report MPI-PAE/Exp.El.75, October 1978
[34] V. Chabaud et al.: Nucl. Phys. B223 (1983) 1
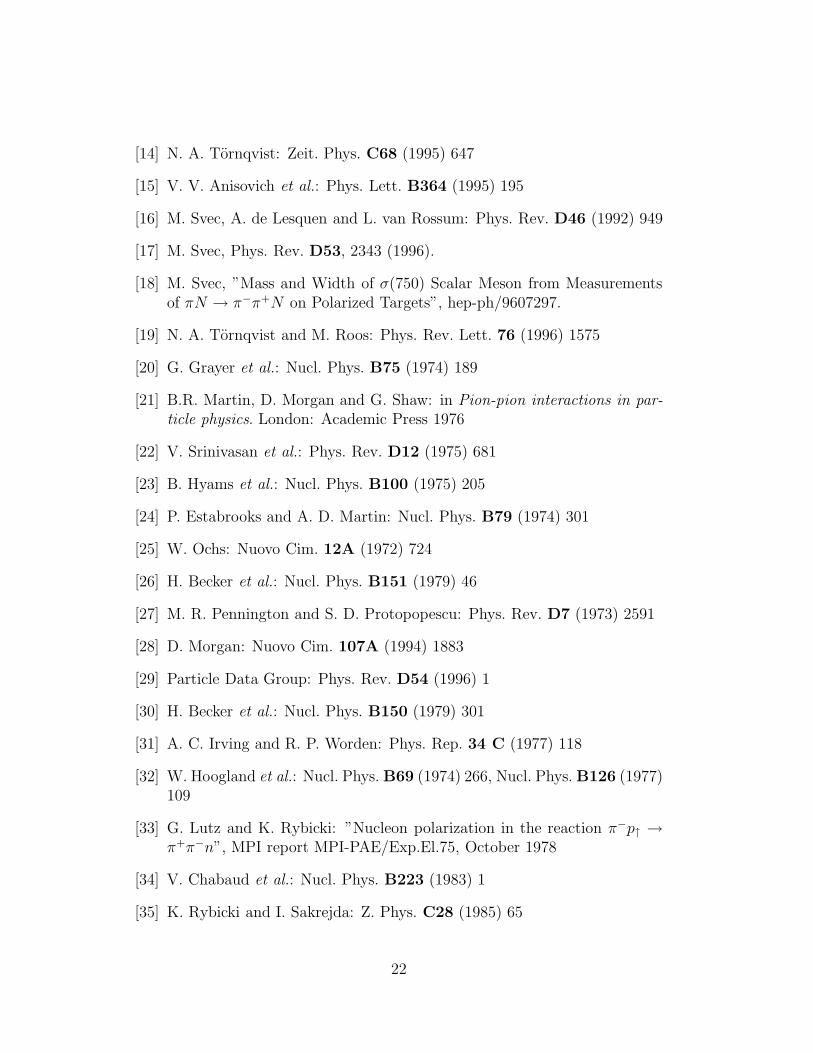
[35] K. Rybicki and I. Sakrejda: Z. Phys. C28 (1985) 65
22
[36] F. James and M. Roos: Computer Physics Communications 10 (1975)343
[37] R. S. Longacre: Phys. ReV. D26 (1982) 82
[38] R. L. Jaffe: Phys. Rev. D15 (1977) 267
[39] C. Daum et al., (ACCMOR Collaboration): Nucl. Phys. B182 (1981) 269
[40] S. Ishida et al.: ”An Analysis of ππ-scattering Phase Shift and Existenceof σ (555) Particle”, KEK Preprint 95-183, NUP-A-95-13, Dec. 1995
[41] R. Kaminski and L. Lesniak: Phys. Rev. C51 (1995) 2264 and H. Niewod-niczanski Institute of Nuclear Physics report No 1675/PH, ”Low energyparameters of the KK and ππ scalar-isoscalar interactions”, June 1994
[42] R. Machleidt, K. Holinde and Ch. Elster: Phys. Rep. 149 (1987) 1
23

FIGURE CAPTIONS
• Fig. 1. The I = 2, S–wave ππ phase shifts versus the effective ππ mass.The curve represents the fit to the data [32].
• Fig. 2. Results of the partial wave analysis of the CERN–Cracow–Munichcollaboration: a) | g |2 + | h |2, b) ratio | g | / | h |. Below 980 MeV, fulland open circles represent the ”down” and ”up” solution, respectively.
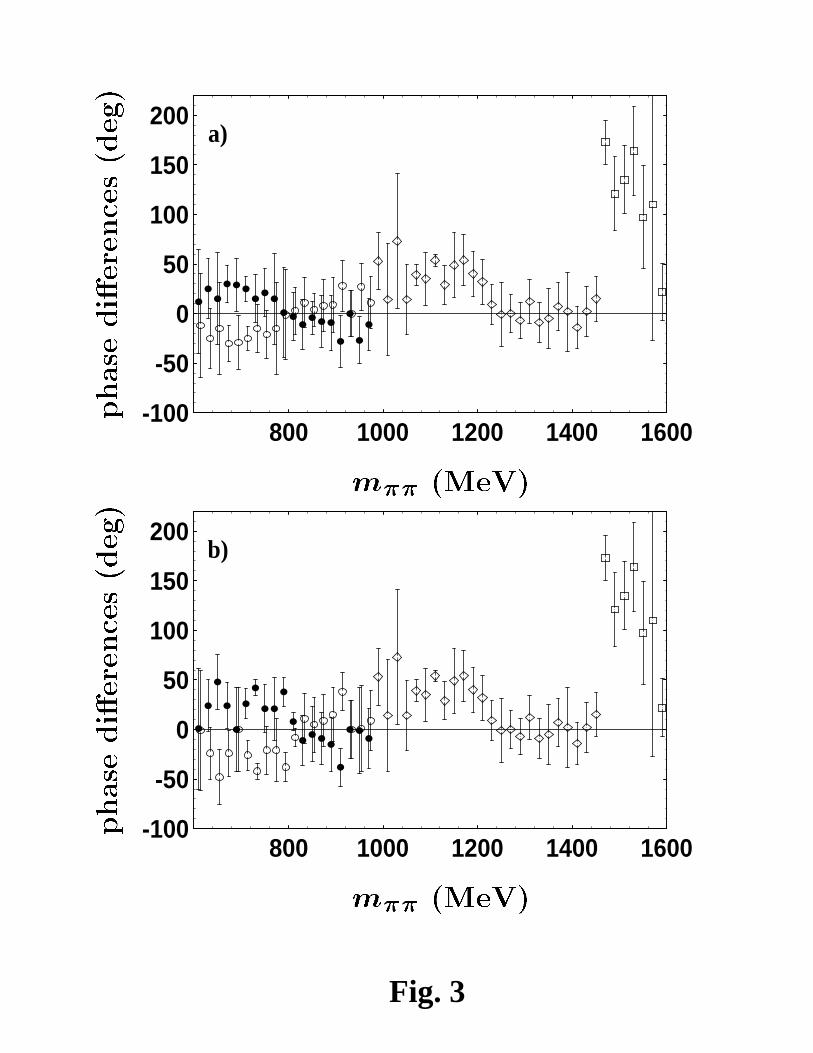
• Fig. 3. Phase differences of the g transversity amplitudes obtained inthe partial wave analysis of the CERN–Cracow–Munich collaboration:a) Solution ”up”: phase differences ϑS
g −ϑPg between the S and P–waves
for the ”flat” set (full circles) and the ”steep” set (open circles), phasedifferences ϑS
g − ϑDg between the S and D–waves (diamonds) and phase
differences ϑSg − ϑF
g between the S and F–waves (squares). b) Solution”down”: notation as in a).
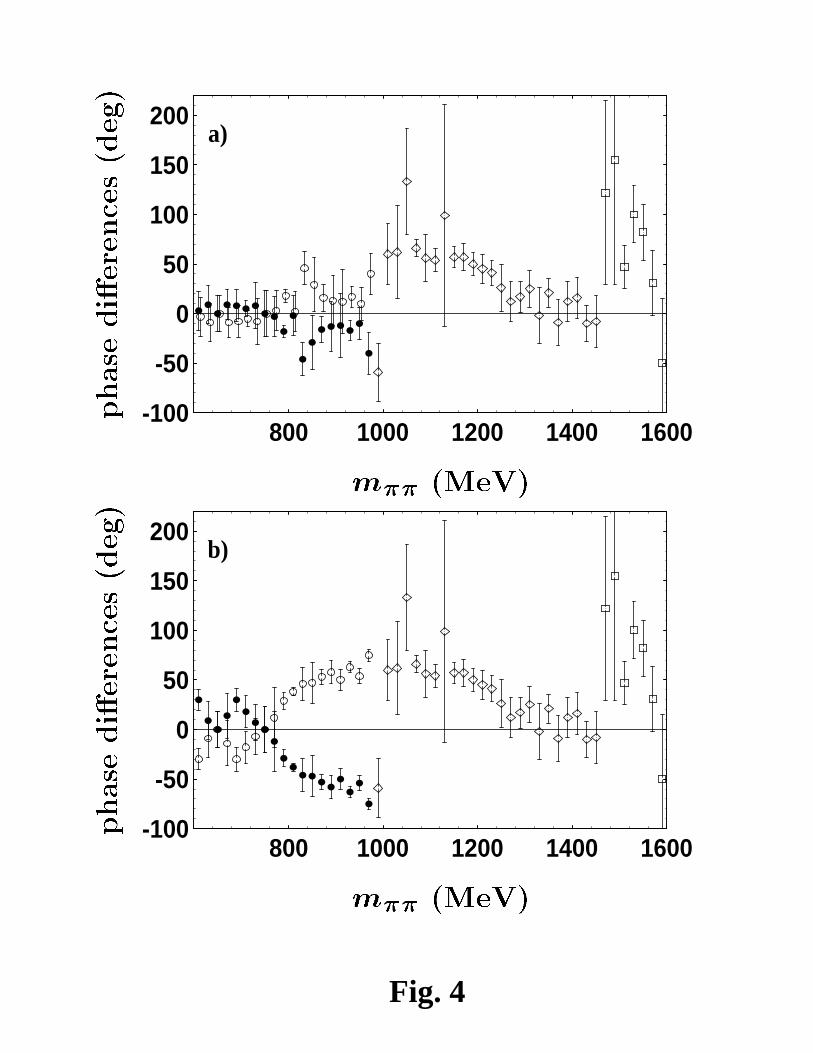
• Fig. 4. Phase differences of the h transversity amplitudes obtained inthe partial wave analysis of the CERN–Cracow–Munich collaboration.Notation as in Fig. 3. a) Solution ”up”. b) Solution ”down”.
• Fig. 5. Phase differences between the P and D–waves for the g (ϑPg −
ϑDg : open circles) and h (ϑP
h − ϑDh : full circles) transversity amplitudes
versus the effective ππ mass. Dashed line represents the effective ππmass dependence of function ∆ obtained from a fit to differences (ϑP
h −ϑD
h ) − (ϑPg − ϑD
g ) denoted by triangles. Solid line represents differencesbetween phases of the ρ(770) and f2(1270) decay amplitudes.
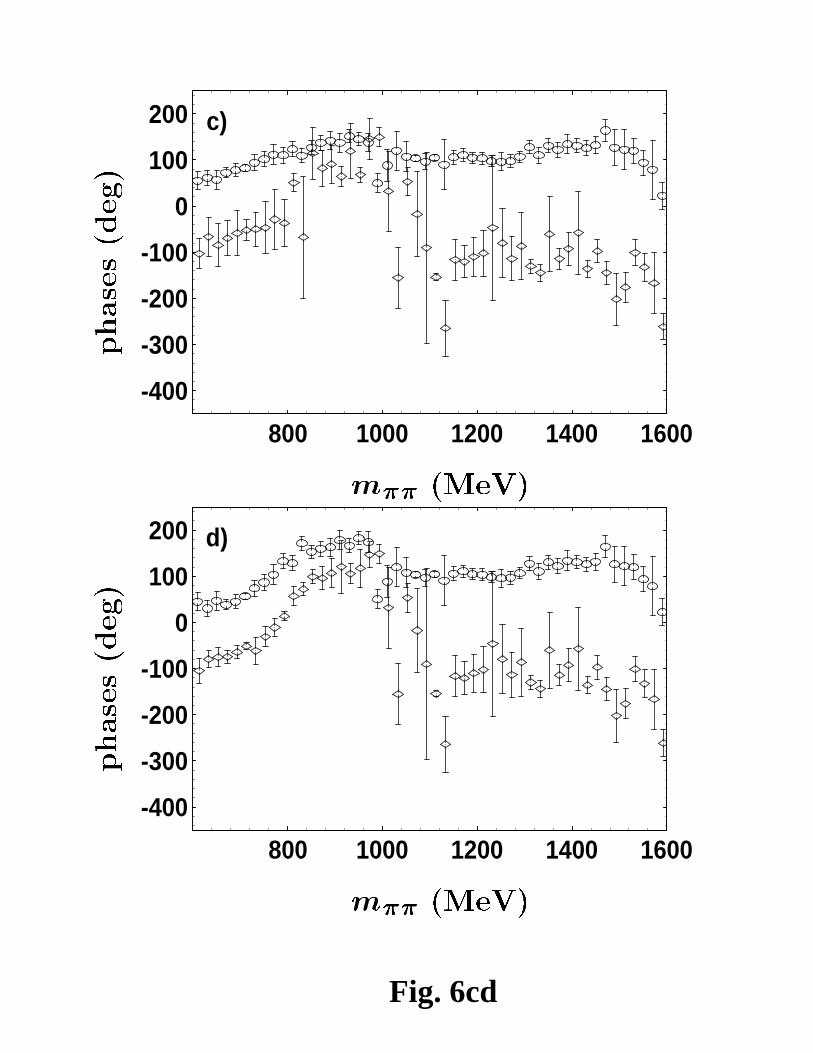
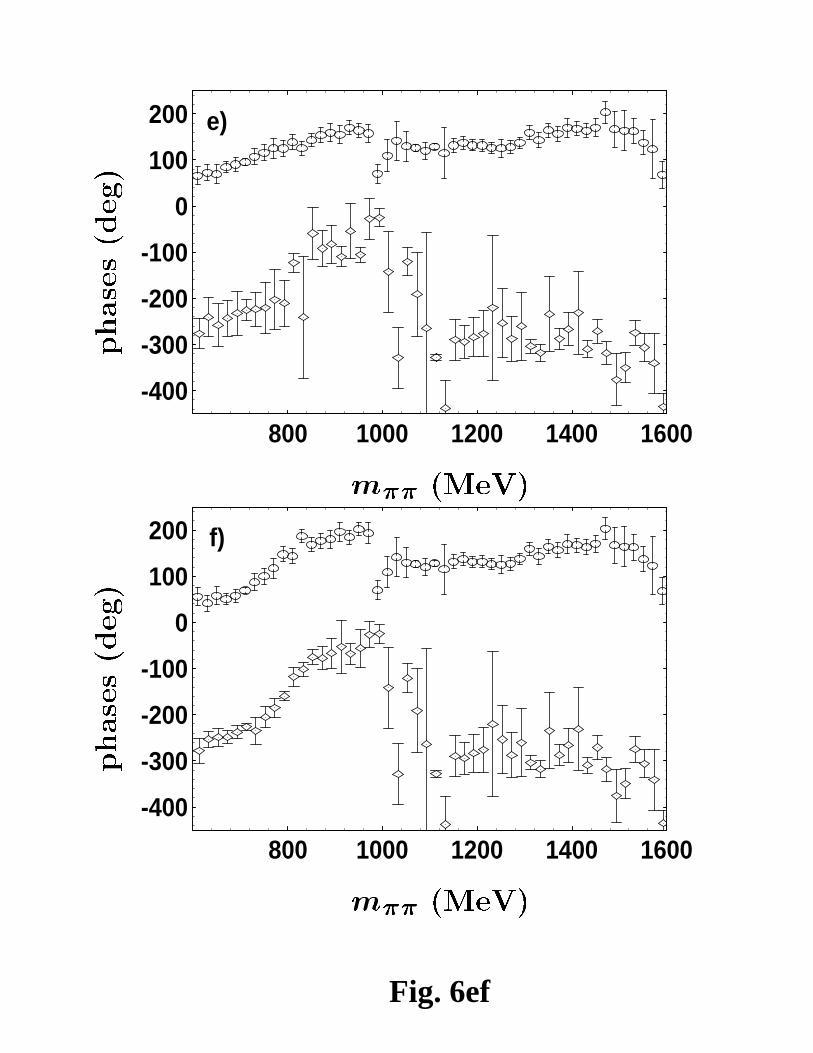
• Fig. 6. a) Moduli of pseudoscalar | gA |=| hA | (open circles) and pseu-dovector | gB |=| hB | (diamonds) exchange amplitudes as a function ofthe effective ππ mass for the ”up–flat” solution. b) Same as in a) forthe ”up–steep” solution. c) Phases of pseudoscalar exchange amplitudesgA (open circles) and pseudovector amplitudes gB (diamonds) versus theeffective ππ mass for the ”up–flat” solution. d) Same as in c) for the”up–steep” solution. e) The phases of the pseudoscalar exchange ampli-tudes hA (open circles) and the pseudovector amplitudes hB (diamonds)versus the effective ππ mass for the ”up–flat” solution. f) Same as in e)for the ”up–steep” solution.
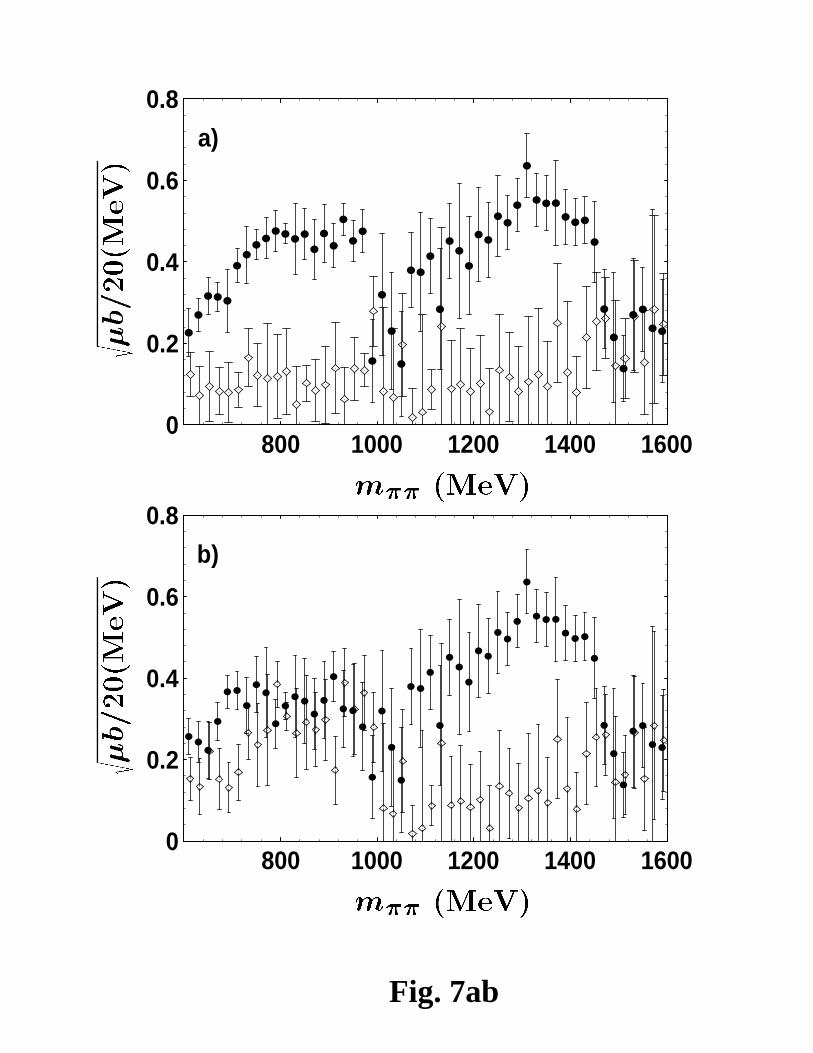
• Fig. 7. a) Moduli of pseudoscalar | gA |=| hA | (full circles) and pseu-dovector | gB |=| hB | (diamonds) exchange amplitudes as a functionof the effective ππ mass for the ”down–flat” solution. b) Same as in
24
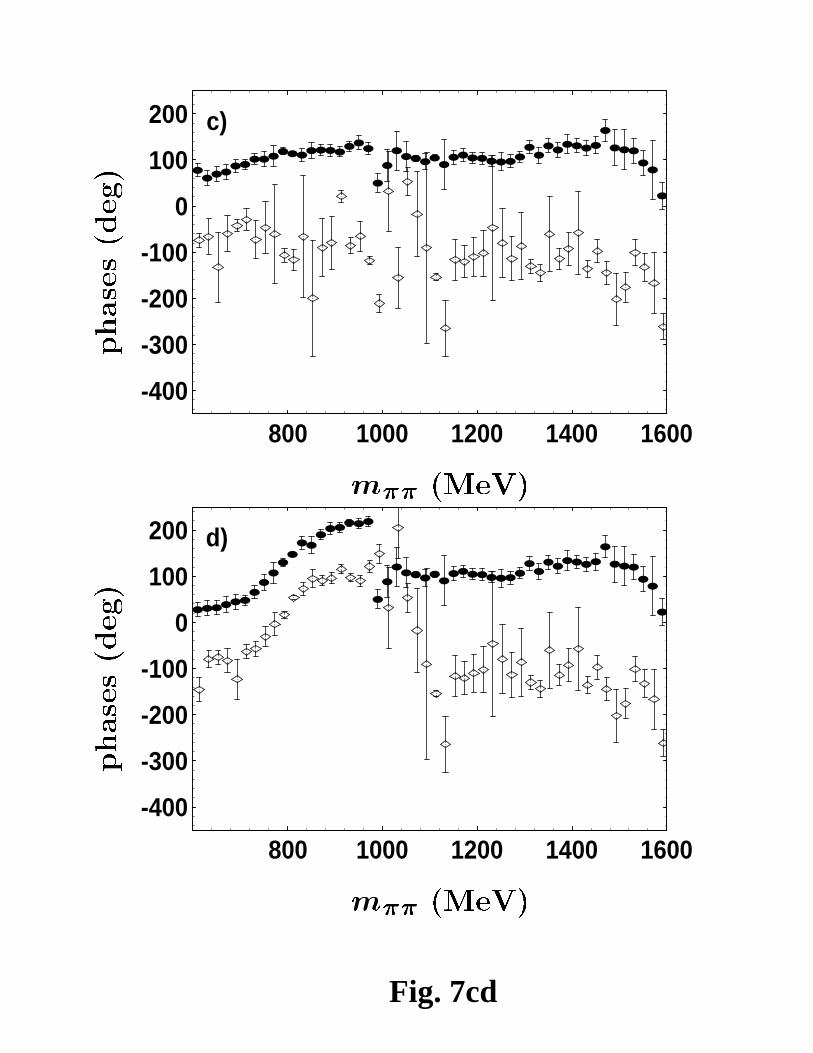
a) for the ”down–steep” solution. c) Phases of pseudoscalar exchangeamplitudes gA (full circles) and pseudovector amplitudes gB (diamonds)versus the effective ππ mass for the ”down–flat” solution. d) Same asin c) for the ”down–steep” solution. e) Phases of pseudoscalar exchangeamplitudes hA (full circles) and pseudovector amplitudes hB (diamonds)versus the effective ππ mass for the ”down–flat” solution. f) Same as ine) for the ”down–steep” solution.
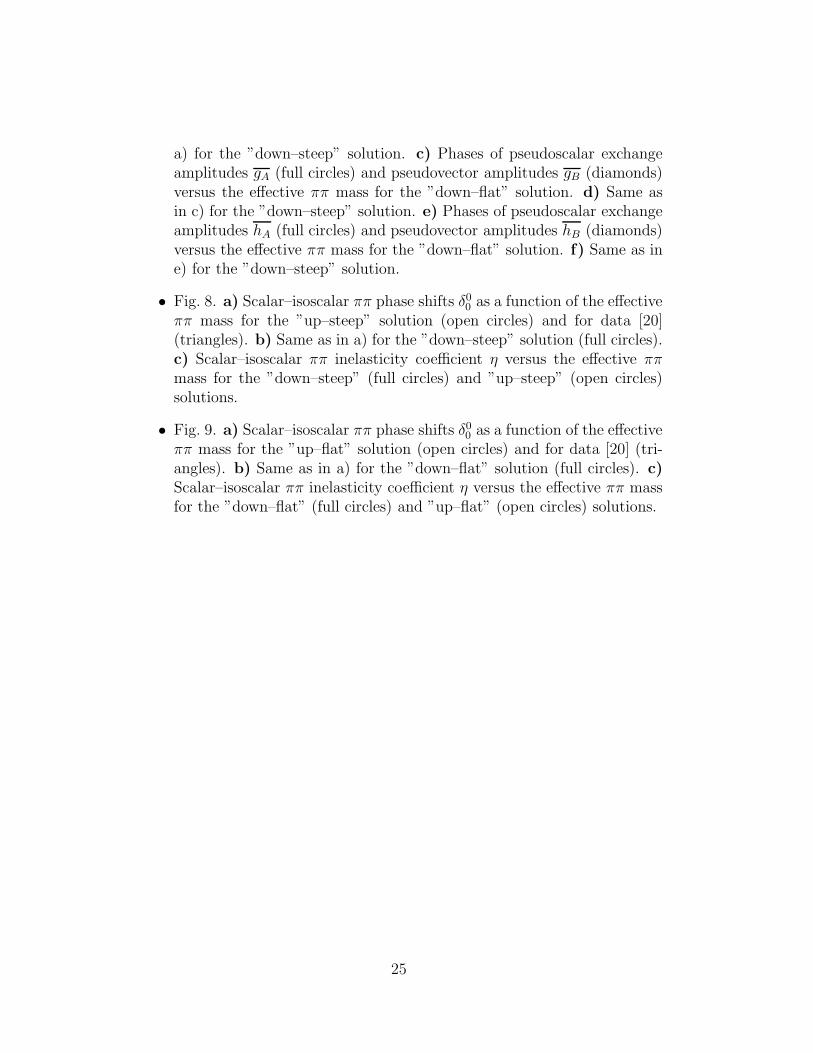
• Fig. 8. a) Scalar–isoscalar ππ phase shifts δ00 as a function of the effective
ππ mass for the ”up–steep” solution (open circles) and for data [20](triangles). b) Same as in a) for the ”down–steep” solution (full circles).c) Scalar–isoscalar ππ inelasticity coefficient η versus the effective ππmass for the ”down–steep” (full circles) and ”up–steep” (open circles)solutions.
• Fig. 9. a) Scalar–isoscalar ππ phase shifts δ00 as a function of the effective
ππ mass for the ”up–flat” solution (open circles) and for data [20] (tri-angles). b) Same as in a) for the ”down–flat” solution (full circles). c)Scalar–isoscalar ππ inelasticity coefficient η versus the effective ππ massfor the ”down–flat” (full circles) and ”up–flat” (open circles) solutions.
25
20(deg)m (MeV)400 600 800 1000 1200 1400 1600
-40
-30
-20
-10
0
Fig. 1
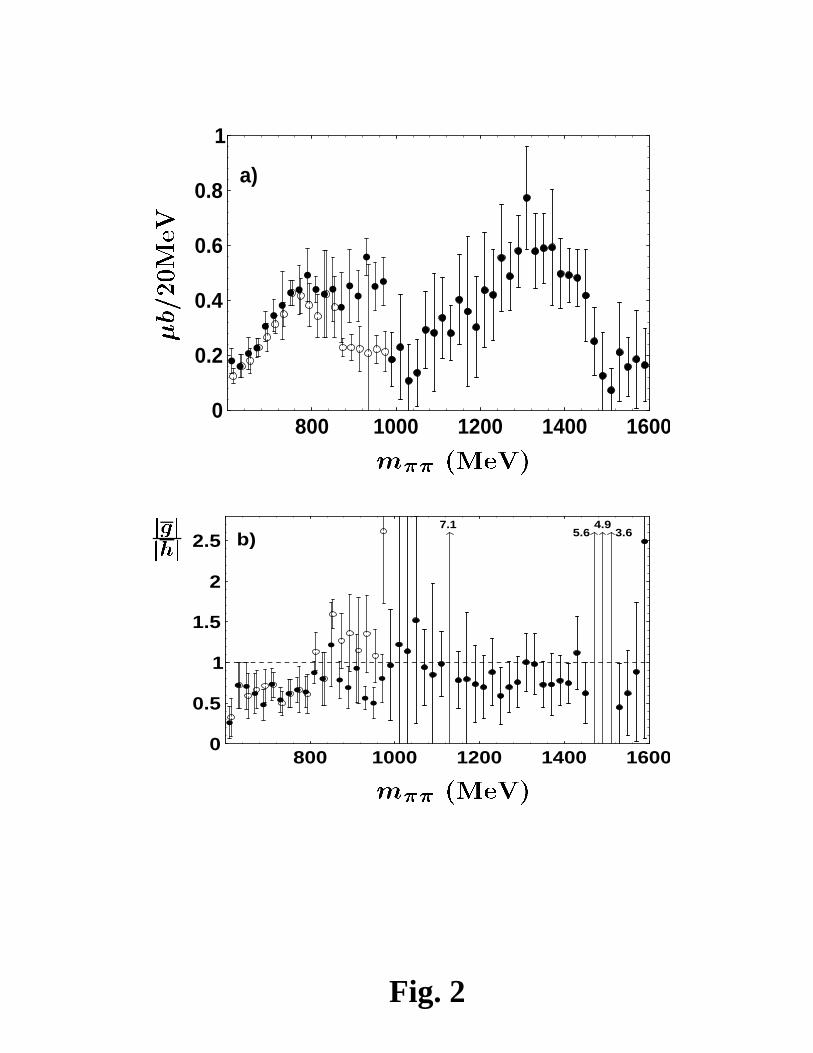
Figure 1: Wyniki analizy fal czastkowych wykonanych przez grupe CERNKrakowMonachium na podstawie danych z reakcji p" ! +n na spolary-zowanej tarczy dla modu low amplitud g i h . a) Suma kwadratow modu lowamplitud poprzecznosci g i h w fali S (j S j2=j g j2 + j h j2) b) Stosunekmodu low amplitud poprzecznosci g i h w fali S (j g j = j h j) Puste ko lkaprzedstawiaja rozwiazanie "up", natomiast pe lne rozwiazanie "down".b=20MeV m (MeV)800 1000 1200 1400 16000
0.2
0.4
0.6
0.8
1
a)
jgjjhjm (MeV)800 1000 1200 1400 1600
0
0.5
1
1.5
2
2.57.1
5.64.9
3.6b)
Fig. 2
phasedierences(deg)
m (MeV)800 1000 1200 1400 1600-100
-50
0
50
100
150
200a)
phasedierences(deg)
m (MeV)800 1000 1200 1400 1600-100
-50
0
50
100
150
200b)
Fig. 3
phasedierences(deg)
m (MeV)800 1000 1200 1400 1600-100
-50
0
50
100
150
200a)
phasedierences(deg)
m (MeV)800 1000 1200 1400 1600-100
-50
0
50
100
150
200b)
Fig. 4
1
phasedierences(deg)
m (MeV)1000 1100 1200 1300 1400-50
0
50
100
150
200
Fig. 5

s b=20(MeV) m (MeV)800 1000 1200 1400 16000
0.2
0.4
0.6
0.8
a)
s b=20(MeV) m (MeV)800 1000 1200 1400 16000
0.2
0.4
0.6
0.8
b)
Fig. 6ab
phases(deg)
m (MeV)800 1000 1200 1400 1600
-400
-300
-200
-100
0
100
200 c)
phases(deg)
m (MeV)800 1000 1200 1400 1600
-400
-300
-200
-100
0
100
200 d)
Fig. 6cd
phases(deg)
m (MeV)800 1000 1200 1400 1600
-400
-300
-200
-100
0
100
200 e)
phases(deg)
m (MeV)800 1000 1200 1400 1600
-400
-300
-200
-100
0
100
200 f)
Fig. 6ef
s b=20(MeV) m (MeV)800 1000 1200 1400 16000
0.2
0.4
0.6
0.8
a)
s b=20(MeV) m (MeV)800 1000 1200 1400 16000
0.2
0.4
0.6
0.8
b)
Fig. 7ab
phases(deg)
m (MeV)800 1000 1200 1400 1600
-400
-300
-200
-100
0
100
200 c)
phases(deg)
m (MeV)800 1000 1200 1400 1600
-400
-300
-200
-100
0
100
200 d)
Fig. 7cd
phases(deg)
m (MeV)800 1000 1200 1400 1600
-400
-300
-200
-100
0
100
200 e)
phases(deg)
m (MeV)800 1000 1200 1400 1600
-400
-300
-200
-100
0
100
200 f)
Fig. 7ef
00(deg)00()m (MeV)800 1000 1200 1400 1600
0
50
100
150
200
250
300
350
400
a)
00(deg)00()m (MeV)800 1000 1200 1400 1600
0
50
100
150
200
250
300
350
400
b)
Fig. 8ab
m (MeV)800 1000 1200 1400 1600
0
0.5
1
1.5
2c)
Fig. 8c
00(deg)00()m (MeV)800 1000 1200 1400 1600
0
50
100
150
200
250
300
350
400
a)
00(deg)00()m (MeV)800 1000 1200 1400 1600
0
50
100
150
200
250
300
350
400
b)
Fig. 9ab
m (MeV)800 1000 1200 1400 1600
0
0.25
0.5
0.75
1
1.25
1.5
1.75
2c)
Fig. 9c