SEISMIC HAZARD - NTUAlee.civil.ntua.gr/pdf/mathimata/eidika_themata... · A seismic hazard analysis...
20
SEISMIC HAZARD
Transcript of SEISMIC HAZARD - NTUAlee.civil.ntua.gr/pdf/mathimata/eidika_themata... · A seismic hazard analysis...
SEISMIC HAZARD
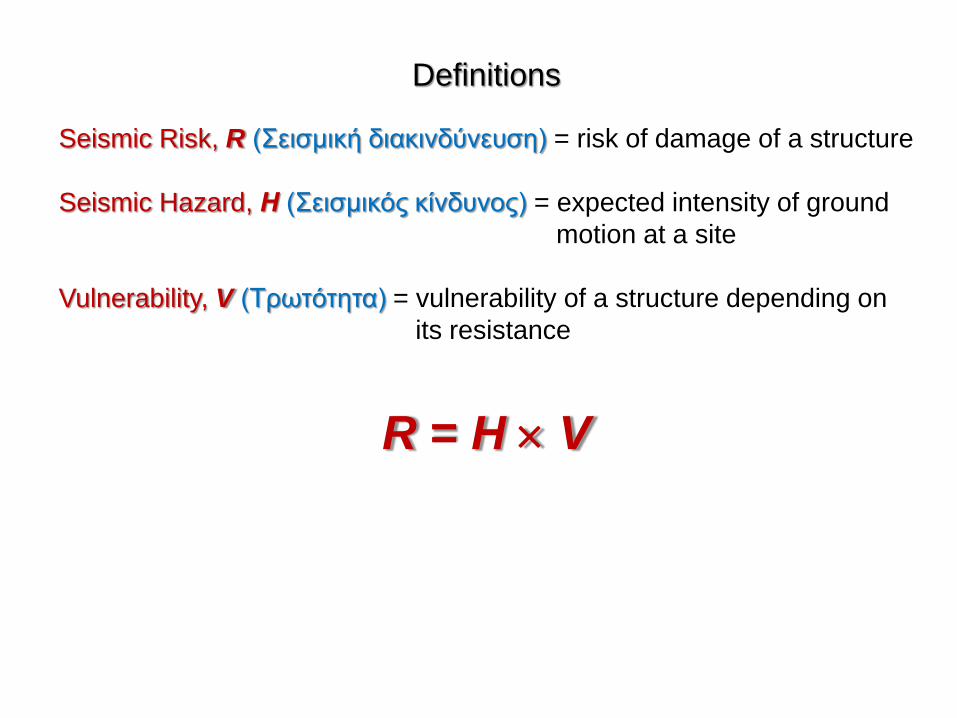
Definitions
Seismic Risk, R (Σεισμική διακινδύνευση) = risk of damage of a structure
Seismic Hazard, Η (Σεισμικός κίνδυνος) = expected intensity of ground
motion at a site
Vulnerability, V (Τρωτότητα) = vulnerability of a structure depending on
its resistance
R = H V
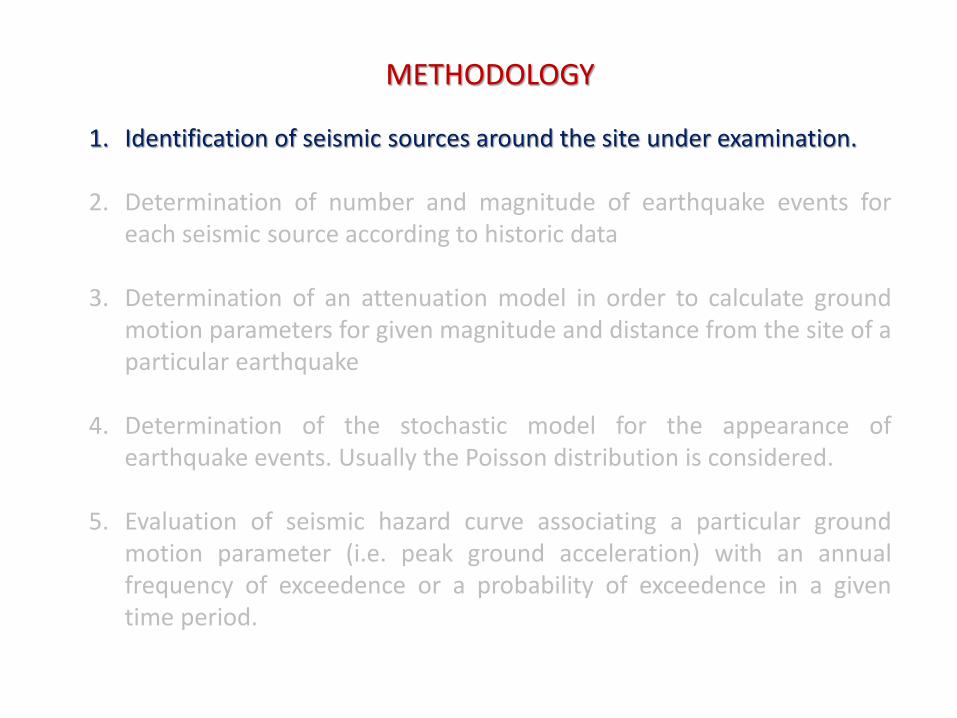
METHODOLOGY
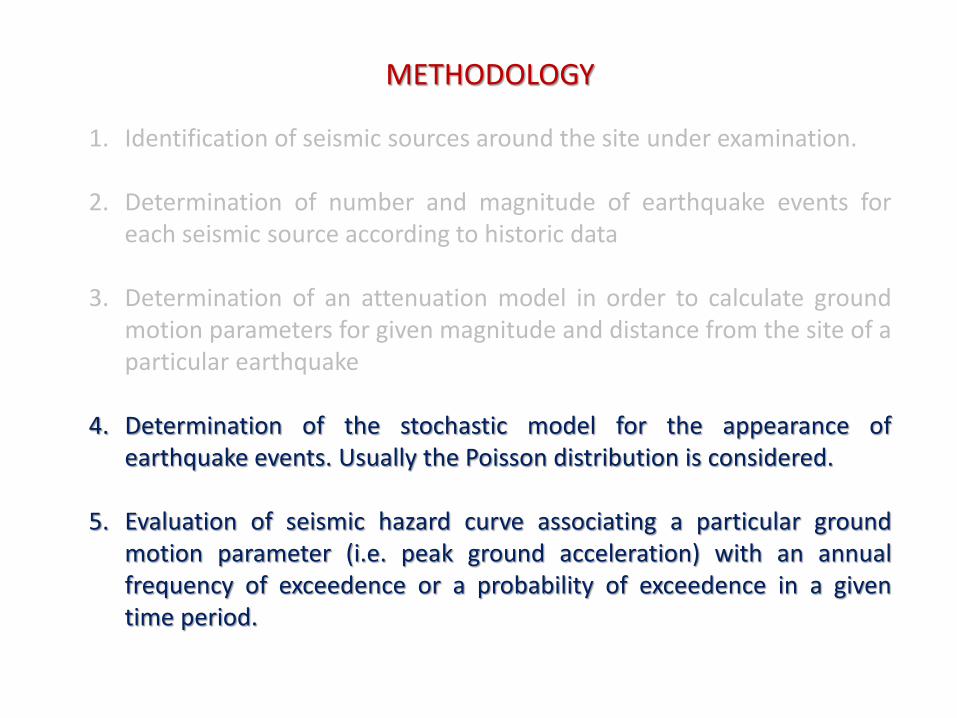
1. Identification of seismic sources around the site under examination.
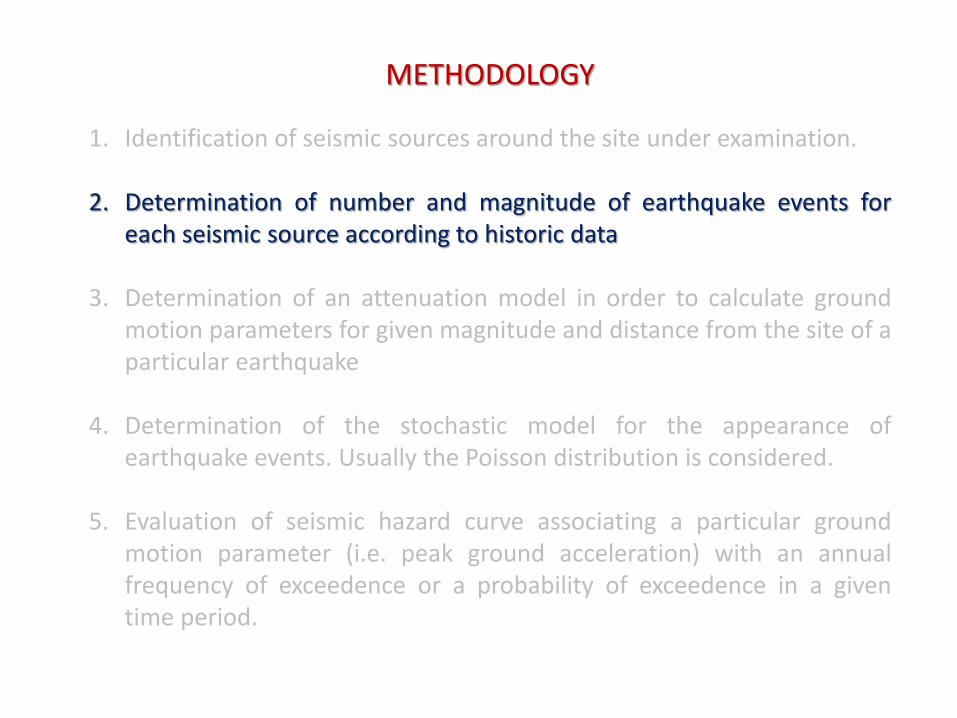
2. Determination of number and magnitude of earthquake events for each seismic source according to historic data
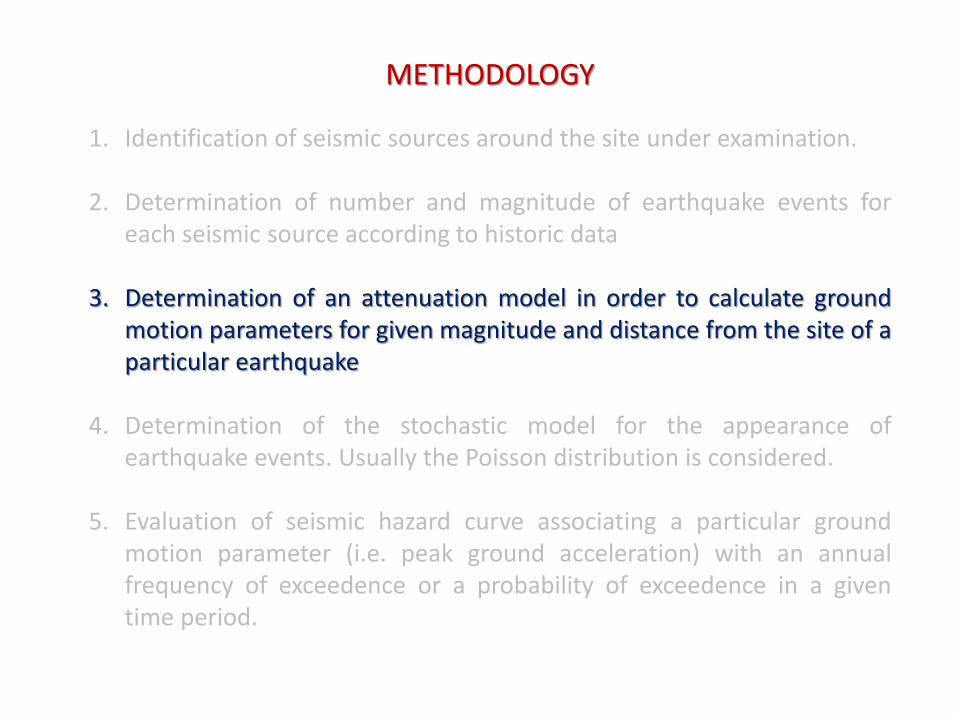
3. Determination of an attenuation model in order to calculate ground motion parameters for given magnitude and distance from the site of a particular earthquake
4. Determination of the stochastic model for the appearance of earthquake events. Usually the Poisson distribution is considered.
5. Evaluation of seismic hazard curve associating a particular ground motion parameter (i.e. peak ground acceleration) with an annual frequency of exceedence or a probability of exceedence in a given time period.
METHODOLOGY
1. Identification of seismic sources around the site under examination.
2. Determination of number and magnitude of earthquake events for each seismic source according to historic data
3. Determination of an attenuation model in order to calculate ground motion parameters for given magnitude and distance from the site of a particular earthquake
4. Determination of the stochastic model for the appearance of earthquake events. Usually the Poisson distribution is considered.
5. Evaluation of seismic hazard curve associating a particular ground motion parameter (i.e. peak ground acceleration) with an annual frequency of exceedence or a probability of exceedence in a given time period.
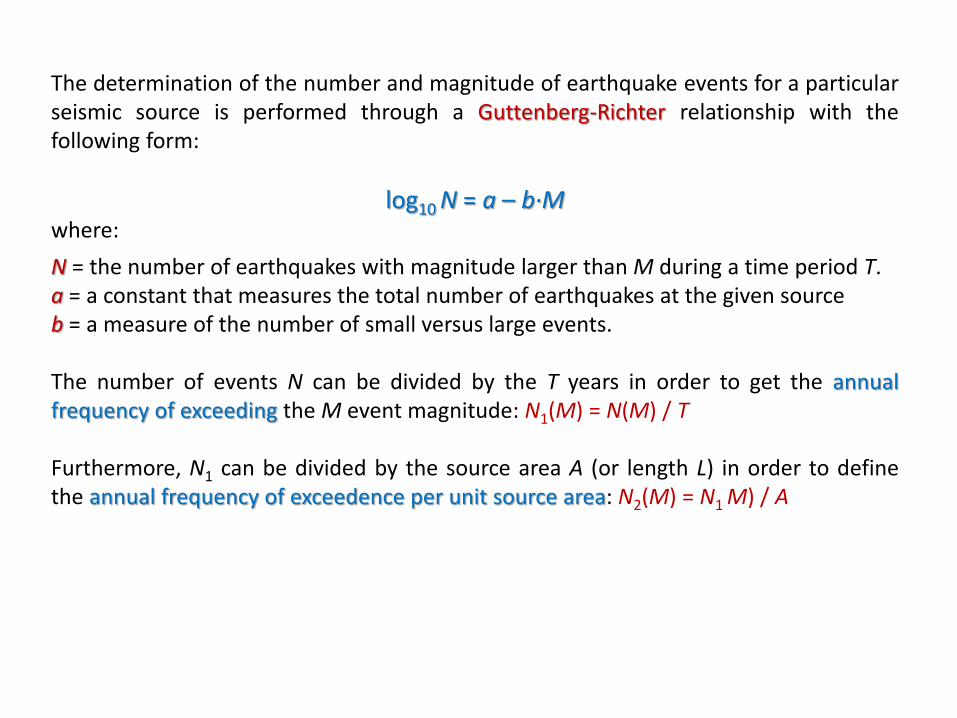
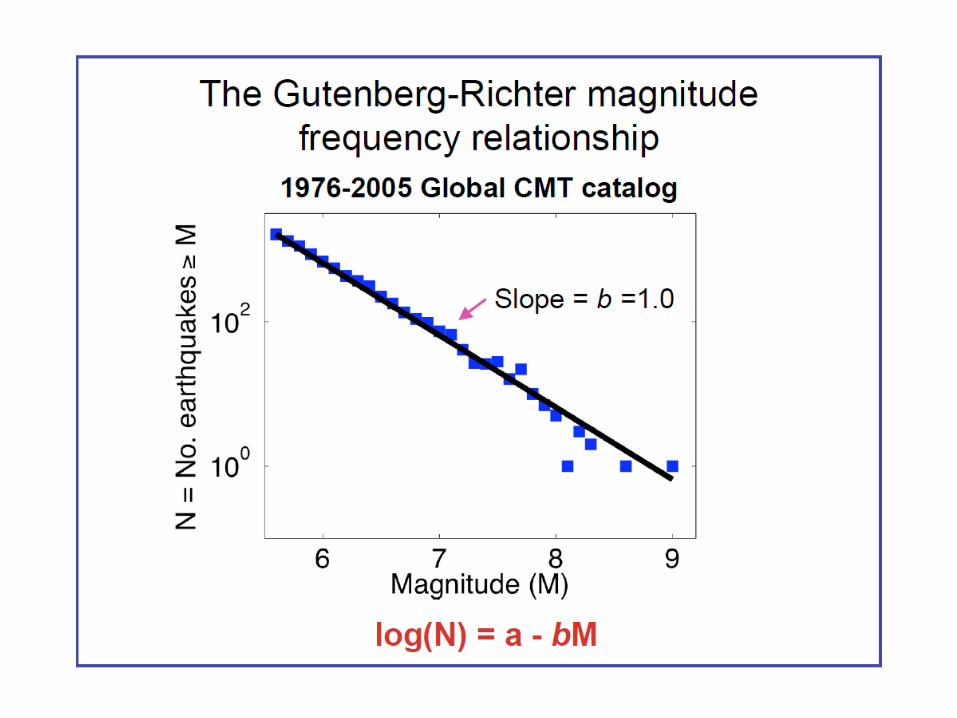
The determination of the number and magnitude of earthquake events for a particular seismic source is performed through a Guttenberg-Richter relationship with the following form:
log10 N = a – b∙M where:
N = the number of earthquakes with magnitude larger than M during a time period T. a = a constant that measures the total number of earthquakes at the given source b = a measure of the number of small versus large events. The number of events N can be divided by the T years in order to get the annual frequency of exceeding the M event magnitude: N1(M) = N(M) / T Furthermore, N1 can be divided by the source area A (or length L) in order to define the annual frequency of exceedence per unit source area: N2(M) = N1 M) / A
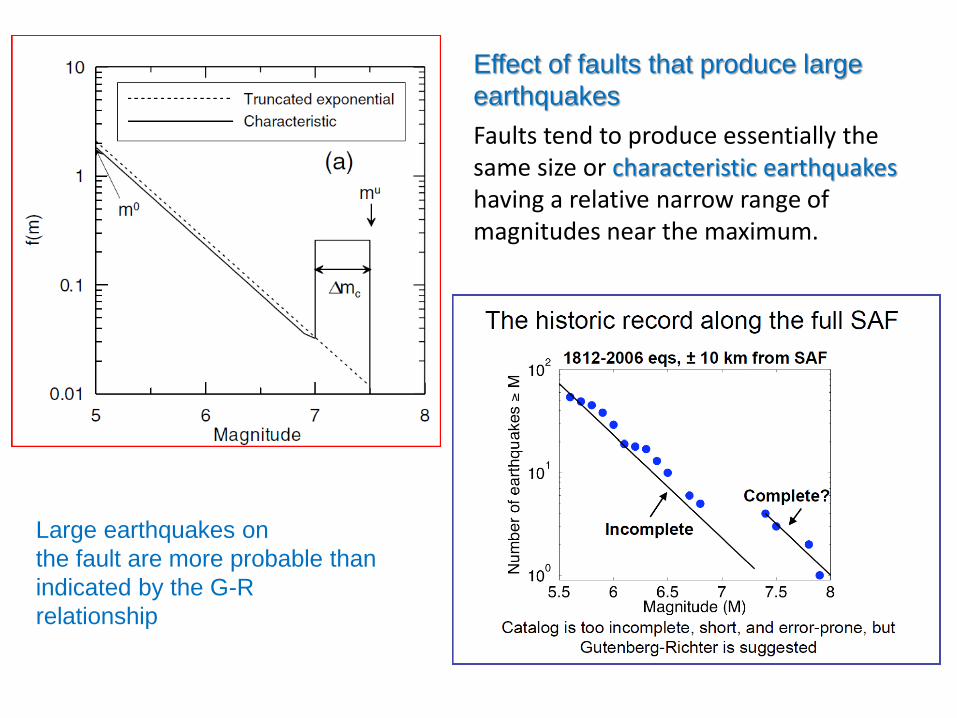
Effect of faults that produce large
earthquakes
Faults tend to produce essentially the same size or characteristic earthquakes having a relative narrow range of magnitudes near the maximum.
Large earthquakes on
the fault are more probable than
indicated by the G-R
relationship
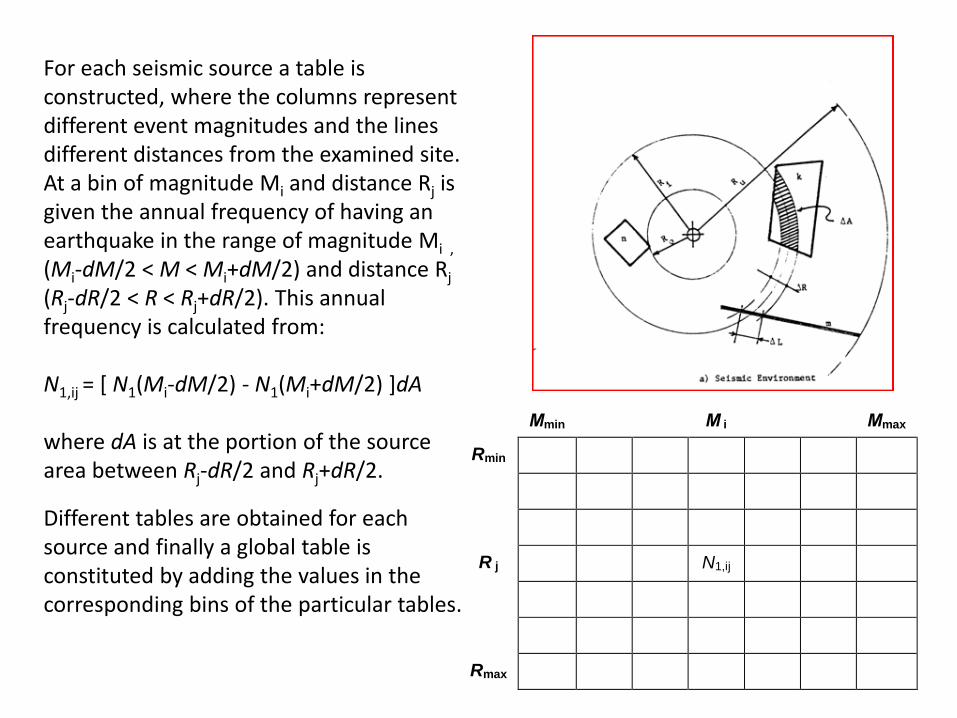
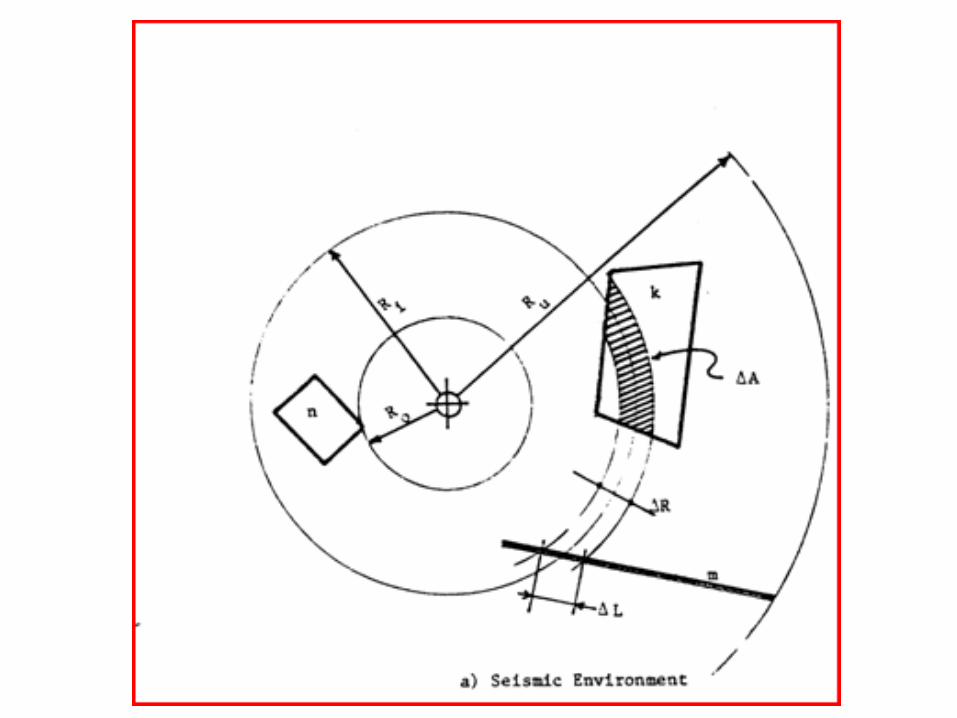
For each seismic source a table is constructed, where the columns represent different event magnitudes and the lines different distances from the examined site. At a bin of magnitude Mi and distance Rj is given the annual frequency of having an earthquake in the range of magnitude Mi , (Μi-dM/2 < M < Mi+dM/2) and distance Rj
(Rj-dR/2 < R < Rj+dR/2). This annual frequency is calculated from: N1,ij = [ N1(Μi-dM/2) - N1(Mi+dM/2) ]dA where dA is at the portion of the source area between Rj-dR/2 and Rj+dR/2.
Different tables are obtained for each source and finally a global table is constituted by adding the values in the corresponding bins of the particular tables.
Μmin Μ i Μmax
Rmin
R j N1,ij
Rmax
METHODOLOGY
1. Identification of seismic sources around the site under examination.
2. Determination of number and magnitude of earthquake events for each seismic source according to historic data
3. Determination of an attenuation model in order to calculate ground motion parameters for given magnitude and distance from the site of a particular earthquake
4. Determination of the stochastic model for the appearance of earthquake events. Usually the Poisson distribution is considered.
5. Evaluation of seismic hazard curve associating a particular ground motion parameter (i.e. peak ground acceleration) with an annual frequency of exceedence or a probability of exceedence in a given time period.
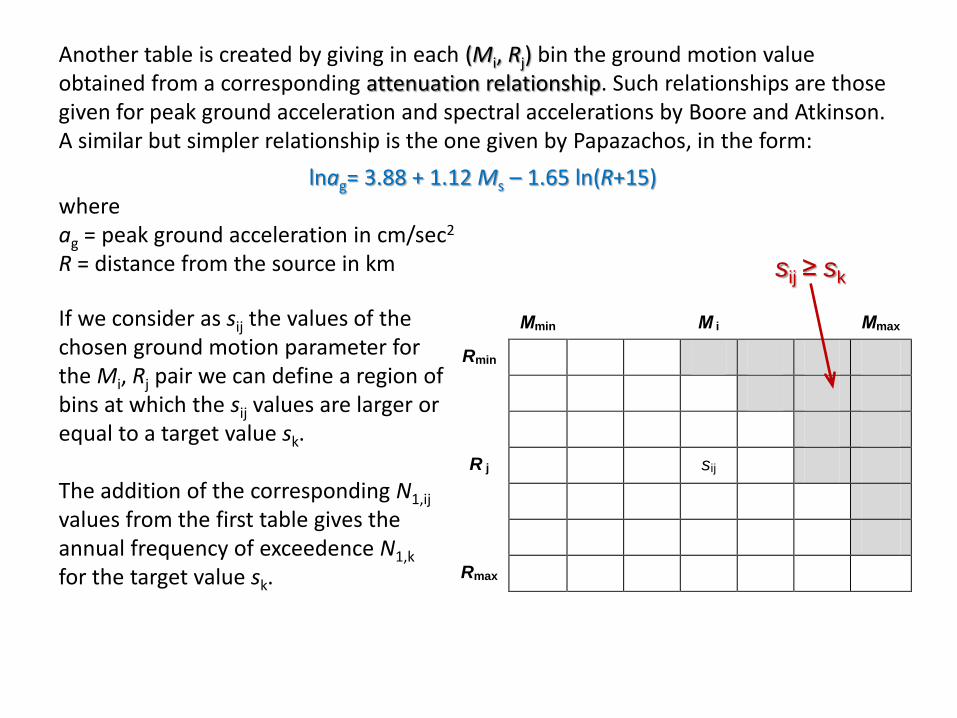
Another table is created by giving in each (Mi, Rj) bin the ground motion value obtained from a corresponding attenuation relationship. Such relationships are those given for peak ground acceleration and spectral accelerations by Boore and Atkinson. A similar but simpler relationship is the one given by Papazachos, in the form:
lnag= 3.88 + 1.12 Ms – 1.65 ln(R+15) where ag = peak ground acceleration in cm/sec2 R = distance from the source in km
Μmin Μ i Μmax
Rmin
R j sij
Rmax
If we consider as sij the values of the chosen ground motion parameter for the Mi, Rj pair we can define a region of bins at which the sij values are larger or equal to a target value sk. The addition of the corresponding N1,ij values from the first table gives the annual frequency of exceedence N1,k for the target value sk.
sij ≥ sk
METHODOLOGY
1. Identification of seismic sources around the site under examination.
2. Determination of number and magnitude of earthquake events for each seismic source according to historic data
3. Determination of an attenuation model in order to calculate ground motion parameters for given magnitude and distance from the site of a particular earthquake
4. Determination of the stochastic model for the appearance of earthquake events. Usually the Poisson distribution is considered.
5. Evaluation of seismic hazard curve associating a particular ground motion parameter (i.e. peak ground acceleration) with an annual frequency of exceedence or a probability of exceedence in a given time period.
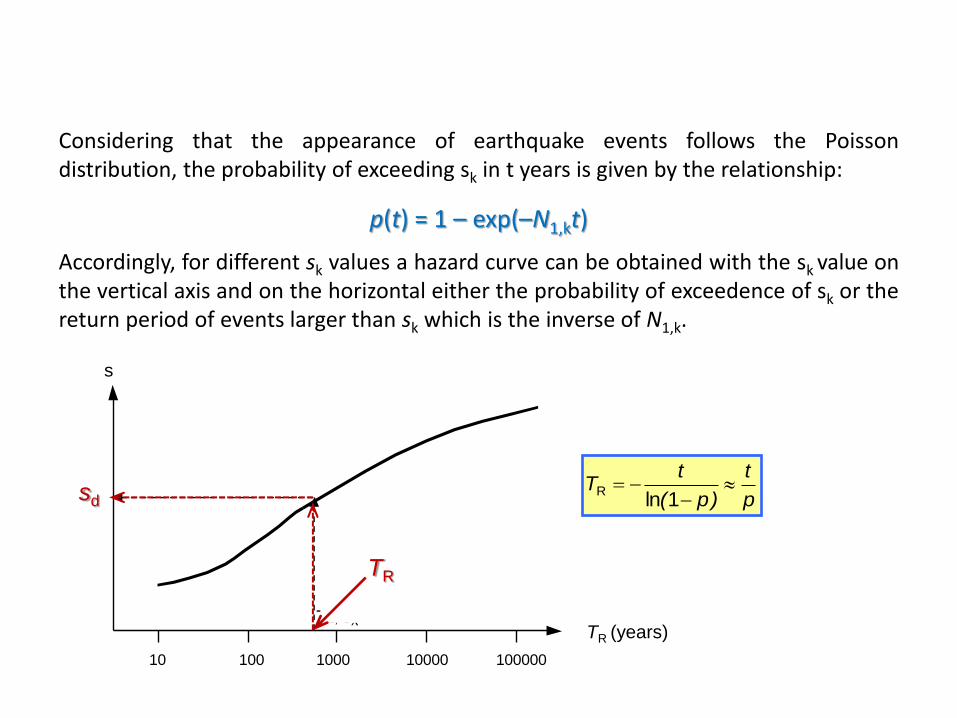
Considering that the appearance of earthquake events follows the Poisson distribution, the probability of exceeding sk in t years is given by the relationship:
p(t) = 1 – exp(–N1,kt)
Accordingly, for different sk values a hazard curve can be obtained with the sk value on the vertical axis and on the horizontal either the probability of exceedence of sk or the return period of events larger than sk which is the inverse of N1,k.
10 100 1000 10000 100000
TE (έτη)
s
TE, σχ
sσχ
TR
sd p
t
)p(
tT
1lnR
TR (years)
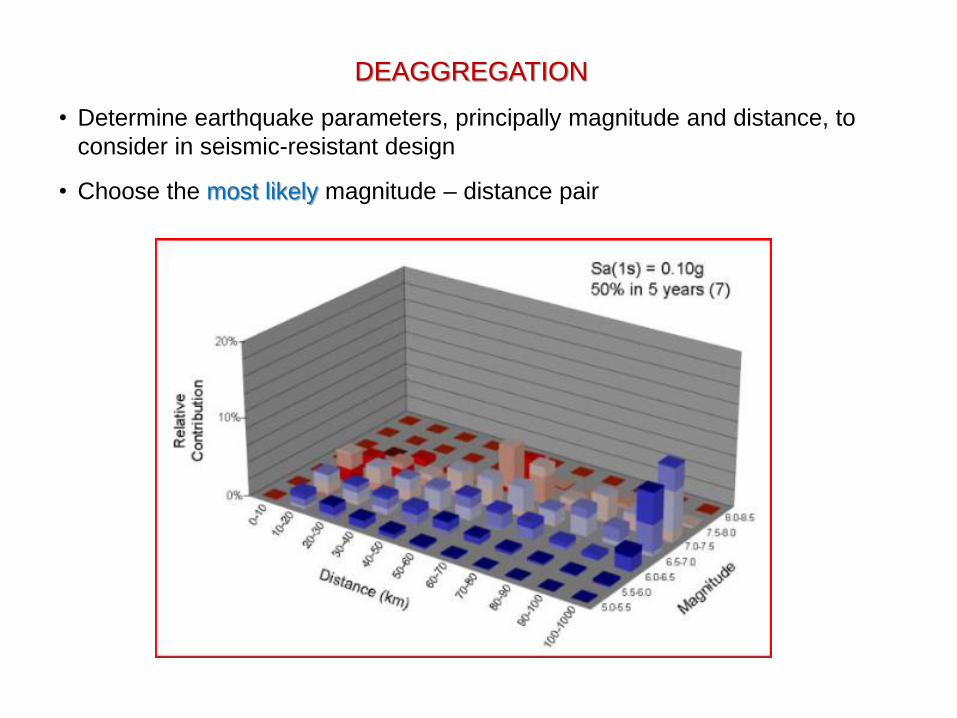
DEAGGREGATION
• Determine earthquake parameters, principally magnitude and distance, to
consider in seismic-resistant design
• Choose the most likely magnitude – distance pair
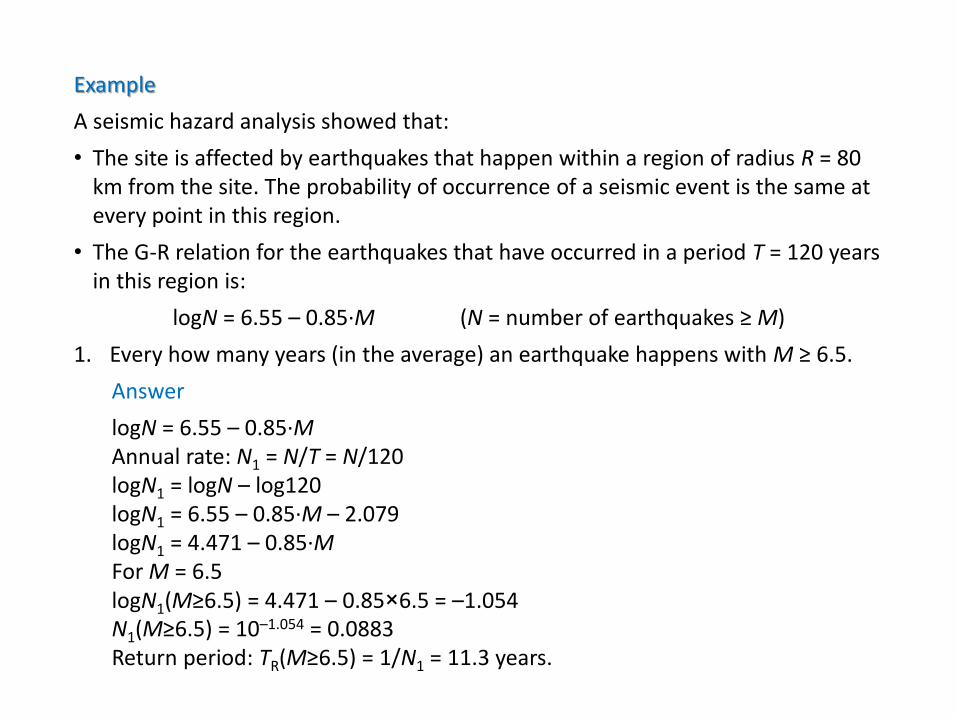
Example
A seismic hazard analysis showed that:
• The site is affected by earthquakes that happen within a region of radius R = 80 km from the site. The probability of occurrence of a seismic event is the same at every point in this region.
• The G-R relation for the earthquakes that have occurred in a period T = 120 years in this region is:
logN = 6.55 – 0.85∙M (Ν = number of earthquakes ≥ Μ)
1. Every how many years (in the average) an earthquake happens with Μ ≥ 6.5.
Answer
logN = 6.55 – 0.85∙M Annual rate: Ν1 = Ν/T = N/120 logN1 = logN – log120 logN1 = 6.55 – 0.85∙M – 2.079 logN1 = 4.471 – 0.85∙M For Μ = 6.5 logN1(M≥6.5) = 4.471 – 0.85×6.5 = –1.054 N1(M≥6.5) = 10–1.054 = 0.0883
Return period: ΤR(Μ≥6.5) = 1/Ν1 = 11.3 years.
Example (cont.)
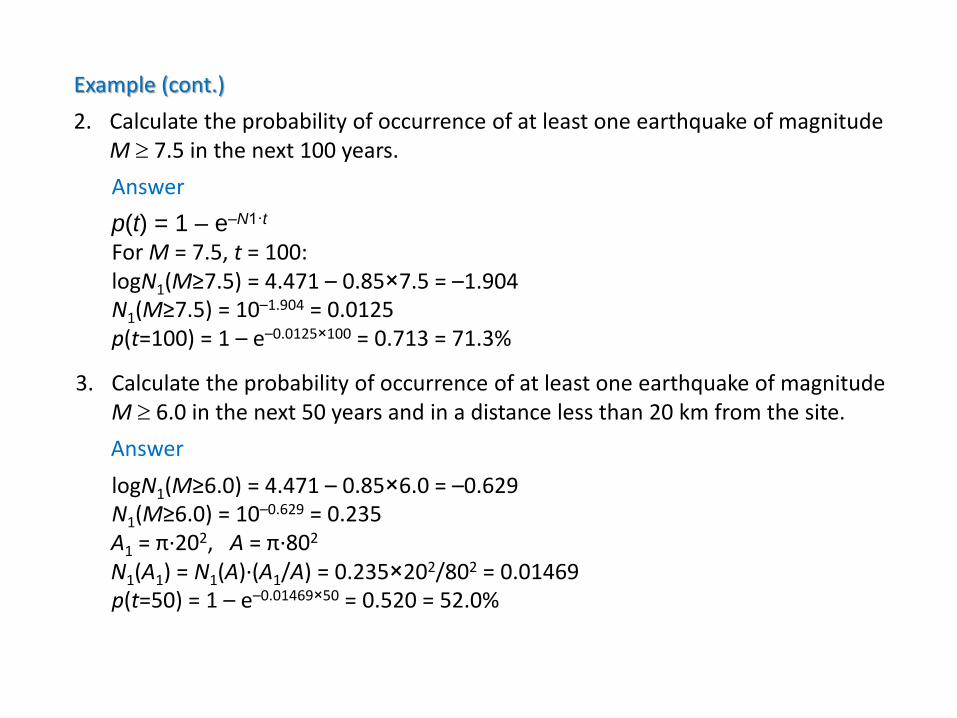
2. Calculate the probability of occurrence of at least one earthquake of magnitude Μ 7.5 in the next 100 years.
Answer
p(t) = 1 – e–N1·t For Μ = 7.5, t = 100: logN1(M≥7.5) = 4.471 – 0.85×7.5 = –1.904 N1(M≥7.5) = 10–1.904 = 0.0125 p(t=100) = 1 – e–0.0125×100 = 0.713 = 71.3%
3. Calculate the probability of occurrence of at least one earthquake of magnitude Μ 6.0 in the next 50 years and in a distance less than 20 km from the site.
Answer
logN1(M≥6.0) = 4.471 – 0.85×6.0 = –0.629 N1(M≥6.0) = 10–0.629 = 0.235 A1 = π∙202, Α = π∙802 Ν1(Α1) = Ν1(Α)∙(Α1/Α) = 0.235×202/802 = 0.01469 p(t=50) = 1 – e–0.01469×50 = 0.520 = 52.0%
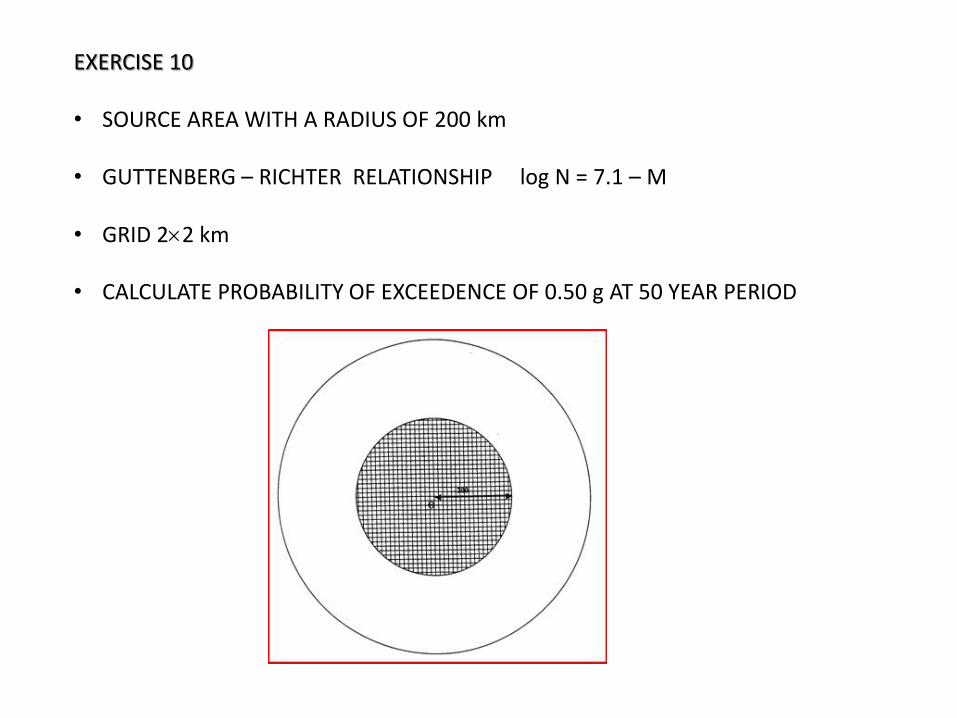
EXERCISE 10 • SOURCE AREA WITH A RADIUS OF 200 km
• GUTTENBERG – RICHTER RELATIONSHIP log N = 7.1 – M
• GRID 22 km
• CALCULATE PROBABILITY OF EXCEEDENCE OF 0.50 g AT 50 YEAR PERIOD
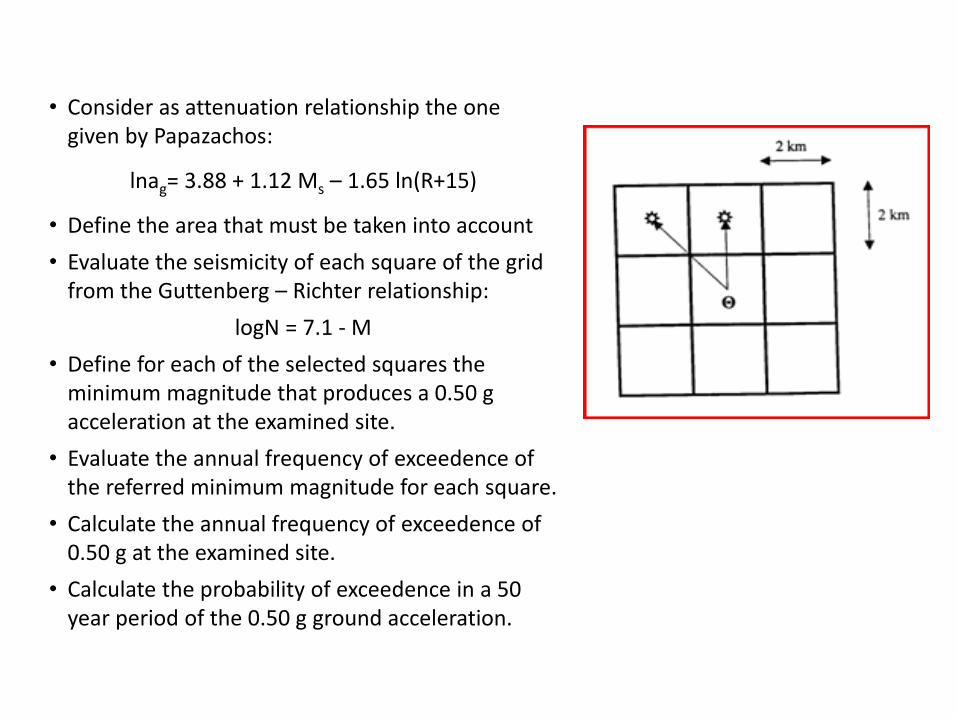
• Consider as attenuation relationship the one given by Papazachos:
lnag= 3.88 + 1.12 Ms – 1.65 ln(R+15)
• Define the area that must be taken into account
• Evaluate the seismicity of each square of the grid from the Guttenberg – Richter relationship:
logN = 7.1 - M
• Define for each of the selected squares the minimum magnitude that produces a 0.50 g acceleration at the examined site.
• Evaluate the annual frequency of exceedence of the referred minimum magnitude for each square.
• Calculate the annual frequency of exceedence of 0.50 g at the examined site.
• Calculate the probability of exceedence in a 50 year period of the 0.50 g ground acceleration.
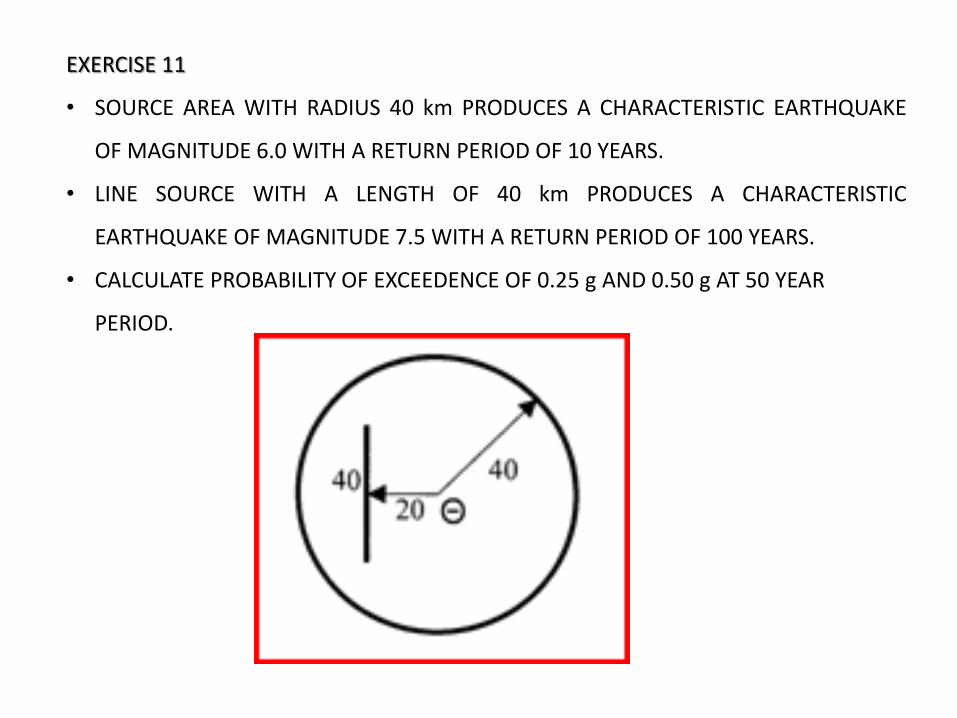
EXERCISE 11
• SOURCE AREA WITH RADIUS 40 km PRODUCES A CHARACTERISTIC EARTHQUAKE
OF MAGNITUDE 6.0 WITH A RETURN PERIOD OF 10 YEARS.
• LINE SOURCE WITH A LENGTH OF 40 km PRODUCES A CHARACTERISTIC
EARTHQUAKE OF MAGNITUDE 7.5 WITH A RETURN PERIOD OF 100 YEARS.
• CALCULATE PROBABILITY OF EXCEEDENCE OF 0.25 g AND 0.50 g AT 50 YEAR
PERIOD.
• Define for each source the portion of its area or length that produces the target acceleration at the examined site as a result of the characteristic earthquake.
• Define the annual frequency of appearance of the characteristic earthquake at the defined portions.
• Calculate the annual frequency of exceedence of the target acceleration at the examined site.
• Calculate the probability of exceedence of the target acceleration in a 50 year period.