Section 5.4 - Graphs of Inverse Trigonometric Functions Recallalmus/1330_section5o4b_after.pdf ·...
14
1 Section 5.4 - Graphs of Inverse Trigonometric Functions Recall: Example 1: 1 2 tan tan 3 π - = Example 2: 5 arcsin sin 3 π = Example 3: 1 2 tan cot 5 - =
Transcript of Section 5.4 - Graphs of Inverse Trigonometric Functions Recallalmus/1330_section5o4b_after.pdf ·...
1
Section 5.4 - Graphs of Inverse Trigonometric Functions Recall:
Example 1: 1 2tan tan
3
π− =
Example 2: 5
arcsin sin3
π =
Example 3: 1 2tan cot
5− =
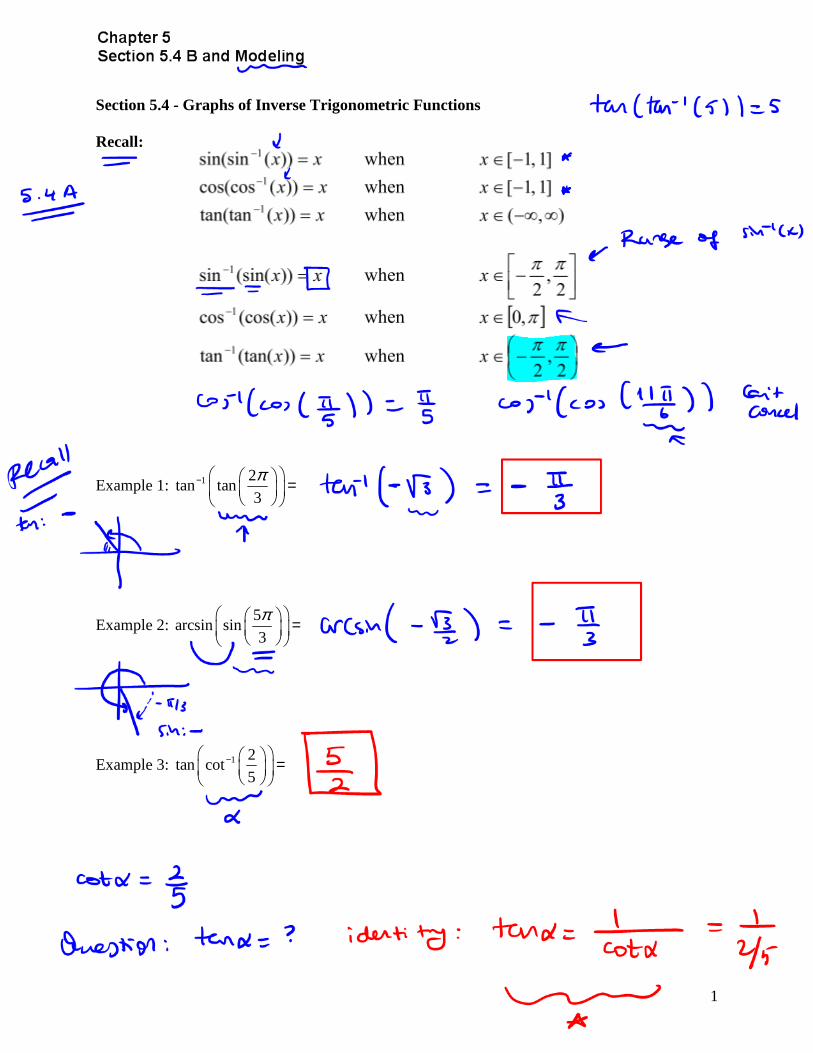
2
Example 4: 1 1sin cos
4− − =
Example 5: 1 4tan sin
5− − =
Example 6: ( )( )=− 2sectan 1
3
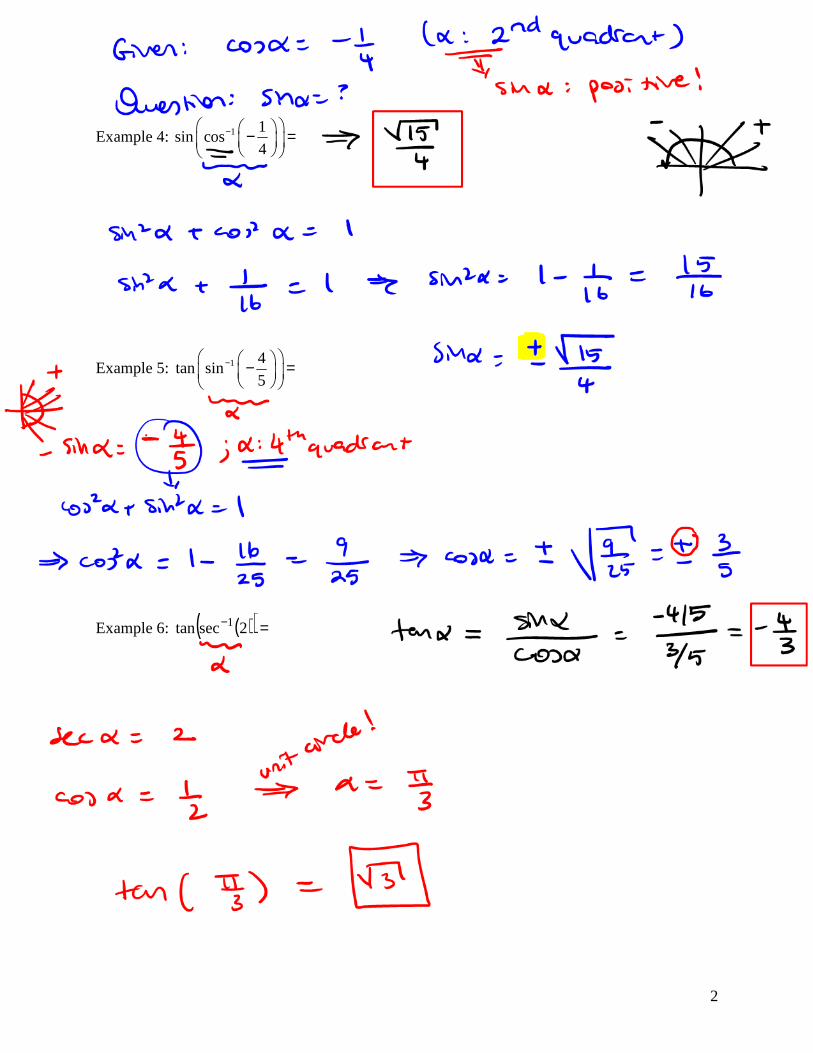
Example 7: ( )( )=−− 4cossin 1
Example 8: Simplify 1
cos arctan4
x
where 0>x .
4
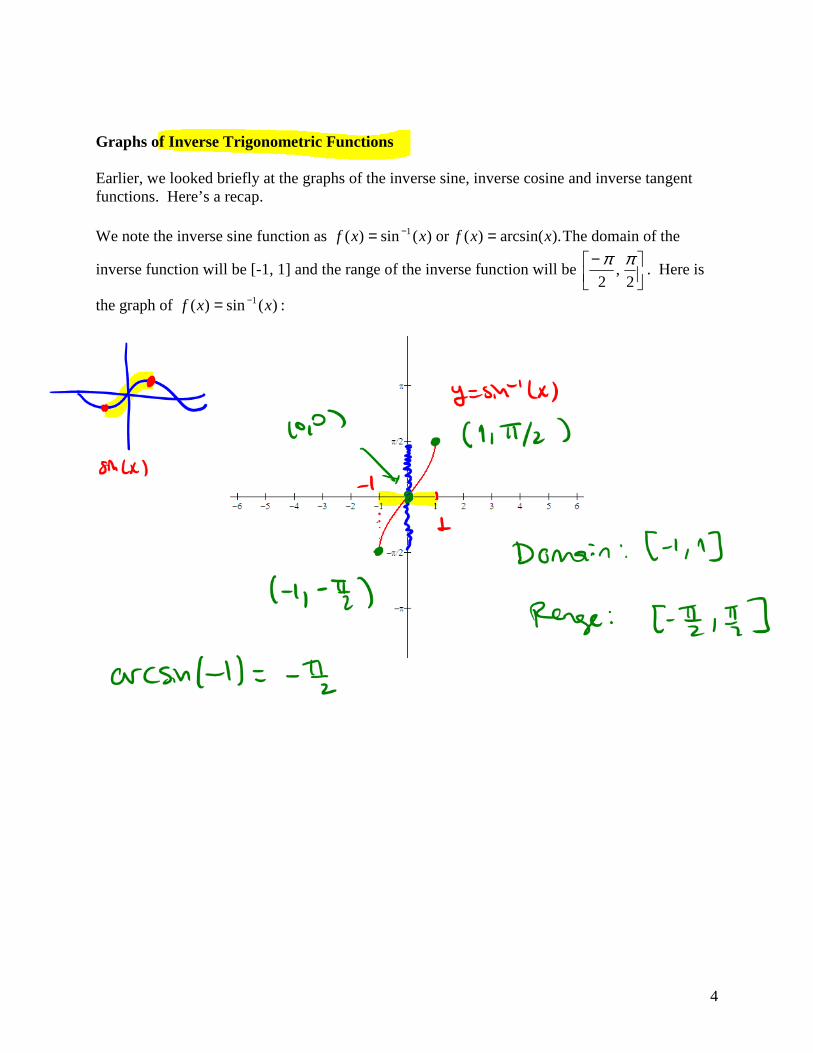
Graphs of Inverse Trigonometric Functions Earlier, we looked briefly at the graphs of the inverse sine, inverse cosine and inverse tangent functions. Here’s a recap. We note the inverse sine function as ).arcsin()(or )(sin)( 1 xxfxxf == − The domain of the
inverse function will be [-1, 1] and the range of the inverse function will be
−2
,2
ππ. Here is
the graph of )(sin)( 1 xxf −= :
5
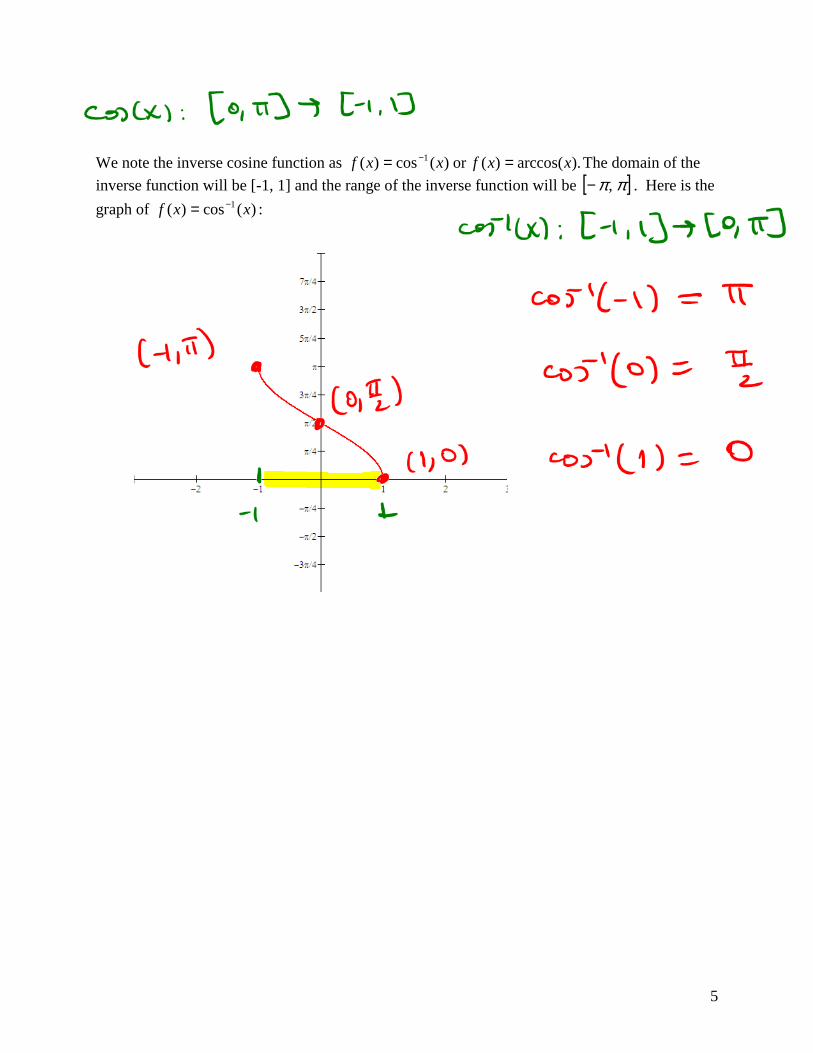
We note the inverse cosine function as ).arccos()(or )(cos)( 1 xxfxxf == − The domain of the
inverse function will be [-1, 1] and the range of the inverse function will be [ ]ππ ,− . Here is the
graph of )(cos)( 1 xxf −= :
6
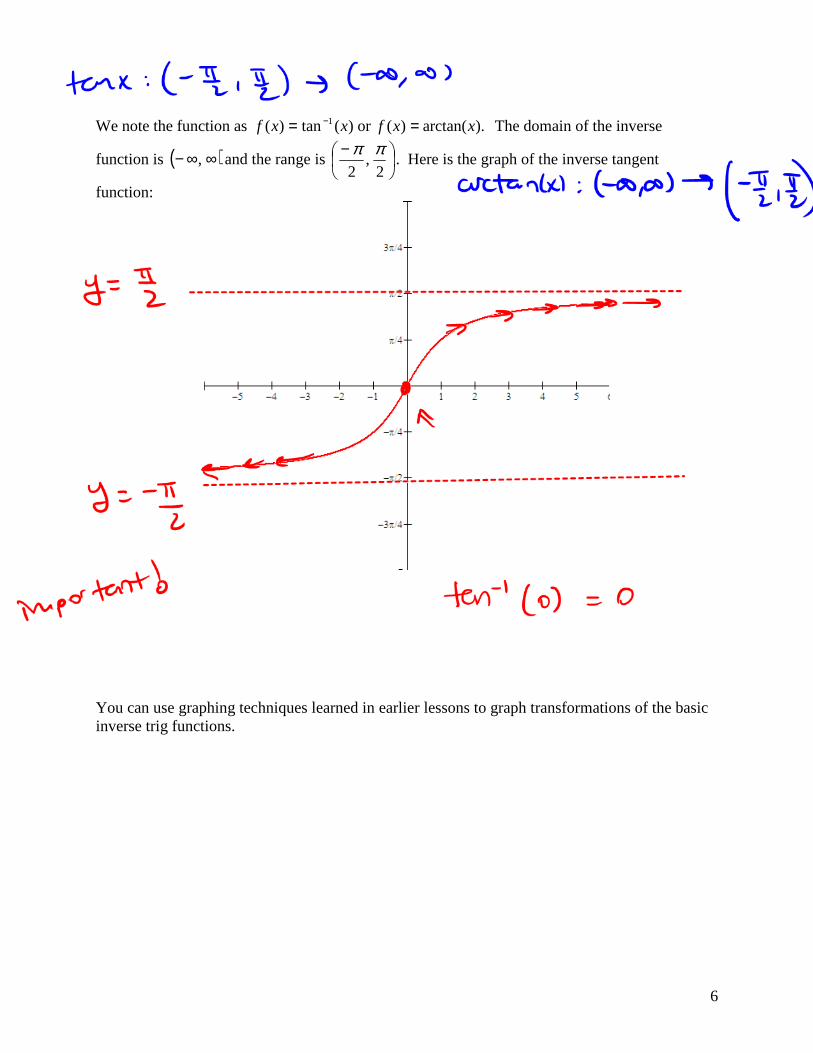
We note the function as ).arctan()(or)(tan)( 1 xxfxxf == − The domain of the inverse
function is ( )∞∞− , and the range is
−2
,2
ππ. Here is the graph of the inverse tangent
function:
You can use graphing techniques learned in earlier lessons to graph transformations of the basic inverse trig functions.
7
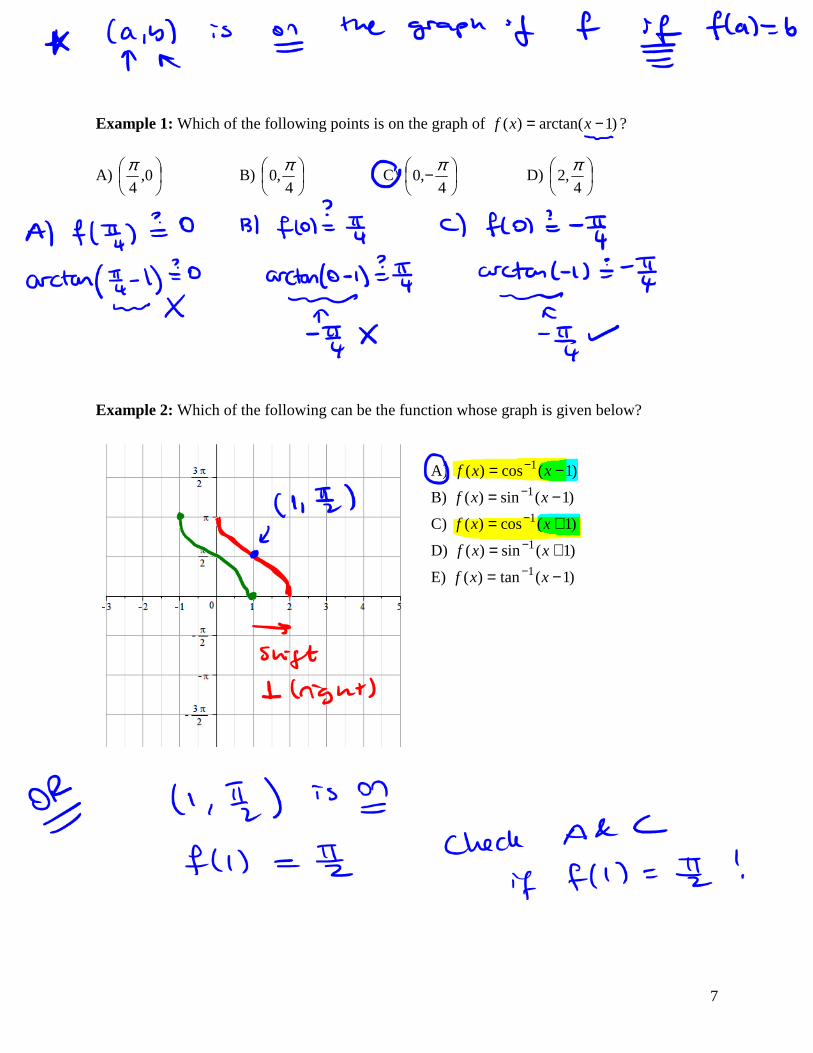
Example 1: Which of the following points is on the graph of )1arctan()( −= xxf ?
A)
0,
4
π B)
4,0π
C)
−4
,0π
D)
4,2π
Example 2: Which of the following can be the function whose graph is given below?
A) )1(cos)( 1 −= − xxf
B) )1(sin)( 1 −= − xxf
C) )1(cos)( 1 += − xxf
D) )1(sin)( 1 += − xxf
E) )1(tan)( 1 −= − xxf
8
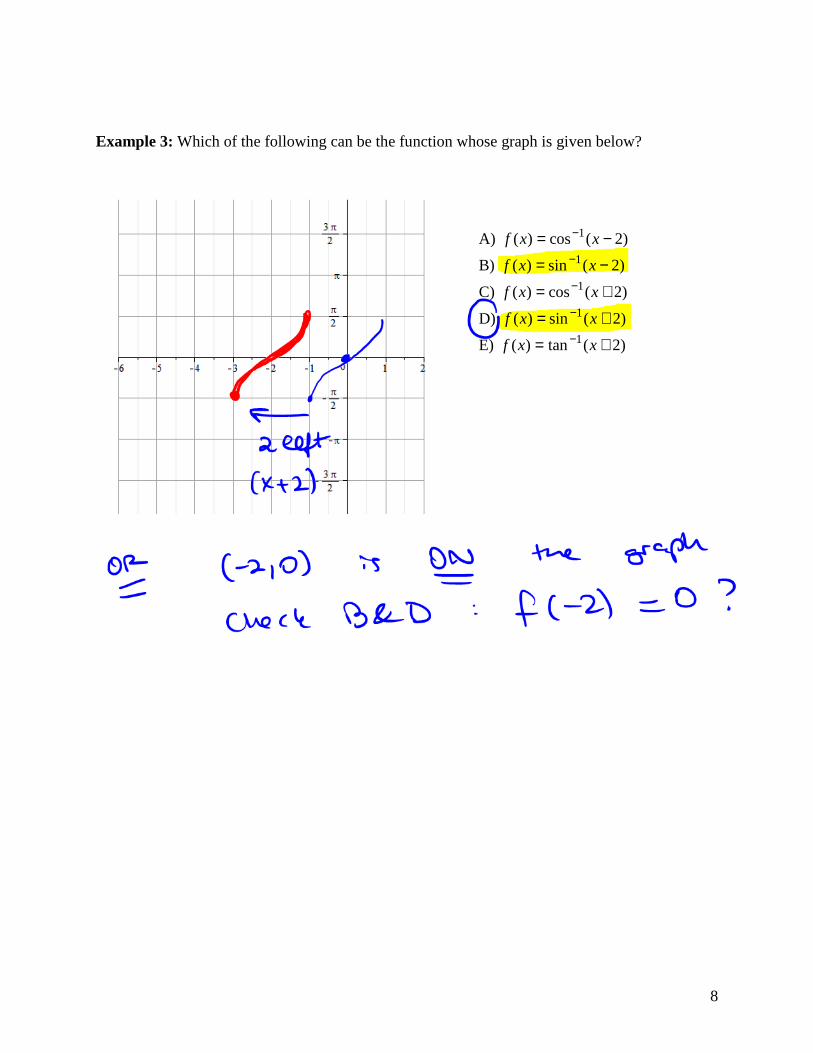
Example 3: Which of the following can be the function whose graph is given below?
A) )2(cos)( 1 −= − xxf
B) )2(sin)( 1 −= − xxf
C) )2(cos)( 1 += − xxf
D) )2(sin)( 1 += − xxf
E) )2(tan)( 1 += − xxf
9
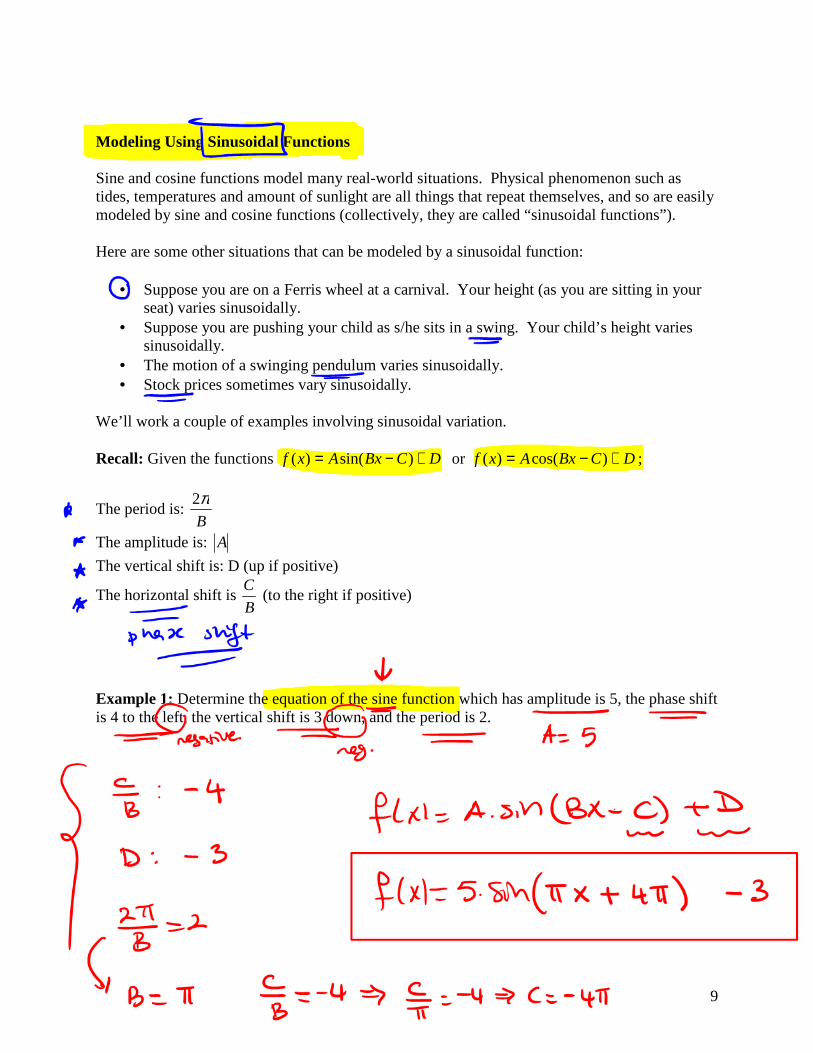
Modeling Using Sinusoidal Functions Sine and cosine functions model many real-world situations. Physical phenomenon such as tides, temperatures and amount of sunlight are all things that repeat themselves, and so are easily modeled by sine and cosine functions (collectively, they are called “sinusoidal functions”). Here are some other situations that can be modeled by a sinusoidal function:
• Suppose you are on a Ferris wheel at a carnival. Your height (as you are sitting in your seat) varies sinusoidally.
• Suppose you are pushing your child as s/he sits in a swing. Your child’s height varies sinusoidally.
• The motion of a swinging pendulum varies sinusoidally. • Stock prices sometimes vary sinusoidally.
We’ll work a couple of examples involving sinusoidal variation. Recall: Given the functions DCBxAxf +−= )sin()( or DCBxAxf +−= )cos()( ;
The period is: B
π2
The amplitude is: A
The vertical shift is: D (up if positive)
The horizontal shift is B
C (to the right if positive)
Example 1: Determine the equation of the sine function which has amplitude is 5, the phase shift is 4 to the left, the vertical shift is 3 down, and the period is 2.
10
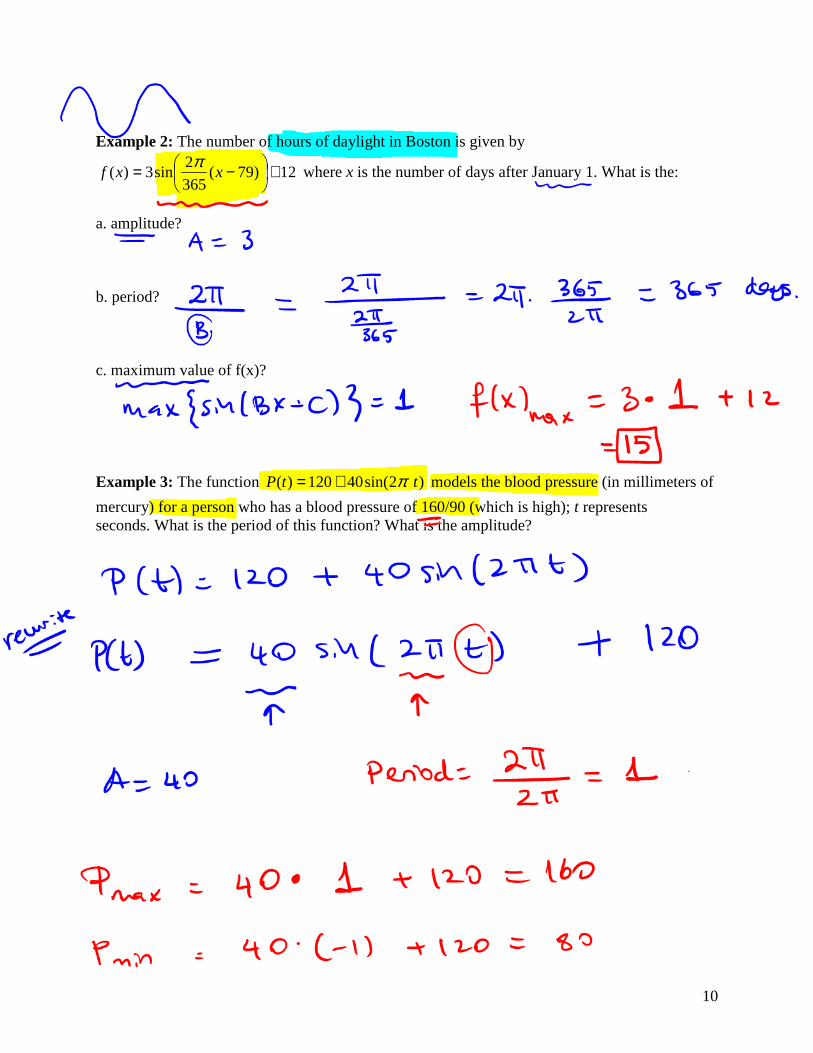
Example 2: The number of hours of daylight in Boston is given by
12)79(365
2sin3)( +
−= xxfπ
where x is the number of days after January 1. What is the:
a. amplitude? b. period? c. maximum value of f(x)? Example 3: The function )2sin(40120)( ttP π+= models the blood pressure (in millimeters of
mercury) for a person who has a blood pressure of 160/90 (which is high); t represents seconds. What is the period of this function? What is the amplitude?
11
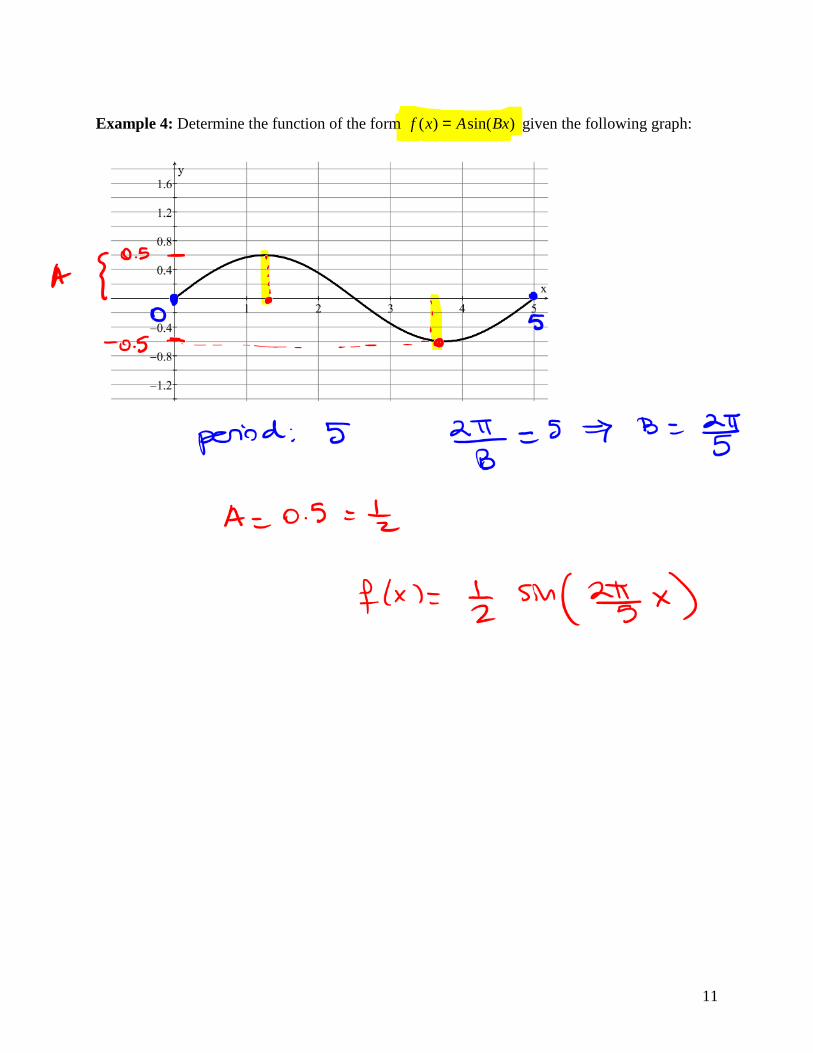
Example 4: Determine the function of the form )sin()( BxAxf = given the following graph:
12
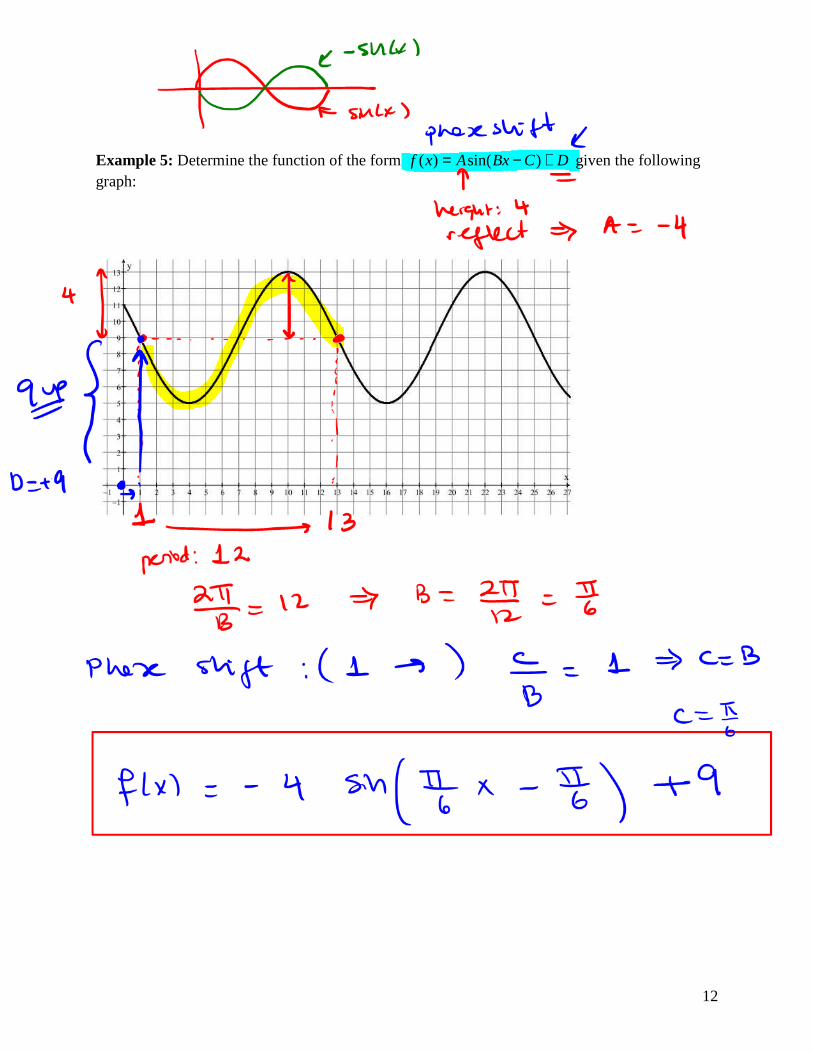
Example 5: Determine the function of the form DCBxAxf +−= )sin()( given the following graph:
13
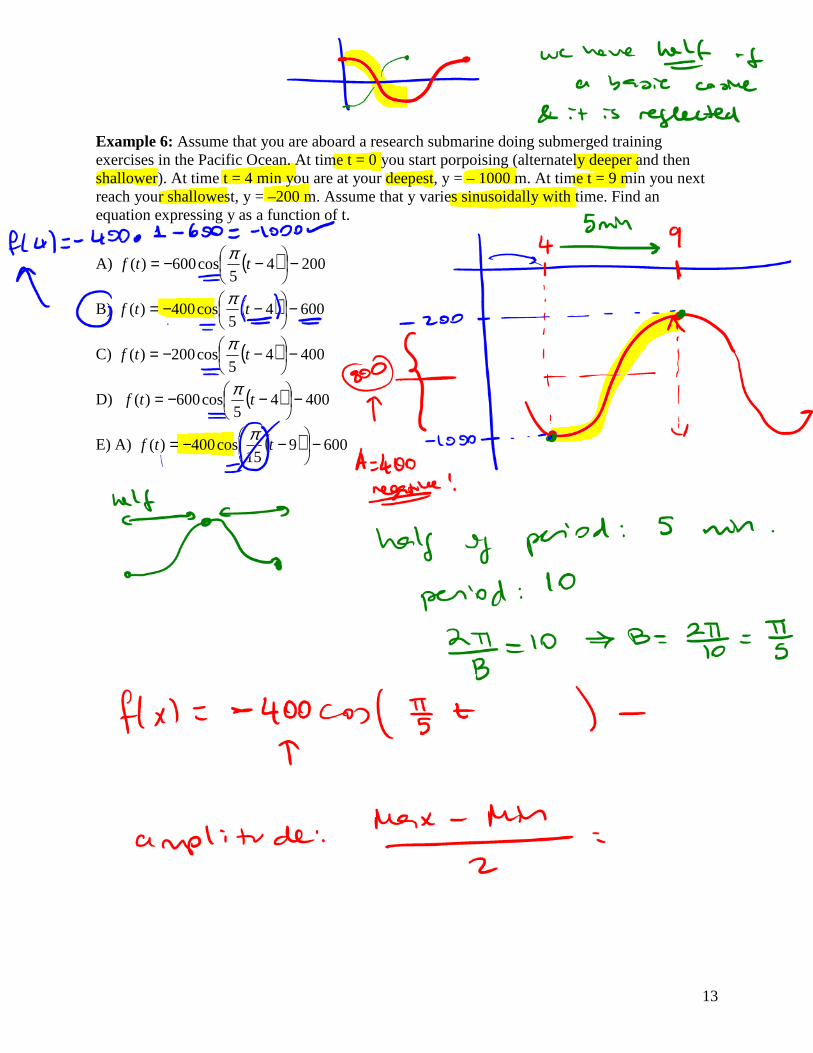
Example 6: Assume that you are aboard a research submarine doing submerged training exercises in the Pacific Ocean. At time t = 0 you start porpoising (alternately deeper and then shallower). At time t = 4 min you are at your deepest, y = – 1000 m. At time t = 9 min you next reach your shallowest, y = –200 m. Assume that y varies sinusoidally with time. Find an equation expressing y as a function of t.
A) ( ) 20045
cos600)( −
−−= ttfπ
B) ( ) 60045
cos400)( −
−−= ttfπ
C) ( ) 40045
cos200)( −
−−= ttfπ
D) ( ) 40045
cos600)( −
−−= ttfπ
E) A) ( ) 600915
cos400)( −
−−= ttfπ
14
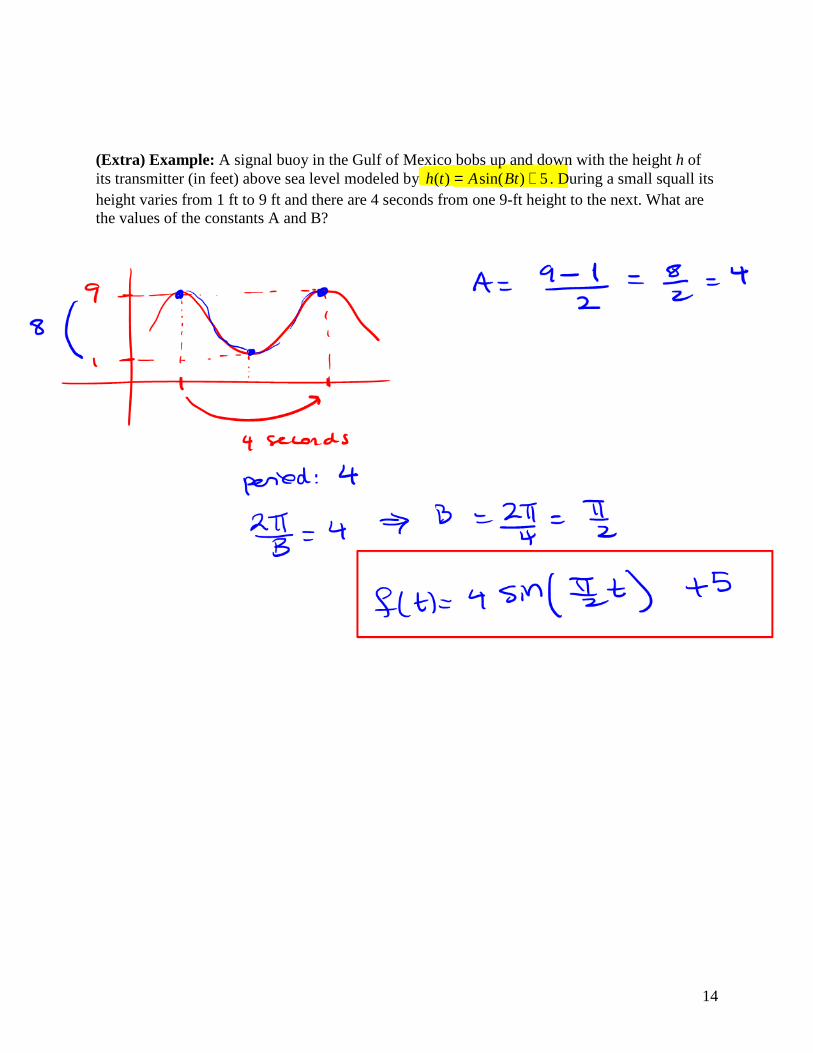
(Extra) Example: A signal buoy in the Gulf of Mexico bobs up and down with the height h of its transmitter (in feet) above sea level modeled by 5)sin()( += BtAth . During a small squall its height varies from 1 ft to 9 ft and there are 4 seconds from one 9-ft height to the next. What are the values of the constants A and B?