
Searching for p-modes in η Bootis & Procyon using MOST...
21
Comm. in Asteroseismology Vol. 151, 2007 Searching for p-modes in η Bo¨ otis & Procyon using MOST satellite data D. B. Guenther 1 , T. Kallinger 2 , P. Reegen 2 , W. W. Weiss 2 , J. M. Matthews 3 , R. Kuschnig 3 , A. F. J. Moffat 4 , S. M. Rucinski 5 , D. Sasselov 6 and G. A. H. Walker 3 1 Institute for Computational Astrophysics, Department of Astronomy and Physics, Saint Marys University, Halifax, NS B3H 3C3, Canada 2 Institut f¨ ur Astronomie, T¨ urkenschanzstrasse 17, 1180 Vienna, Austria 3 Department of Physics and Astronomy, University of British Columbia, 6224 Agricultural Road, Vancouver, BC B6T 1Z1, Canada 4 D´ epartment de Physique, Universit´ e de Montr´ eal C. P. 6128, Succursale : Centre-Ville, Montr´ eal, QC H3C 3J7 and Observatoire Astronomique du Mont M´ egantic, Canada 5 Department of Astronomy and Astrophysics, David Dunlap Observatory, University of Toronto, P. O. Box 360, Richmond Hill, ON L4C 4Y6, Canada 6 Harvard-Smithsonian Center for Astrophysics, 60 Garden Street, Cambridge, MA 02138 Abstract We present frequency analyses of new photometry obtained in 2005 by the MOST 1 (Microvariability & Oscillations of STars) satellite of two solar- type stars, η Bo¨ otis and Procyon, and reanalyses of MOST data of these stars obtained in 2004. With improved strategies to identify and correct stray light artifacts in the MOST Fabry Imaging data, we produce amplitude spectra from the reduced data and compare them to p-mode oscillation spectra computed from stellar models. We confirm the null result from the 2004 MOST observa- tions of Procyon. We find no evidence for spectral power with regular spaced frequencies characteristic of radial p-modes, nor do we find excess power in the expected p-mode frequency range. Consequently, we argue the absence of p-mode oscillations in Procyon exceeding our detection limit of about 10ppm. 1 Based on data from the MOST satellite, a Canadian Space Agency mission, jointly operated by Dynacon Inc., the University of Toronto Institute for Aerospace Studies and the University of British Columbia, with the assistance of the University of Vienna.
Transcript of Searching for p-modes in η Bootis & Procyon using MOST...
Comm. in AsteroseismologyVol. 151, 2007
Searching for p-modes in η Bootis & Procyon usingMOST satellite data
D. B. Guenther1, T. Kallinger2, P. Reegen2, W. W. Weiss2, J. M. Matthews3,R. Kuschnig3, A. F. J. Moffat4, S. M. Rucinski5, D. Sasselov6 and
G. A. H. Walker3
1Institute for Computational Astrophysics, Department of Astronomy and Physics,Saint Marys University, Halifax, NS B3H 3C3, Canada
2 Institut fur Astronomie, Turkenschanzstrasse 17, 1180 Vienna, Austria3 Department of Physics and Astronomy, University of British Columbia, 6224
Agricultural Road, Vancouver, BC B6T 1Z1, Canada4 Department de Physique, Universite de Montreal C. P. 6128, Succursale :
Centre-Ville, Montreal, QC H3C 3J7 andObservatoire Astronomique du Mont Megantic, Canada
5 Department of Astronomy and Astrophysics, David Dunlap Observatory,University of Toronto, P. O. Box 360, Richmond Hill, ON L4C 4Y6, Canada
6 Harvard-Smithsonian Center for Astrophysics, 60 Garden Street,Cambridge, MA 02138
Abstract
We present frequency analyses of new photometry obtained in 2005 by theMOST1 (Microvariability & Oscillations of STars) satellite of two solar-type stars, η Bootis and Procyon, and reanalyses of MOST data of these starsobtained in 2004. With improved strategies to identify and correct stray lightartifacts in the MOST Fabry Imaging data, we produce amplitude spectra fromthe reduced data and compare them to p-mode oscillation spectra computedfrom stellar models. We confirm the null result from the 2004 MOST observa-tions of Procyon. We find no evidence for spectral power with regular spacedfrequencies characteristic of radial p-modes, nor do we find excess power inthe expected p-mode frequency range. Consequently, we argue the absence ofp-mode oscillations in Procyon exceeding our detection limit of about 10ppm.
1Based on data from the MOST satellite, a Canadian Space Agency mission, jointlyoperated by Dynacon Inc., the University of Toronto Institute for Aerospace Studies andthe University of British Columbia, with the assistance of the University of Vienna.
6 Searching for p-modes in η Bootis and Procyon using MOST satellite data
For η Boo, the frequencies present in the 2005 data do not match within theresolution those identified in the 2004 data after excluding all frequencies wesuspect to be due to stray light contamination. However, there is clear evidencefor excess power within the p-mode range predicted by models. We discuss theimplications of these results for mode lifetimes in these stars and the sensi-tivity of high-precision photometry to solar-type oscillations in the presence ofgranulation.
Introduction
Eigenfrequency spectra of acoustic oscillations have been observed in solar-type stars through groundbased spectroscopic measurements of radial velocity,especially with the advent of the few-m/s precision developed for extrasolarplanet searches. The study of such p-modes photometrically requires a precisionof a few parts per million (ppm) or less, which can only be achieved reliablyfrom space. The MOST space mission, lead by J. Matthews and first reviewedby Walker et al. 2003, was designed to obtain such precision for a few brightstars. The long, nearly continuous time coverage possible with MOST wouldalso make it possible to resolve fine structure in the p-mode eigenspectrum forasteroseismic modeling.
Two early MOST targets were Procyon (Matthews et al. 2004) and η Bootis(Guenther et al. 2005), both observed in 2004 for about a month each. In theformer, no p-modes were detected, with strong upper limits on amplitude andmode lifetime. In the latter, radial p-modes were identified that are consistentwith a stellar structure model appropriate to η Boo, and which extend to lowovertones the sequence of modes identified by Kjeldsen et al. (2003) in theirspectroscopic data. The astrophysical implications of the results warrantedsecond sets of photometry to confirm, refine or deny the original findings. Forthis reason, both stars were chosen to be reobserved by MOST in 2005.
The trail of two stars
Procyon and η Boo are more massive than the Sun and are in their post-main-sequence phase of evolution. They have convective envelopes but withdifferent depths. This makes these stars attractive targets to help quantify thedriving of p-modes by turbulent convection, the mechanism believed to operatein solar-type stars, as in the Sun.
The coupling between the pressure variations associated with p-modes andtheir driving source, the convective motions, is greatest in the very outermostlayers of the convective envelope, in a thin region called the superadiabaticlayer. Numerical hydrodynamical simulations of stellar convection (Robinson
D. B. Guenther, T. Kallinger, P. Reegen, et al. 7
et al. 2005) show that the convective velocities are greater in stars with thin-ner convection zones (such as found in the post main-sequence stars Procyonand η Boo) than those with deeper convective envelopes like the Sun. If theamplitudes of the p-mode pulsations correlate with the maximum turbulent ve-locities, and hence the depth of the convection zone, then the amplitudes of thep-modes in stars like Procyon and η Boo should be greater than those observedin the Sun (Christensen-Dalsgaard & Frandsen 1993; Kjeldsen & Bedding 1995;Houdek et al. 1999).
Attempts to observe p-modes on these stars from the ground have yieldedmixed results. For Procyon, the groundbased radial velocity observations showan enhanced region of power in the frequency range 0.5 – 1.5 mHz (e.g., Brownet al 1991; Martic et al. 1999; Eggenberger et al. 2004). The identificationof individual peaks and regular spacings is less certain, although both Marticet al. (1999) and Eggenberger et al. (2004) find a frequency spacing of 55µHz, which is consistent with model predictions (Chaboyer et al. 1999). In thecase of η Boo, several groundbased campaigns have yielded plausible individualp-mode identifications (Kjeldsen et al. 2003, Carrier et al. 2005). They find aspacing of 40 µHz, consistent with models. However, there is little coincidenceof the actual identified frequencies between the two groups, and even betweenobserving runs by the same group from epoch to epoch.
The results on Procyon and η Boo from MOSTs first year of operation havealready been published (Matthews et al. 2004; Guenther et al. 2005). We re-ported a null detection for Procyon and a possible detection of radial p-modeson η Boo. The Procyon null detection was a surprise since we expected theamplitudes of the oscillations, as consequence of its very thin convective enve-lope, to be large enough to be detectable above the noise level of a few ppm inthe MOST photometry. The tentative detection of p-modes on η Boo was alsonot quite what we expected. We had expected to see a clear and unambiguoussignature of p-modes. What we saw though were many peaks in the spectrum,of which less than a third could be associated with the radial p-modes of ourmodels. Other peaks in the spectrum of comparable amplitudes could not beunambiguously identified because stellar models appropriate to η Boo show arich and complex eigenspectrum of nonradial modes which are very sensitiveto changes in metallicity, convection parameters and envelope models. Thisambiguity makes exact nonradial mode identification in our MOST photome-try virtually impossible without additional information on stellar fundamentalparameters derived with techniques other than asteroseismology.
In this paper we present the new sets of MOST photometry of Procyon andη Boo obtained in 2005, and a revised strategy to identify p-mode signals in thedata. Much of this strategy involves identifying and removing artifacts in theMOST data introduced by stray light from scattered Earthshine. We apply this
8 Searching for p-modes in η Bootis and Procyon using MOST satellite data
to the new data and the previously published 2004 photometry, and comparethe resulting frequency spectra for each star to stellar models. We also discussthe possibility of short p-mode lifetimes and show the consequences of shortlifetimes on the observations.
Observations & Data Analysis
The MOST microsatellite houses a 15-cm telescope which feeds a CCD pho-tometer through a custom broadband optical filter. For the brightest stellartargets and the highest photometric precision, starlight is directed through aFabry microlens to produce a fixed image of the telescope pupil covering about1500 pixels on the detector. MOST is in a near-polar Sun-synchronous orbitof altitude 820 km, from which it can monitor stars continuously for up to twomonths within a 54◦–wide viewing zone. The instrument is capable of achiev-ing noise levels in the Fourier domain for very bright stars of about 1 ppm atfrequencies above about 1 – 2 mHz.
It was recognized in the earliest observations (e.g., Matthews et al. 2004;Rucinski et al. 2004) that stray light entering the Fabry field due to scatteredEarthshine was modulated with the MOST orbital period. This introduces arti-facts in the data at the satellite orbital frequency and its harmonics, and othermodulation terms. These effects, other aspects of spacebased CCD photometry,and how they are dealt with in MOST Fabry Imaging photometric reductions,are described in more detail by Reegen et al. (2006) and revisited here inSection Stray light processing.
MOST photometry of Procyon and η Boo
The data set for Procyon consists of two runs: 32 days in January 2004(Matthews et al. 2004), and 17 days in January 2005 (this paper). For ηBoo, the runs cover: 27 days during April May 2004 (Guenther et al. 2005)and 21 days during March April 2005. In Table 1 we summarize the propertiesof all four observing runs, listing the start and end dates of each run, its dura-tion, exposure time, number of exposures, duty cycle, and resulting frequencyresolution.
Stray light processing
The photometric signal from a MOST Fabry Imaging target star arrives on theCCD in an annulus (see Fig. 1 in Reegen et al. 2006). We define the“Fabryimage” to be the image of the telescope entrance pupil produced by a Fabrylens close to the CCD, the “target pixels” to be those pixels located within the
D. B. Guenther, T. Kallinger, P. Reegen, et al. 9
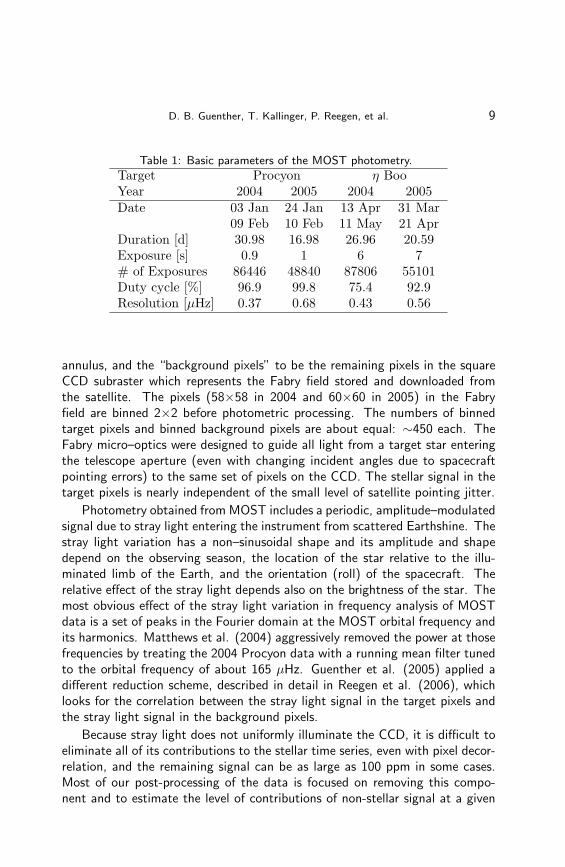
Table 1: Basic parameters of the MOST photometry.
Target Procyon η BooYear 2004 2005 2004 2005Date 03 Jan 24 Jan 13 Apr 31 Mar
09 Feb 10 Feb 11 May 21 AprDuration [d] 30.98 16.98 26.96 20.59Exposure [s] 0.9 1 6 7# of Exposures 86446 48840 87806 55101Duty cycle [%] 96.9 99.8 75.4 92.9Resolution [µHz] 0.37 0.68 0.43 0.56
annulus, and the “background pixels” to be the remaining pixels in the squareCCD subraster which represents the Fabry field stored and downloaded fromthe satellite. The pixels (58×58 in 2004 and 60×60 in 2005) in the Fabryfield are binned 2×2 before photometric processing. The numbers of binnedtarget pixels and binned background pixels are about equal: ∼450 each. TheFabry micro–optics were designed to guide all light from a target star enteringthe telescope aperture (even with changing incident angles due to spacecraftpointing errors) to the same set of pixels on the CCD. The stellar signal in thetarget pixels is nearly independent of the small level of satellite pointing jitter.
Photometry obtained from MOST includes a periodic, amplitude–modulatedsignal due to stray light entering the instrument from scattered Earthshine. Thestray light variation has a non–sinusoidal shape and its amplitude and shapedepend on the observing season, the location of the star relative to the illu-minated limb of the Earth, and the orientation (roll) of the spacecraft. Therelative effect of the stray light depends also on the brightness of the star. Themost obvious effect of the stray light variation in frequency analysis of MOSTdata is a set of peaks in the Fourier domain at the MOST orbital frequency andits harmonics. Matthews et al. (2004) aggressively removed the power at thosefrequencies by treating the 2004 Procyon data with a running mean filter tunedto the orbital frequency of about 165 µHz. Guenther et al. (2005) applied adifferent reduction scheme, described in detail in Reegen et al. (2006), whichlooks for the correlation between the stray light signal in the target pixels andthe stray light signal in the background pixels.
Because stray light does not uniformly illuminate the CCD, it is difficult toeliminate all of its contributions to the stellar time series, even with pixel decor-relation, and the remaining signal can be as large as 100 ppm in some cases.Most of our post-processing of the data is focused on removing this compo-nent and to estimate the level of contributions of non-stellar signal at a given
10 Searching for p-modes in η Bootis and Procyon using MOST satellite data
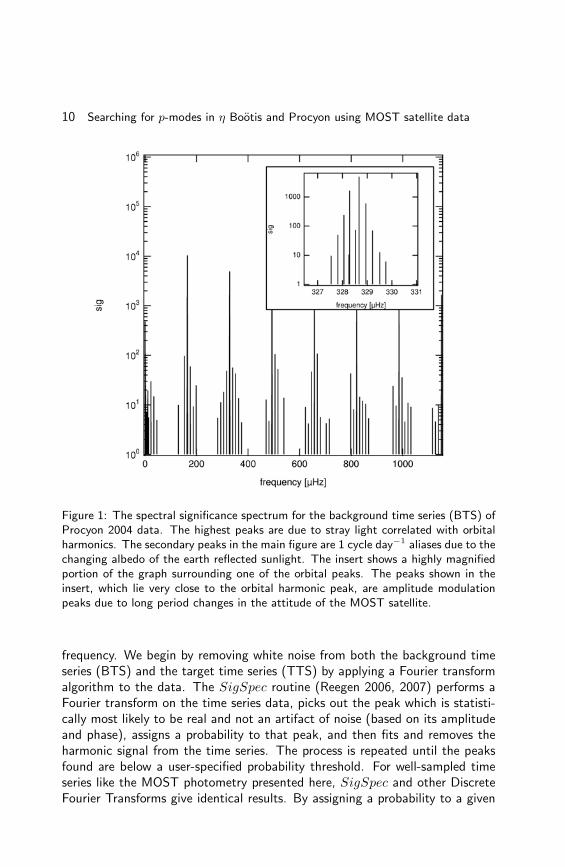
Figure 1: The spectral significance spectrum for the background time series (BTS) ofProcyon 2004 data. The highest peaks are due to stray light correlated with orbitalharmonics. The secondary peaks in the main figure are 1 cycle day−1 aliases due to thechanging albedo of the earth reflected sunlight. The insert shows a highly magnifiedportion of the graph surrounding one of the orbital peaks. The peaks shown in theinsert, which lie very close to the orbital harmonic peak, are amplitude modulationpeaks due to long period changes in the attitude of the MOST satellite.
frequency. We begin by removing white noise from both the background timeseries (BTS) and the target time series (TTS) by applying a Fourier transformalgorithm to the data. The SigSpec routine (Reegen 2006, 2007) performs aFourier transform on the time series data, picks out the peak which is statisti-cally most likely to be real and not an artifact of noise (based on its amplitudeand phase), assigns a probability to that peak, and then fits and removes theharmonic signal from the time series. The process is repeated until the peaksfound are below a user-specified probability threshold. For well-sampled timeseries like the MOST photometry presented here, SigSpec and other DiscreteFourier Transforms give identical results. By assigning a probability to a given
D. B. Guenther, T. Kallinger, P. Reegen, et al. 11
frequency (and corresponding amplitude and phase) that it is not caused bywhite noise, SigSpec allows a more rigorous statistical treatment of the result-ing amplitude spectrum. Specifically, a peak with a spectral significance equalto sig means that that signal would only occur once in 10sig random Gaussiannoise spectra. For example, a spectral significance of 6, means that that peak’samplitude, frequency and phase would only appear in one in a million Gaus-sian noise spectra. We have shown mathematically and through simulationsthat a spectral significance level (“sig”, returned by SigSpec) of 5.6 corre-sponds roughly to a signal-to-noise ratio in amplitude of 4 for a non-modulatedperiodic wave (Reegen 2005, 2006).
Peaks with high spectral significance are very unlikely to be caused by whitenoise. Not all noise is white, nor is it necessarily all due to instrumental effects.For example, stars like Procyon and η Boo have surface convection zones, whichproduce granulation noise in the photometry whose amplitude will increase withdecreasing frequency.
After applying SigSpec to the BTS in a threshold limited spectral signifi-cance spectrum we obtain, as presented in Section 3, only instrumental signal,as expected for the background. The same analysis applied to the TTS yieldsstellar plus instrumental signal, provided that the threshold limit is set highenough to reject random white noise. With the instrumental signal clearlyidentified in the BTS, our next step is to remove this signal from the TTS,leaving behind, presumably, the intrinsic stellar signal. In an early version ofour reduction routine, we accomplished this by removing the correspondingsignificant peaks found in the BTS from the TTS. Of course, if there is anyintrinsic stellar power coincidentally at those frequencies, it is also removed. Ashortcoming of this approach is that – formally – a tiny signal in the BTS caneliminate a large signal in the TTS, which may actually be dominated by thestellar variations. To address this possibility, we transformed a given measuredBTS signal amplitude to the (usually higher) intensity level of the TTS andassumed that stray light components are additive in the TTS.
Recognizing Artifacts in the data
Background signal
The background intensity consists mainly of three components: the bias level ofthe CCD, the stray light signal, and (as a minor component) the sky background.The stray light signal increases linearly with the exposure time while the biaslevel remains approximately constant.
After applying our analysis to the BTS of the 2004 Procyon observations,we obtain the spectral significance spectrum shown in Figure 1 (for spectral
12 Searching for p-modes in η Bootis and Procyon using MOST satellite data
significances ≥ 4). The largest significant peaks correspond to the expectedorbital harmonics. The smaller peaks surrounding the largest peaks are sidelobes separated by multiples of 1 cycle day−1. The amplitude of the stray lightis modulated by both the orbital period of the satellite and its Sun-synchronousnature, which brings MOST over a similar part of the Earth after one day, sosimilar albedo features affect the stray light as they rotate into view. There isadditional structure (see inset in Figure 1) associated with the slower modulationof the stray light signal during the long observing run, as the orientation of thesatellite orbit and the position of the star with respect to the illuminated Earthchange. All of the peaks in the background spectrum, except those at very lowfrequencies near 0 µHz, are associated with stray light. The largest peaks atthe orbital frequency and its first harmonic have amplitudes of 13.9 mmag and6.4 mmag, respectively.
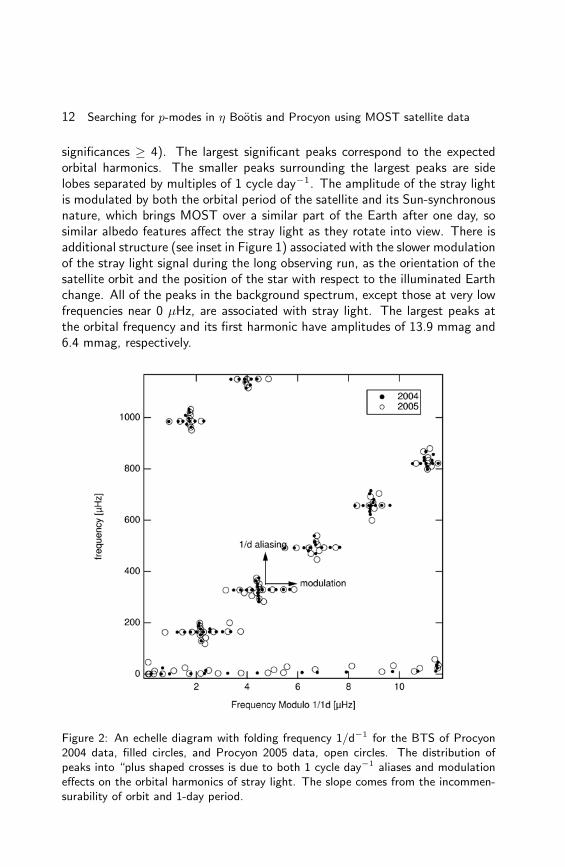
Figure 2: An echelle diagram with folding frequency 1/d−1 for the BTS of Procyon2004 data, filled circles, and Procyon 2005 data, open circles. The distribution ofpeaks into “plus shaped crosses is due to both 1 cycle day−1 aliases and modulationeffects on the orbital harmonics of stray light. The slope comes from the incommen-surability of orbit and 1-day period.
D. B. Guenther, T. Kallinger, P. Reegen, et al. 13
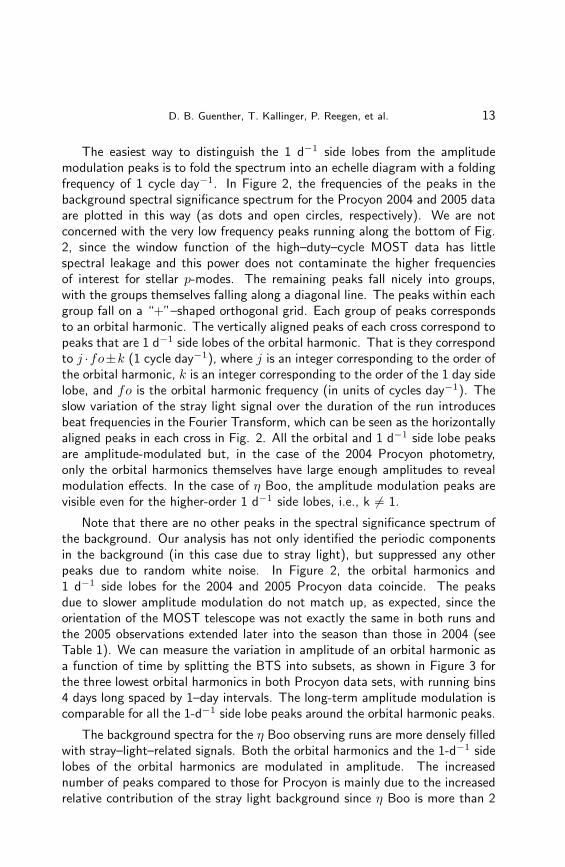
The easiest way to distinguish the 1 d−1 side lobes from the amplitudemodulation peaks is to fold the spectrum into an echelle diagram with a foldingfrequency of 1 cycle day−1. In Figure 2, the frequencies of the peaks in thebackground spectral significance spectrum for the Procyon 2004 and 2005 dataare plotted in this way (as dots and open circles, respectively). We are notconcerned with the very low frequency peaks running along the bottom of Fig.2, since the window function of the high–duty–cycle MOST data has littlespectral leakage and this power does not contaminate the higher frequenciesof interest for stellar p-modes. The remaining peaks fall nicely into groups,with the groups themselves falling along a diagonal line. The peaks within eachgroup fall on a “+”–shaped orthogonal grid. Each group of peaks correspondsto an orbital harmonic. The vertically aligned peaks of each cross correspond topeaks that are 1 d−1 side lobes of the orbital harmonic. That is they correspondto j ·fo±k (1 cycle day−1), where j is an integer corresponding to the order ofthe orbital harmonic, k is an integer corresponding to the order of the 1 day sidelobe, and fo is the orbital harmonic frequency (in units of cycles day−1). Theslow variation of the stray light signal over the duration of the run introducesbeat frequencies in the Fourier Transform, which can be seen as the horizontallyaligned peaks in each cross in Fig. 2. All the orbital and 1 d−1 side lobe peaksare amplitude-modulated but, in the case of the 2004 Procyon photometry,only the orbital harmonics themselves have large enough amplitudes to revealmodulation effects. In the case of η Boo, the amplitude modulation peaks arevisible even for the higher-order 1 d−1 side lobes, i.e., k 6= 1.
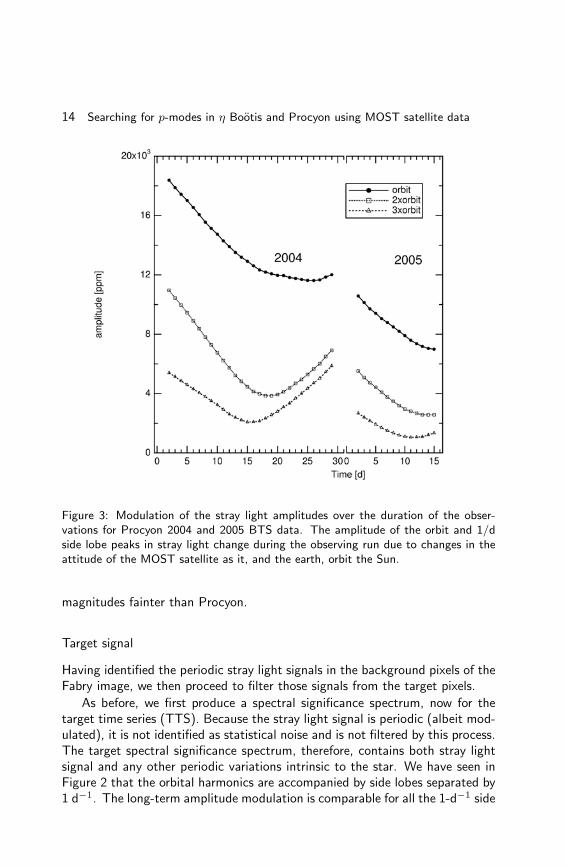
Note that there are no other peaks in the spectral significance spectrum ofthe background. Our analysis has not only identified the periodic componentsin the background (in this case due to stray light), but suppressed any otherpeaks due to random white noise. In Figure 2, the orbital harmonics and1 d−1 side lobes for the 2004 and 2005 Procyon data coincide. The peaksdue to slower amplitude modulation do not match up, as expected, since theorientation of the MOST telescope was not exactly the same in both runs andthe 2005 observations extended later into the season than those in 2004 (seeTable 1). We can measure the variation in amplitude of an orbital harmonic asa function of time by splitting the BTS into subsets, as shown in Figure 3 forthe three lowest orbital harmonics in both Procyon data sets, with running bins4 days long spaced by 1–day intervals. The long-term amplitude modulation iscomparable for all the 1-d−1 side lobe peaks around the orbital harmonic peaks.
The background spectra for the η Boo observing runs are more densely filledwith stray–light–related signals. Both the orbital harmonics and the 1-d−1 sidelobes of the orbital harmonics are modulated in amplitude. The increasednumber of peaks compared to those for Procyon is mainly due to the increasedrelative contribution of the stray light background since η Boo is more than 2
14 Searching for p-modes in η Bootis and Procyon using MOST satellite data
Figure 3: Modulation of the stray light amplitudes over the duration of the obser-vations for Procyon 2004 and 2005 BTS data. The amplitude of the orbit and 1/dside lobe peaks in stray light change during the observing run due to changes in theattitude of the MOST satellite as it, and the earth, orbit the Sun.
magnitudes fainter than Procyon.
Target signal
Having identified the periodic stray light signals in the background pixels of theFabry image, we then proceed to filter those signals from the target pixels.
As before, we first produce a spectral significance spectrum, now for thetarget time series (TTS). Because the stray light signal is periodic (albeit mod-ulated), it is not identified as statistical noise and is not filtered by this process.The target spectral significance spectrum, therefore, contains both stray lightsignal and any other periodic variations intrinsic to the star. We have seen inFigure 2 that the orbital harmonics are accompanied by side lobes separated by1 d−1. The long-term amplitude modulation is comparable for all the 1-d−1 side
D. B. Guenther, T. Kallinger, P. Reegen, et al. 15
lobes around each orbital harmonic. Therefore, most of the beat frequenciesproduced by that modulation have at least one companion 1 d−1 away, withina conservative frequency resolution given by ±1/(time span of the data). Weassume that each peak in the target spectral significance spectrum which ispart of a 1-d−1 pair is due to remaining stray light signal and we reject both.We stress that these pairs are not due to daily aliases produced by the spectralwindow function, as is a problem for ground-based observations, since MOSTobservations do not have daily gaps.
Not all stray light components are parts of 1-d−1 pairs. To filter out theremaining stray light signal, we search through the residual target spectral sig-nificance spectrum, identify and remove all peaks from the spectrum that matchpeaks in the background spectral significance spectrum. We consider peaks tomatch if their frequencies agree within the frequency resolution (see Table 1).This approach, unfortunately, may also remove any intrinsic stellar signal nearthose frequencies. To avoid removing a high amplitude target peak just becauseit is located close to the frequency of a very low amplitude background peak, wecompare the amplitudes and re-introduce the removed frequency if the removedfrequency’s amplitude is much greater than the background peak’s amplitude.
The approximate percentages of significant peaks we identify as instrumen-tal and remove are: Procyon 2004, 70.3%; Procyon 2005, 74.4%, η Boo 200485%, and η Boo 2005, 84.6%. The approximate percentages of the frequencyranges covered by these instrumental signals (taking into account the inherentfrequency resolutions of the data sets) are: Procyon 2004, 5.3%; Procyon 2005,9.3%; η Boo 2004, 49.8% and η Boo 2005, 42.1%. If p-modes are present inour target spectral significance spectra, then these latter percentages representapproximately the percentage of p-mode peaks which have likely been filteredout along with the stray light signal.
Searching for p-modes
No p-modes in Procyon
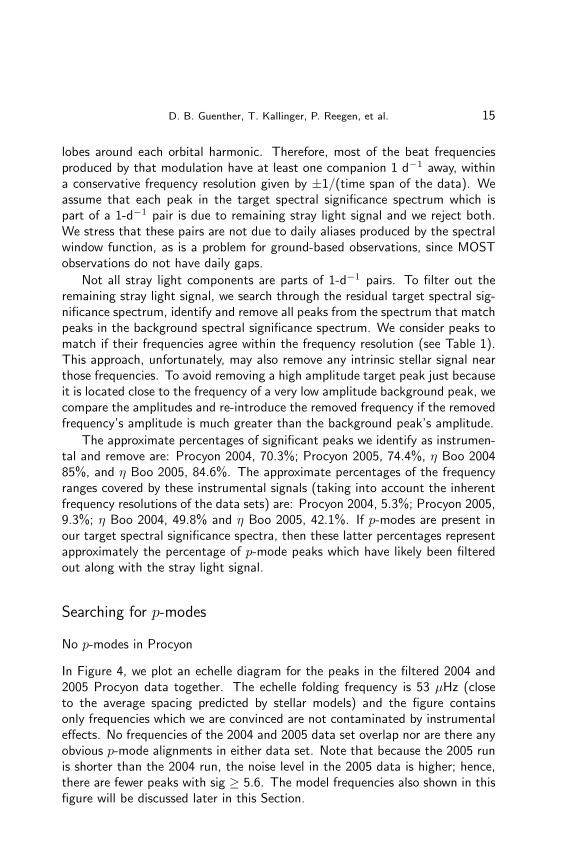
In Figure 4, we plot an echelle diagram for the peaks in the filtered 2004 and2005 Procyon data together. The echelle folding frequency is 53 µHz (closeto the average spacing predicted by stellar models) and the figure containsonly frequencies which we are convinced are not contaminated by instrumentaleffects. No frequencies of the 2004 and 2005 data set overlap nor are there anyobvious p-mode alignments in either data set. Note that because the 2005 runis shorter than the 2004 run, the noise level in the 2005 data is higher; hence,there are fewer peaks with sig ≥ 5.6. The model frequencies also shown in thisfigure will be discussed later in this Section.
16 Searching for p-modes in η Bootis and Procyon using MOST satellite data
Figure 4: An echelle diagram comparing the Procyon 2004, filled circles, and Procyon2005, filled triangles, spectral significance spectra to p-modes of models of Procyon(open symbols). The model mode frequencies are the average of all models that liewithin 1σ of Procyons mass, luminosity, and effective temperature (see Table 2). Theerror bars show the range of frequencies for each mode for models that lie within 1σof Procyons mass, luminosity, and effective temperature.
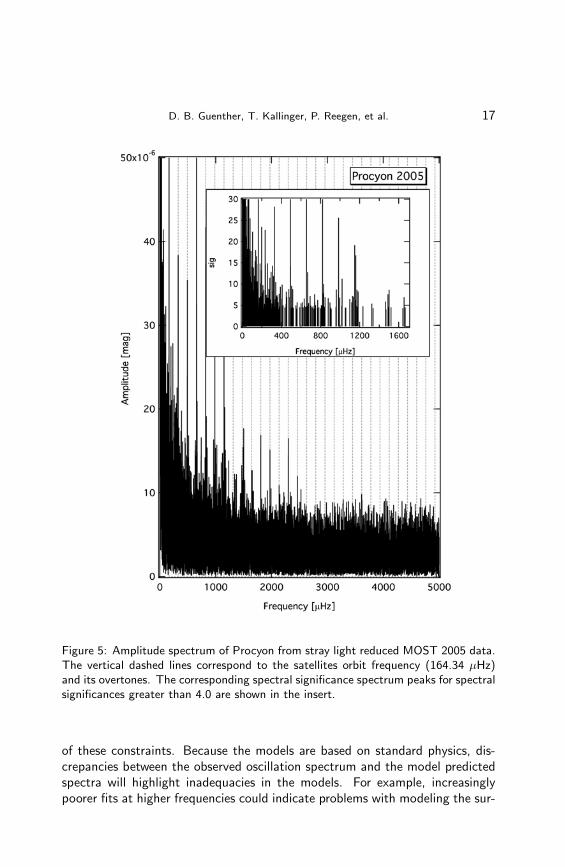
Ignoring the stray light and considering only true statistical noise for the2004 Procyon data, the lowest peaks we can identify above the noise threshold(set at sig = 4) have amplitudes of about 10 ppm. The peaks from the 2004spectrum with sig ≥ 5.6 have amplitudes ≥ 12 ppm. For the 2005 Procyondata (shown in Fig. 5), the corresponding amplitudes are about 11 ppm and 14ppm. The echelle structure of p-modes in Procyon may not exhibit as simplean asymptotic pattern as expected. To explore this, we have examined stel-lar models taken from one of the author’s (DBGs) dense and extensive grids(Guenther et al. 2005). Using typical values for the temperature, luminosityand composition of Procyon, along with a mass constraint based on its binaryorbit (Girard et al. 2000), we selected models in the grid that fall within 1σ
D. B. Guenther, T. Kallinger, P. Reegen, et al. 17
Figure 5: Amplitude spectrum of Procyon from stray light reduced MOST 2005 data.The vertical dashed lines correspond to the satellites orbit frequency (164.34 µHz)and its overtones. The corresponding spectral significance spectrum peaks for spectralsignificances greater than 4.0 are shown in the insert.
of these constraints. Because the models are based on standard physics, dis-crepancies between the observed oscillation spectrum and the model predictedspectra will highlight inadequacies in the models. For example, increasinglypoorer fits at higher frequencies could indicate problems with modeling the sur-
18 Searching for p-modes in η Bootis and Procyon using MOST satellite data
face layers, such as those implied by the 0.25% discrepancy that exists betweenthe Sun’s observed frequencies and those of the standard solar model (Guenther& Brown, 2004). The adopted stellar parameters are listed in Table 2, and theaverage values (and standard deviations) of key properties of the best modelsare given in Table 3. Those properties are: mass, age, log effective temperature(log Teff), log luminosity (log L/L�), mass of the convective envelope (MCE),mass of the convective core (MCC), acoustic cut-off frequency (νcutoff), charac-teristic p-mode frequency spacing (∆ν), characteristic g-mode period spacing(∆Π), average large l = 0 frequency separation (< ∆ν0 >), average large l = 1frequency separation (< ∆ν1 >), and average small l = 0 frequency separation(< δν0 >). The spacings are averaged over radial orders n = 10–30. For eachset of constraints, properties are listed for the closest model and the averageof all the models that lie within 1σ of the constraints. The uncertainties arestandard deviations of the averages. The LT and LTM labels identify the con-straints used on the models, with LT corresponding to luminosity and effectivetemperature and LTM corresponding to luminosity, effective temperature, andmass. The constraints are the uncertainties in Table 2.
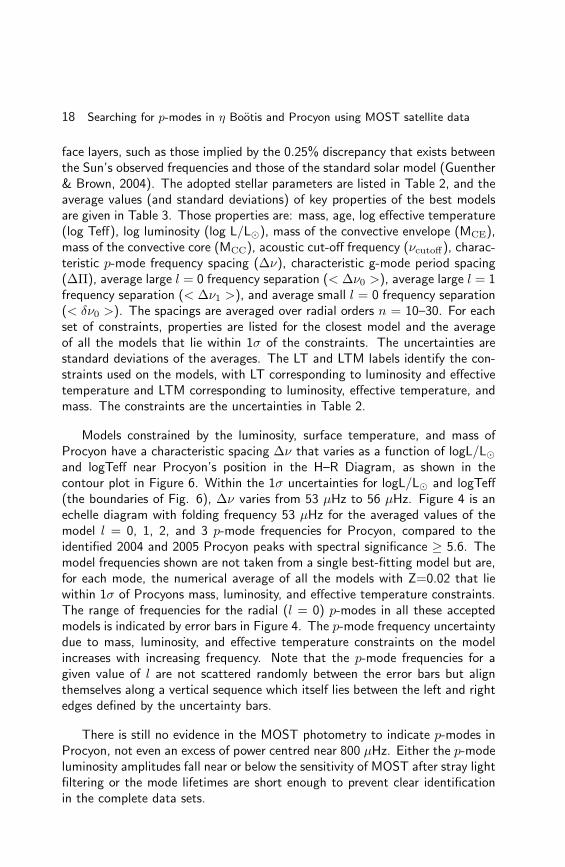
Models constrained by the luminosity, surface temperature, and mass ofProcyon have a characteristic spacing ∆ν that varies as a function of logL/L�and logTeff near Procyon’s position in the H–R Diagram, as shown in thecontour plot in Figure 6. Within the 1σ uncertainties for logL/L� and logTeff(the boundaries of Fig. 6), ∆ν varies from 53 µHz to 56 µHz. Figure 4 is anechelle diagram with folding frequency 53 µHz for the averaged values of themodel l = 0, 1, 2, and 3 p-mode frequencies for Procyon, compared to theidentified 2004 and 2005 Procyon peaks with spectral significance ≥ 5.6. Themodel frequencies shown are not taken from a single best-fitting model but are,for each mode, the numerical average of all the models with Z=0.02 that liewithin 1σ of Procyons mass, luminosity, and effective temperature constraints.The range of frequencies for the radial (l = 0) p-modes in all these acceptedmodels is indicated by error bars in Figure 4. The p-mode frequency uncertaintydue to mass, luminosity, and effective temperature constraints on the modelincreases with increasing frequency. Note that the p-mode frequencies for agiven value of l are not scattered randomly between the error bars but alignthemselves along a vertical sequence which itself lies between the left and rightedges defined by the uncertainty bars.
There is still no evidence in the MOST photometry to indicate p-modes inProcyon, not even an excess of power centred near 800 µHz. Either the p-modeluminosity amplitudes fall near or below the sensitivity of MOST after stray lightfiltering or the mode lifetimes are short enough to prevent clear identificationin the complete data sets.
D. B. Guenther, T. Kallinger, P. Reegen, et al. 19
Figure 6: A contour plot showing the characteristic spacing ∆ν for models of Procyonin the vicinity of its position in the HR-diagram. The log Teff and log L/L� axis rangescorrespond to the 1σ box around Procyons HR-diagram location. The contour labelsare in units of µHz.
Possible p-modes in η Boo
We carried out identical filtering of the data for this star to remove first thed−1 multiplets, then the remaining background peaks. The more aggressivestray light filtering performed for the present study has eliminated all the peaksidentified in 2004 as radial modes. Although these frequencies may still containa significant amount of stellar signal, we are unable to confirm this. The echellediagram of the identified intrinsic peaks in the MOST η Boo photometry isplotted in Figure 7.
For the 2004 η Boo data, the lowest peaks we can identify above the noisethreshold set at sig = 4 have amplitudes of about 7 ppm. The 2004 peaks usedfor Fig. 7 with sig ≥ 5.6 have amplitudes ≥ 9 ppm. For the 2005 data (seeFig. 8), the lowest peaks above the noise threshold (sig = 4) have amplitudes
20 Searching for p-modes in η Bootis and Procyon using MOST satellite data
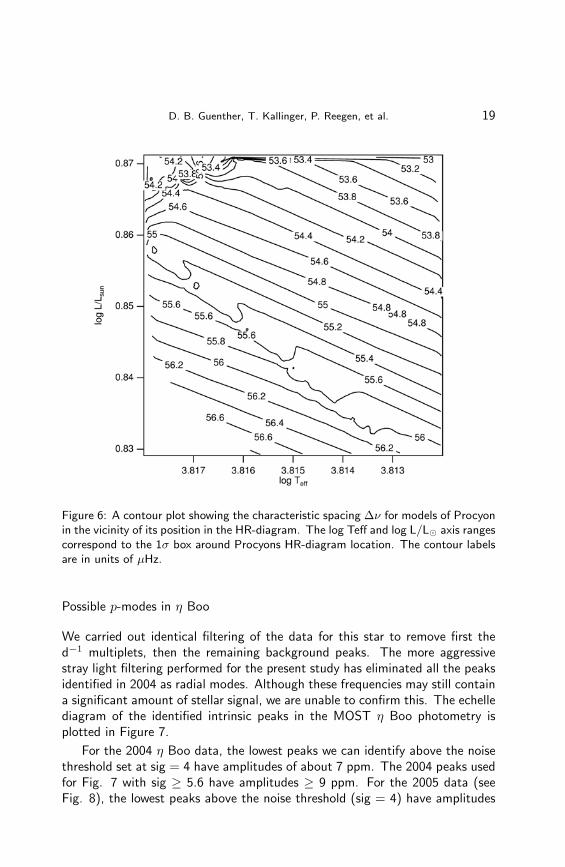
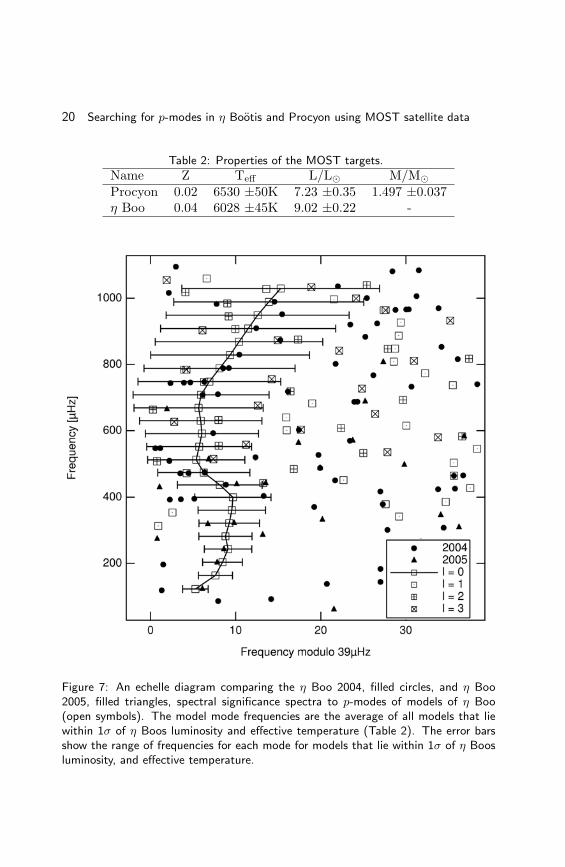
Table 2: Properties of the MOST targets.
Name Z Teff L/L� M/M�Procyon 0.02 6530 ±50K 7.23 ±0.35 1.497 ±0.037η Boo 0.04 6028 ±45K 9.02 ±0.22 -
Figure 7: An echelle diagram comparing the η Boo 2004, filled circles, and η Boo2005, filled triangles, spectral significance spectra to p-modes of models of η Boo(open symbols). The model mode frequencies are the average of all models that liewithin 1σ of η Boos luminosity and effective temperature (Table 2). The error barsshow the range of frequencies for each mode for models that lie within 1σ of η Boosluminosity, and effective temperature.
D. B. Guenther, T. Kallinger, P. Reegen, et al. 21
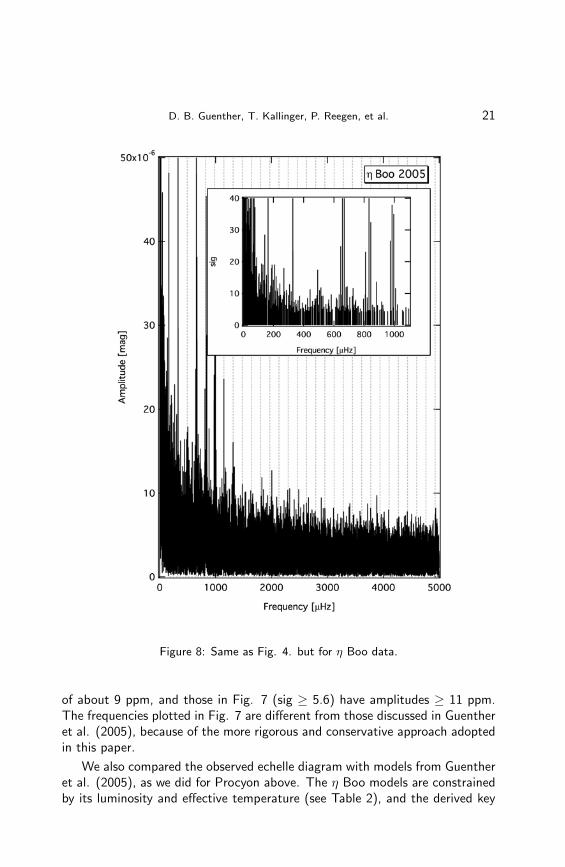
Figure 8: Same as Fig. 4. but for η Boo data.
of about 9 ppm, and those in Fig. 7 (sig ≥ 5.6) have amplitudes ≥ 11 ppm.The frequencies plotted in Fig. 7 are different from those discussed in Guentheret al. (2005), because of the more rigorous and conservative approach adoptedin this paper.
We also compared the observed echelle diagram with models from Guentheret al. (2005), as we did for Procyon above. The η Boo models are constrainedby its luminosity and effective temperature (see Table 2), and the derived key
22 Searching for p-modes in η Bootis and Procyon using MOST satellite data
model parameters are shown in Table 3. Figure 7 also compares the averagedp-mode frequencies of the best-fitted models and the frequencies of the peaksin the 2004 and 2005 η Boo data sets with spectral significance ≥ 5.6. η Boohas a more evolved core; hence, the nonradial p-modes are subject to modebumping. As a consequence, the l = 1, 2 and 3 p-mode sequences do not fallalong easily identifiable vertical sequences. Additionally, as noted in Guenther etal. (2005), the nonradial p-mode frequencies that are bumped are very sensitiveto the age, mass, and composition of the model. Both effects in combinationmake model comparisons difficult. The radial p-modes identified in Guenther etal. (2005) lie outside of the indicated error bars, consistent with the fact thatthe best model fit to these modes was also just outside the 1σ observationaluncertainty error box.
Constraints on mode lifetimes?
Since we do not see a clear radial (l = 0) sequence in any of our echellediagrams for Procyon or η Boo, what is the origin of the peaks that remainin the target signal spectral significance spectrum after the background peakshave been removed? It seems unlikely that the remaining peaks are due to straylight since our identification of stray light in the background time series (BTS)is very effective. If they are intrinsic to the star, why do the observations fromtwo epochs a year apart for the same star show so few frequencies in common(while the background spectral significance spectra for the same star in the twoepochs are nearly identical)? Could this be a consequence of p-modes in thesestars having short lifetimes?
Because the convective envelopes are shallow in these stars, the supera-diabatic limit is closer to the optically thin surface than in the Sun, and thep-modes are subject to stronger radiative damping. This shortens their lifetimescompared to solar p-modes. The short lifetimes cause the amplitudes of themodes to vary on similar time scales, which in turn leads to modulation effectsin the Fourier transform spectrum. The modulation effects include both split-ting and smearing of the peaks. We must add that short 2 day variations couldalso be a consequence of variations in the forcing function itself. Robinsonet al. (2005) found in their 3D numerical simulations of convection that thesuperadiabatic layer, the layer that provides most of the force driving turbu-lent convective motions, itself oscillates into and out of the very thin surfaceconvective envelope in Procyon.
In an attempt to see if the identified peaks are the consequence of modu-lated amplitudes, we applied a running window 6 days wide to the TTS (targettime series) of each star, and then applied our analysis routine to each windoweddata set. We show a portion of the resulting time-evolving spectral significance
D. B. Guenther, T. Kallinger, P. Reegen, et al. 23
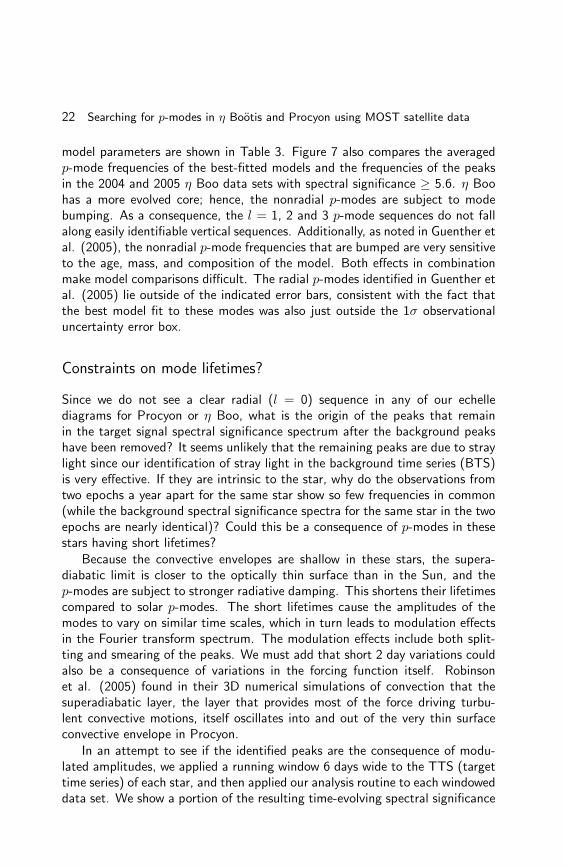
Figure 9: An intensity plot showing the changing amplitudes (and frequencies), overtime, of peaks in the spectral significance spectrum of η Boo 2004 data. As individualpeaks rise and fall in amplitude, they can shift in frequency and split into multiplepeaks in the Fourier domain. Only a small portion of the spectral significance spectrumis shown.
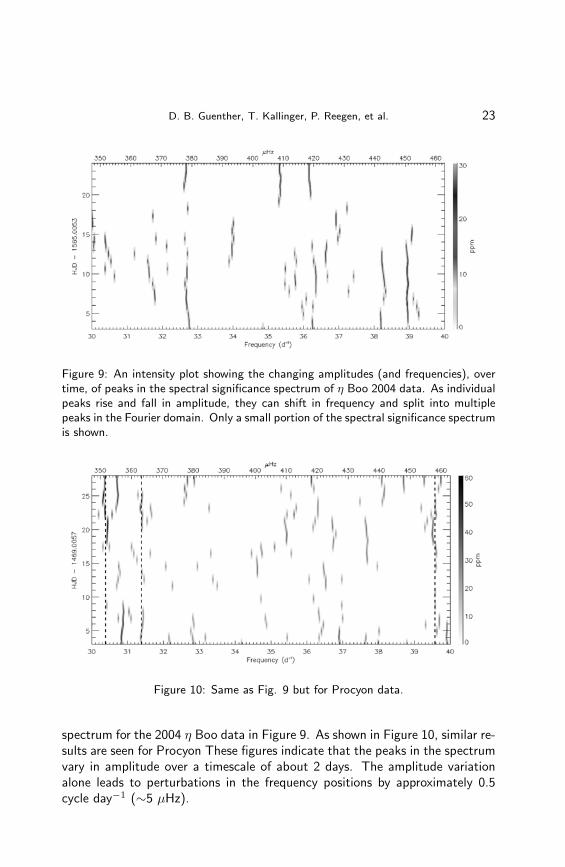
Figure 10: Same as Fig. 9 but for Procyon data.
spectrum for the 2004 η Boo data in Figure 9. As shown in Figure 10, similar re-sults are seen for Procyon These figures indicate that the peaks in the spectrumvary in amplitude over a timescale of about 2 days. The amplitude variationalone leads to perturbations in the frequency positions by approximately 0.5cycle day−1 (∼5 µHz).
24 Searching for p-modes in η Bootis and Procyon using MOST satellite data
If the peaks are p-modes and the modulation is intrinsic, then one has todramatically expand the duration of the observation to give the damped and re–excited modes a chance to form well-defined Lorentzian profiles in the Fourierdomain. If the length of observations is comparable to a modes lifetime (oronly a few times longer) then the modes peak can fall over a relatively widerange of frequencies around the modes true frequency.
Conclusions
Analysis of the 2005 MOST photometry of Procyon and reanalysis of the 2004data for that star reinforce the null p-mode detection reported by Matthews etal. (2004). The same type of analysis for the 2004 and 2005 MOST photometryof η Boo confirms the excess of power in the frequency range expected for p-modes but there is little agreement between identified frequencies in the twoepochs. Our analysis suggests that the p-mode lifetimes in η Boo may be asshort as about 2 days, which could account for the epoch-to-epoch differences.The groundbased spectroscopic campaigns on η Boo carried out by Kjeldsen etal. (2003) and Carrier et al. (2005) also do not identify the same frequenciesin that star from epoch to epoch, which is also consistent with short modelifetimes.
We have applied a more rigorous and conservative approach to stray lightreduction than those used originally for the Procyon 2004 data (Matthews etal. 2004) and for the η Boo 2004 data (Guenther et al. 2005). In the formercase, the high brightness of Procyon reduces the relative stray light effects,and our analysis affects only about 5-10% of the frequency range relevant forp-mode detection. In the case of the fainter η Boo, the new more aggressivetreatment of stray light modulation gives a more robust identification of theintrinsic stellar frequencies. However, for this star, up to about 50% of therelevant frequency range may be affected.
We have produced p-mode model eigenspectra for Procyon and η Boo basedon observed parameters of the two stars. However, the models cannot validatethe frequency identifications in η Boo because the uncertainties in model pa-rameters are too large. Even if we had evidence of p-modes in the photometryof Procyon, whose mass is well determined by its binary orbit, the uncertaintiesin the model eigenfrequencies would present a challenge to asteroseismic fitting.The possibility of short mode lifetimes makes the challenge even more severe.
The data presented here for Procyon and η Boo are available for down-load from the MOST Public Data Archive through the Science link at http ://www.astro.ubc.ca/MOST .
D. B. Guenther, T. Kallinger, P. Reegen, et al. 25
Acknowledgments. The Natural Sciences and Engineering Research Coun-cil of Canada supports the research of D.B.G., J.M.M., A.F.J.M., S.M.R.,G.A.H.W. A.F.J.M. is also supported by FQRNT (Quebec), and R.K. is sup-ported by the Canadian Space Agency. T.K, P.R. and W.W.W. are supportedby the Austrian Research Promotion Agency (FFG), and the Austrian Sci-ence Fund (FWF P17580). The MOST Science Team would like to thankSergey Marchenko (Western Kentucky University) for providing separate anal-ysis stream results.
References
Brown, T. M., Gilliland, R. L., Noyes, R. W., & Ramsey, L. W. 1991, ApJ 368, 599
Carrier, F., Eggenberger, P., & Bouchy, F. 2005 A&A 434, 1085 (C05)
Chaboyer, B., Demarque, P., & Guenther, D.B. 1999, ApJ 525, 41
Christensen-Dalsgaard, J., & Frandsen, S. 1993, Solar Phys. 82, 469
Eggenberger, P., Carrier, F., Bouchy, F., & Blecha, A. 2004, A&A 422, 247
Girard, T. M., Wu, H., Lee, J. T., , et al. 2000, AJ 119, 2428
Guenther, D. B., & Brown, K. 2004, ApJ 600, 419
Guenther, D. B., Kallinger, T., Reegen, P., et al. 2005, ApJ 635, 547
Houdek, G., Balmforth, N. J., Christensen-Dalsgaard, J., & Gough, D. O. 1999,AAP 351, 582
Kjeldsen, H., & Bedding, T. R. 1995, A&A 293, 87
Kjeldsen, H., Bedding, T. R., Baldry, I. K., et al. 2003, AJ 126, 1483
Matthews, J. M., Kuschnig, R., Guenther, D. B., et al. 2004, Nature 430, 51
Martic, M., Schmitt, J., Lebrun, J. C., et al. 1999, A&A 351, 993
Reegen, P. 2005, Proceedings of the International Astronomical Union, Vol. 2004,No IAUS224, 791, (Cambridge: Cambridge University Press), also,http : //journals.cambridge.org/jidIAU
Reegen, P. 2006, Ph.D. dissertation, University of Vienna
Reegen, P. 2007, A&A 467, 1353
Robinson, F. J., Demarque, P., Guenther, D. B., et al. 2005, MNRAS 362, 1031
Rucinski, S. M., Walker, G. A. H., Matthews, J. M., et al. 2004, PASP 116, 1093
Walker, G. A. H., Matthews, J. M., Kuschnig, R., et al. 2003, PASP 115, 1023