
Search for Higgs bosons decaying to aa in the final state ... · USLUA, November 2015 B. Kaplan...
17
Search for Higgs bosons decaying to aa in the μμτ τ final state in pp collisions at √ s = 8 TeV with the ATLAS experiment Phys. Rev. D 92, 05002 B. Kaplan (NYU) November , 2015 USLUA, November 2015 B. Kaplan (NYU) [email protected] 1
Transcript of Search for Higgs bosons decaying to aa in the final state ... · USLUA, November 2015 B. Kaplan...
Search for Higgs bosons decaying to aa in theµµττ final state in pp collisions at
√s = 8 TeV
with the ATLAS experimentPhys. Rev. D 92, 05002
B. Kaplan (NYU)
November , 2015
USLUA, November 2015 B. Kaplan (NYU) [email protected] 1
Physics Motivation
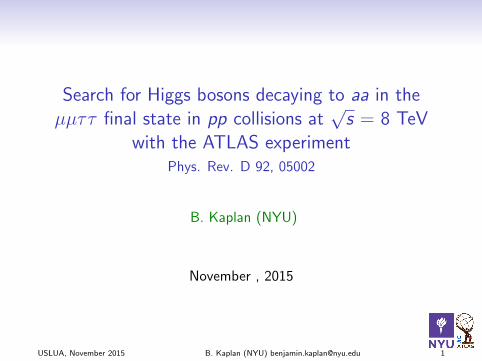
Exotic Decay of SM-like Higgs, h
Coupling measurements allow for
non-SM decays up to BR ∼ O(40%),
at 95% CL
Consider a new pseudo-scalar Higgs boson, a
• Focus on, i.e. optimize selection for, 2 ·mτ < ma < 2 ·mb
Leptons from a decay will be highly collimated
We extend analysis above 2 ·mb in case couplings to quarks are suppressed
• Coupling related to mass of decay products ⇒ large BR(a→ ττ) at low mass
• a→ µµ gives a narrow resonance ⇒ clean experimental signature
• One previous search for this signature from D∅, which had no sensitivity
The Next-to-Minimal-Supersymmetric Standard Model
• The NMSSM is a well-motivated (and quite popular) SUSY modelD. Curtin et. al., Phys. Rev. D 90, no. 7, 075004 (2014)
• Naturally achieves mh = 125 GeV
• Notable in that it predicts an additional light pseudoscalar Higgs bosons (a)• Also predicts another scalar Higgs, H, which can decay H → aa
USLUA, November 2015 B. Kaplan (NYU) [email protected] 2
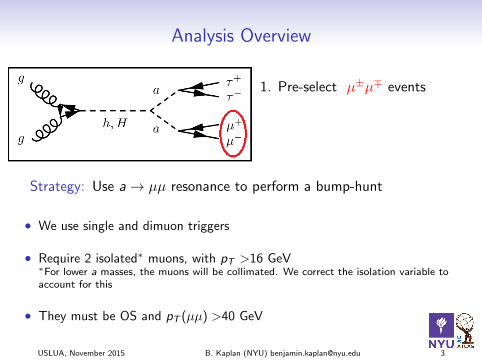
Analysis Overview
1. Pre-select µ±µ∓ events
2. Signal Selection: µ±µ∓+`±trk∓
3. Validation: µ±µ∓+`±trk±
4. Control: µ±µ∓+(b-)jets
Strategy: Use a→ µµ resonance to perform a bump-hunt
• We use single and dimuon triggers
• Require 2 isolated∗ muons, with pT >16 GeV∗For lower a masses, the muons will be collimated. We correct the isolation variable toaccount for this
• They must be OS and pT (µµ) >40 GeV
USLUA, November 2015 B. Kaplan (NYU) [email protected] 3
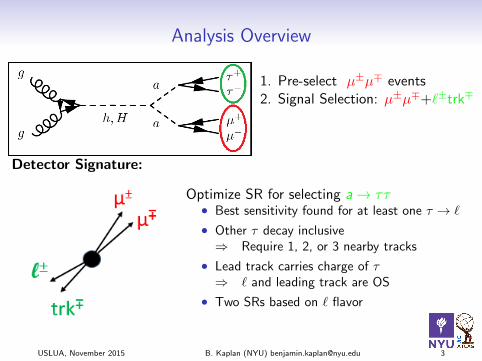
Analysis Overview
1. Pre-select µ±µ∓ events2. Signal Selection: µ±µ∓+`±trk∓
3. Validation: µ±µ∓+`±trk±
4. Control: µ±µ∓+(b-)jets
Detector Signature:
Optimize SR for selecting a→ ττ• Best sensitivity found for at least one τ → `
• Other τ decay inclusive⇒ Require 1, 2, or 3 nearby tracks
• Lead track carries charge of τ⇒ ` and leading track are OS
• Two SRs based on ` flavor
USLUA, November 2015 B. Kaplan (NYU) [email protected] 3
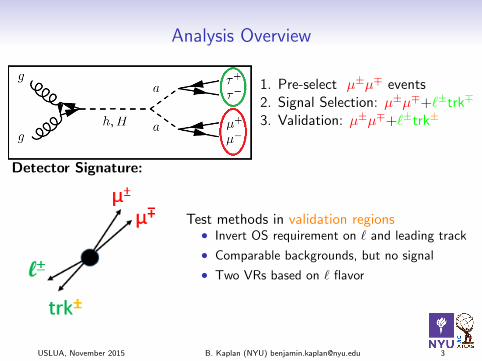
Analysis Overview
1. Pre-select µ±µ∓ events2. Signal Selection: µ±µ∓+`±trk∓
3. Validation: µ±µ∓+`±trk±
4. Control: µ±µ∓+(b-)jets
Detector Signature:
Test methods in validation regions• Invert OS requirement on ` and leading track
• Comparable backgrounds, but no signal
• Two VRs based on ` flavor
USLUA, November 2015 B. Kaplan (NYU) [email protected] 3
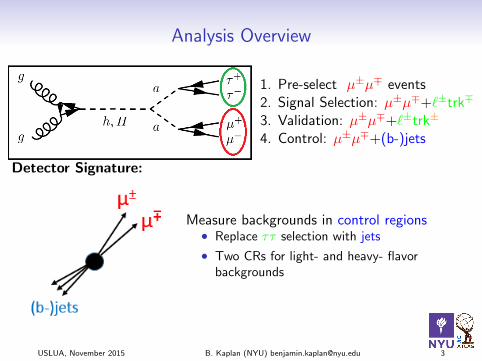
Analysis Overview
1. Pre-select µ±µ∓ events2. Signal Selection: µ±µ∓+`±trk∓
3. Validation: µ±µ∓+`±trk±
4. Control: µ±µ∓+(b-)jets
Detector Signature:
Measure backgrounds in control regions• Replace ττ selection with jets
• Two CRs for light- and heavy- flavorbackgrounds
USLUA, November 2015 B. Kaplan (NYU) [email protected] 3
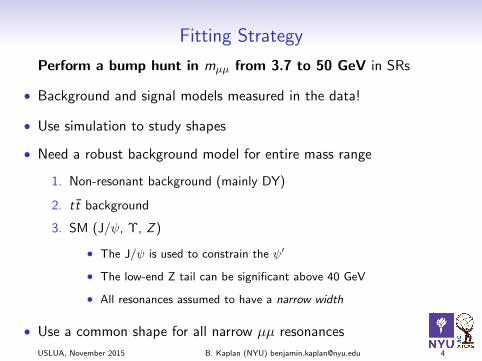
Fitting Strategy
Perform a bump hunt in mµµ from 3.7 to 50 GeV in SRs
• Background and signal models measured in the data!
• Use simulation to study shapes
• Need a robust background model for entire mass range
1. Non-resonant background (mainly DY)
2. tt̄ background
3. SM (J/ψ, Υ, Z )
• The J/ψ is used to constrain the ψ′
• The low-end Z tail can be significant above 40 GeV
• All resonances assumed to have a narrow width
• Use a common shape for all narrow µµ resonances
USLUA, November 2015 B. Kaplan (NYU) [email protected] 4
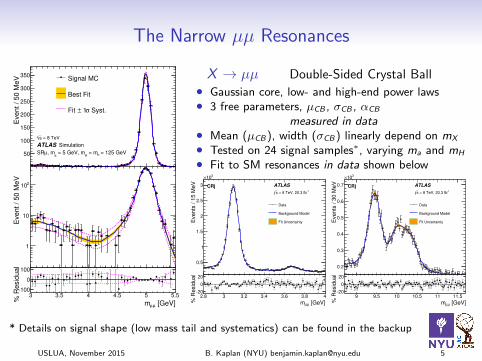
The Narrow µµ Resonances
[GeV]µµm3 3.5 4 4.5 5 5.5
% R
esid
ua
l
100
0
100~~
Event / 50 M
eV
1
10
210
Eve
nt
/ 5
0 M
eV
50
100
150
200
250
300
350
Signal MC
Best Fit
Syst.σ 1±Fit
= 125 GeVh = mH
= 5 GeV, ma
, mµSR
ATLAS Simulation
= 8 TeVs
X → µµ Double-Sided Crystal Ball• Gaussian core, low- and high-end power laws• 3 free parameters, µCB , σCB , αCB
measured in data• Mean (µCB), width (σCB) linearly depend on mX
• Tested on 24 signal samples∗, varying ma and mH
• Fit to SM resonances in data shown below
2.8 3 3.2 3.4 3.6 3.8 4
Events
/ 1
5 M
eV
0.5
1
1.5
2
2.5
3
310×
Data
Background Model
Fit Uncertainty
ATLAS
1 = 8 TeV, 20.3 fbs
CRj
[GeV]µµm2.8 3 3.2 3.4 3.6 3.8 4
% R
esid
ual
20
0
20
9 9.5 10 10.5 11 11.5
Events
/ 3
0 M
eV
0.2
0.3
0.4
0.5
0.6
0.7
310×
Data
Background Model
Fit Uncertainty
ATLAS
1 = 8 TeV, 20.3 fbs
CRj
[GeV]µµm9 9.5 10 10.5 11 11.5
% R
esid
ual
20
0
20
* Details on signal shape (low mass tail and systematics) can be found in the backup
USLUA, November 2015 B. Kaplan (NYU) [email protected] 5
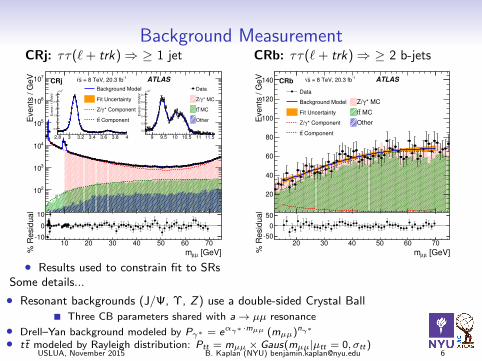
Background MeasurementCRj: ττ(`+ trk)⇒ ≥ 1 jet
Eve
nts
/ G
eV
210
310
410
510
610
710
ATLAS1
= 8 TeV, 20.3 fbsCRjBackground Model
Fit Uncertainty
* ComponentγZ/
Componenttt
Data
* MCγZ/
MCtt
Other
2.8 3 3.2 3.4 3.6 3.8 4
Events
/ 1
5 M
eV
0.5
1
1.5
2
2.5
3
310×
9 9.5 10 10.5 11 11.5E
vents
/ 3
0 M
eV
0.2
0.3
0.4
0.5
0.6
0.7
310×
[GeV]µµm10 20 30 40 50 60 70
% R
esid
ua
l
10
0
10
CRb: ττ(`+ trk)⇒ ≥ 2 b-jets
Eve
nts
/ G
eV
20
40
60
80
100
120
140
ATLAS1
= 8 TeV, 20.3 fbsCRb
Data
Background Model
Fit Uncertainty
* ComponentγZ/
Componenttt
* MCγZ/
MCtt
Other
[GeV]µµm20 30 40 50 60 70
% R
esid
ua
l
50
0
50
• Results used to constrain fit to SRsSome details...
• Resonant backgrounds (J/Ψ, Υ, Z) use a double-sided Crystal Ball
Three CB parameters shared with a→ µµ resonance
• Drell–Yan background modeled by Pγ∗ = eαγ∗ ·mµµ (mµµ)nγ∗
• tt̄ modeled by Rayleigh distribution: Ptt = mµµ × Gaus(mµµ|µtt = 0, σtt)USLUA, November 2015 B. Kaplan (NYU) [email protected] 6
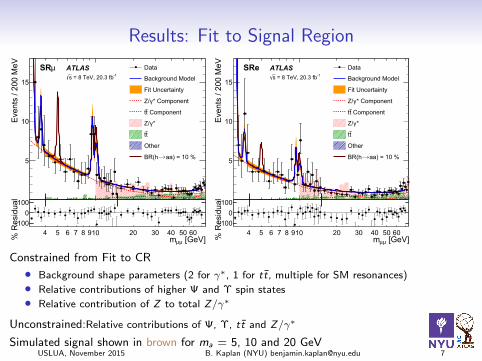
Results: Fit to Signal Region
Eve
nts
/ 200
MeV
[GeV]µµm4 5 6 7 8 910 20 30 40 50 60%
Res
idua
l
-1000
100
5
10
15
ATLAS-1 = 8 TeV, 20.3 fbs
µSR Data
Background Model
Fit Uncertainty
* ComponentγZ/
Componenttt
*γZ/
tt
Other
aa) = 10 %BR(h
Eve
nts
/ 200
MeV
[GeV]µµm4 5 6 7 8 910 20 30 40 50 60%
Res
idua
l-100
0100
5
10
15
ATLAS-1 = 8 TeV, 20.3 fbs
SRe Data
Background Model
Fit Uncertainty
* ComponentγZ/
Componenttt
*γZ/
tt
Other
aa) = 10 %BR(h
Constrained from Fit to CR
• Background shape parameters (2 for γ∗, 1 for tt̄, multiple for SM resonances)
• Relative contributions of higher Ψ and Υ spin states
• Relative contribution of Z to total Z/γ∗
Unconstrained:Relative contributions of Ψ, Υ, tt̄ and Z/γ∗
Simulated signal shown in brown for ma = 5, 10 and 20 GeVUSLUA, November 2015 B. Kaplan (NYU) [email protected] 7
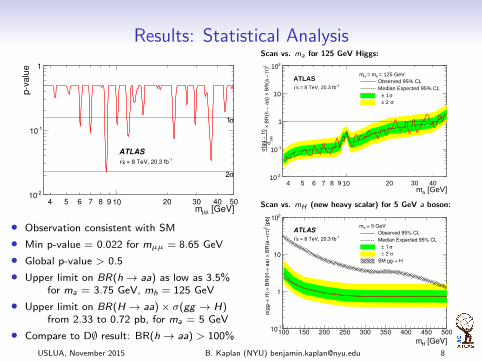
Results: Statistical Analysis
[GeV]µµm4 5 6 7 8 9 10 20 30 40 50
pv
alu
e
210
110
1
σ1
σ2
ATLAS1 = 8 TeV, 20.3 fbs
• Observation consistent with SM
• Min p-value = 0.022 for mµµ = 8.65 GeV
• Global p-value > 0.5
• Upper limit on BR(h→ aa) as low as 3.5%for ma = 3.75 GeV, mh = 125 GeV
• Upper limit on BR(H → aa)× σ(gg → H)from 2.33 to 0.72 pb, for ma = 5 GeV
• Compare to D∅ result: BR(h→ aa) > 100%
Scan vs. ma for 125 GeV Higgs:
[GeV]am4 5 6 7 8 9 10 20 30 40
2 )ττ→
BR
(a×
aa)
→
BR
(h×
SM
σ h
)→
(gg
σ
-210
-110
1
10
210 = 125 GeVh = mHmObserved 95% CLMedian Expected 95% CL
σ 1 ± σ 2 ±
ATLAS-1 = 8 TeV, 20.3 fbs
Scan vs. mH (new heavy scalar) for 5 GeV a boson:
[GeV]Hm100 150 200 250 300 350 400 450 500
[p
b]
2 )τ
τ→
BR
(a×
aa
) →
BR
(H×
H)
→(g
gσ
110
1
10
210 = 5 GeVam
Observed 95% CL
Median Expected 95% CL
σ 1 ±
σ 2 ±
H→SM gg
ATLAS1 = 8 TeV, 20.3 fbs
USLUA, November 2015 B. Kaplan (NYU) [email protected] 8
Concluding Thoughts
• These are the first limits on this well motivated channel fromthe LHC
• They are the first ever to have sensitivity to BSM physics
• The NMSSM is getting a lot of attention during Run 2, in thischannel and others, so...STAY TUNED!
USLUA, November 2015 B. Kaplan (NYU) [email protected] 9
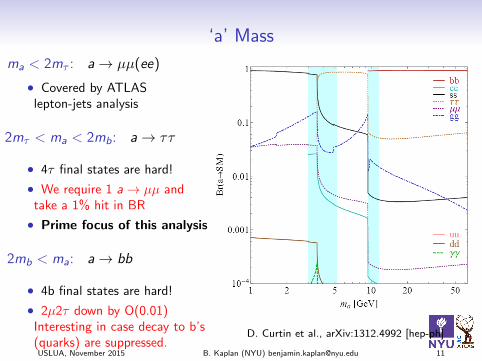
‘a’ Mass
ma < 2mτ : a→ µµ(ee)
• Covered by ATLASlepton-jets analysis
2mτ < ma < 2mb: a→ ττ
• 4τ final states are hard!
• We require 1 a→ µµ andtake a 1% hit in BR
• Prime focus of this analysis
2mb < ma: a→ bb
• 4b final states are hard!
• 2µ2τ down by O(0.01)Interesting in case decay to b’s(quarks) are suppressed.
D. Curtin et al., arXiv:1312.4992 [hep-ph]
USLUA, November 2015 B. Kaplan (NYU) [email protected] 11
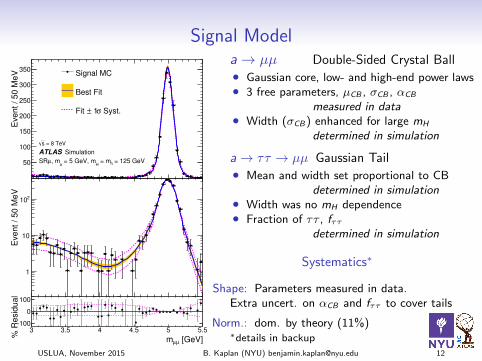
Signal Model
[GeV]µµm3 3.5 4 4.5 5 5.5
% R
esid
ual
100
0
100~~
Eve
nt
/ 5
0 M
eV
1
10
210
Event / 50 M
eV
50
100
150
200
250
300
350
Signal MC
Best Fit
Syst.σ 1±Fit
= 125 GeVh = mH
= 5 GeV, ma
, mµSR
ATLAS Simulation
= 8 TeVs
a→ µµ Double-Sided Crystal Ball• Gaussian core, low- and high-end power laws• 3 free parameters, µCB , σCB , αCB
measured in data• Width (σCB) enhanced for large mH
determined in simulation
a→ ττ → µµ Gaussian Tail• Mean and width set proportional to CB
determined in simulation• Width was no mH dependence• Fraction of ττ , fττ
determined in simulation
Systematics∗
Shape: Parameters measured in data.Extra uncert. on αCB and fττ to cover tails
Norm.: dom. by theory (11%)∗details in backup
USLUA, November 2015 B. Kaplan (NYU) [email protected] 12
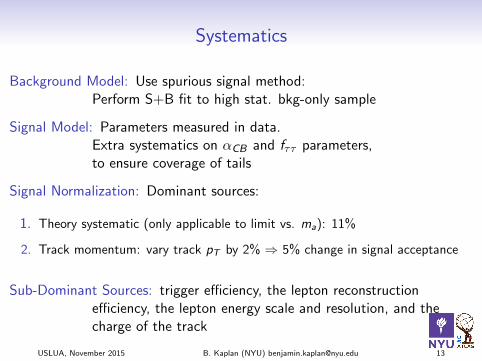
Systematics
Background Model: Use spurious signal method:Perform S+B fit to high stat. bkg-only sample
Signal Model: Parameters measured in data.Extra systematics on αCB and fττ parameters,to ensure coverage of tails
Signal Normalization: Dominant sources:
1. Theory systematic (only applicable to limit vs. ma): 11%
2. Track momentum: vary track pT by 2% ⇒ 5% change in signal acceptance
Sub-Dominant Sources: trigger efficiency, the lepton reconstructionefficiency, the lepton energy scale and resolution, and thecharge of the track
USLUA, November 2015 B. Kaplan (NYU) [email protected] 13
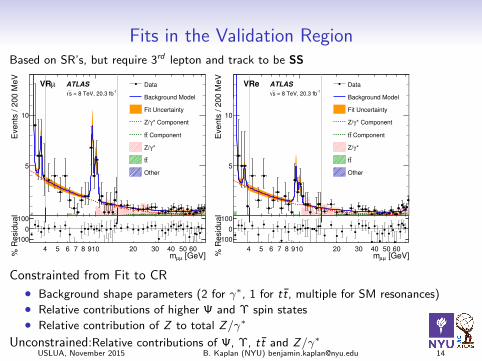
Fits in the Validation RegionBased on SR’s, but require 3rd lepton and track to be SS
Eve
nts
/ 2
00
Me
V
[GeV]µµm4 5 6 7 8 910 20 30 40 50 60
% R
esid
ua
l
100
0
100
5
10
ATLAS1
= 8 TeV, 20.3 fbs
µVR Data
Background Model
Fit Uncertainty
* ComponentγZ/
Componenttt
*γZ/
tt
Other
Eve
nts
/ 2
00
Me
V
[GeV]µµm4 5 6 7 8 910 20 30 40 50 60
% R
esid
ua
l
100
0
100
5
10
ATLAS1
= 8 TeV, 20.3 fbs
VRe Data
Background Model
Fit Uncertainty
* ComponentγZ/
Componenttt
*γZ/
tt
Other
Constrainted from Fit to CR
• Background shape parameters (2 for γ∗, 1 for tt̄, multiple for SM resonances)• Relative contributions of higher Ψ and Υ spin states• Relative contribution of Z to total Z/γ∗
Unconstrained:Relative contributions of Ψ, Υ, tt̄ and Z/γ∗USLUA, November 2015 B. Kaplan (NYU) [email protected] 14


![Observation of new Xic0 baryons decaying to Lambdac+ K-2250 2300 2350 +) [MeV] p-m ( p K 0 200 400 600 800 1000 3 ´ 10 Candidates / (0.5 MeV) LHCb Figure 1: Distribution of the reconstructed](https://static.fdocument.org/doc/165x107/608ef01c56d38b6e435ef450/observation-of-new-xic0-baryons-decaying-to-lambdac-k-2250-2300-2350-mev.jpg)