Science with the Cherenkov Telescope Array (CTA) - KICP Workshops
26
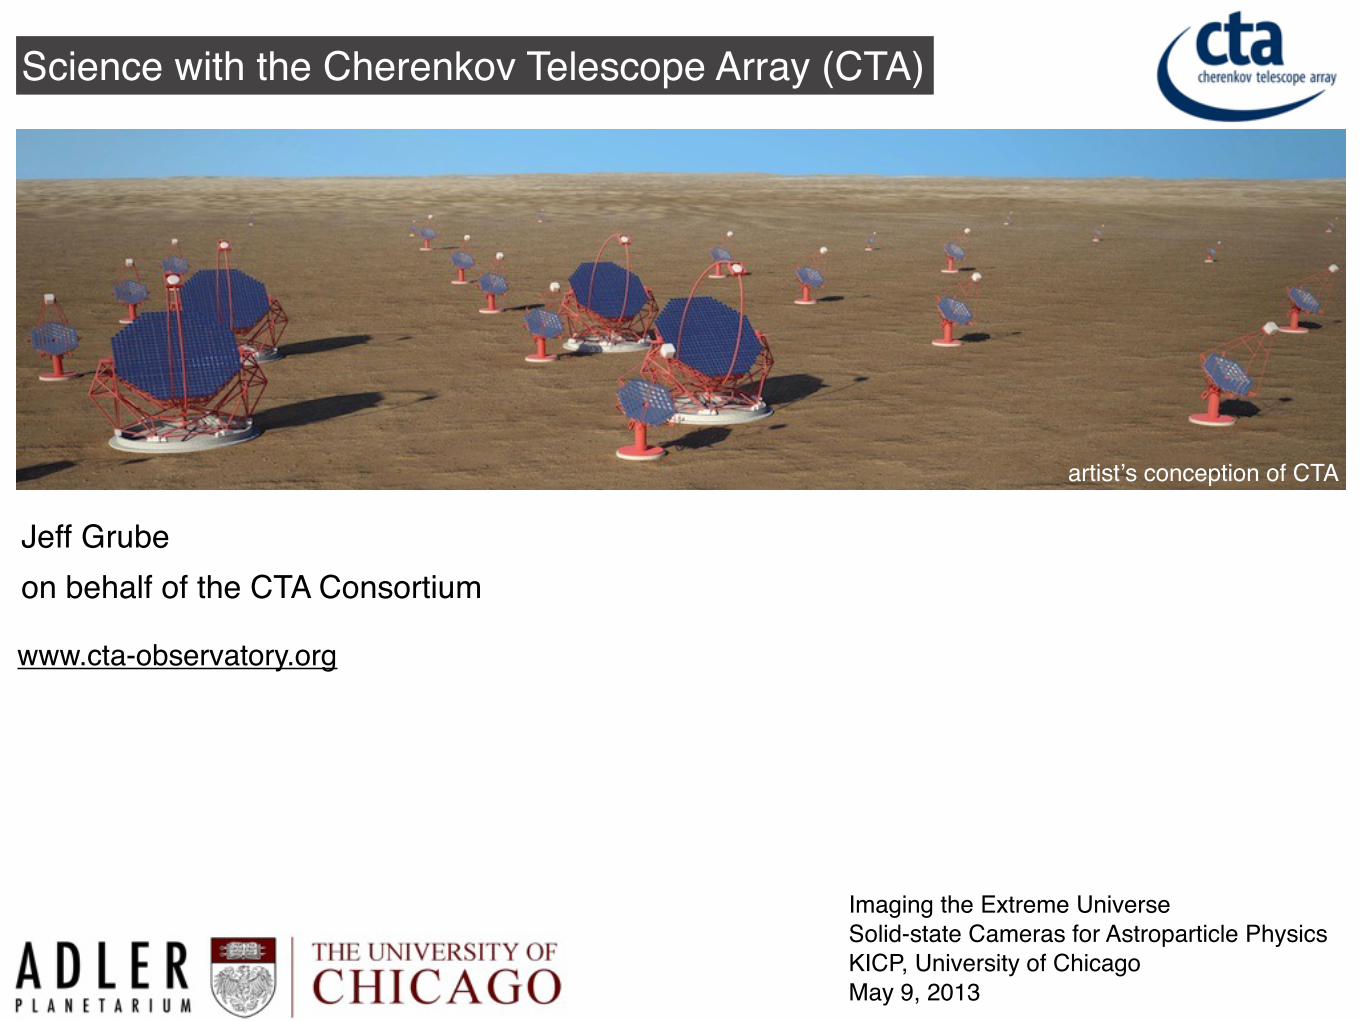
Science with the Cherenkov Telescope Array (CTA) artistʼs conception of CTA Jeff Grube on behalf of the CTA Consortium Imaging the Extreme Universe Solid-state Cameras for Astroparticle Physics KICP, University of Chicago May 9, 2013 www.cta-observatory.org
Transcript of Science with the Cherenkov Telescope Array (CTA) - KICP Workshops
Science with the Cherenkov Telescope Array (CTA)
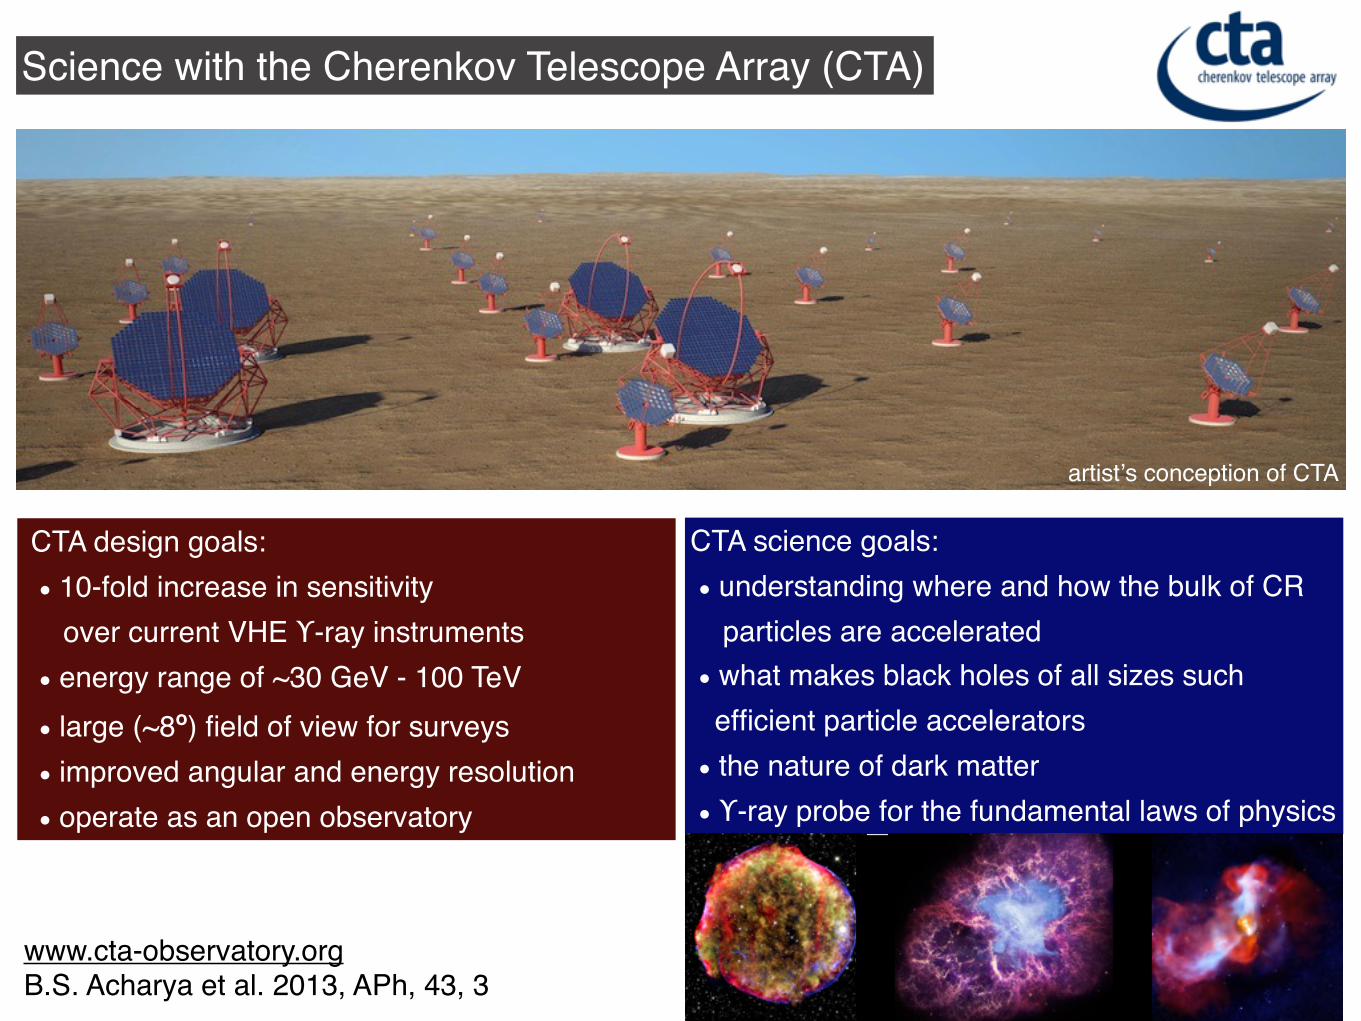
artistʼs conception of CTA
Jeff Grubeon behalf of the CTA Consortium
Imaging the Extreme Universe Solid-state Cameras for Astroparticle PhysicsKICP, University of ChicagoMay 9, 2013
www.cta-observatory.org
Science with the Cherenkov Telescope Array (CTA)
artistʼs conception of CTA
CTA design goals: 10-fold increase in sensitivity over current VHE ϒ-ray instruments energy range of ~30 GeV - 100 TeV large (~8o) field of view for surveys improved angular and energy resolution operate as an open observatory
CTA science goals: understanding where and how the bulk of CR particles are accelerated what makes black holes of all sizes such efficient particle accelerators the nature of dark matter ϒ-ray probe for the fundamental laws of physics
www.cta-observatory.orgB.S. Acharya et al. 2013, APh, 43, 3
3.1. IMAGING ATMOSPHERIC CHERENKOV TECHNIQUE
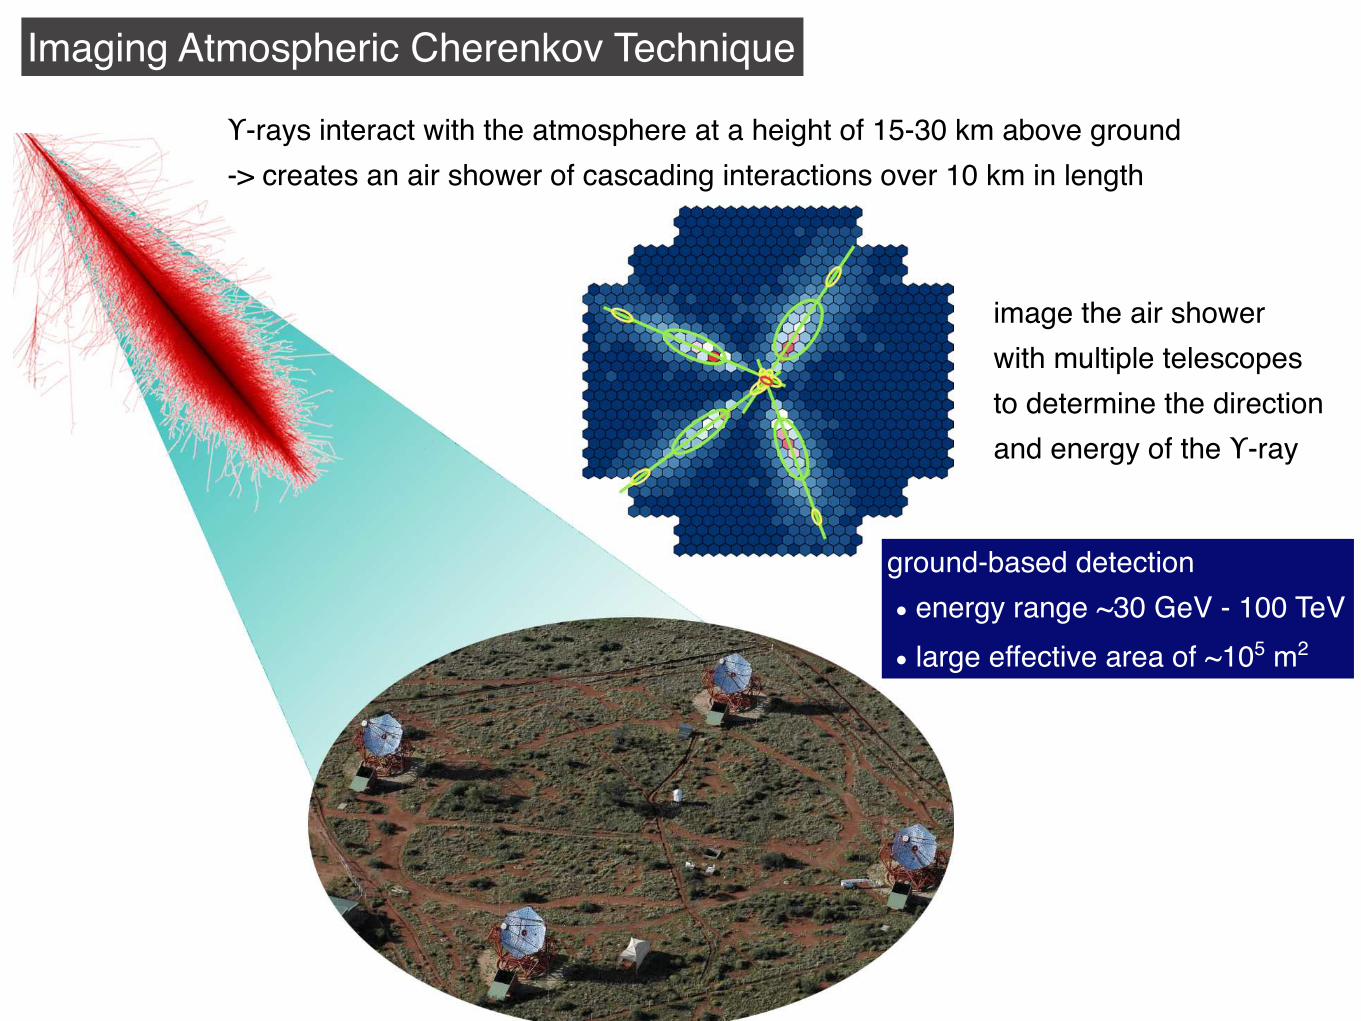
Figure 3.4: A montage of images showing the basic detection principle of IACT telescope systems.
Shown (top left) is a CORSIKA simulated !-ray air shower from figure 3.1 with the Cherenkov
light yield represented by a blue cone. Shown (bottom right) is the H.E.S.S. system of 4 IACT
telescopes, described in section 3.1.3. Shown (top right) are Cherenkov images of a simulated 7
TeV !-ray air shower from each of the 4 H.E.S.S. cameras superimposed onto one camera, adapted
from (Berge 2006).
and shower core location relative to the telescope. The effective area of single IACT telescopes is
very large (∼105 m2 at 1 TeV), and is determined by the efficiency of detecting Cherenkov light.
Using a single IACT telescope, the angular position of incident !-ray is not directly measured,
and is estimated based on the characteristic shape of !-ray Cherenkov images from simulations.
Section 4.2 describes in detail the !-ray reconstruction methods applied to the single Whipple 10
m telescope. The basic detection principles pioneered with the Whipple 10 m are used in modern
IACT telescope arrays. Stereoscopic arrays use a number of IACT telescopes arranged ∼100 m
apart with a ∼100 ns coincidence window for event triggers from each telescope to reconstruct
39
Imaging Atmospheric Cherenkov Technique
ϒ-rays interact with the atmosphere at a height of 15-30 km above ground-> creates an air shower of cascading interactions over 10 km in length
image the air showerwith multiple telescopes to determine the directionand energy of the ϒ-ray
ground-based detection energy range ~30 GeV - 100 TeV large effective area of ~105 m2
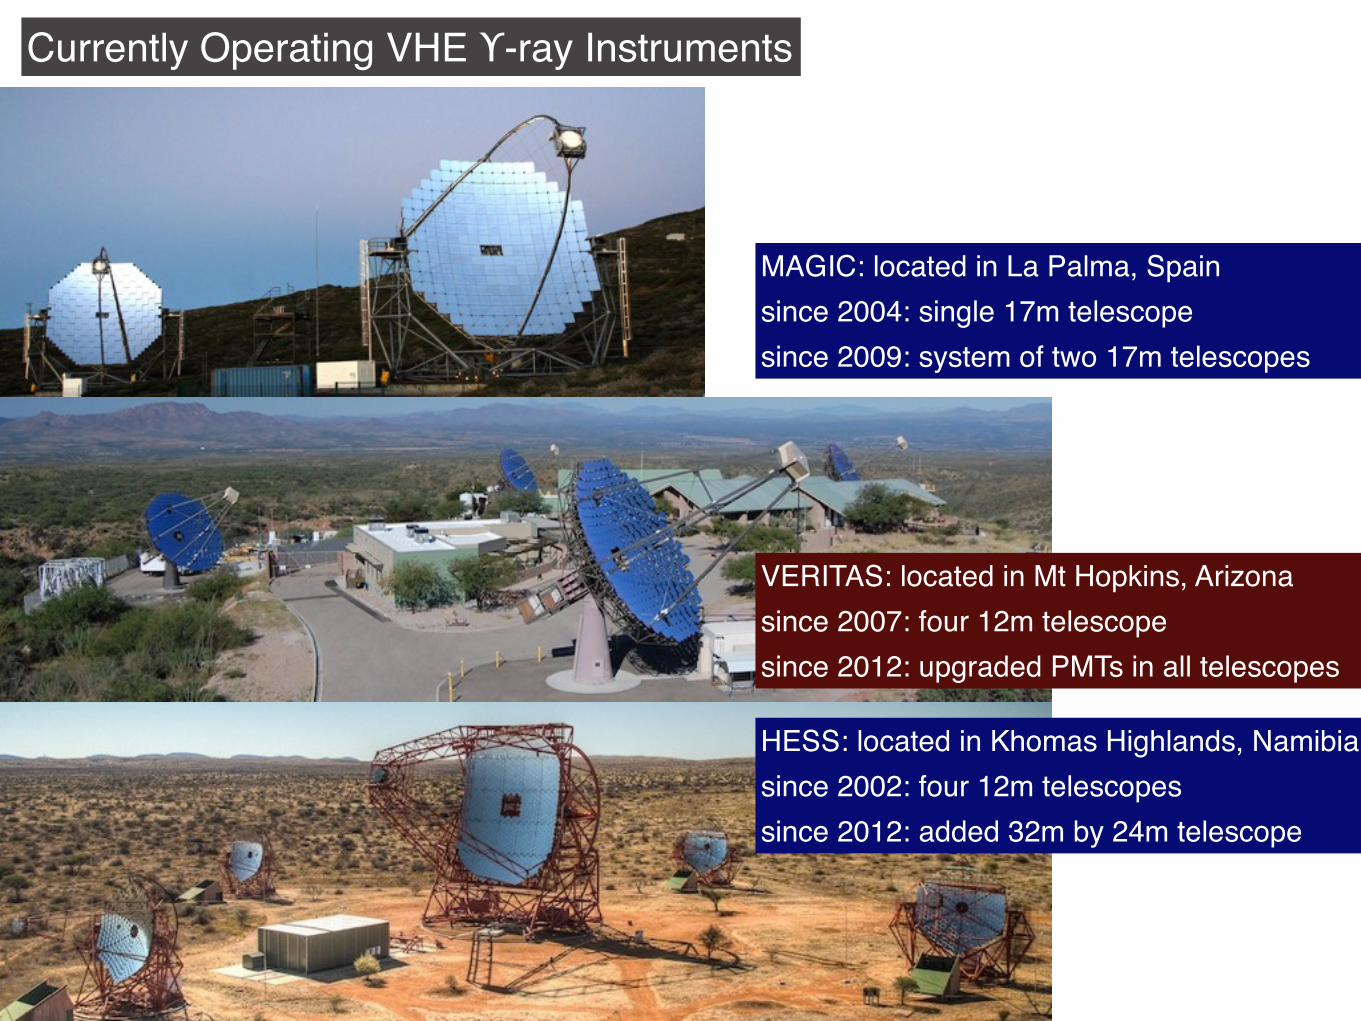
Currently Operating VHE ϒ-ray Instruments
MAGIC: located in La Palma, Spainsince 2004: single 17m telescopesince 2009: system of two 17m telescopes
HESS: located in Khomas Highlands, Namibiasince 2002: four 12m telescopessince 2012: added 32m by 24m telescope
HESS VERITAS: located in Mt Hopkins, Arizonasince 2007: four 12m telescopesince 2012: upgraded PMTs in all telescopes
Maximizing the Sensitivity, Resolution, and Energy Range!"#$%#&'()"*+,&,-'-,%(.*$%#*,')-.*
/0123*455/*67809:**#*;<==><?=*@*;*3A40B7/*3C/C:B54C*:47B0D1*
.ECC3*:453*F56*GC:3*36011C60D1**7D8*6CB5D:369BH5DI*@5:3*:25EC6:*@0::*03J*
/761C*8C3CBH5D*76C7*@56C*0@71C:*4C6*:25EC6*/5EC6*36011C6*326C:25/8*
!"#$%#&'()"*+,&,-'-,%(.*$%#*,')-.*
/0123*455/*67809:**#*;<==><?=*@*;*3A40B7/*3C/C:B54C*:47B0D1*
.ECC3*:453*F56*GC:3*36011C60D1**7D8*6CB5D:369BH5DI*@5:3*:25EC6:*@0::*03J*
/761C*8C3CBH5D*76C7*@56C*0@71C:*4C6*:25EC6*/5EC6*36011C6*326C:25/8*
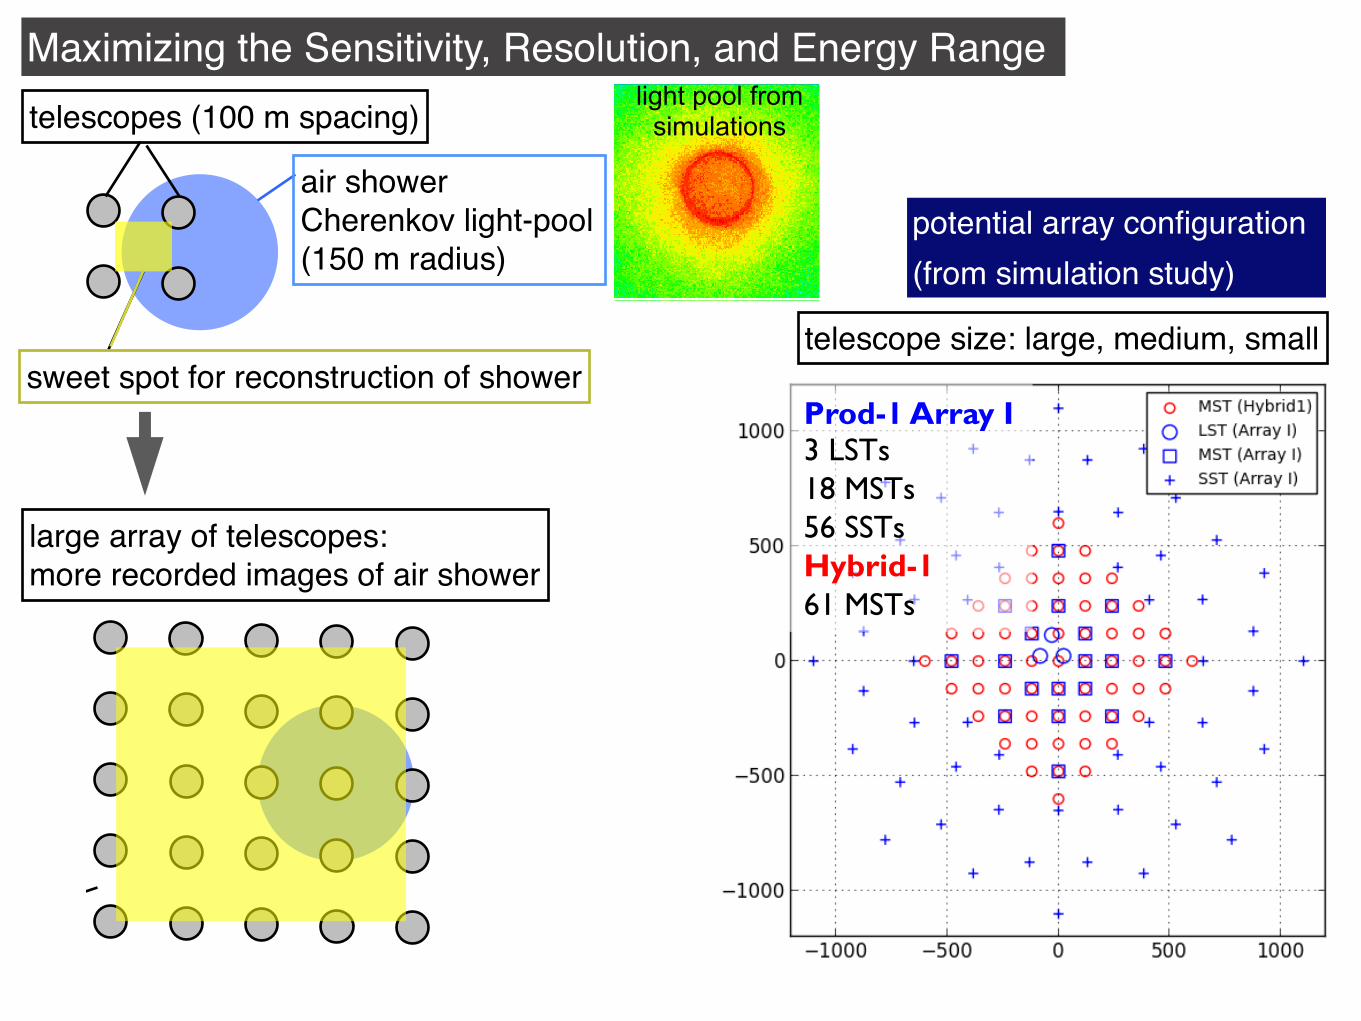
air shower Cherenkov light-pool(150 m radius)
telescopes (100 m spacing)
sweet spot for reconstruction of shower
Gernot Maier | CTA Performance | Nov 2012
From a few to >50 telescopes light pool from simulations
large array of telescopes:more recorded images of air shower
potential array configuration(from simulation study)
3/7/13 5
1 km
Simulated Array Performance!
SLAC Cosmic Fronter Workshop
Hybrid-1 (50 hr) Prod-1 Array-I (50 hr)
~2-3x improvement in core energy range from US contribution
Prod-1 Array I 3 LSTs 18 MSTs 56 SSTs Hybrid-1 61 MSTs
Prod-1: See K. Bernlohr et al. 2012, arXiv:1210.3503 Hybrid-1: See T. Jogler et al. 2012, arXiv: 1211.3181
Fermi (3yr)
telescope size: large, medium, small
!"#$%!&'$("#)*+)!),"-"'./0")/0,$!$("#)1/2),3")*44)5"6),/)*4),"6)2785")
*9):);<=>?)?@ABCD)E&F<)G@?H)<;)IJ@K)4L*F<)MJN@?O)
*44):+)HJOD)>P@>)*L+):)):JPP<P));>=@CO)
'C@@?)OCPQ=CQP@R)3"''&CSM@)HJOD)6"2$,7'&CSM@):<QAC)
0P<C<CSM@)QAH@P)=<AOCPQ=T<A)
!"#$%&'()*(+(,-.%"(/","#012"#(12/$+$3"!(41.(/5"(.-&%"(6",17()88(%"9(
0:;<=>?@<;A((BC;DECD;A(
F88(G)(HIBJ(:;A:(KLM(G(B:>HNIEJ(GI;;=;(O:EACB(
1>(P%.6Q(C:;RAC(I>(S()8(BAEL(
)TLU(G(O=E:V(VA>RCJ(FLM=(@AVH(=O(WIAN(8LK=(XIYAVB(
-EZWA(H:GXI>R(=O(=BEIVV:Z=>B(
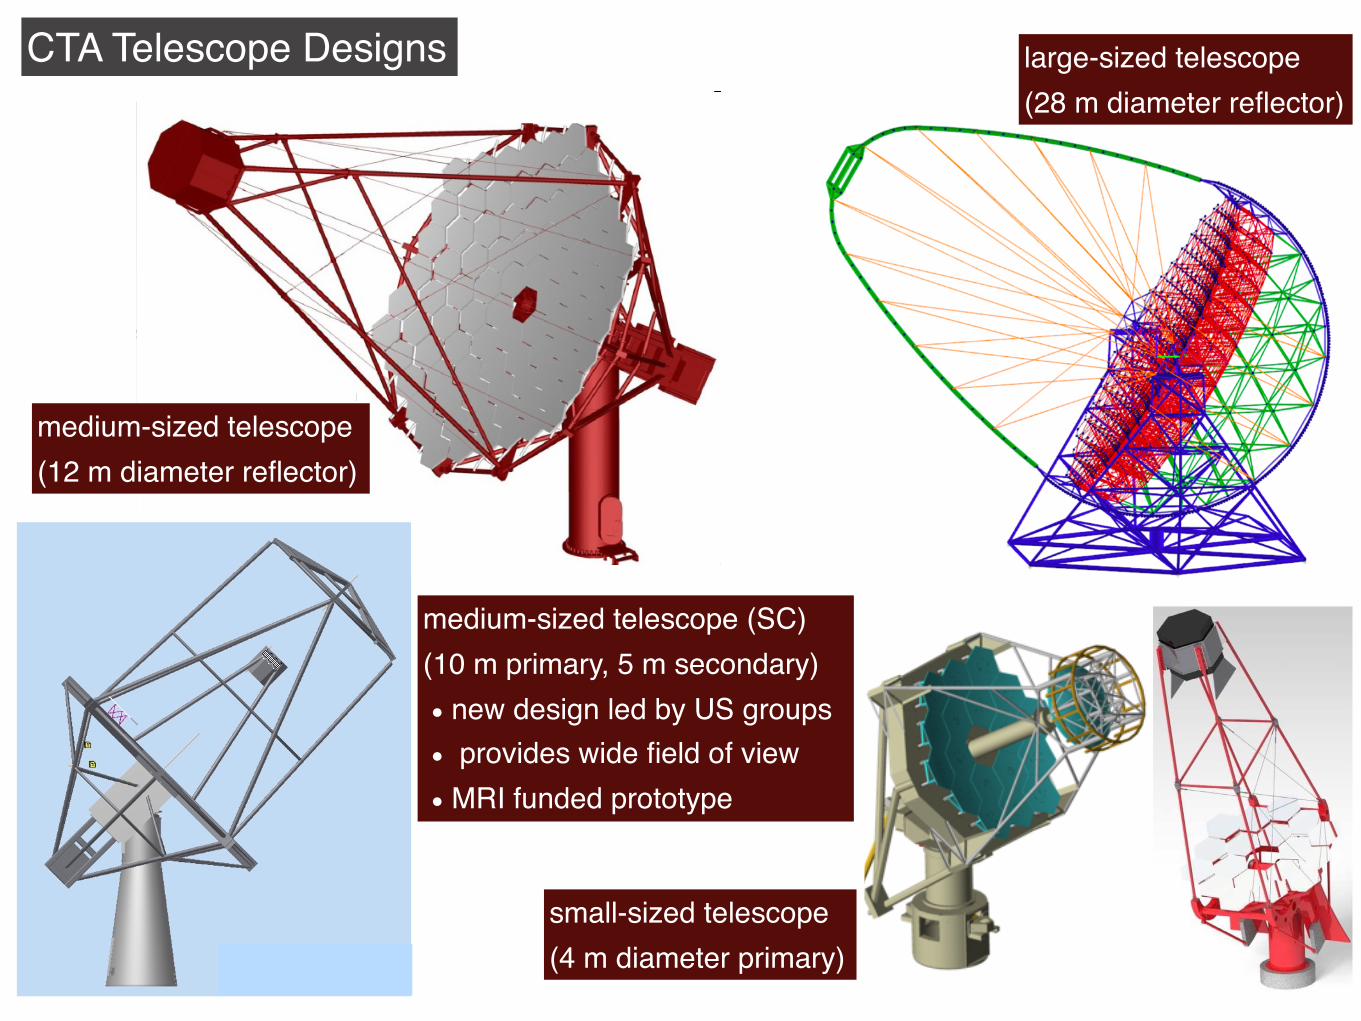
CTA Telescope Designs
J. Buckley SCT Camera Overview CTA, Rome 2012
Introduction
•Development of camera for Schwartzschild-Couder MST prototype (see Vladimir Vassiliev’s talk Thursday)
•Work now funded by NSF MRI
•Three year time-scale to complete prototype at VERITAS site
medium-sized telescope(12 m diameter reflector)
large-sized telescope(28 m diameter reflector)
small-sized telescope(4 m diameter primary)
medium-sized telescope (SC)(10 m primary, 5 m secondary) new design led by US groups provides wide field of view MRI funded prototype
FoV also requires technically challenging telescope optics. With thecurrent single-mirror optics and f/D ratios in the range up to 1.2, anacceptable point spread function is obtained out to radii of 4–5!.Larger FoVs with single-mirror telescopes require increased f/D ra-tios, in approaching 2 for a 10! FoV, which are mechanically diffi-cult to realise since a large and heavy focus box needs to besupported at a long distance from the mirror. Also, the single-mir-ror optics solutions, which provide the best imaging, use the Da-vies–Cotton design, which in turn result in a time dispersion ofthe Cherenkov photons that seriously affects the trigger perfor-mance, once the mirror diameters exceed 15 m (for the typical f/D ratios). An alternative solution is the use of dual-mirror optics.With non-spherical primary and secondary mirrors, good imagingover fields of up to 10! diameter can be achieved, but the disadvan-tages are the increased cost and complexity, significant shadowingof the primary mirror by the secondary, and complex alignment is-sues for faceted primary and secondary mirrors. Large incidenceangles of photons onto the camera, which is common in dual-mir-ror optics, affects the photo detection efficiency and may requirebaffling of stray light.
Therefore, the choice of the FoV requires that science gains, costand increased complexity be carefully balanced. When searchingfor unknown source types which are not associated with non-thermal processes in other, well-surveyed wavelength domains, alarge FoV helps, as several sources may appear in one pointing. Thisincreases the effective observation time per source by a corre-sponding factor compared to an instrument that can look only atone source at a time. An instrument with CTA-like sensitivity is ex-pected to detect of the order of 1000 sources. In the Galactic plane,one would always find multiple sources in a FoV. In extragalacticspace, the average angular distance between (an estimated 500)sources would be about 10!, implying that even for the maximumconceivable FoVs the gain is modest, but not negligible. Even in theGalactic plane, a very large field of view will not be the most costeffective solution, since the gain in terms of the number of sourcesviewed simultaneously scales essentially linearly with the diame-ter of the field of view, given that sources are likely to cluster with-in a fraction of a degree from the Galactic plane, whereas cameracosts scale with the diameter squared. A rough estimate basedon typical mirror costs and per-channel pixel and readout costs
Fig. 5. Three possible designs for SSTs of about 4 m mirror diameter, with 8–10! FoV and 1300–2000 pixels of 0.2–0.3!. Top and bottom right: Schwarzschild–Couder dual-mirror optics. Bottom left: Traditional Davies–Cotton design with f/D = 1.4 and a large camera.
B.S. Acharya et al. / Astroparticle Physics 43 (2013) 3–18 13
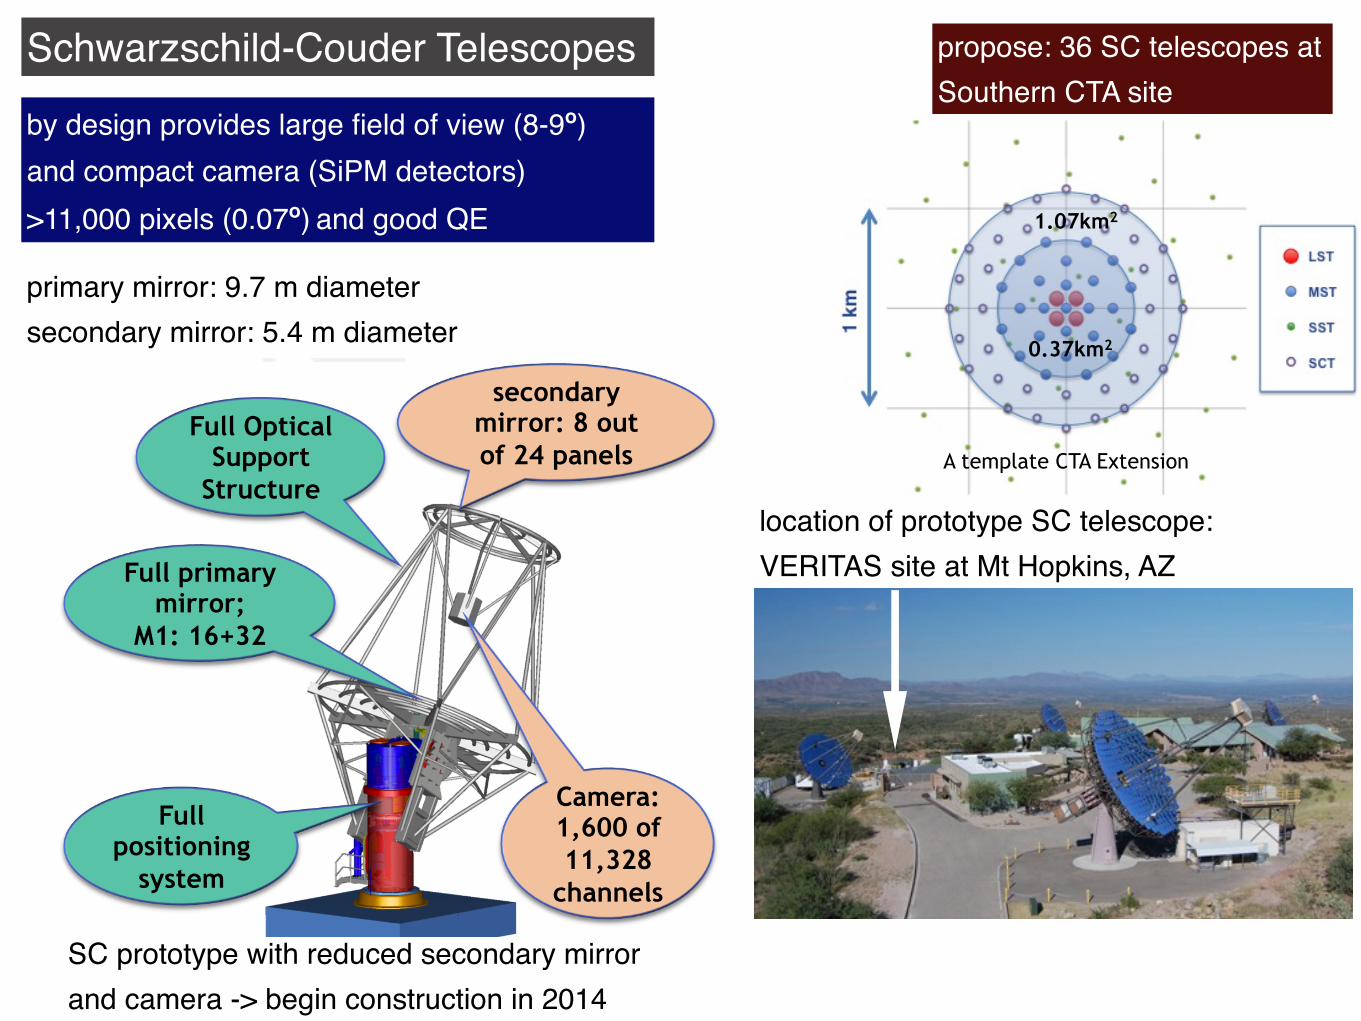
Schwarzschild-Couder Telescopes ! ! Expand capabilities of the base-
line CTA (South) by adding 36 Schwarzschild-Couder Telescopes (SCTs). ! Increase footprint of the MST
installation to reach 1km2 and achieve CTA operation in an “event containment” regime for E!<1TeV.
! Approach physics limit of imaging atmospheric Cherenkov technique for angular resolution by implementing very high resolution imaging camera with pixel size 2.6 times smaller than in MST camera.
! Simultaneously increase field of view of an individual telescope to at least 8 degrees to enhance VHE transient, DM searchers and survey capabilities of CTA.
A template CTA Extension
0.37km2
1.07km2
Feb 7, 2013 Vladimir Vassiliev | SCT | SPPRR
!
Full positioning
system
Full primary mirror;
M1: 16+32
Full Optical Support
Structure
Camera: 1,600 of 11,328
channels
secondary mirror: 8 out of 24 panels
Major Research Instrumentation (MRI)
project
Conceptual Design
09/2012-09/2013
Fabrication 09/2013-09/2014
Verification and commissioning
09/2014-09/2015
location of prototype SC telescope:VERITAS site at Mt Hopkins, AZ
propose: 36 SC telescopes at Southern CTA site
by design provides large field of view (8-9o)and compact camera (SiPM detectors)>11,000 pixels (0.07o) and good QE
primary mirror: 9.7 m diametersecondary mirror: 5.4 m diameter
SC prototype with reduced secondary mirror and camera -> begin construction in 2014
Stefan Schlenstedt | MST | SPPRR | Feb 7, 2013 | 7
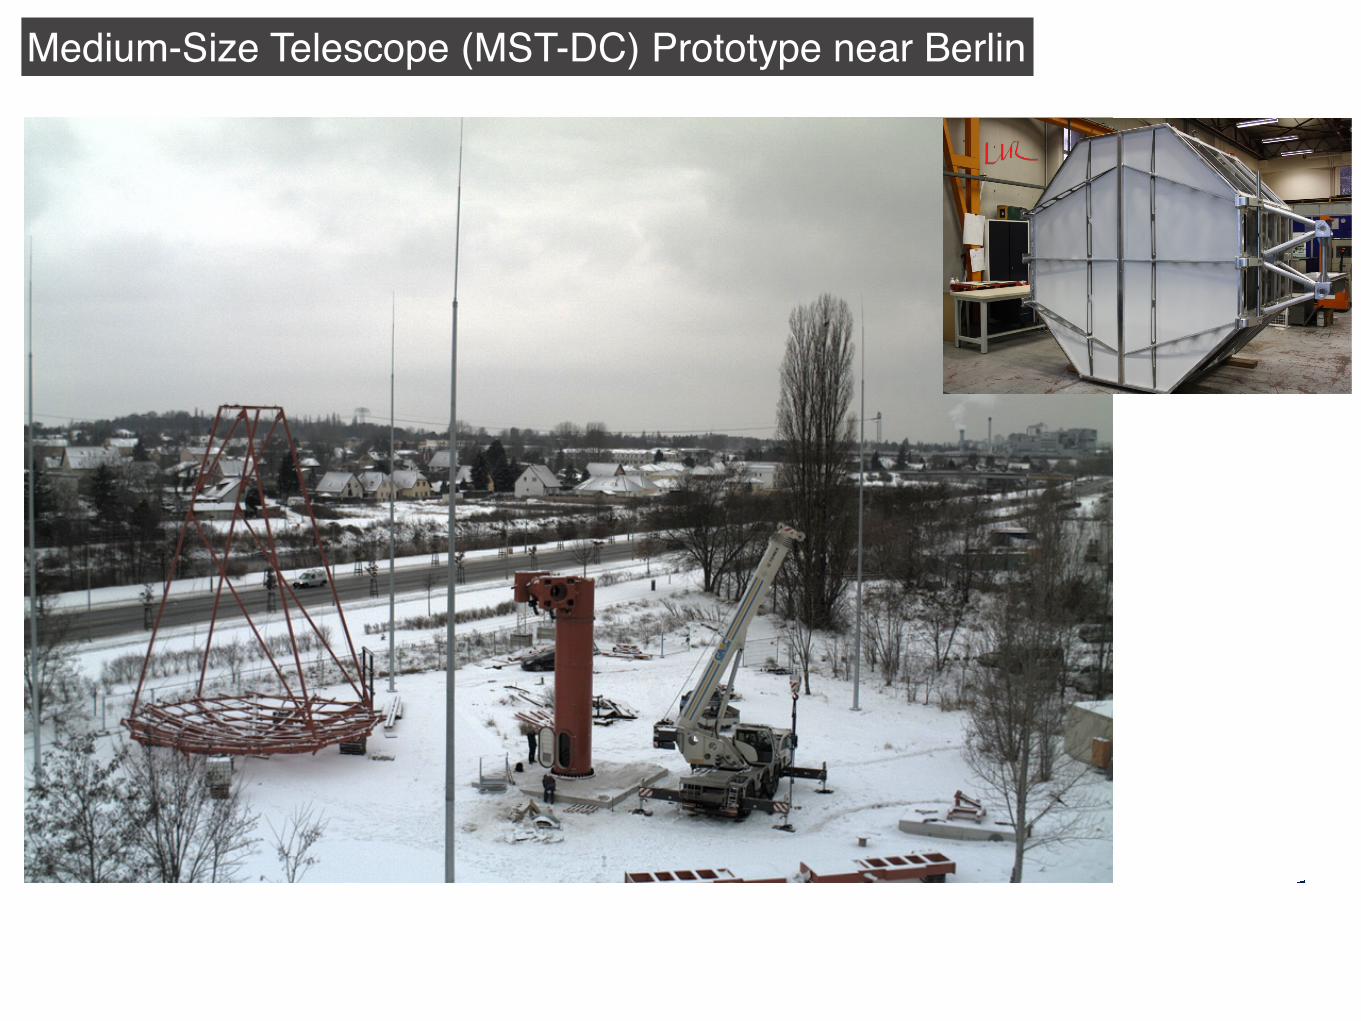
MST MechanicsThe First Telescope Prototype Of CTAMedium-Size Telescope (MST-DC) Prototype near Berlin
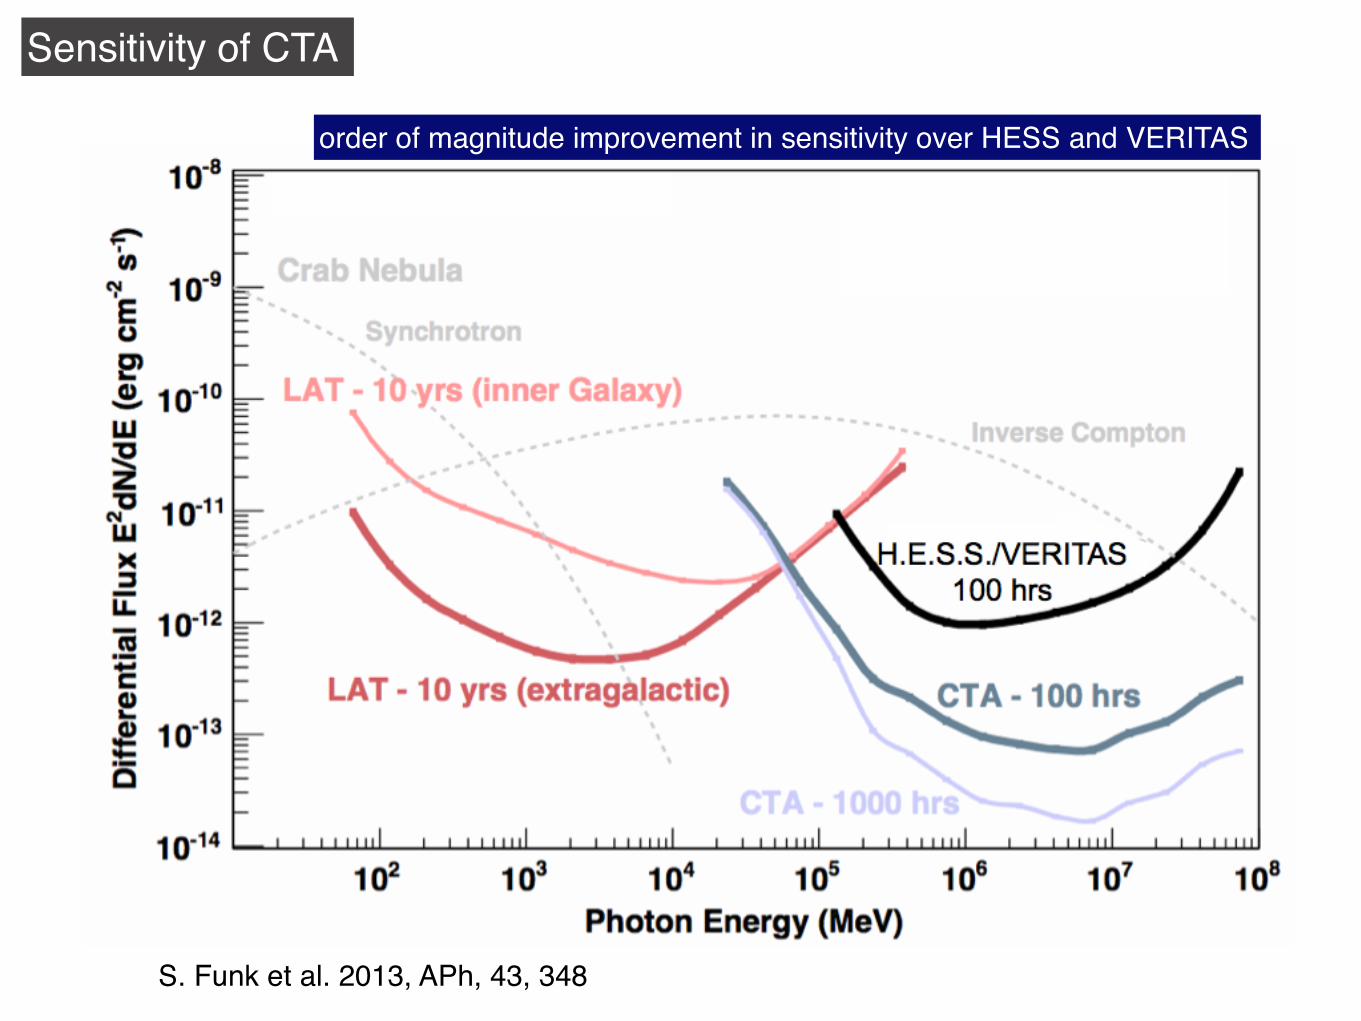
Sensitivity of CTA
order of magnitude improvement in sensitivity over HESS and VERITAS
S. Funk et al. 2013, APh, 43, 348
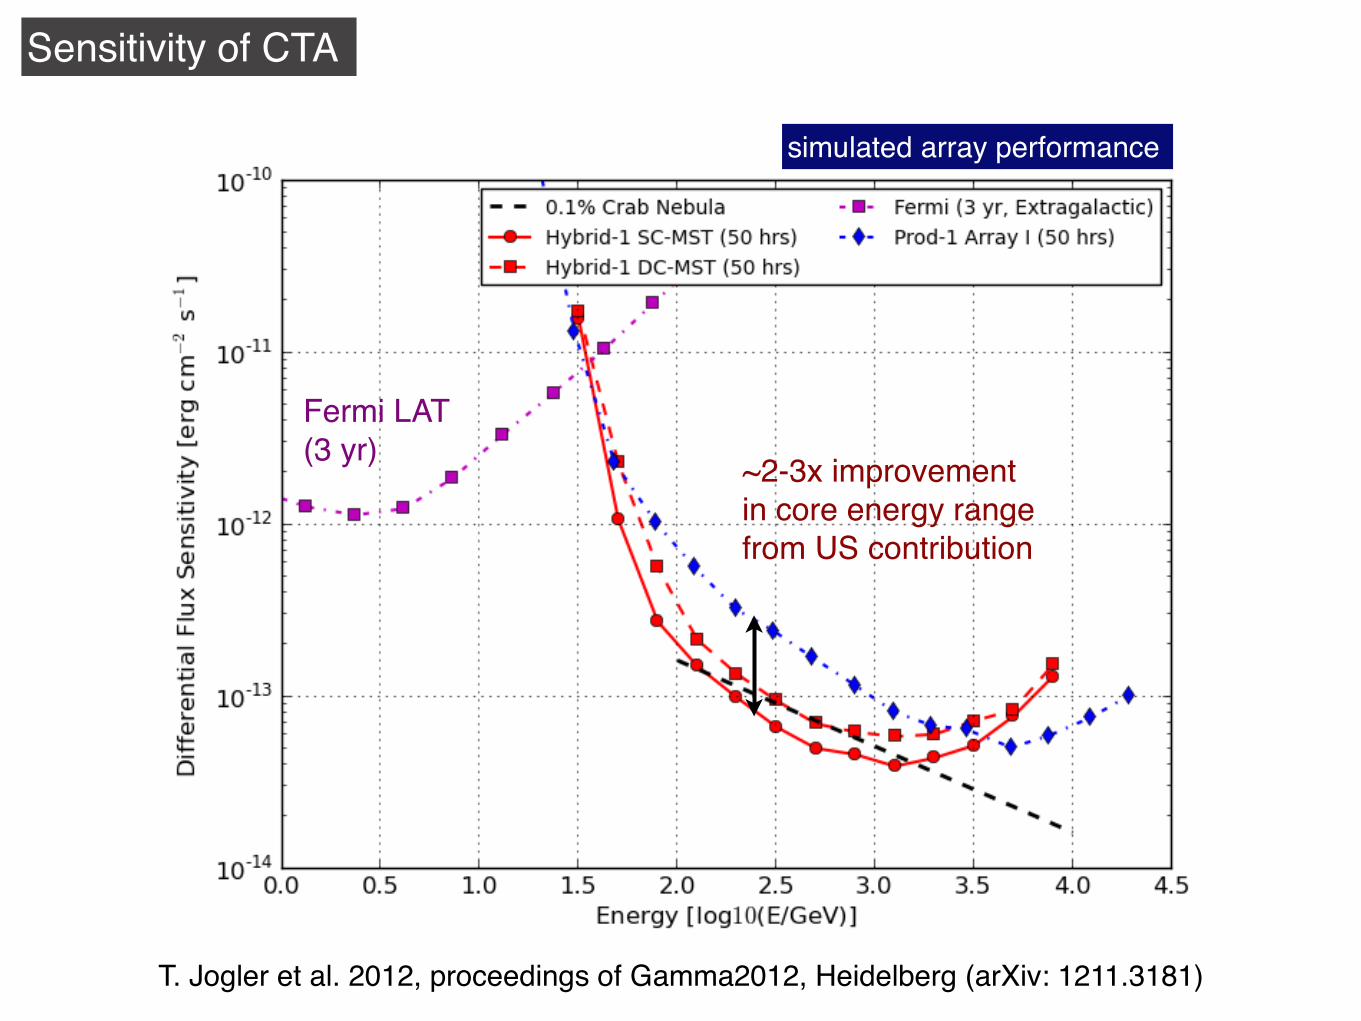
Sensitivity of CTA
Fermi LAT(3 yr) ~2-3x improvement
in core energy range from US contribution
simulated array performance
T. Jogler et al. 2012, proceedings of Gamma2012, Heidelberg (arXiv: 1211.3181)
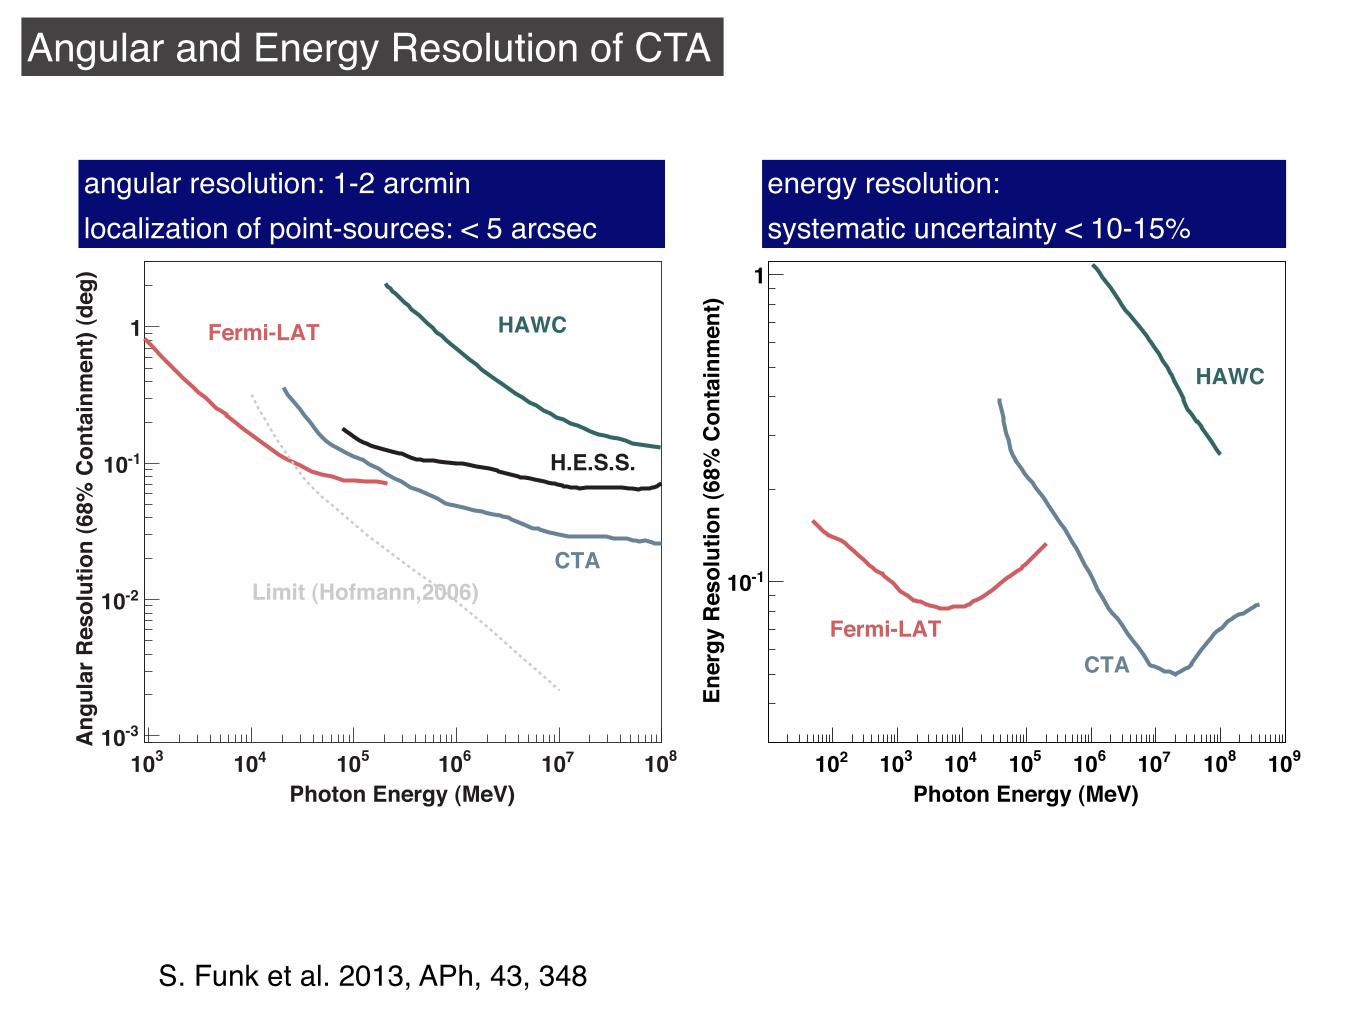
Angular and Energy Resolution of CTA
angular resolution: 1-2 arcminlocalization of point-sources: < 5 arcsec
energy resolution:systematic uncertainty < 10-15%
LAT and CTA is the same at a given energy, the Fermi-LAT will be able todo a better measurement of a source. While HAWC’s performance in thesequantities is rather modest, its main goal is to detect new sources and studyvariability and find transients. HAWC is not shown in Figure 1 as differ-ential sensitivity curves has not been provided by the HAWC collaborationand indeed, it is not the relevant quantity for the aforementioned goals. Inthe energy range at which this study is focused, HAWC is not competitivewith the Fermi-LAT and CTA except perhaps for the detection of very shorttimescale transients such as GRBs.
Photon Energy (MeV)
310 410 510 610 710 810
An
gu
lar
Re
so
luti
on
(6
8%
Co
nta
inm
en
t) (
de
g)
-310
-210
-110
1 Fermi-LAT
CTA
H.E.S.S.
Limit (Hofmann,2006)
HAWC
Photon Energy (MeV)210 310 410 510 610 710 810 910
Ener
gy R
esol
utio
n (6
8% C
onta
inm
ent)
-110
1
Fermi-LATCTA
HAWC
Figure 2: Left: Angular resolution for Fermi-LAT [29] and CTA [30]. H.E.S.S. [31] andHAWC [32] are shown as examples for a current-generation IACT and for a next-generationwater Cherenkov detector. Also shown is the limiting angular resolution that could beachieved if all Cherenkov photons emitted by the particle shower could be detected [33].The CTA curve has not been optimized for angular resolution and enhanced analysistechniques are expected to improve this curve. Right: Energy resolution for Fermi-LATand CTA. Shown is the 68% containment radius around the mean of the reconstructedenergy. It is evident that the energy resolution of Fermi-LAT in the overlapping energyrange is significantly better than the CTA resolution.
2. The SensitivityModel
The sensitivity of gamma-ray detectors is determined by three basic char-acteristics: the effective collection area, residual background rate and angularresolution, all of which are typically a strong function of gamma-ray energy.
5
S. Funk et al. 2013, APh, 43, 348
+30
-30
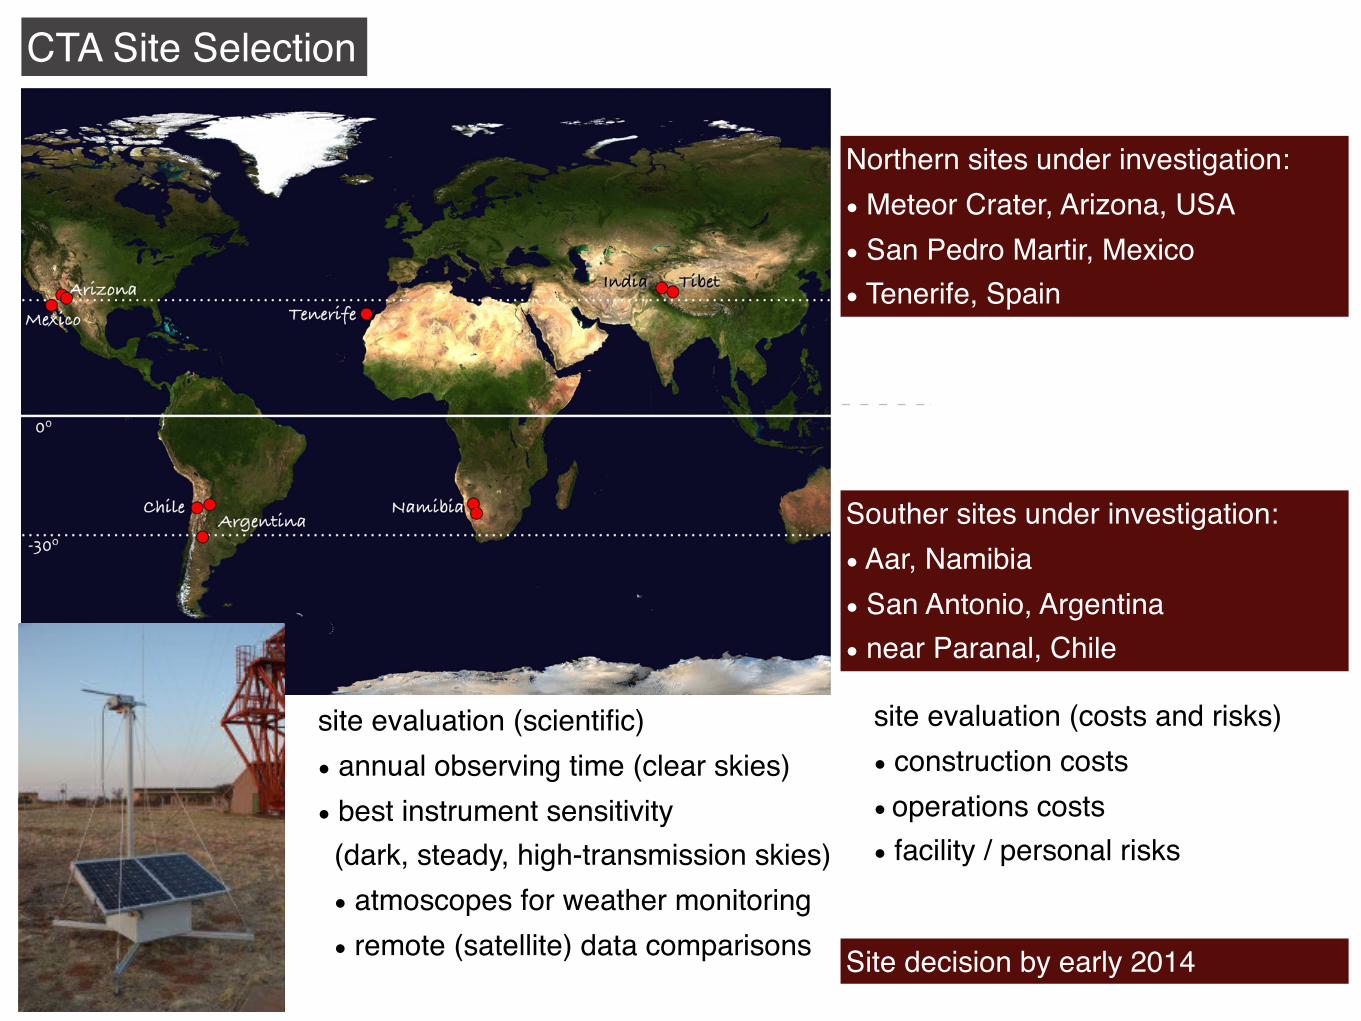
Warning: map not quite accuratetwo sites to cover full skyat 20o to 30o N, S
CTA Site Selection
Northern sites under investigation: Meteor Crater, Arizona, USA San Pedro Martir, Mexico Tenerife, Spain
Souther sites under investigation: Aar, Namibia San Antonio, Argentina near Paranal, Chile
site evaluation (costs and risks) construction costs operations costs facility / personal risks
site evaluation (scientific) annual observing time (clear skies) best instrument sensitivity (dark, steady, high-transmission skies) atmoscopes for weather monitoring remote (satellite) data comparisons Site decision by early 2014
software and data center infrastructures will be provided through asingle access point, the ‘‘VHE gamma-ray Science Gateway’’. It isforeseen that individual scientists using the analysis softwaremade available by CTA can conduct the high-level analysis ofCTA data. This software will follow the standards used by otherobservatories. All aspects of data preparation, processing, dissemi-nation and archiving will be organised and conducted by thescience data centre.
7. CTA status and plans
CTA is the worldwide project for the future of VHE gamma-rayastronomy with Cherenkov Telescopes. It will consolidate VHEgamma-ray astronomy as one of the modern branches of astron-omy. CTA is already considered one of the leading large astronom-ical observatories of this decade, together with ALMA [32], theE-ELT [33], SKA [34] and the LSST [35].
Currently, the CTA Consortium consists of over scientists andengineers from 27 countries from 5 continents and has become atruly global project.
Since 2008, CTA has been included in the roadmap of the Euro-pean Strategy Forum on Research Infrastructures (ESFRI) [36]. It isone of the high-priority ‘‘Magnificent Seven’’ of the European strat-egy for astroparticle physics published by ASPERA [37], and ishighly ranked in the ‘‘strategic plan for European astronomy’’ ofASTRONET [38]. In addition, CTA is a prioritised project for the cur-rent decade in the recently completed Decadal Survey of the USNational Academy of Sciences [39].
The CTA Consortium started in 2007 to design the installationand to work towards its implementation. A Design Study phasehas been ended in 2010 with the publication of a 120-page report[12]. CTA is now in the middle of a three-year EU funded Prepara-tory Phase, aimed to deliver a Technical Design Report and being‘‘construction ready’’ towards the end of 2014. The five-year con-struction period could then be started in early 2015 (Fig. 11).
An important milestone will be the selection of the location forthe two CTA observatories. Ideal sites should provide a flat area ofabout 10 km2 at an altitude of 1.5–4.0 km a.s.l., supreme astronom-ical sky conditions with minimum cloud cover and low levels ofambient light, easy access, and good local infrastructure. There
Fig. 11. Current timeline of the CTA project.
Fig. 12. Approximate location of candidate sites in the range of ±20–30! latitude.
B.S. Acharya et al. / Astroparticle Physics 43 (2013) 3–18 17
! !
!
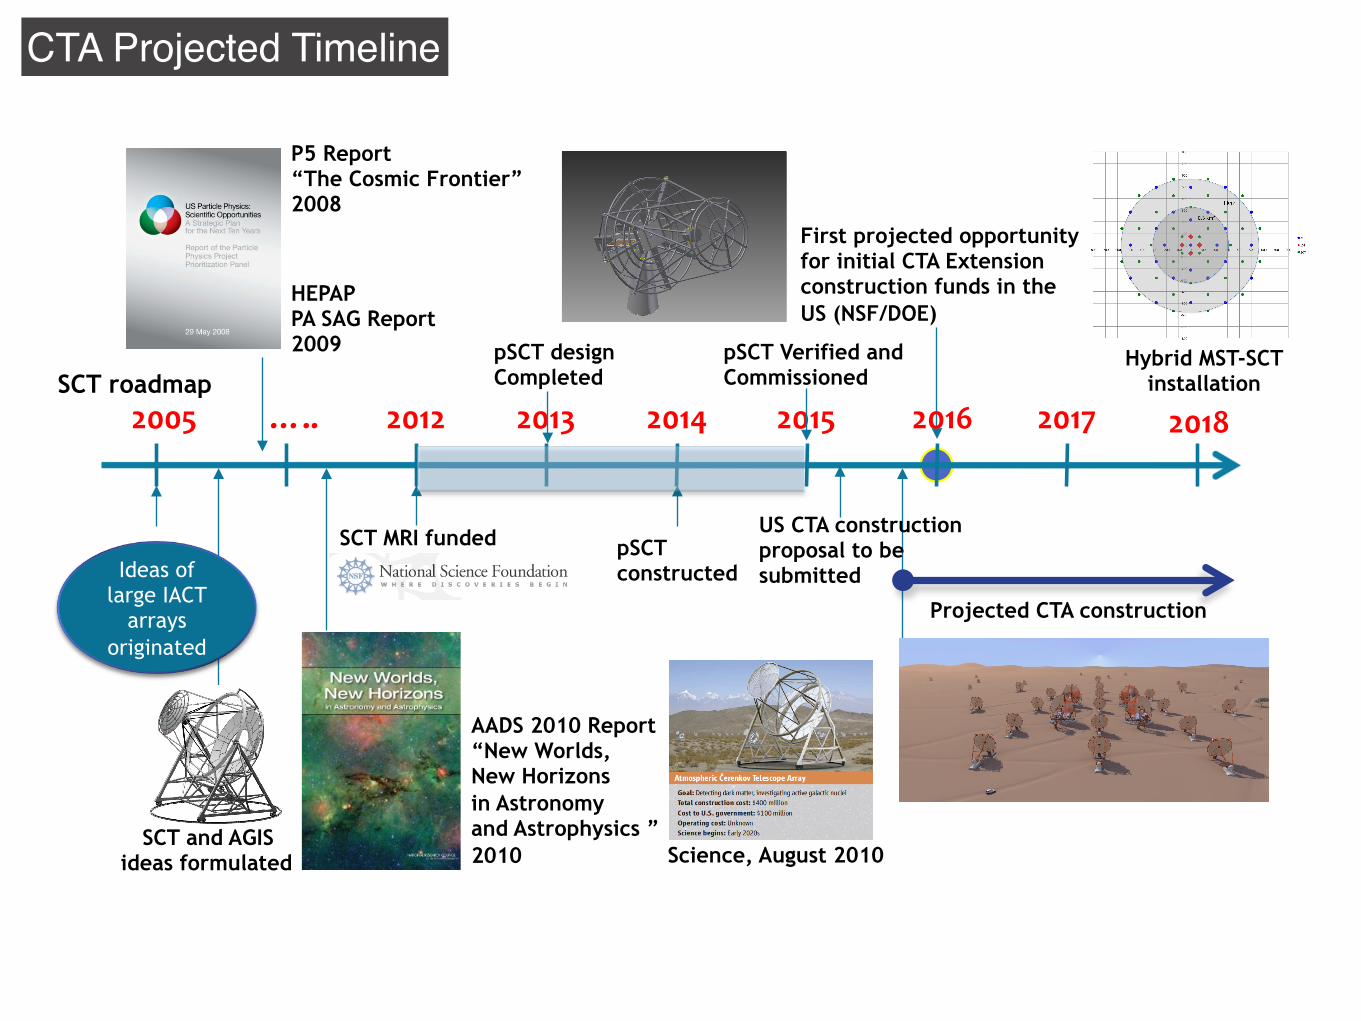
!"#$%!"#&%!"#'%!"#(%!"#)%!"#!%*++%!""'% !"#,%SCT roadmap
Ideas of
large IACT
arrays
originated
SCT MRI funded
pSCT design Completed
pSCT constructed
pSCT Verified and Commissioned
First projected opportunity for initial CTA Extension construction funds in the US (NSF/DOE)
US CTA construction proposal to be submitted
P5 Report “The Cosmic Frontier” 2008
HEPAP PA SAG Report 2009
SCT and AGIS ideas formulated
AADS 2010 Report “New Worlds, New Horizons in Astronomy and Astrophysics ” 2010 Science, August 2010
Projected CTA construction
Hybrid MST-SCT installation
CTA Projected Timeline
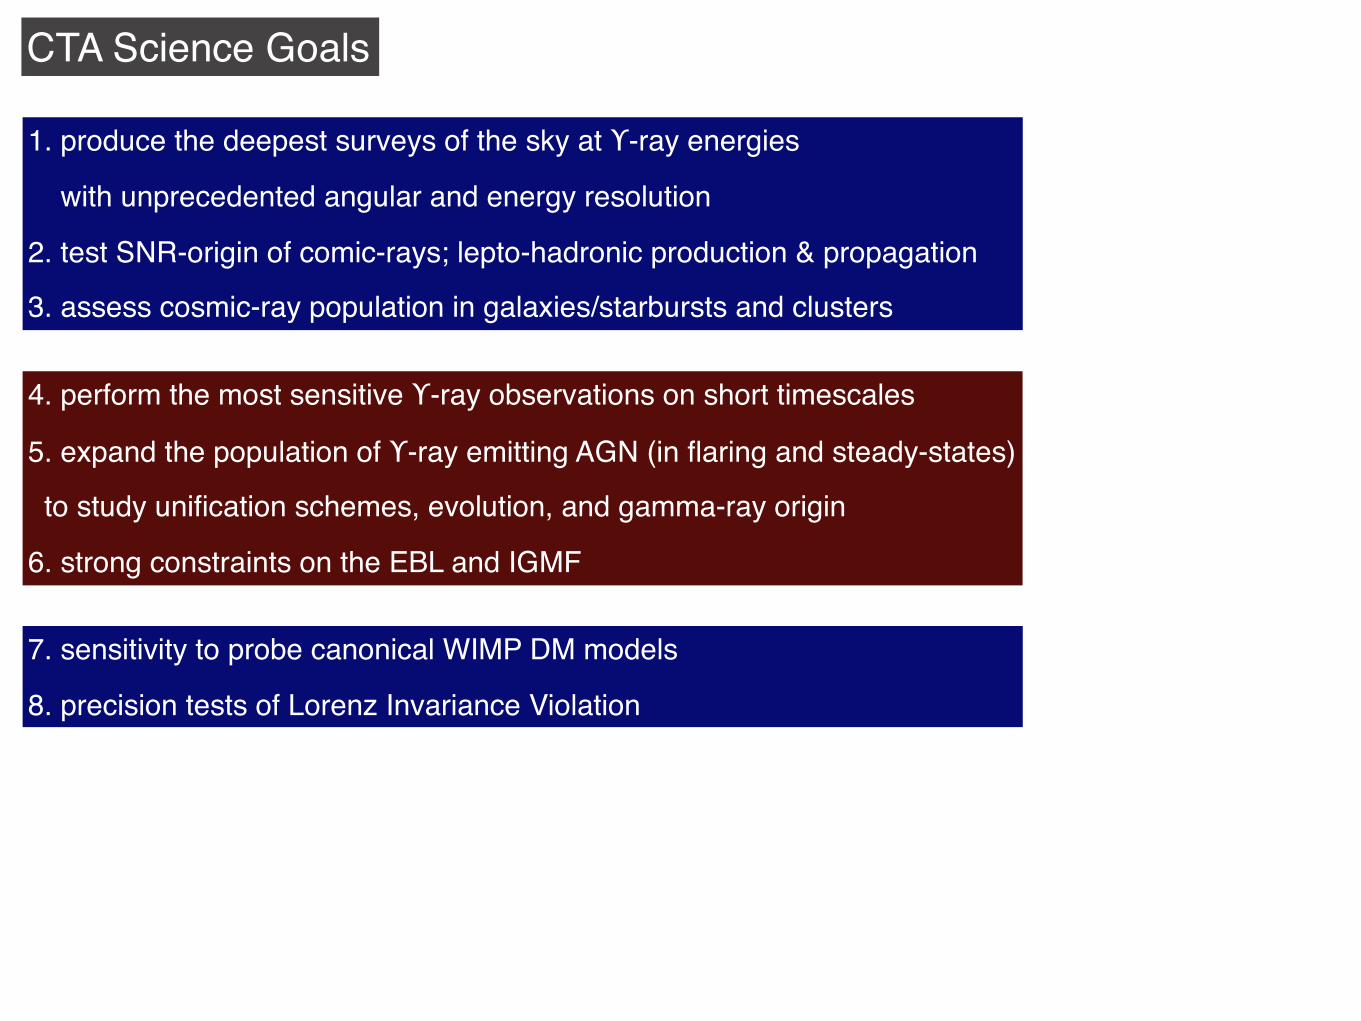
CTA Science Goals
1. produce the deepest surveys of the sky at ϒ-ray energies
with unprecedented angular and energy resolution
2. test SNR-origin of comic-rays; lepto-hadronic production & propagation
3. assess cosmic-ray population in galaxies/starbursts and clusters
4. perform the most sensitive ϒ-ray observations on short timescales
5. expand the population of ϒ-ray emitting AGN (in flaring and steady-states)
to study unification schemes, evolution, and gamma-ray origin
6. strong constraints on the EBL and IGMF
7. sensitivity to probe canonical WIMP DM models
8. precision tests of Lorenz Invariance Violation
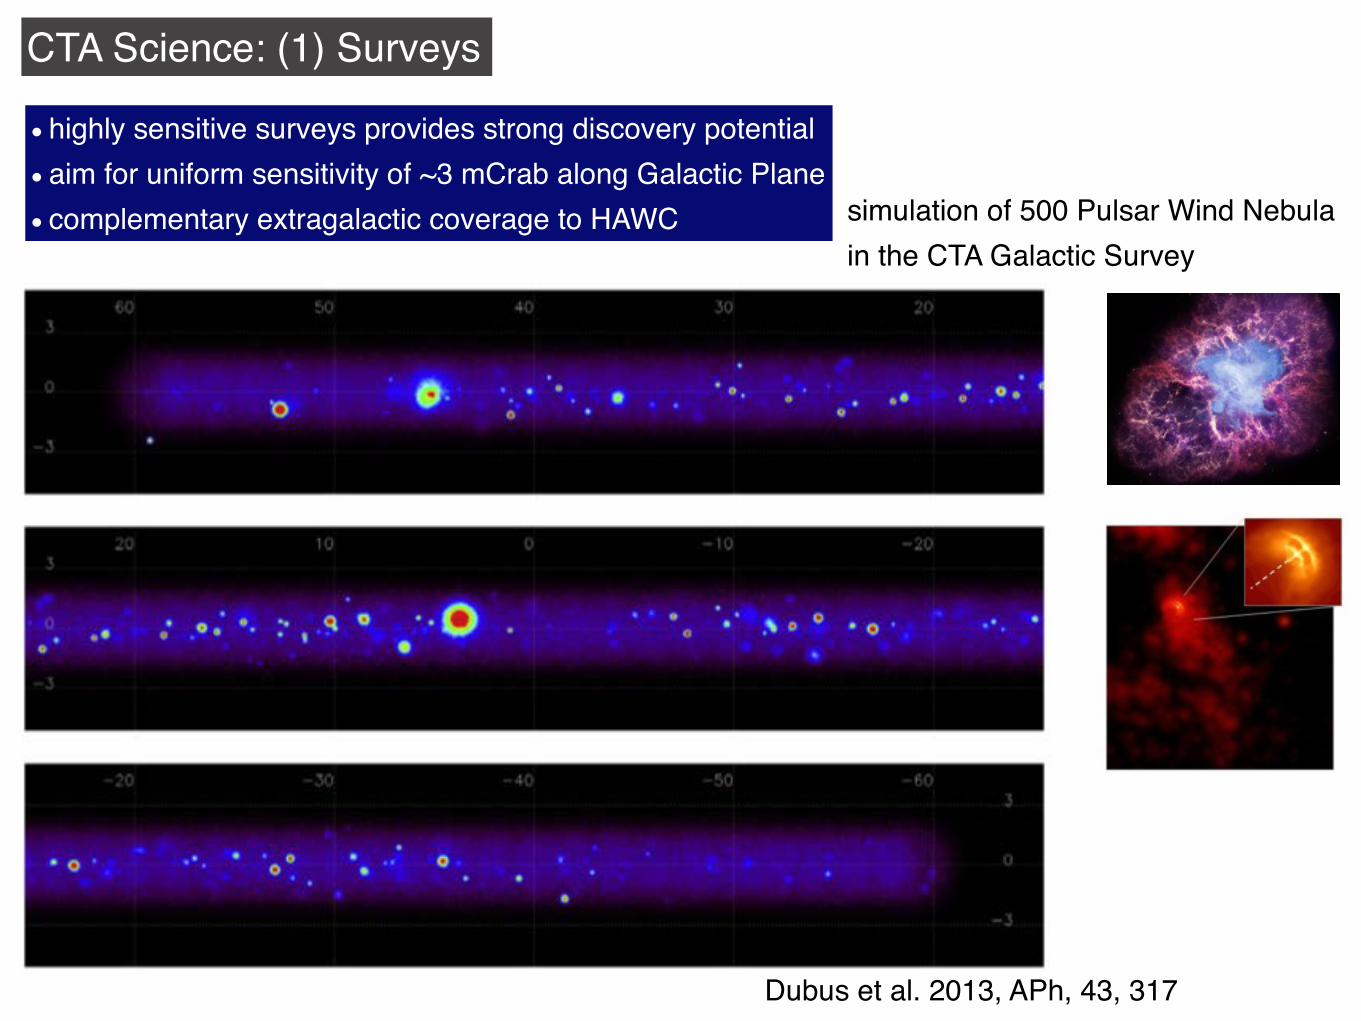
CTA Science: (1) Surveys
highly sensitive surveys provides strong discovery potential aim for uniform sensitivity of ~3 mCrab along Galactic Plane complementary extragalactic coverage to HAWC simulation of 500 Pulsar Wind Nebula
in the CTA Galactic Survey
La Thuille, 9-16 March 2013 G.Lamanna
Surveys specifications put as examples
!"#
$%&#'()*+(,-#'(#!"""#.%/&)#012#,+(#&-+,.#340&+5#)%/&,-)#65-**-&#*.+(#+(7#8%'(*-9#%5)-&:+*'%(#,%(9/,*-9#/8#*%#(%;<=####!"#$%&#'()$*#+,,#-./#2)3(4#5&&"#56#789#:"#$%&#;0(0<$:<#13=>&6?#
1.-)-#+&-#->+48?-)#;-??#;'*.'(#%5)-&:+*'%(+?#,%()*&+'(*)#6-=@=#9/*7#,7,?-<###
• # )/&:-7)#,+(#5-#->*-(9-9#'(#,%:-&+@-##
• # )/&:-7)#,+(#5-#&-8-+*-9#'(#*'4-#
Dubus et al. 2013, APh, 43, 317

CTA Science: (1) Surveys
5 10 15 20distance (kpc)
0.1
1.0
Frac
tion
of P
WN
e (Z
.A. <
45°
) B ID
G21.5-0.9HESS J1356-645Kes 75
Figure 15: Fraction of visible PWNe as a function of the distance to the Sun. For each source andeach CTA configuration considered here, filled and open symbols give respectively the horizonsof detectability and resolvability, as defined in the text.
∼40 kyr (for B=3µG, similar to what has been found in several PWNe such asVela X). This gives a total number of detectable G21.5–0.5-, HESSJ1356–645–and Kes75–like PWNe with CTA of NPWN ∼ 800 fPWN (!PWN/40kyr) ("PWN/2),where "PWN is the Galactic VHE-emitting-PWN rate (in units of number of sourcesper century). This implies that ∼ (300-600) PWNe should be detected with CTA(for configurations CTA–I and CTA–D). These estimates should be taken withcare, since we have implicitly assumed that the three considered PWNe are rep-resentative of the whole population of VHE nebulae, i.e. we have not accountedfor any time evolution of the PWN sizes and luminosities, which both depend onmany parameters.
2.2. Pulsars2.2.1. The Crab Pulsar
The Crab pulsar is the only pulsar detected so far at VHE energies with Cherenkovtelescopes. In 2008, MAGIC announced the detection of the Crab pulsation above25 GeV making use of an novel trigger system [22]. Contrary to what one couldexpect from EGRET [32], AGILE [42] (and later on Fermi [2]) observations,the characteristic double-peaked structure of the Crab light-curve was still visi-ble above 25GeV. Recently, VERITAS [23] and MAGIC [20, 21] have reportedthe detection of the Crab pulsar at even higher energies, providing measurementsof the pulsed spectrum which in both cases is well described by a power-law,
21
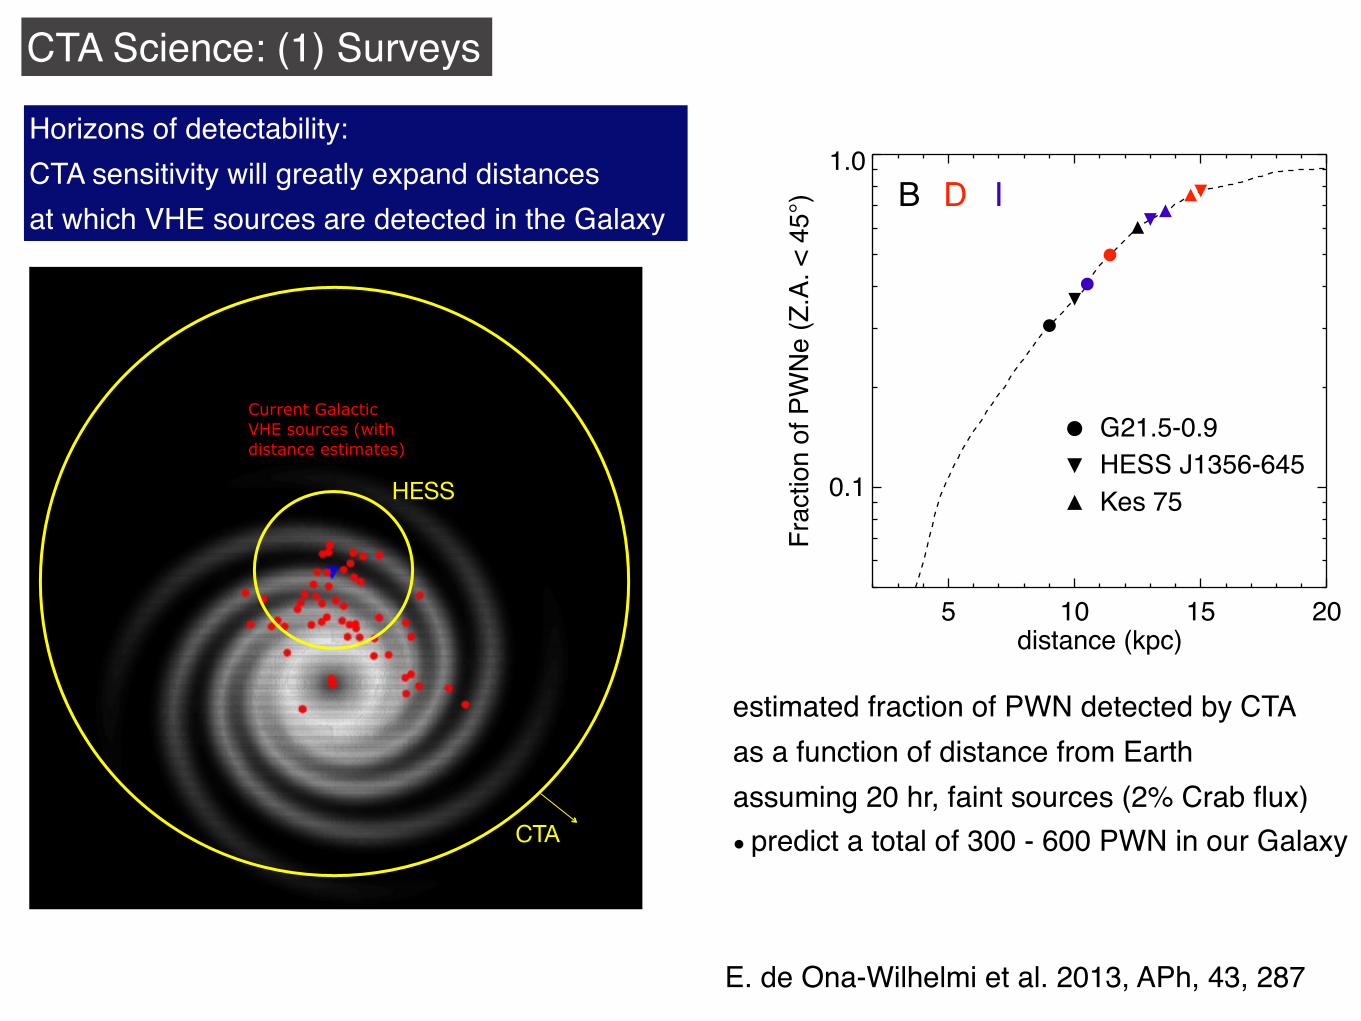
Current GalacticVHE sources (with distance estimates)
HESS
Horizons of detectability:CTA sensitivity will greatly expand distancesat which VHE sources are detected in the Galaxy
estimated fraction of PWN detected by CTA as a function of distance from Earthassuming 20 hr, faint sources (2% Crab flux) predict a total of 300 - 600 PWN in our Galaxy
E. de Ona-Wilhelmi et al. 2013, APh, 43, 287
CTA Science: (1) Surveys
5 10 15 20distance (kpc)
0.1
1.0
Frac
tion
of P
WN
e (Z
.A. <
45°
) B ID
G21.5-0.9HESS J1356-645Kes 75
Figure 15: Fraction of visible PWNe as a function of the distance to the Sun. For each source andeach CTA configuration considered here, filled and open symbols give respectively the horizonsof detectability and resolvability, as defined in the text.
∼40 kyr (for B=3µG, similar to what has been found in several PWNe such asVela X). This gives a total number of detectable G21.5–0.5-, HESSJ1356–645–and Kes75–like PWNe with CTA of NPWN ∼ 800 fPWN (!PWN/40kyr) ("PWN/2),where "PWN is the Galactic VHE-emitting-PWN rate (in units of number of sourcesper century). This implies that ∼ (300-600) PWNe should be detected with CTA(for configurations CTA–I and CTA–D). These estimates should be taken withcare, since we have implicitly assumed that the three considered PWNe are rep-resentative of the whole population of VHE nebulae, i.e. we have not accountedfor any time evolution of the PWN sizes and luminosities, which both depend onmany parameters.
2.2. Pulsars2.2.1. The Crab Pulsar
The Crab pulsar is the only pulsar detected so far at VHE energies with Cherenkovtelescopes. In 2008, MAGIC announced the detection of the Crab pulsation above25 GeV making use of an novel trigger system [22]. Contrary to what one couldexpect from EGRET [32], AGILE [42] (and later on Fermi [2]) observations,the characteristic double-peaked structure of the Crab light-curve was still visi-ble above 25GeV. Recently, VERITAS [23] and MAGIC [20, 21] have reportedthe detection of the Crab pulsar at even higher energies, providing measurementsof the pulsed spectrum which in both cases is well described by a power-law,
21
CTA
Current GalacticVHE sources (with distance estimates)
HESS
Horizons of detectability:CTA sensitivity will greatly expand distancesat which VHE sources are detected in the Galaxy
estimated fraction of PWN detected by CTA as a function of distance from Earthassuming 20 hr, faint sources (2% Crab flux) predict a total of 300 - 600 PWN in our Galaxy
E. de Ona-Wilhelmi et al. 2013, APh, 43, 287
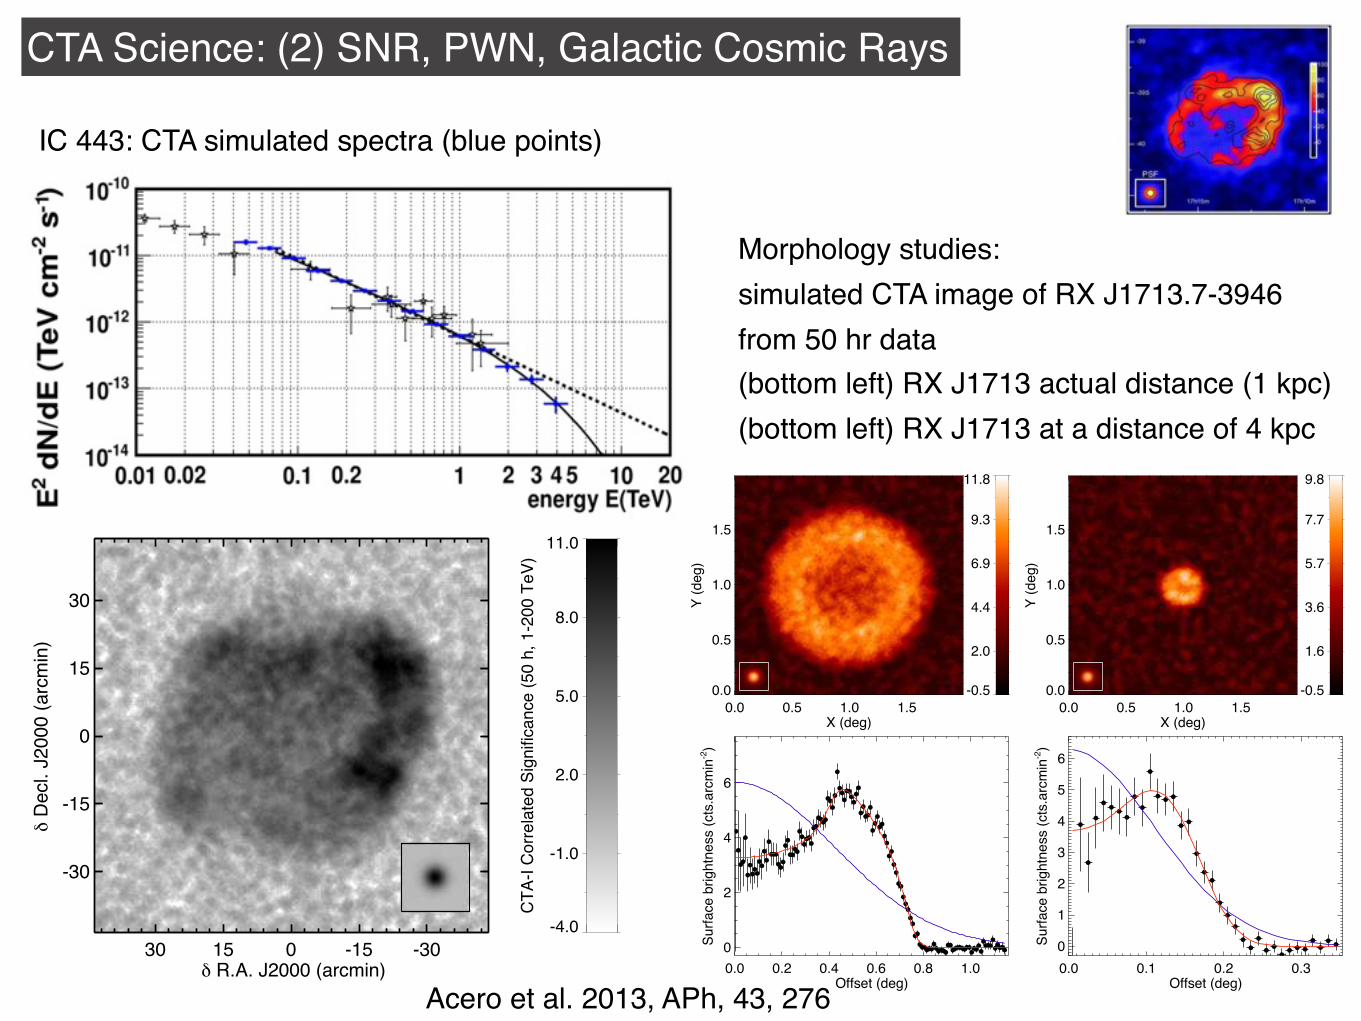
CTA Science: (2) SNR, PWN, Galactic Cosmic Rays
IC 443: CTA simulated spectra (blue points)
284 M. Renaud: SNRs and PWNe in the CTA era
109 1010 1011 1012 1013 1014
Energy (eV)
10-12
10-11
E2 dN
/dE
(erg
cm
-2 s
-1)
Fermi-LAT (2 yr)H.E.S.S. (~90 h)CTA-I (50h)
-1.0 -0.5 0.0 0.5 1.0Log10 Emax (TeV)
0.2
0.3
0.4
0.5
0.6
0.7
!
1.5
1.6
1.7
1.8
2.0
2.1
"
30 15 0 -15 -30# R.A. J2000 (arcmin)
-30
-15
0
15
30
# D
ecl.
J200
0 (a
rcm
in)
-4.0
-1.0
2.0
5.0
8.0
11.0C
TA-I
Cor
rela
ted
Sign
ifica
nce
(50
h, 1
-200
TeV
)
Fig. 2. CTA-I simulations of RX J1713.7−3946 for 50 h of observing time. Left: Spectral energy distribu-tion (SED, in black) with the best-fitted parameters of the joint Fermi/LAT (in red) and H.E.S.S. (in blue)spectrum. The inset figure shows the 1, 2, and 3 σ confidence ellipses in the Ecut-β plane, derived fromthe fit of 100 simulated spectra (solid lines) and of the Fermi/LAT-H.E.S.S. spectrum (dashed lines), su-perimposed on the image of the Γ values. The white dot gives the best-fit values: Γ ∼1.62, Ecut ∼0.78 TeVand β ∼0.38. Right: Correlated significance map (Rcorr = 0.02) above 1 TeV. The XMM-Newton image ofRX J1713.7−3946 [3] has been used as template. The CTA-I PSF is shown in the inset.
respectively. Spatial structures such as the dou-ble shell-like morphology in the W-NW regionare clearly seen. Simulated spectra have alsobeen extracted over 0.25-wide boxes, as de-fined in Aharonian et al. [4]. The mean errorson Γ and Ecut (with β fixed) are estimated tobe of the order of 0.08 and 0.3 TeV (90% con-fidence level), respectively, i.e. small enoughto allow the exploration of possible azimuthalvariations of these parameters, in combinationwith what is performed nowadays in X-rays onthe SC spectrum of many young SNRs.
3. Population studiesOn one hand, the small number of detectedTeV shells (RX J0852−4622 aka Vela Jr,RX J1713.7−3946, RCW 86, SN 1006 andHESS J1731−347) prevents one from perform-ing population studies in order to shed furtherlight on particle acceleration in these sources,even when considering the other (unresolved)detected young shell-type SNRs (such asCas A and Tycho). On the other hand, ∼30VHE PWNe have been detected so far, mainlyin the inner regions of the Galaxy surveyedwith H.E.S.S., most of them being extendedon scales of σ ∼ 0.2. Moreover, a signifi-cant fraction of the unassociated VHE sources
could be such ancient nebulae, as suggestedby de Jager et al. [8]. This scenario seemsto be conforted by the on-going detection ofmany gamma-ray pulsars with Fermi/LAT, sev-eral of which lying close to VHE sources[e.g. MGRO J1908+06/PSR J1907+0602, 1].It is then worth estimating the expected numberof shell-like SNRs and PWNe to be detectedwith CTA, in order to (1) trigger SNR/PWNpopulation studies and (2) quantify the level ofsource confusion along the Galactic Plane (andespecially in the regions close to the spiral armtangents), given the large number of already-detected VHE PWNe and PWN candidates. Inthe following, simulations have been carriedout assuming a reasonable exposure time of20 h in the survey of the Galactic Plane.
For this purpose, three shell-type SNRs(RX J1713.7−3946, Vela Jr, RCW 86)and three PWNe (G21.5−0.9, Kes 75,HESS J1356−645) were considered to berepresentative of the SNR/PWN Galacticpopulations in the VHE domain. Their mor-phological and spectral characteristics, asmeasured with H.E.S.S., together with theirrespective distance estimates, have been usedto simulate sources throughout the inner (|#|< 60, |b| < 5) Galaxy (see Figure 3, upperpanels). The horizon of detectability is defined
M. Renaud: SNRs and PWNe in the CTA era 285
0.0 0.5 1.0 1.5X (deg)
0.0
0.5
1.0
1.5
Y (d
eg)
-0.5
2.0
4.4
6.9
9.3
11.8
0.0 0.2 0.4 0.6 0.8 1.0
Offset (deg)
0
2
4
6
Surfa
ce b
right
ness
(cts
.arc
min
-2)
0.0 0.5 1.0 1.5X (deg)
0.0
0.5
1.0
1.5
Y (d
eg)
-0.5
1.6
3.6
5.7
7.7
9.8
0.0 0.1 0.2 0.3Offset (deg)
0
1
2
3
4
5
6
Surfa
ce b
right
ness
(cts
.arc
min
-2)
Fig. 3. Upper panels: CTA-I simulated images ofRX J1713.7−3946-like SNR located at 1 (left) and4 (right) kpc. The color bars give the correlated sig-nificance, and the CTA-I PSF is shown in the insets.Lower panels: Radial profiles of the VHE surfacebrightness at 1 (left) and 4 (right) kpc. The blue andred lines represent the best-fit curves for uniform-sphere and shell-type morphologies, respectively.
as the distance at which the source has apeak significance of 5, while the horizon ofresolvability (for shell-type SNRs) representsthe distance up to which a shell-type fit on thesource radial profile (see Figure 3, bottom) isfavored at ≥ 3 σ over a simple gaussian fit(i.e. the shell is identified as such, and statisti-cally favored over a PWN-like shape). Thesetwo horizons can be translated into fractionsof the total number of detectable/resolvablesources with CTA, based on a model of theGalactic source distribution. The logarithmicspiral arms model of Vallee [17] is assumed,with a galactocentric distribution given byCase & Bhattacharya [7], and an arm disper-sion as a function of the galactocentric radiusfollowing the Galactic dust model of Drimmel& Spergel [10]2. The resulting source distri-bution is shown in Figure 4, together withthe fraction of visible3 SNRs and PWNe as afunction of the distance to the Sun.2 With regard to PWNe, any potential displace-
ment from pulsar birth place due to the kick velocityhas been ignored.3 The visibility is defined here as the fraction of
the sky seen by an observatory located at the samelatitude as the H.E.S.S. site, at zenith angles ≤ 45.
As seen in Figure 4 (middle), a large frac-tion fSNR (∼0.3–0.9) of RXJ1713-, VelaJr- andRCW86-like Galactic SNRs should be de-tectable with CTA-I/D (both configurationsbeing definitively favored in comparison toB, discarded in the following), but only asmall fraction of them (∼0.1–0.2) would ac-tually be resolvable. Although the timescale(τSNR) during which a SNR shines in the VHEdomain is very sensitive to many parame-ters (related to the stellar progenitor, the ac-celeration process and the ambient medium),it is assumed to be identical among all theSNRs. Therefore, the fractions given aboveare converted into numbers following NSNR ∼75 fSNR (τSNR/3kyr) (νSN/2.5), where νSN is theGalactic SN rate [in SNe per century, see 14].This leads to ∼20–70 detectable TeV SNRs,among which ∼7–15 would be resolved withCTA-I/D. The same simulations have been car-ried out by improving the CTA PSF by a factorof 2 (i.e. ! 1′ at 1 TeV, see Figure 1) in order toquantify the effect of the angular resolution onthe number of detectable (Ndetect) and resolv-able (Nresolv) SNRs. While Ndetect gets larger byonly 20% at most, Nresolv increases by a factorof (1.5–1.9).
As for PWNe, a large fraction fPWN (∼0.4–0.8) of G21.5-, HESSJ1356- and Kes75-like nebulae should be detectable with CTA-I/D (see Figure 4, right). de Jager & Djannati-Ataı [9] have estimated the lifetime of TeV-emitting leptons in such sources to be ∼40 kyr(for B = 3 µG, similar to what has been foundin several PWNe such as Vela X). This givesNPWN ∼ 800 fPWN (τPWN/40kyr) (νPSR/2), andimplies that ∼ (300–600) PWNe should be de-tected with CTA-I/D. Again, these estimatesshould be taken with care as they do not ac-count for any time evolution of the TeV lumi-nosity in these sources, which itself depends onmany parameters [e.g. 12].
4. ConclusionsIn this contribution, simulations of Galacticshell-type SNRs and PWNe in the VHE do-main as seen with CTA have been presented,for three different array configurations. Asshown above, the configurations optimized at
Morphology studies:simulated CTA image of RX J1713.7-3946 from 50 hr data(bottom left) RX J1713 actual distance (1 kpc) (bottom left) RX J1713 at a distance of 4 kpc
Acero et al. 2013, APh, 43, 276
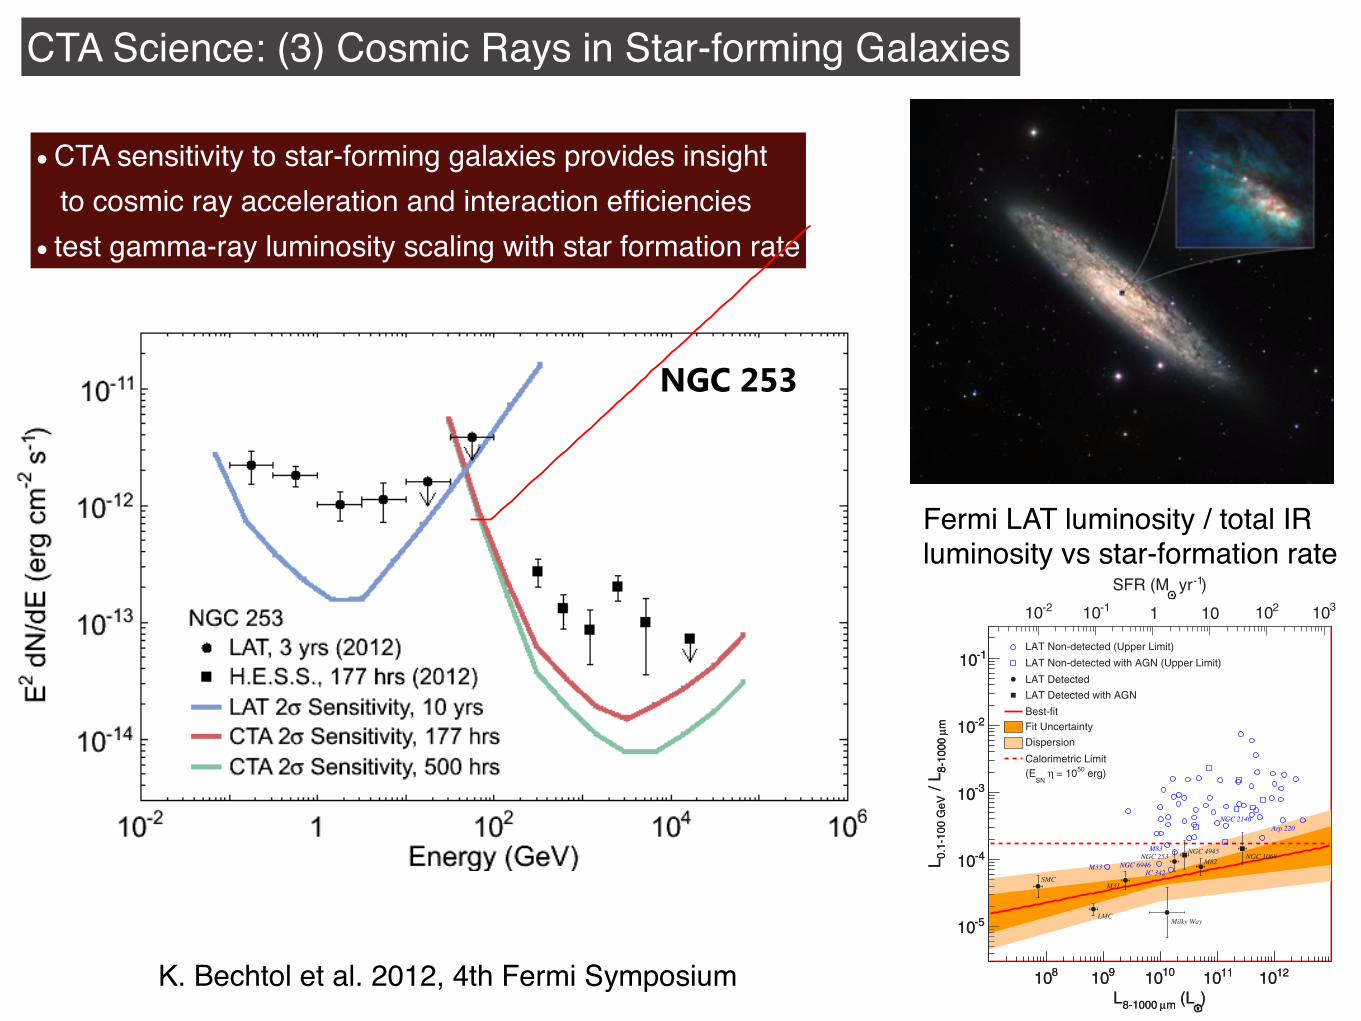
CTA Science: (3) Cosmic Rays in Star-forming Galaxies
!"#$%&'()*+(,'-'#./0(+.'#-(!"#$%&''&("&)$*+#,-"&$./$*-&"01"*-*$'."#$,.'+2#3$-4&5$*6'+2#$+.7#"$2&7*8$
9 $:6%4#*-$#5#"%)$;<*$65$*-&"01"*-$*)*-#'*8$$
;&5$-4#$*-&"01"*-$=$>6*?$0#$*#+&"&-#>$76-4$;@!$6'&%65%8$
1#$$#2.#3(4'5'/5678-(79(:1)(;<=(>650(9?5?.'(4699'.'856#&(-'8-656@653(
/?.@'-(7@'.@(>#/65#>$&*$A $>#-#,-6.5*$65$065*$./$B=C$>#,&>#$65$#5#"%)$
D,.1"-#*)$9-#/&5$E15?F$$*##$&2*.$&"G6HIBAJKLJMCAN$
:1)(;<=(
K. Bechtol et al. 2012, 4th Fermi Symposium
CTA sensitivity to star-forming galaxies provides insight to cosmic ray acceleration and interaction efficiencies test gamma-ray luminosity scaling with star formation rate
The Astrophysical Journal, 755:164 (23pp), 2012 August 20 Ackermann et al.
)-1 (W Hz1.4 GHzL
1910 2010 2110 2210 2310 2410
)-1
(er
g s
0.1-
100
GeV
L
3710
3810
3910
4010
4110
4210
4310
)-1 yrSFR (M-210 -110 1 10 210 310
M33M31
SMC
NGC 6946
Milky Way
M82M83
Arp 220
NGC 4945
IC 342
NGC 253
NGC 1068NGC 2146
LMC
LAT Non-detected (Upper Limit)
LAT Non-detected with AGN (Upper Limit)
LAT DetectedLAT Detected with AGN
Best-fitFit UncertaintyDispersion
Calorimetric Limit erg)50 = 10η
SN(E
) (W Hz1.4 GHzL
1910 2010 2110 2210 2310 2410
) (
erg
s0.
1-10
0 G
eVL
3710
3810
3910
4010
4110
4210
4310
)-1 (W Hz1.4 GHzL
1910 2010 2110 2210 2310 2410
1.4
GH
z /
L0.
1-10
0 G
eVL
10
210
310
410
510
)-1 yrSFR (M-210 -110 1 10 210 310
M33
M31SMCNGC 6946
Milky Way
M82
M83
Arp 220
NGC 4945IC 342
NGC 253
NGC 1068
NGC 2146
LMC
LAT Non-detected (Upper Limit)
LAT Non-detected with AGN (Upper Limit)
LAT DetectedLAT Detected with AGN
Best-fitFit UncertaintyDispersion
Calorimetric Limit erg)50 = 10η
SN(E
) (W Hz1.4 GHzL
1910 2010 2110 2210 2310 2410
1.4
GH
z /
L0.
1-10
0 G
eVL
10
210
310
410
510
Figure 3. Top panel: gamma-ray luminosity (0.1–100 GeV) vs. RC luminosityat 1.4 GHz. Galaxies significantly detected by the LAT are indicated with filledsymbols whereas galaxies with gamma-ray flux upper limits (95% confidencelevel) are marked with open symbols. Galaxies hosting Swift-BAT AGNs areshown with square markers. RC luminosity uncertainties for the non-detectedgalaxies are omitted for clarity, but are typically less than 5% at a fixed distance.The upper abscissa indicates SFR estimated from the RC luminosity according toEquation (2) (Yun et al. 2001). The best-fit power-law relation obtained using theEM algorithm is shown by the red solid line along with the fit uncertainty (darkershaded region), and intrinsic dispersion around the fitted relation (lighter shadedregion). The dashed red line represents the expected gamma-ray luminosityin the calorimetric limit assuming an average CR luminosity per supernovaof ESN η = 1050 erg (see Section 5.1). Bottom panel: ratio of gamma-rayluminosity (0.1–100 GeV) to RC luminosity at 1.4 GHz.(A color version of this figure is available in the online journal.)
Although these three SFR estimators are intrinsically linked,each explores a different stage of stellar evolution and issubject to different astrophysical and observational systematicuncertainties.
Figures 3 and 4 compare the gamma-ray luminosities ofgalaxies in our sample to their differential luminosities at1.4 GHz, and total IR luminosities (8–1000 µm), respectively.
) (Lmµ8-1000 L
810 910 1010 1110 1210
)-1
(er
g s
0.1-
100
GeV
L
3710
3810
3910
4010
4110
4210
4310
)-1 yrSFR (M-210 -110 1 10 210 310
M33
M31
SMC
NGC 6946
Milky Way
M82
M83
Arp 220
NGC 4945
IC 342
NGC 253
NGC 1068
NGC 2146
LMC
LAT Non-detected (Upper Limit)
LAT Non-detected with AGN (Upper Limit)
LAT DetectedLAT Detected with AGN
Best-fitFit UncertaintyDispersion
Calorimetric Limit erg)50 = 10η
SN(E
) (Lmµ8-1000 L
810 910 1010 1110 1210
)-1
(er
g s
0.1-
100
GeV
L
3710
3810
3910
4010
4110
4210
4310
) (Lmµ8-1000 L
810 910 1010 1110 1210
mµ8-
1000
/
L0.
1-10
0 G
eVL
-510
-410
-310
-210
-110
)-1 yrSFR (M-210 -110 1 10 210 310
M33
M31SMC
NGC 6946
Milky Way
M82
M83
Arp 220
NGC 4945
IC 342
NGC 253 NGC 1068
NGC 2146
LMC
LAT Non-detected (Upper Limit)
LAT Non-detected with AGN (Upper Limit)
LAT DetectedLAT Detected with AGN
Best-fitFit UncertaintyDispersion
Calorimetric Limit erg)50 = 10η
SN(E
) (Lmµ8-1000 L
810 910 1010 1110 1210
mµ8-
1000
/
L0.
1-10
0 G
eVL
-510
-410
-310
-210
-110
Figure 4. Same as Figure 3, but showing gamma-ray luminosity (0.1–100 GeV)vs. total IR luminosity (8–1000 µm). IR luminosity uncertainties for the non-detected galaxies are omitted for clarity, but are typically ∼0.06 dex. Theupper abscissa indicates SFR estimated from the IR luminosity according toEquation (1) (Kennicutt 1998b).(A color version of this figure is available in the online journal.)
A second abscissa axis has been drawn on each figure toindicate the estimated SFR corresponding to either RC or totalIR luminosity using Equations (2) and (1). The upper panelsof Figures 3 and 4 directly compare luminosities betweenwavebands, whereas the lower panels compare luminosity ratios.Taken at face value, the two figures show a clear positivecorrelation between gamma-ray luminosity and SFR, as hasbeen reported previously in LAT data (see in this context Abdoet al. 2010b). However, sample selection effects, and galaxiesnot yet detected in gamma rays must be taken into account toproperly determine the significance of the apparent correlations.
We test the significances of multiwavelength correlationsusing the modified Kendall τ rank correlation test proposed byAkritas & Siebert (1996). This method is an example of “survival
9
Fermi LAT luminosity / total IR luminosity vs star-formation rate
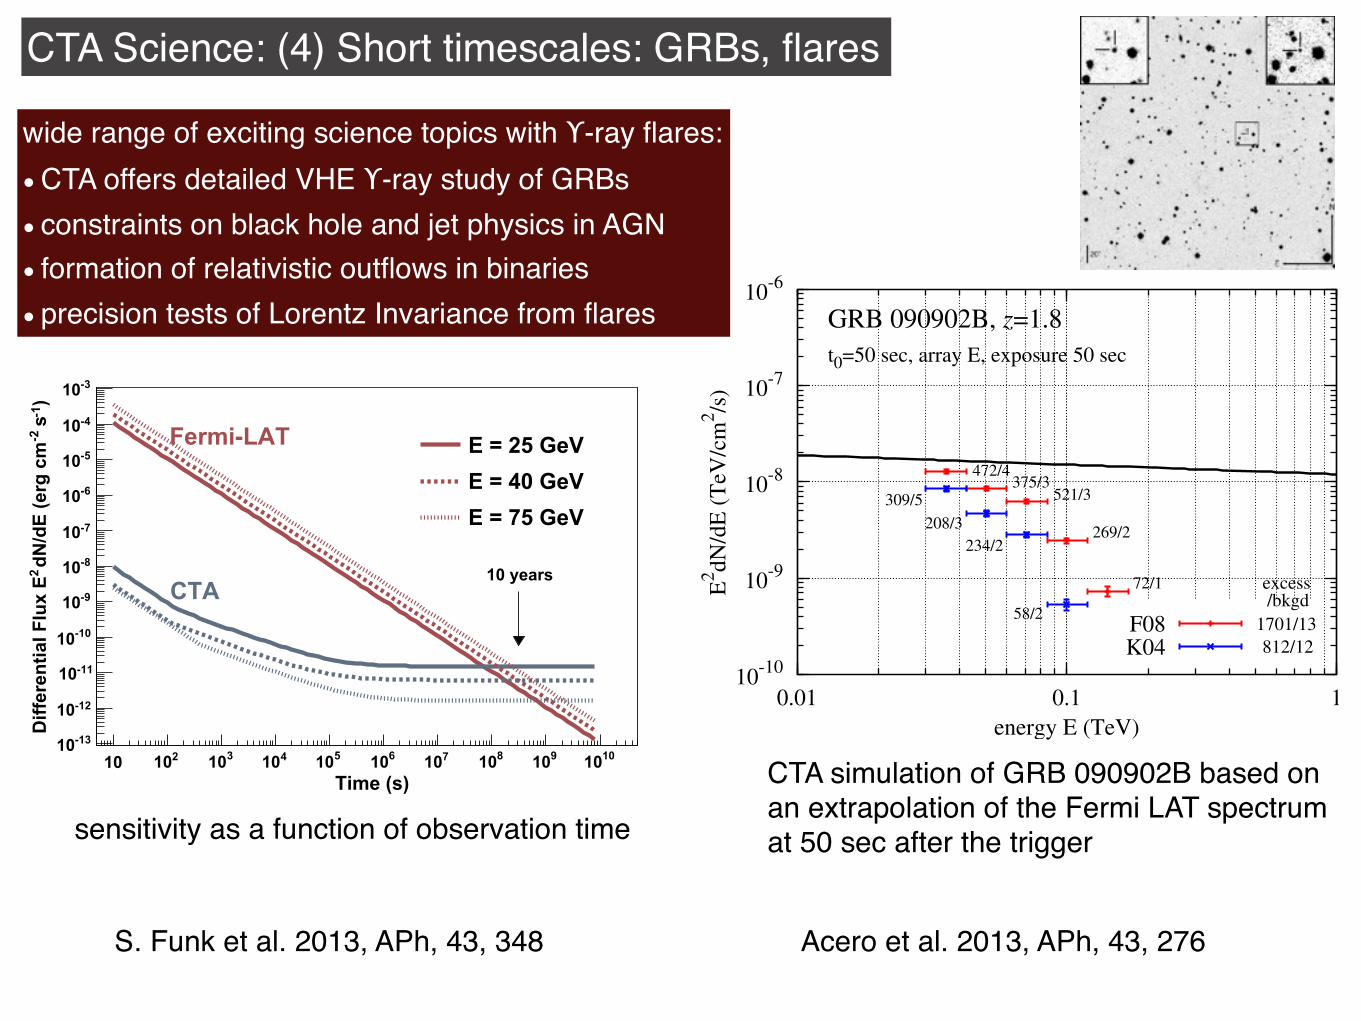
CTA Science: (4) Short timescales: GRBs, flares
magnitude which constitutes a large discovery potential. It shouldhowever be said that for transient sources the Fermi-LAT has theadvantage of a 2.4p sr field of view which makes catching tran-sients much more likely. In addition, the Fermi-LAT can view outgamma rays to much larger redshifts due to the cc pair productionopacity of the Universe at higher gamma-ray energies. The exactposition of the kink in the graphs for CTA depends on the exactassumptions on the background systematics as discussed above.Again, it can be expected, that the CTA sensitivity for short-dura-tion events can be significantly improved compared to the currentinstrument response function.
In addition to faint sources, it is also interesting to considerbright sources. Recent measurements have established pulsedemission from the Crab Pulsar in the > 25 GeV range [36,37]. Forsuch observation the systematic error on the background levelcan be significantly reduced, since the local background can bedetermined from the off-phase of the pulsar. In this case the aimis no more the detection in each energy bin, but rather a very smallerror on the measured flux. In Fig. 6 we illustrate the effect ofrequiring 10r per energy bin (and correspondingly 100 events toget the same error on the flux in the signal-limited regime) andthe suppression of the systematic error on the cross-over energyEcross. For the special case of the pulsar observations, the cross-overenergy can be significantly reduced and will be close to ! 25 GeV
(compared to ! 40 GeV in the standard case of 5r and 10 eventsand 1% systematic error on the background flux).
4. Integral sensitivity
The potential of an instrument to discover new sources, orevents, is related to its integrated performance over the relevantenergy range. Unfortunately estimates of integral flux sensitivityare always strongly dependent on the assumed spectral shape.The most common approach assumes a power-law spectrum of agiven spectral index (C) and calculates the minimum flux (Fmin)above a given energy (E0) that is required for detection. As the min-imum flux in terms of photon rate per unit area is often a rapidlyfalling function of energy E" Fmin, a quantity with the same unitsas mFm, is often plotted. Implicit in this method is that the sourcespectrum starts abruptly at E0 (or that all information below E0 isdisregarded) and that the source spectral power-law extends toinfinity. Both of these assumptions are highly unrealistic in prac-tice. Here we adopt an alternative approach to estimate minimumdetectable flux, based on a characteristic energy in the source spec-trum: either a spectral energy distribution (SED) peak or a cut-offenergy. We define /ðEcÞ as the minimum detectable integrated en-ergy flux over the full energy range of a source with a spectrumdN=dE / E%C exp%E=Ec . A significance of 5r and a minimum num-ber of 10 events were requested (this section deals mostly with thedetection of sources, not so much with the measurement of spec-tra). Fig. 7 shows this quantity for Fermi and CTA for two choicesof C, 1.5 and 2.0. In the case C ¼ 1:5; Ec corresponds roughly tothe SED peak energy. The minima in / seen for Fermi at ! 3 GeVand CTA at ! 10 TeV in the left panel of Fig. 7 can be interpretedas the energies at which these instruments are most sensitive forsource detection. The cross-over between Fermi and CTA is at acutoff energy of ! 90 GeV. The case C ¼ 2 is also interesting, dem-onstrating how dramatic the impact of a cut-off in the source spec-trum is on the detection probability: for CTA a cut-off at 100 GeVraises the minimum required source power by an order of magni-tude with respect to a > 1 TeV cut-off and a detection of such asource with Fermi is much more likely for the observation timesassumed (10 years for Fermi and 100 h for CTA). The cross-over be-tween Fermi-LAT and CTA in this curve is at a cutoff energy of! 370 GeV.
To help relate these curves to detection sensitivity for astrophys-ical objects, the right-hand axis of Fig. 7 gives the correspondingsource luminosity at 1 kpc. For reference a canonical proton
Observation time Fermi [log10(s)]3 4 5 6 7 8 9 10
Obs
erva
tion
time
HESS
[log
10(s
)]
1
2
3
4
5
6
7
8
Cros
s-ov
er E
nerg
y [G
eV]
20
40
60
80
100
120
140
160
180
200
220
H.E.S.S.
10 Years1 Year
1 Month1 Week
200 Hours
50 Hours
1 Hour
1 Minute
Observation time Fermi [log10(s)]3 4 5 6 7 8 9 10
Obs
erva
tion
time
CTA
[log1
0(s)
]
1
2
3
4
5
6
7
8
Cros
s-ov
er E
nerg
y [G
eV]
20
40
60
80
100
120
140
160
CTA
10 Years1 Year
1 Month1 Week
200 Hours
50 Hours
1 Hour
1 Minute
Fig. 4. Cross over energy Ecross as a function of Fermi-LAT and of H.E.S.S. (left) or CTA (right) observation time. Here we required a detection significance in each energy bin of5r and a minimum number of 25 events in each bin (to get comparable errors on the flux measurement in the bin (see text for a discussion). No optimization for loosening thecuts at short observation times has been performed (the Fermi-LAT pass6_v3 diffuse response function was used), therefore in principle the Fermi response could besomewhat better - but not by much, given the limited physical area of the instrument. Also for CTA, the curves could be improved if the systematics are brought under controland there was a smaller systematic error on the background estimate.
Time (s)10 210 310 410 510 610 710 810 910 1010
)-1
s-2
dN/d
E (e
rg c
m2
Diffe
rent
ial F
lux
E
-1310
-1210
-1110
-1010
-910
-810
-710
-610
-510
-410
-310
E = 25 GeVE = 40 GeVE = 75 GeV
Fermi-LAT
CTA10 years
Fig. 5. Differential sensitivity at selected energies as a function of observation time.These plots were generated for a detection significance of 5r in the relevant energybin and a minimum number of 25 events.
S. Funk, J.A. Hinton / Astroparticle Physics 43 (2013) 348–355 351
S. Funk et al. 2013, APh, 43, 348
number of ! 0:1—1 TeV photons with variability timescale of a fewseconds may be detectable, potentially improving the Fermi limitby up to a factor of ! 103. Thus, such wide-field mode observationscan make a profound impact on fundamental physics by probingLIV with extraordinary precision.
All methods of constraining LIV require large amplitude, shorttimescale variability and bright high-energy emission. Hence theprompt emission is more favorable for this purpose than the after-glow, which is fainter and generally has a smooth temporal profile.Nevertheless, the X-ray flares that are often observed by Swiftsuperimposed on the afterglow may also have correlated emissionat GeV–TeV energies, as predicted in some models [97,98,84] andmay have been seen in GRB 100728A [96]. In view of the higher ex-pected detection rates in the afterglow phase with CTA (Section 6),such late-time flares may also be interesting for probing LIV. How-ever, most X-ray flares have durations DtJ0:1t with respect to thepost-trigger time t (possibly being a factor of ! 2 longer at GeV–TeV [84]), and their luminosities rapidly decrease with t [221].Compared to the prompt emission for which the average durationand luminosity of spikes in the light curve are roughly constant,LIV constraints from high-energy flares during the afterglow arethus expected to be weaker.
5. Simulations of GRB observations
In order to quantify the prospects for CTA observations, we nowpresent some simulated spectra and light curves of GRBs. Althoughour ultimate aim is to assess the different science cases discussedabove, in view of the wide range of uncertainties in the currentphysical models, here we take a purely phenomenological ap-proach as a first step. Choosing as templates some prominentbursts detected by Fermi LAT whose spectra and variability wererelatively well characterized up to multi-GeV energies, we simplyassume that their intrinsic spectra extend to higher energies aspower-law extrapolations, while accounting for the effects of EBLattenuation based on selected models. These simulations shouldbe considered exemplary first results on which we can elaboratefurther in the future by incorporating more physical ingredientsdepending on the specific science motivation.
5.1. Simulations of spectra
A series of spectral simulations have been conducted utilizingversion 4 of the CTA simulation tool developed by Daniel Mazinand colleagues (see [222] for more details). Our assumptions areas follows.
" Take as templates the bright LAT GRBs 090902B (z ¼ 1:822) [35]and 080916C (z ¼ 4:35) [33].
" Extrapolate their spectra to higher energies using the spectralindices measured by LAT at specific time intervals.
" Using the time decay indices measured by LAT, normalize theflux at some post-trigger time t0, allowing for some delay inthe telescope response (sometimes optimistically, e.g. 35 s,otherwise quite reasonably, e.g. 50–150 s).
" Besides the template bursts with their actual redshifts, consideralso events with the same intrinsic properties but with redshiftsscaled to different values from z ¼ 1 to 6.5, accounting for spec-tral and temporal redshift corrections.
" Adopt a range of EBL models, e.g. [192,194,196,208,199]." Generally take array configuration E (perceived as a balancedchoice for a broad range of science goals), but also configurationB (with optimal performance for the lowest energies) in a fewselected cases. (See [222] for more information on arrayconfigurations.)
" Assume 20 deg for the zenith angle of observation." Simulate the spectra that would be measured by CTA with theaforementioned tool, taking exposure times in accord with theconsidered t0.
" For GRB 090902B, the considered t0 are all in the extendedemission phase at t0 >25 s, and we take photon indexC ¼ $2:1 and time decay index dt ¼ $1:5 [35].
" For GRB 080916C, the considered t0 correspond to time interval‘‘d’’ (t0 ¼ 16–55 s for z ¼ 4:3) with C ¼ $1:85. Note that thisspectral index is from the LAT only fits and not the GBM + LATjoint fits. The time decay index is always dt ¼ $1:2.
" As the template bursts are at the upper end of the luminositydistribution and the probabililty of their detection could be rel-atively low (Section 6), consider also events with the sameintrinsic properties but with fluxes scaled by factor 1/10 thatmay correspond to bursts with more typical luminosities.
Some selected results are displayed in Figs. 7–11.For GRB 090902B, LAT detected 1 photon above 30 GeV at
t0 !80 s, while the CTA simulations for 50 s exposure near this t0result in !1000–2000 photons depending on the EBL (Fig. 7). Thisis roughly consistent with the expected factor ! 104 difference ineffective area at 30 GeV [19].
Luminous bursts at low z can result in enormous numbers of de-tected photons (Fig. 8) and and permit detailed studies of lightcurves and time-resolved spectra (Section 5.2), from which wemay delve into many issues left unsolved by Fermi. For z ¼ 1, notealso the potentially significant detection even up to !400 GeV andafter EBL attenuation by !3 orders of magnitude. However, thispostulates that the whole array has been slewed sufficiently rap-idly, whereas in reality, the sensitivity at the higher energies fromthe MSTs/SSTs may not be available, at least not very rapidly. Suchsimulations and comparison with those for different subarray com-binations should be useful for addressing the relative merits/demerits of slewing the non-LST components.
Distant GRBs may also be detectable, which would serve aspowerful probes of the EBL at z > 2, beyond the expected reachof AGNs (Fig. 9), and possibly even into the cosmic reionizationepoch at z > 6 (Fig. 10). Even for some EBL models predicting sig-
Fig. 7. Simulated spectra for GRB 090902B at z ¼1.8, for exposure time 50 s andarray configuration E, adopting the EBL model of Franceschini et al. [194] (red) andthe ‘‘best fit’’ EBL model of Kneiske et al. [192] (blue). The number of detectedphotons/background events are denoted for each energy bin beside the data points,as well as for all energies in the legend. The assumed source flux isdN=dE ¼ 1:2% 10$8 ðE=TeVÞ$2:1 cm$2 s$1 TeV$1 (black solid line), representing apower-law extrapolation of the observed Fermi LAT spectrum at t ¼50 s aftertrigger. (For interpretation of the references to colour in this figure legend, thereader is referred to the web version of this article.)
264 S. Inoue et al. / Astroparticle Physics 43 (2013) 252–275
Acero et al. 2013, APh, 43, 276
wide range of exciting science topics with ϒ-ray flares: CTA offers detailed VHE ϒ-ray study of GRBs constraints on black hole and jet physics in AGN formation of relativistic outflows in binaries precision tests of Lorentz Invariance from flares
sensitivity as a function of observation time
CTA simulation of GRB 090902B based on an extrapolation of the Fermi LAT spectrum at 50 sec after the trigger
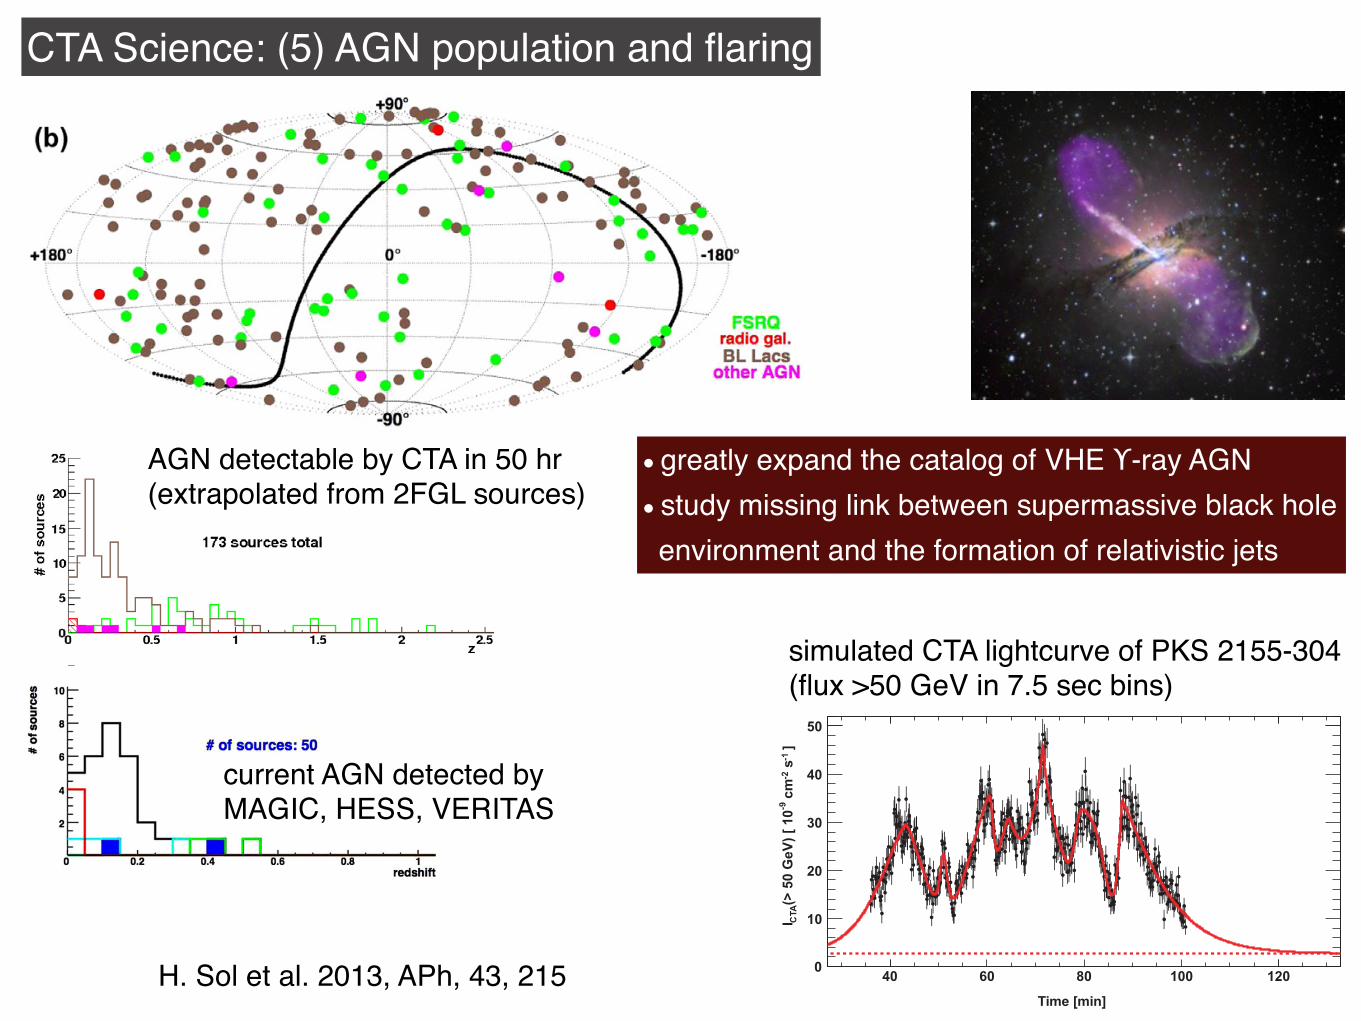
CTA Science: (5) AGN population and flaring
CTA will therefore clarify the actual distribution of observed pho-ton index versus redshift (Fig. 4) and should offer the possibilityto study evolutionary effects at VHE, at least for the blazar class.
3.1. The population of blazars
What will be the best strategy to gather complete samples ofsources? A blind imaging survey is the most unbiased way to ob-serve in a given waveband, and potentially includes the possibilityof discovering unexpected objects, such as isolated black holes ex-pelled from host star clusters [51,52] or final evaporation of pri-mordial black holes [53,54]. Given our present ignorance of AGNproperties and statistics at VHE, it is not yet certain how manyAGN can be detected by deep surveys for a realistic observing timewith CTA.
Estimates have been done for the blazar class, including BL Lacsources and FSRQs, based on a blazar gamma-ray luminosity func-tion model consistent with recent Fermi results [55,56] and underthe conservative assumption of the standard blazar sequence tosimulate the SED. The number of blazars detectable by CTA inblank fields has been estimated for various array configuration(see also the survey article in this issue). The best case leads toabout 0.36 blazars detected above 30 GeV in 40 deg2, for 50 h ofexposure time. This results into 370 blazars potentially detectableby CTA, for an all-sky survey with 50 h/FoV. This requires a verylong observing time, and more than 30 years,1 comparable with
Fig. 8. Skymaps of AGN with confirmed redshift from the second Fermi catalog (2FGL) that are potentially detectable by CTA in 5 h (panel a), 50 h (panel b) and 150 h (panelc) maximum exposure time per FoV (assuming the array configuration B and a 20! zenith angle over the whole sky). It should be noted that several extragalactic sources thatare already known to be TeV emitters do not appear in this figure, due to the tight selection criteria applied here and the existence of non-Fermi VHE sources. Such skymapsshould be obtained in less than two months (a), in about three years (b) and in less than 10 years (c) with CTA, assuming 1500 h observing time per year.
1 Throughout this section, we assume a CTA field of view (FoV) of 7! and 1500 h ofobserving time per year. One can anticipate that typically one third of the whole CTAobserving time, including the two sites, could be devoted to AGN programs.
220 H. Sol et al. / Astroparticle Physics 43 (2013) 215–240
the expected lifetime of CTA. However, relatively bright objectsshould readily come out in a full-sky survey at ! 1% Crab level inabout one year. The expected cumulative redshift distribution inthe entire sky is shown in Fig. 7. For a conservative view of blazarstatistics, which tends to minimize VHE emission, CTA has the po-tential to find at least 20 blazars at redshift larger than 1 with itsconfiguration B [57,58]. Should the standard blazar sequence be re-vised with more high redshift TeV blazars, still higher detection rateswould be expected.
Blank field sky surveys are mandatory because they providesamples of sources with minimal observational biases, especiallyfrom other waveband observations or from detections triggeredby alerts, which is essential for any reliable statistical analysisof the blazar population. As deep surveys are very timeconsuming, they will be extended over many years, in the fieldsof specific targets. One can anticipate that for a FoV of 7!, morethan 100 serendipitous discoveries of blazars should beobtained in the field of other extragalactic sources in about10 years.
3.2. Extrapolating from Fermi sources
Follow-up observations of sources already detected at lowerfrequencies offer another promising approach – biased but faster– in the search for TeV AGN. Here we consider the case of the Fermisatellite, which has already provided detections of a large sampleof AGN in the high energy range. The detection of blazars in theFermi LAT energy band (!0.1 to 100 GeV), i.e. at energies belowor partially overlapping with the ones accessible with CTA, pro-vides important information about the intrinsic spectral propertiesof extragalactic sources, which are mostly unaffected by c-rayabsorption on the EBL in the Fermi LAT band. The combination ofsame-epoch Fermi and CTA measurements of AGN spectra will beof great importance since it will provide a broad-band measure-ment over ! 5 decades in energy.
In order to make predictions for CTA, we extrapolated Fermi/LAT AGN spectra into VHE frequencies taking EBL attenuation intoaccount [41]. Two independent analyses, based on slightly differ-ent selections of sources and assumptions on their detection, lead
Fig. 9. Redshift distributions of the AGN with confirmed redshift from the second Fermi catalog (2FGL) that are potentially detectable by CTA in 5 h (panel a), 50 h (panel b)and 150 h (panel c) maximum exposure time per FoV (assuming the array configuration B and a 20! zenith angle over the whole sky). These distributions correspond to theskymaps shown in Fig. 8. The same color code is used: brown for BL Lacs, green for FSRQs, red for radio galaxies and magenta for other types of AGN. (For interpretation of thereferences to color in this figure legend, the reader is referred to the web version of this article.)
H. Sol et al. / Astroparticle Physics 43 (2013) 215–240 221
R0 ctvard1þ z
; ð2Þ
where d, the Doppler factor, is in the range from a few up to a fewtens, gives R0 $ 1014 to $ 1017 cm. VLBI radio monitoring of the clos-est objects confirms this argument by showing growing evidence of
correlation between VHE activity and VLBI core evolution [20–23].The existence of additional extended VHE emission remains aninteresting possibility [24–26].
The number of detected TeV sources per class of AGN appearsextremely peculiar since the blazars are usually the smallest pop-ulation among all types of AGN seen across the electromagnetic
Fig. 1. Distribution in galactic coordinates of the VHE active Galactic Nuclei currently detected by the present generation of Cherenkov experiments H.E.S.S., MAGIC andVERITAS, as listed in the TeVCat catalog in October 2012). The detection of some fifty sources in the TeV domain is now firmly confirmed. Various types of AGN are shown, aswell as their distribution in redshift.
Fig. 2. The big flare of PKS 2155-304 observed in 2006 by H.E.S.S., with variability down to a few minute scale [2]. Fig. 16 of part 5 shows how CTA could have seen it.
H. Sol et al. / Astroparticle Physics 43 (2013) 215–240 217
One specific CTA lightcurve realization is shown in Fig. 16. Pro-vided the red noise behavior extends to higher frequencies, addi-tional substructures which could not have been resolved byH.E.S.S. are revealed by the peak finding and fitting procedure. Dur-ing such an event, the shortest significant rise time accessible toCTA would be sr ¼ 25" 4 s (second peak on Fig. 16), which isapproximately seven times smaller than sr H:E:S:S: ¼ 173" 28 s. Suchan upper limit on the smallest variability time scale constrains theratio of the size of the emission region over the Doppler factor toRd#1 6 csr=ð1þ ZÞ ' 6:7( 1011 cm, implying e.g. an emission re-gion smaller than 1 AU for a Doppler factor of 20, an unusual valuein the current acceleration models used for AGN. The detection ofsuch short time scale events would be a real challenge for jet for-mation models.
This first example illustrates the great CTA timing capabilitieswhich could detect events almost ten times shorter than the short-est ones detected by current IACT. This temporal resolution, belowthe minute time scale under exceptional circumstances, could im-pose severe constraints on acceleration mechanisms and raise thequestion of the maximal Fourier frequency accessible to very highenergy sources. However, such events are relatively rare and willrequire long term monitoring of large samples of AGN and the trig-gering of observations under alarm to be efficiently detected. Be-low we present a more general statistical study which aims atassessing the typical gain in terms of temporal resolution of flaringevents that CTA could monitor.
To perform this statistical study, we chose to adopt unbinned,non-parametric methods, in order to take into account all theavailable timing information present in the light-curves and allowto probe for short variability events in a model-independent way.We generated a family of light-curves [180], with an empiricalPSD index b ' 2, which are independent realizations of the processdescribing the H.E.S.S. observations of 2006. A second group oflight-curves was also generated, extending the PSD to the higherfrequencies which would be accessible by CTA, as described inour first example. These unbinned sequences of time-taggedevents were further analyzed for variability using the BayesianBlocks algorithm [181–183], which aim at finding the best parti-tion of a sequence of events in a non-parametric fashion. The opti-mization of the Bayesian priors of the analysis is described inAppendix B.
Two groups of 1,000 light-curves were derived for H.E.S.S. andfor the CTA extrapolation. Observe that the power law describingthe PSD being essentially the same for both groups, the only differ-ence between the two data sets is the sampling provided by theinstrument. The distribution of flare doubling times sd for both
samples is shown in Fig. 17. Many of the light-curve features notresolved in the H.E.S.S. sample can be separated in different eventswith the CTA resolution, shifting the peak of the distribution to-wards shorter duration events and thus revealing additional infor-mation about the timing structure of the source which waspreviously unnoticed. In particular, the most probable flare sd de-rived for H.E.S.S. is of the order of 5 min, a typical value for theH.E.S.S. light-curve of PKS 2155-304 in 2006. With CTA, this valueis expected to shift to 100 s, a factor of 3 shorter than H.E.S.S.
The probability of occurrence and detection of a given ultra-fastflare as presented in the beginning of this section can be assessedby comparing the cumulative distribution of the flare durations asderived from our MC simulations (Fig. 18). If short events are pres-ent in PKS 2155-like light-curves, these will be better sampled byCTA, up to the high resolution limit of the instrument. In the PKS2155-304 light-curve as seen by H.E.S.S. in 2006 [2], the shortestvariability event was of 173 s, which from simulations has an esti-mated probability of occurrence and detection by an instrumentlike H.E.S.S. of '13% (a rare event). With the improved capabilities
Time [min]40 60 80 100 120
]-1
s-2
cm
-9(>
50
GeV
) [ 1
0C
TAI
0
10
20
30
40
50
Fig. 16. Simulated integral flux of PKS 2155-304 above 50 GeV as CTA would monitor it. This simulation relies on an extension of the red noise behavior to high frequencies,generating the short time scale structures (second and fourth peaks). The data are binned in 7.5 s intervals.
Fig. 17. Kernel density estimates for the distributions of the sizes of variabilityfeatures detected from the H.E.S.S. and CTA simulated light-curve samples. Themost probable typical flare size as seen with CTA, of the order of 100 s, isapproximately 1r from the typical values of 5 min observed today.
H. Sol et al. / Astroparticle Physics 43 (2013) 215–240 231
H. Sol et al. 2013, APh, 43, 215
current AGN detected byMAGIC, HESS, VERITAS
simulated CTA lightcurve of PKS 2155-304(flux >50 GeV in 7.5 sec bins)
greatly expand the catalog of VHE ϒ-ray AGN study missing link between supermassive black hole environment and the formation of relativistic jets
AGN detectable by CTA in 50 hr(extrapolated from 2FGL sources)
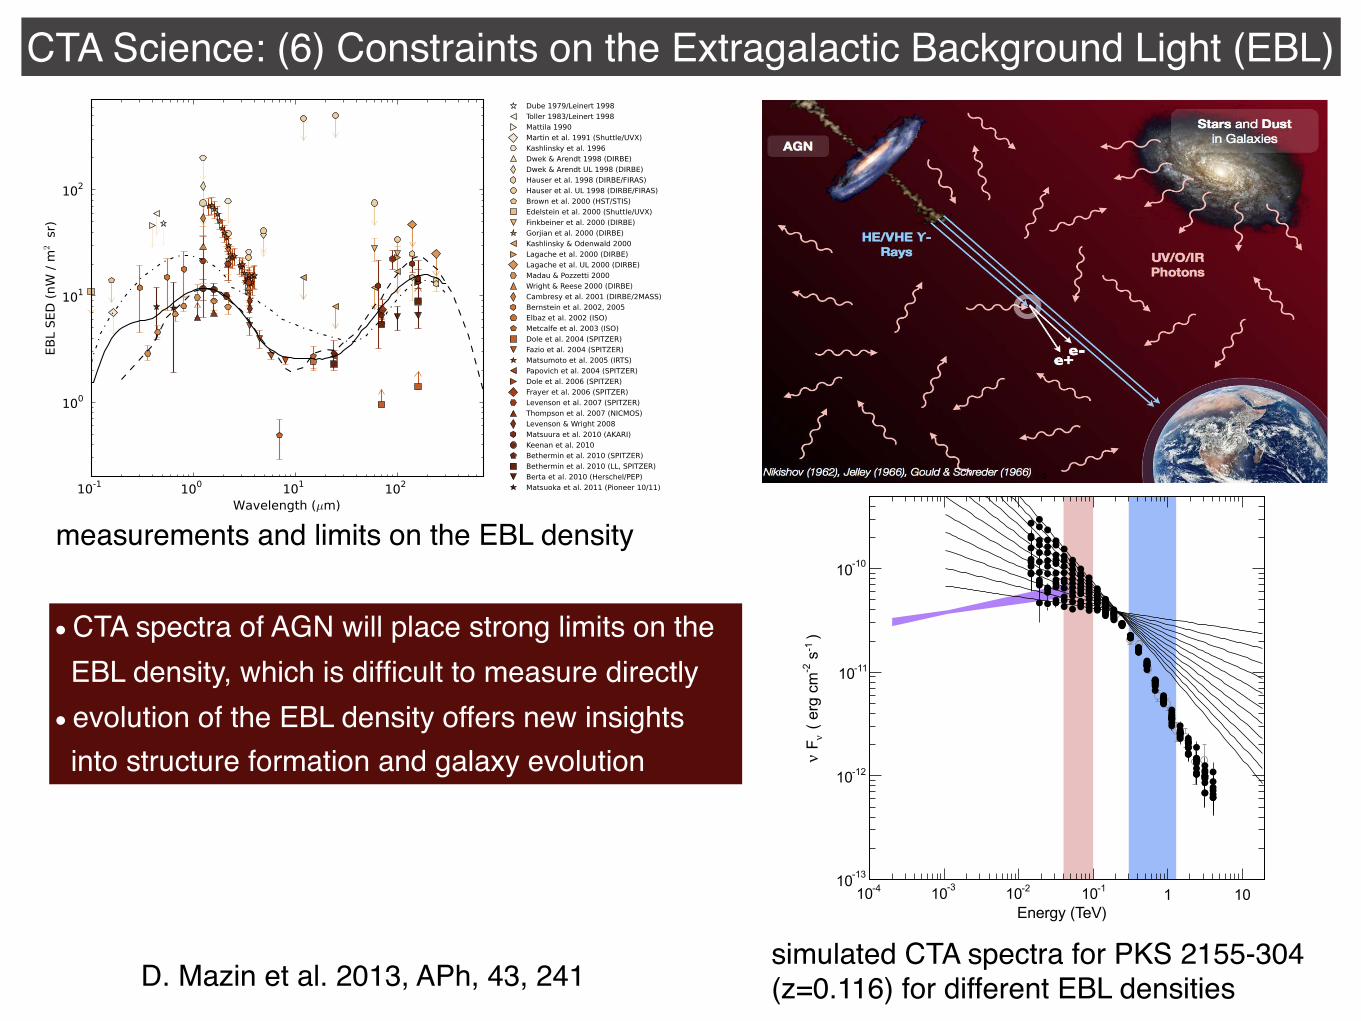
CTA Science: (6) Constraints on the Extragalactic Background Light (EBL)
The precise level of the EBL density is not well known (see [8]for a review). It is difficult to measure directly due to strongforegrounds from our solar system and the Galaxy [9]. Lower limitson the EBL density can be derived from integrated deep galaxycounts at optical and infrared wavelengths (e.g. [10–13]). Theobservation of distant sources of very high energy (VHE, typicalE > 100 GeV) c-rays using Imaging Atmospheric CherenkovTelescopes (IACT, such as H.E.S.S., MAGIC, or VERITAS) provides aunique way to derive indirect limits on the EBL density. This meth-od will be discussed in more detail in the next section. The preci-sion of the EBL constraints set by IACTs improved remarkably inthe last few years (e.g. [14,6,15]). Recently, data in the GeV energyrange from the Fermi-LAT instrument provided new tools to deriveconstraints from VHE data (e.g. [16,17]). Contemporaneously withthe IACT constraints, there has been rapid progress in resolving asignificant fraction of this background with the deep galaxy countsat infrared wavelengths from, e.g. the Spitzer satellite (e.g.[11,12,18]) as well as at sub-millimeter wavelengths from Herschelor the Submillimeter Common User Bolometer Array (SCUBA)instrument (e.g. [19]). Furthermore, the trends of source countsat the faintest magnitudes as measured by HST and 8 m-classground-based telescopes (Keck, Subaru, VLT) indicate that theEBL contribution from standard galaxies is largely resolved[10,20]. The current status of direct and indirect EBL measure-ments are summarized in an accompanying review article in thisjournal and can also be found in [7].
In total, the collective limits on the EBL between the UV and FIRconfirm the expected two peak structure, although the absolute le-vel of the EBL density remains uncertain by a factor of two to ten(Fig. 1). In addition to this consistent picture, several direct mea-surements in the near IR have also been reported (e.g. [21]), signif-icantly exceeding the expectations from source counts (see [8,22]for reviews). If this claimed excess of the EBL is real (butsee[23,14]), it might be attributed to emission from more exoticsources like, e.g., the first stars in the history of the universe.
Alternative models do exist, which could, in principle, reconcilethe observations with a high level of the EBL: axion like particles(ALPs), which had been introduced to address the strong-CP viola-tion problem in particle physics, could lead to a conversion of VHEgamma-rays to ALPs. This mechanism and the related physics for
CTA is discussed in a separate paper in this special issue [24].Recently, the secondary gamma-rays produced along the line ofsight by the interactions of cosmic-ray protons with backgroundphotons have been invoked to explain the VHE spectra of distantsources [25].
1.3. VHE c-rays from blazars as a probe of the EBL
On the way from the source to the observer, VHE c-rays can suf-fer absorption losses through interaction with the low energy pho-tons of the EBL via the pair-production mechanism [26,27]:
cVHE þ cEBL ! eþ þ e" with EcVHE # EcEBL > ðmec2Þ2: ð1Þ
VHE c-ray photon fluxes measured on earth UobsðEcÞ are, there-fore, altered from the flux emitted at the location of the sourceUintðEcÞ
UobsðEc; zÞ ¼ e"sðEc ;zÞ 'UintðEcÞ: ð2Þ
The optical depth, sðEcÞ, encountered by VHE c-rays of energy Eemitted at redshift z and traveling toward the observer can then becalculated by solving the threefold integral (see e.g. [28]):
sðEc; zÞ ¼Z z
0d‘ðz0Þ
Z 1
"1dl 1" l
2
Z 1
!0th
d!0 nð!0; z0Þrccð!0; E0c;lÞ; ð3Þ
where l ¼ cos h, nð!Þ is EBL photon number density and d‘ðzÞ thedistance element (expressed in co-moving coordinates).
Fig. 2 displays the resulting attenuation due to the EBL for VHEc-ray sources at different redshifts and for different EBL models(see Fig. 1). Several features can be identified:
( At low energies (< 80 GeV) the spectrum is practically unatten-uated (with the exception of extreme EBL models at high red-shifts, i.e. the fast evolution model from Stecker et al. atz ¼ 2). Since this energy range will be sampled by the CTA withhigh statistical precision, it will be possible to measure theunabsorbed spectrum.
( At energies from 80 GeV to 2 TeV the strength of the attenua-tion is increasing due to the EBL photons in the optical tonear-infrared range peak of the EBL density.
Fig. 1. Measurements of and limits on the EBL density in comparison to different EBL models/shapes utilized in this study at z ¼ 0 (dashed dotted line: fast evolution modelfrom [3]; solid line: [4]; dashed line: [5]). References for the collection of measurements can be found in [6,7].
242 D. Mazin et al. / Astroparticle Physics 43 (2013) 241–251
either the intrinsic source physics is fundamentally different thanthe models predict or the properties of gamma ray propagationthrough space are fundamentally different than we know today,which can become a major challenge for the modern physics (seee.g. [63,24]).
3. Investigating the CTA response
3.1. Simulations
For the studies presented here the CTA physics response simu-lation tools presented in [64] are used. In short, a source intrinsicspectrum is assumed in each case and then folded with a givenCTA response. The source is located at the center of the telescopes’field of view and the background (especially important at lowenergies) is assumed to be measured with a 5-times betterstatistics than the exposure of the source region. Only significant,i.e. larger than 3 standard deviations, reconstructed flux pointshave been considered in the analysis. Furthermore, the systematicuncertainty is considered to be 1% of the background level, and werequire the signal to be at least 3 times higher than that. The per-formance files for 20! zenith angle (fixed) are used and no correc-tion for source motion along the sky is made.
An example of such a simulated spectrum is shown in Fig. 4,where the measured spectrum of the blazar PKS2155-304 is usedtogether with different assumptions about the EBL density (herea scaled version of the EBL model by [5]) to calculate the spectrumas it would have been detected by CTA in a 20 h exposure (CTA ar-ray layout: B) (more details can be found in [66]).
3.2. Results
3.2.1. Disentangling intrinsic blazar spectra and EBL effectsOne of the main features of CTA will be a high sensitivity in the
energy range between 20 and 100 GeV, an energy range which
holds the possibility to directly sample parts of the energy spec-trum of a source, which are not affected by the EBL attenuation.With the difference between the measured spectrum in the unab-sorbed part of the VHE spectrum and in the absorbed part of thespectrum, especially if studied for several sources with good statis-tics, the strength of the near-IR EBL can be derived. Here, exempl-arily, the case of PKS2155-304 is studied following the approachdescribed in [66].
For different levels of the EBL density, generated by scaling theEBL model from [5], the intrinsic source spectrum is reconstructedand used to simulate the corresponding spectrum as measured byCTA (Fig. 4). The resulting attenuations for the scaled EBL modelsare shown in Fig. 5 left panel. In the CTA simulated spectrumtwo distinct regions in energy can be identified: (i) the unabsorbedregion, roughly from 40 to 100 GeV for the redshift of PKS2155-304 of z ¼ 0:116 (red band), where no or little EBL attenuation ispresent and the intrinsic spectrum can be observed directly, andthe (ii) absorbed region at energies > 100 GeV, where the EBLattenuation can be measured (blue band). In each of the two bandsthe spectrum is characterized by a power law dN=dE " E#C and thederived photon indices C, shown in Fig. 5 right panel, are theninvestigated. The fit in the low energy band reproduces very wellthe assumed intrinsic spectral indices (red dots vs black crossesin Fig. 5 right panel).
Fig. 6 displays the strength of the spectral break between thetwo power laws CLOW # CHIGH for different CTA array layouts, withthe error bands calculated via error propagation. For array layout B(best low energy performance) an EBL density a step in scale factorof 0.1 corresponds to one to two standard deviations difference inthe strength of the break. Array layout I provides a comparable butslightly worse performance while the decreased low energy sensi-tivity of array layout C makes studies of this type difficult (resolu-tion factor two to three worse and the intrinsic index cannot bereconstructed). Note that a scaling of 0.1 corresponds to an EBLdensity of "1 nWm#2 sr#1 at 2 lm which is of the same orderas the error on the lower limits from integrated source counts atthis wavelength. Since EBL attenuation is a global, redshift depen-dent phenomenon, in general, a combined fit to all available VHEdata should be used to derive limits on the EBL density (see e.g.[6]).
While for many of the up to now detected extragalactic VHEsources the energy spectrum in the VHE range is well describedby the extrapolation of the spectrum in the HE range folded withan EBL attenuation some of the sources show an intrinsic breakbetween the two energy regimes (e.g. PKS2155-304) [67]. For indi-vidual sources, such an intrinsic break could lead to a wronglydetermined EBL density when blindly applying the methods out-lined above. The solution, again, lies in utilizing a sample of source:while intrinsic features are different between the sources the EBLattenuation signature can be precisely determined for each of themenabling one to disentangle the two.
3.2.2. Distant sources, GRBsDue to the low energy threshold of CTA and its high sensitivity
CTA will have the opportunity to detect even distant GRBs.Whereas a discussion on GRB physics is beyond the scope of thisarticle, GRBs start playing a crucial role in understanding EBL den-sity at high redshifts [71]. A common expectation is that only GRBswill provide high enough c-ray luminosity to detect a source lo-cated at high redshifts (z > 2). Also AGN in extreme flaring statescould be detected at z > 2 (see Fig. 6 in AGN paper, same issue).As mentioned before, c-ray sources beyond a redshift of two canbe used as beacons probing the star formation rate density and,in particular, its peak position.
The power of CTA to detect distant GRBs can be demonstratedby utilizing the Fermi-LAT detection of the extraordinary
Energy (TeV)-410 -310 -210 -110 1 10
)-1
s-2
( er
g cm
ν F ν
-1310
-1210
-1110
-1010
Fig. 4. Example of simulated spectra for different EBL densities. The base spectrumassumed is the quiescence state spectrum of PKS2155–304 (z ¼ 0:116), EBL modelis from [5], used with different scalings. Shown are: the measured spectrum (greymarkers), the simulated spectra for different level of the EBL density (blackmarkers) and the corresponding assumed intrinsic spectra (black lines), the sourcespectrum in the GeV energy range as measured by Fermi-LAT [65] (not simulta-neous, purple butterfly), and the energy ranges, which are used to determine theslope of the simulated spectrum at low (light red) and high (blue) energies. Fordetails on the data and methods see [66]. (For interpretation of the references tocolour in this figure legend, the reader is referred to the web version of this article.)
D. Mazin et al. / Astroparticle Physics 43 (2013) 241–251 245
La Thuille, 9-16 March 2013 G.Lamanna
Gamma-ray interactions with the EBL
40
D. Mazin et al. 2013, APh, 43, 241
CTA spectra of AGN will place strong limits on the EBL density, which is difficult to measure directly evolution of the EBL density offers new insights into structure formation and galaxy evolution
measurements and limits on the EBL density
simulated CTA spectra for PKS 2155-304 (z=0.116) for different EBL densities
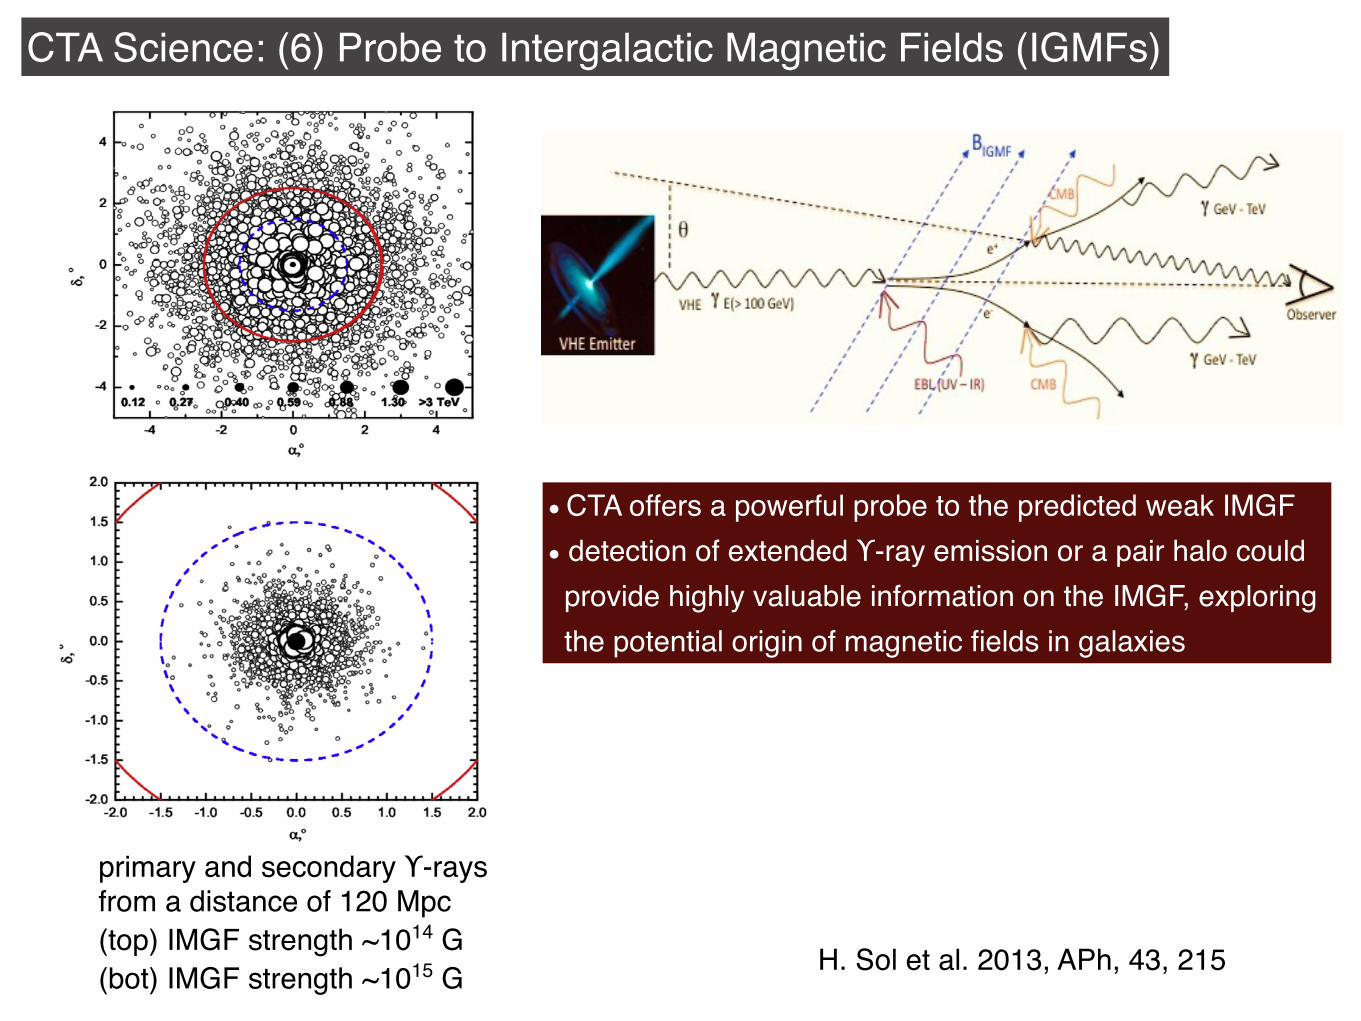
CTA Science: (6) Probe to Intergalactic Magnetic Fields (IGMFs)tended emission with IGMF dependent size, which emission benefitsfrom Doppler boosting.
There have been no clear observational indications for eitherpair echo or halo emission so far, and deriving lower bounds toIGMF strengths from upper limits to such components obtainedby GeV–TeV observations of selected blazars appears very promis-ing and still a matter of debate [219–225]. Existing limits rely on acombination of data obtained with different types of telescopes inthe GeV and TeV bands. CTA will have the great advantage of beingable to cover all the relevant energy range, from 10 GeV up to10 TeV, within one observational facility. Improving the time cov-erage to better determine the GeV and TeV light-curves with Fermiand hopefully future GeV gamma-ray satellites, together with aglobal network of IACT including the two sites of CTA, would sig-nificantly benefit to this issue.
The positive detection of the pair echo or extended emissioncomponents would provide highly valuable information on theIGMF, a goal that is expected to be achievable with CTA. Pair echoscould be detected in the case of very tiny IGMF (6 10!16 G), and ex-tended emission for higher IGMF values. CTA will conduct detailedmeasurements of spectral variability with higher sensitivity andtime resolution over a wider energy band compared to currentgamma-ray telescopes, potentially allowing us to disentangle andpositively identify the echo component from the primary emission,and thereby probing very weak IGMF in the range B 6 10!16 G, to-tally out of reach with other means of investigation.
A fruitful synergy with wide-field instruments such as HAWC orLHAASO can be expected in the CTA era, since regular, long-termcoverage of the multi-TeV emission of blazars by such facilitiesshould greatly improve our knowledge of their TeV activity ontimescales of years to decades, giving us a much better handle onthe light curve of the primary emission as input for more reliablepredictions of the pair echo and extended emission properties.The prediction of the level of the cascade emission will be greatlyimproved also with the detailed measurements of the blazar spec-tra in the 10 TeV band with CTA itself, which will give the details ofabsorption of the primary gamma-rays in the intergalacticmedium.
If IGMF strengths are in a stronger range, B " 10!16 ! 10!12 G,the spatially-extended emission may be detectable and resolvableby CTA by virtue of its high sensitivity and angular resolution (seeFig. 19), in which case one would probe not only IGMF but also thelifetime of TeV activity for the source. High signal-to-noise detec-tions of pair halos around nearby blazars (z " 0:1! 0:2) would al-low us to study the energy-dependent radial profile and therebydeduce unique information on the IGMF and on the EBL [226].
If the IGMF is B P 10!12 G and strong enough to effectively isot-ropize the secondary pairs, the detection of isotropic pair halosfrom distant AGNs should be feasible [216,228]. Fig. 20 showsthe expected sizes of such isotropic pair halos as a function of red-shift, generated by 10 TeV primary photons giving rise to"100 GeV secondary photons, and using the EBL model of Frances-chini et al. [41]. Even though the properties of such isotropic halosno longer depend explicitly on the IGMF, observation of their iso-tropic nature would still provide indicative lower bounds on its va-lue, allow to check the self-consistency of our EBL description, andalso give important information on the high-energy spectrum andbeaming angle of the primary emission.
Although the halos are very large for redshifts z < 0:5, a halowith a radius <1! at z > 0:5 would fit into the field of view ofCTA telescopes and would allow for reliable background subtrac-tion. If one assumes that the source has a constant mFm-flux from100 GeV to 10 TeV, a simple estimate shows that the halo fluxesare below a couple of percent compared to the primary 100 GeVemission. The halo fluxes would be much larger if the photon indexat the source was much harder than C ¼ 2. This is to be compared
to the pair halo detection limits which should be actually reachablewith CTA.
The expected flux sensitivity for pair halo detection with CTAhas been calculated for four separate approaches. In all cases a dif-ferential angular distribution of a pair halo at z = 0.129 and Ec >100 GeV, taken from Fig. 6 of [229] was used as our model haloprofile, with a functional form: dN/ dh2 / h5=3. The differential en-ergy flux sensitivity for the four different approaches is shown inFig. 21. Methods A and B rely on a 5 r excess above the expectedbackground, calculated using Eq. 17 in [61]. Method A searchesfor some overall extended emission with a halo profile forh < 0:32$. Method B probes a region in which a point-like centralsource would no longer be dominant (0:11$ < h < 0:32$) and there-fore provides the most basic method of establishing the detectionof extended emission. For methods C and D the ‘‘goodness of fit’’for a halo profile (convolved with the CTA PSF) fitted to simulated
Fig. 19. The arrival directions of the primary and secondary gamma-rays (circles)from a source at a distance D = 120 Mpc. The IGMF strength is 10!14 G (upperpanel) and 10!15 G (lower panel). The sizes of the circles representing each photonare proportional to the photon energies. The AGN intrinsic gamma-ray spectrum istypically described as dN=dE " E!2expð!E=EcutÞ with the cutoff energyEcut " 300 TeV. The blue dashed and red solid circles are radii of 1.5$ and 2.5$ ,respectively, and would perfectly fit into the FoV of CTA. See [227] for details. (Forinterpretation of the references to color in this figure legend, the reader is referredto the web version of this article.)
234 H. Sol et al. / Astroparticle Physics 43 (2013) 215–240
CTA offers a powerful probe to the predicted weak IMGF detection of extended ϒ-ray emission or a pair halo could provide highly valuable information on the IMGF, exploring the potential origin of magnetic fields in galaxies
tended emission with IGMF dependent size, which emission benefitsfrom Doppler boosting.
There have been no clear observational indications for eitherpair echo or halo emission so far, and deriving lower bounds toIGMF strengths from upper limits to such components obtainedby GeV–TeV observations of selected blazars appears very promis-ing and still a matter of debate [219–225]. Existing limits rely on acombination of data obtained with different types of telescopes inthe GeV and TeV bands. CTA will have the great advantage of beingable to cover all the relevant energy range, from 10 GeV up to10 TeV, within one observational facility. Improving the time cov-erage to better determine the GeV and TeV light-curves with Fermiand hopefully future GeV gamma-ray satellites, together with aglobal network of IACT including the two sites of CTA, would sig-nificantly benefit to this issue.
The positive detection of the pair echo or extended emissioncomponents would provide highly valuable information on theIGMF, a goal that is expected to be achievable with CTA. Pair echoscould be detected in the case of very tiny IGMF (6 10!16 G), and ex-tended emission for higher IGMF values. CTA will conduct detailedmeasurements of spectral variability with higher sensitivity andtime resolution over a wider energy band compared to currentgamma-ray telescopes, potentially allowing us to disentangle andpositively identify the echo component from the primary emission,and thereby probing very weak IGMF in the range B 6 10!16 G, to-tally out of reach with other means of investigation.
A fruitful synergy with wide-field instruments such as HAWC orLHAASO can be expected in the CTA era, since regular, long-termcoverage of the multi-TeV emission of blazars by such facilitiesshould greatly improve our knowledge of their TeV activity ontimescales of years to decades, giving us a much better handle onthe light curve of the primary emission as input for more reliablepredictions of the pair echo and extended emission properties.The prediction of the level of the cascade emission will be greatlyimproved also with the detailed measurements of the blazar spec-tra in the 10 TeV band with CTA itself, which will give the details ofabsorption of the primary gamma-rays in the intergalacticmedium.
If IGMF strengths are in a stronger range, B " 10!16 ! 10!12 G,the spatially-extended emission may be detectable and resolvableby CTA by virtue of its high sensitivity and angular resolution (seeFig. 19), in which case one would probe not only IGMF but also thelifetime of TeV activity for the source. High signal-to-noise detec-tions of pair halos around nearby blazars (z " 0:1! 0:2) would al-low us to study the energy-dependent radial profile and therebydeduce unique information on the IGMF and on the EBL [226].
If the IGMF is B P 10!12 G and strong enough to effectively isot-ropize the secondary pairs, the detection of isotropic pair halosfrom distant AGNs should be feasible [216,228]. Fig. 20 showsthe expected sizes of such isotropic pair halos as a function of red-shift, generated by 10 TeV primary photons giving rise to"100 GeV secondary photons, and using the EBL model of Frances-chini et al. [41]. Even though the properties of such isotropic halosno longer depend explicitly on the IGMF, observation of their iso-tropic nature would still provide indicative lower bounds on its va-lue, allow to check the self-consistency of our EBL description, andalso give important information on the high-energy spectrum andbeaming angle of the primary emission.
Although the halos are very large for redshifts z < 0:5, a halowith a radius <1! at z > 0:5 would fit into the field of view ofCTA telescopes and would allow for reliable background subtrac-tion. If one assumes that the source has a constant mFm-flux from100 GeV to 10 TeV, a simple estimate shows that the halo fluxesare below a couple of percent compared to the primary 100 GeVemission. The halo fluxes would be much larger if the photon indexat the source was much harder than C ¼ 2. This is to be compared
to the pair halo detection limits which should be actually reachablewith CTA.
The expected flux sensitivity for pair halo detection with CTAhas been calculated for four separate approaches. In all cases a dif-ferential angular distribution of a pair halo at z = 0.129 and Ec >100 GeV, taken from Fig. 6 of [229] was used as our model haloprofile, with a functional form: dN/ dh2 / h5=3. The differential en-ergy flux sensitivity for the four different approaches is shown inFig. 21. Methods A and B rely on a 5 r excess above the expectedbackground, calculated using Eq. 17 in [61]. Method A searchesfor some overall extended emission with a halo profile forh < 0:32$. Method B probes a region in which a point-like centralsource would no longer be dominant (0:11$ < h < 0:32$) and there-fore provides the most basic method of establishing the detectionof extended emission. For methods C and D the ‘‘goodness of fit’’for a halo profile (convolved with the CTA PSF) fitted to simulated
Fig. 19. The arrival directions of the primary and secondary gamma-rays (circles)from a source at a distance D = 120 Mpc. The IGMF strength is 10!14 G (upperpanel) and 10!15 G (lower panel). The sizes of the circles representing each photonare proportional to the photon energies. The AGN intrinsic gamma-ray spectrum istypically described as dN=dE " E!2expð!E=EcutÞ with the cutoff energyEcut " 300 TeV. The blue dashed and red solid circles are radii of 1.5$ and 2.5$ ,respectively, and would perfectly fit into the FoV of CTA. See [227] for details. (Forinterpretation of the references to color in this figure legend, the reader is referredto the web version of this article.)
234 H. Sol et al. / Astroparticle Physics 43 (2013) 215–240
H. Sol et al. 2013, APh, 43, 215
primary and secondary ϒ-rays from a distance of 120 Mpc(top) IMGF strength ~1014 G(bot) IMGF strength ~1015 G
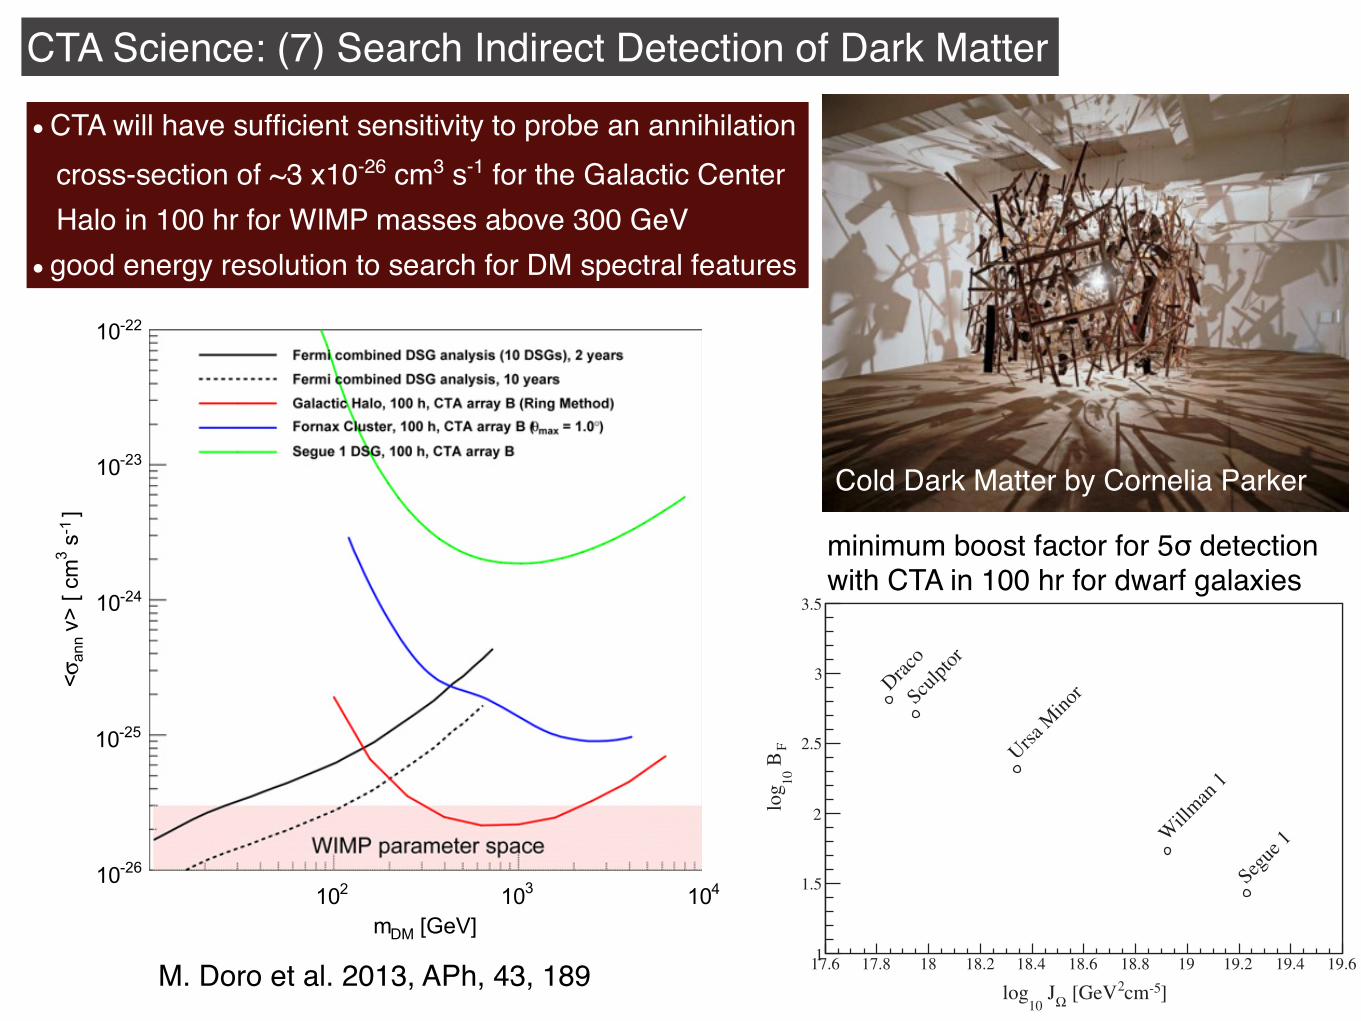
CTA Science: (7) Search Indirect Detection of Dark Matter
respect to those obtained with dSphs. The results are promising: ifthe intrinsic boost factor from subhalos is larger than that pre-dicted by the model we used, or mechanisms of Sommerfeldenhancement are at work, there is also the possibility to have adetection in 100! 200 h with array B or E. We have also consideredthe prospects of detection of CR-induced signal in hadronic accel-eration scenarios in Fig. 5. We have seen that the CR-induced emis-sion from the Perseus cluster could be detected in about 100 h.Finally, we discussed the more realistic case when DM– and CR-induced gamma-rays are treated together. We discuss that thedifference in both the spatial and spectral features of the twoemissions can be used as a method for discrimination, while morequantitative results need dedicated MC which were not availablewhen writing this contribution. We underline that the extensionof the expected DM emitting region in galaxy clusters representsa problem for current Cherenkov Telescopes since their FOV is lim-ited to 3–5! and their sensitivity rapidly decreases moving awayfrom the centre of the camera. CTA will overcome this limitation,having a FOV of up to 10! and an almost flat sensitivity up to sev-eral degrees from the centre of the camera. For galaxy clustersearches, CTA will hence mark the difference compared to the cur-rent generation of IACTs.
More promising are DM searches of annihilation signatures inthe Galactic halo, where the DM density is expected to be knownwith much higher precision than in the Galactic Centre itself orin (ultra-faint) dSphs or galaxy clusters. This was studied in Section2.8. By adopting dedicated observational strategies of the regionclose to the Galactic Centre, as shown in Fig. 8, it was shown thatCTA has the potential to reach the thermal annihilation cross-sec-tion expected fromWIMP DM of 10!26 cm3 s!1 and lower (Fig. 9) in100 h observation of the vicinities the Galactic Centre using the‘‘Ring’’ method. Models with a large photon yield from DM annihi-lation will be constrained for even smaller cross-sections. It is alsoexpected that the limits presented here can be improved by factorof a few when the stereoscopic analysis of CTA events has beenunderstood so well that a further suppression of the backgroundbecomes feasible. This would be the first time that ground-basedCherenkov telescopes could reach this sensitivity level.
Besides observations of individual dedicated objects, the capa-bilities of CTA for searching DM signals in the diffuse backgroundof gamma-ray radiation were discussed in Section 2.11. We dis-cussed the reconstruction performance for different anisotropypower spectra and residual background level. Considering a cur-rent model for the anisotropy power spectra, we showed thatCTA may be able to distinguish a DM-induced diffuse gamma-raycomponent from the astrophysical background.
In Fig. 23, we summarize the constraints that we expect withCTA for a WIMP annihilating purely into b!b in 100 h observation,with the different targets discussed above. As already anticipated,the best results are expected for the observation of the vicinity ofthe Galactic Centre, where we expect to reach the thermal annihi-lation cross-section for WIMP DM of 10!26 cm3 s!1. Unlike presentIACTs, whose sensitivity supersedes that of the Fermi-LAT atmasses around a TeV, CTA will constitute the most sensitive instru-ment above masses of about 100 GeV. It should be noted that theseestimates are conservative: the most important improvement canbe expected from the possible redefinition and final optimizationof the array layout.9 In addition, the presented sensitivities were cal-culated using generic analysis which was not optimized specificallyfor the DM searches and thus our results could be considered conser-vative in this sense.
Obviously, a firm identification of DM requires a very good spec-tral discrimination with respect to any possible astrophysical back-ground. Spectral shapes and (even more so) absolute normalizationof these backgrounds are often poorly determined and the DM sig-nal most likely is small in comparison. As the extent to which thesefactors affect detection claims is highly model and target depen-dent, we refer to future detailed more focused assessments.
It has been shown that the detection of gamma-rays providescomplementary information to other experimental probes of parti-cle DM, especially that of direct detection, because CTA could beable to access a fraction of the parameter space not accessibleotherwise [217,218]. With respect to particle searches at theLHC, the comparison is not straightforward, as LHC results are usu-ally strongly related to specific models, and general conclusions aresomewhat model dependent, as shown by recent publications fromthe ATLAS and CMS collaborations [219–221]. Generically, the dis-covery of a candidate for particle DM will be limited by the avail-able centre-of-mass energy. Other scenarios exist, in the context ofspecific super-symmetric models for DM, that exhibit parts of themodel space not accessible by the LHC [222]. In any case, LHC dis-covery of dark matter, would prompt the need for proof that theparticle is actually consistent with the astrophysical DM, and closecollaboration with LHC physicists is currently under organizationto facilitate the optimal use of accelerator results within CTA. Aconcrete scenario has been analyzed by [223] in the case of a SUSYmodel in the so-called co-annihilation region. Simulated LHC datawere used to derive constraints on the particle physics nature ofthe DM, with the result that the LHC alone is not able to recon-struct the neutralino composition. The situation improves if theinformation from a detection of gamma-rays after the observationof the Draco dSph by CTA is added to the game: in this case theinternal degeneracies of the SUSY parameter space are brokenand including CTA allows us to fully interpret the particle detectedat the LHC as the cosmological DM. In the other case where the LHCwill not detect any physics beyond the Standard Model, predictionswere made in the context of the CMSSM [224] indicating that the
[GeV]DMm210 310 410
]-1
s3 v
> [ c
man
nσ<
-2610
-2510
-2410
-2310
-2210
Fig. 23. Comparison of exclusion curves of Fermi-LAT in 24 months [52] andexpected for 10 years (rescaled with the square root of time). The exclusion curvesfor the various targets studied in this contribution are also reported for the b!bannihilation channel: for the dwarf satellite galaxy Segue 1 (green curve, seeSection 2.1), for the Fornax galaxy cluster in case only DM-induced gamma-rays areconsidered (blue line, see Section 2.4) and and for the ring-method of observation ofthe Galactic Centre vicinities (red line, see Section 2.8). (For interpretation of thereferences to colour in this figure legend, the reader is referred to the web version ofthis article.)
9 For example, it is currently under disussion, the possibility to add 36 medium-size telescopes of Schwarzchild-Couder design to the arrays considered here.Preliminary simulations predict that improvement in the overall sensitivity by atleast a factor of 2 compared to that studied here may be expected.
M. Doro et al. / Astroparticle Physics 43 (2013) 189–214 209
M. Doro et al. 2013, APh, 43, 189
the DM modeling of the dSphs. Again, the thermal cross-section3! 10"26 cm3 s"1 is assumed. Fig. 4 shows the minimum BF for a1 TeV DM particle annihilating into sþs". Jobs is calculated for aNFW profile for all the cases except Segue 1, where an Einasto pro-file is considered. Considering that the boost factor from subhalosin dSph is only of Oð1Þ, CTA observations of dSphs will be moresensitive to scenarios where Sommerfeld enhancement is at play,which may instead boost the signal up to Oð1000Þ.
2.4. Observations of galaxy clusters
Within the standard KCDM scenario, galaxy clusters, withmasses around 1014 " 1015 M&, are the largest gravitationallybound objects and the most recent structures to form [92]. Theyare complex objects, relevant for both cosmological and astrophys-ical studies, and for what concerns DM searches [25,29,30,93–100].DM, in fact, is supposed to be the dominant component of the clus-ter mass budget, accounting for up to 80% of its mass (the othercomponents are the galaxies and the gas of the intra-cluster med-ium (ICM)). This is why clusters have been considered as targets forthe indirect detection of DM, with the possibility of detecting thegamma-rays produced in the annihilation (or decay) of DM parti-cles in the halo of the cluster.
N-body simulations of halo formation and evolution have alsoproven that, while the majority of early-formed, small structuresmerge together giving shape to more massive objects, some ofthe subhalos survive and are still present in the ‘‘host’’ halo of lar-ger objects. Theoretical models foresee a huge number of thesesubstructures at all scales down to 10"11 " 10"3 M& [101]. Thesesubhalos have the effect of contributing to the total gamma-rayemission from DM annihilations, and they may have importantconsequences for DM indirect detection. This is especially truefor galaxy clusters, where the intrinsic flux ‘‘boost’’ from subhaloscan be of order 100" 1000, in particular compared to the case ofdSphs, explored previously, where the subhalos boost should con-tribute only marginally. Despite the fact that, due to their vicinity,dSphs are usually considered as the best sources for DM indirectdetection, thanks to the subhalos boost, some authors claim thatgalaxy clusters have prospects of DM detection better or at leastas good as those of dSphs [29–31].
On the other hand, in galaxy clusters, emission in the gamma-ray range is not only expected by DM annihilation. Clusters mayhost an Active Galaxy Nucleus (AGN, that appear as point-likesources at very high energies) and radio galaxies. The case of thePerseus galaxy cluster, which has been observed by MAGIC during
several campaigns in the last years, is emblematic: MAGIC detectedboth the central AGN NGC-1275 [102] and the off-centreed head–tail radio galaxy IC 310 [103]. Moreover gamma-rays are expectedto be produced also from the interaction of cosmic rays (CRs) withthe ICM [95,104–107]. The physics of the acceleration of CRs (elec-trons and protons) is not completely understood, but plausiblemechanisms can be shock acceleration during structure formation,or galactic winds driven by supernovae. CRs can also be injectedinto the ICM from radio galaxy jets/lobes. At the energies of interesthere (above 10 GeV), CRs emit gamma-rays from the processesassociated with the decay of the neutral and charged pions pro-duced in the interaction of the CRs with the ICM ambient protons[108,109]. Most importantly, such a contribution is usually foundto be larger than the one predicted from DM annihilation. It thusrepresents an unavoidable source of background for DM searchesin galaxy clusters. To date, the deep exposure performed with theMAGIC stereoscopic system of the Perseus cluster [47] placed themost stringent constraints from VHE gamma-rays observationsregarding themaximumCRs-to-thermal pressure to hXCRi < 1" 2%.
The purpose of this section is to estimate the CTA potential todetect gamma-rays from DM annihilation in the halo of galaxyclusters. First, the CR-induced emission only will be considered.This component represents, by itself, an extremely interesting sci-entific case, at the same time being a background complicating theprospects of DM detection. Afterward, the ideal case of a clusterwhose emission is dominated by DM annihilation only will be trea-ted. Finally, the combination of the two components distributedco-spatially will be discussed.
It should be noted here that gamma-ray emission from both DMannihilation and CRs is spatially extended, even though not alwaysco-spatial. In particular, [29] proved that, for the case of DM, thecontribution of subhalos is particularly relevant away from thehalo centre, so that annihilations can still produce a significantamount of photons up to a distance of 1" 2 degrees from the cen-tre. This represents a problem for current Cherenkov Telescopessince their FOV is limited to 3–5!. CTA will overcome this limita-tion, having a FOV of up to 10! (at least above 1 TeV) and an almostflat sensitivity up to several degrees from the centre. It is reason-able to expect, therefore, that CTA will allow a step-change in capa-bility in this important area.
In this study, we selected two benchmark galaxy clusters: Per-seus and Fornax. Perseus has been chosen because it is consideredthat with the highest CR-induced photon yield but a low DM con-tent, and Fornax for the opposite reason: it is considered the mostpromising galaxy cluster for DM searches [29,30]. We recall thatPerseus is located in the Northern hemisphere, while Fornax is inthe Southern hemisphere. To study the prospects for CTA we usetwo Monte Carlo simulations of the instrument response functionsand of the background rates for extended sources, for the case ofarray B and array E, which we recall, are representatives of well-performing arrays at low energies (array B) and in the full energyrange (array E). The MC simulations were developed explicitly forthe analysis of extended sources so that all the relevant observ-ables are computed throughout the entire FOV.
2.5. Gamma-ray emission from cosmic-rays
Gamma-ray emission due to the injection of CRs into the ICM ofa galaxy cluster is proportional both to the density of the ICM andthe density of CRs. For the present work, we refer to the hadronicCR model of Pinzke and collaborators [30,95], based on detailedhydrodynamic, high-resolution simulations of the evolution of gal-axy clusters, since in these works we found detailed morphologicalinformation, essential to compute the CTA response. The CR surfacebrightness rapidly decreases with the distance from the centre ofthe halo, so that, in most cases, the total emission is contained in
]-5cm2 [GeVΩ J10
log17.6 17.8 18 18.2 18.4 18.6 18.8 19 19.2 19.4 19.6
F B
10lo
g
1
1.5
2
2.5
3
3.5
Draco
Ursa M
inorScu
lptor
Willm
an 1
Segue
1
Fig. 4. Minimum boost factor required for a 5r detection in 100 h by array B, forthe dSphs in Table 1.1 and a 1 TeVWIMP annihilating into sþs" . The density profilesare taken to be NFW, except for Segue 1 where an Einasto profile has been assumed.The smallest boost required is BF ¼ 25 for Segue 1.
194 M. Doro et al. / Astroparticle Physics 43 (2013) 189–214minimum boost factor for 5σ detection with CTA in 100 hr for dwarf galaxies
Cold Dark Matter by Cornelia Parker
CTA will have sufficient sensitivity to probe an annihilation cross-section of ~3 x10-26 cm3 s-1 for the Galactic Center Halo in 100 hr for WIMP masses above 300 GeV good energy resolution to search for DM spectral features

CTA Science: (8) Probes of Lorenz Violation
La Thuille, 9-16 March 2013 G.Lamanna
LIV: lever arm and peak discrimination
50
Larger lever-arm because of larger energy coverage
Better-peak discrimination thus shorter flare are observable
CTA observations of distant ϒ-ray sources (GRB and AGN) offers a far more sensitive probe to Lorenz violation than accelerators and astrophysical neutrino measurements
J. Ellis & N. Mavromatos 2013, APh, 43, 50
! !
!"#$%&'(""%)'*+,'-./0/
! !"#$%&$'%&(')*+&(,)-#('.//#$
! 0*%-#('1)21'3&(+)$)/*'.($.$'/4'2&%5).%.)/*%#'.1(/&6
! 7)21'3&(+)$)/*'8(%$"&($'/4'-)*%&6'/&-).$9'8%$$($'(.+
! :(."&*'./'%*'!"#$%#&'';<%%&(.'=>>>9'?@?9'()*9'ABCDABEF
! G(%&+1'/4'(44(+.$'/4'+!,&-./$0-1',%'-2&$3%!"'.%!-'/*'.1('%&&)5%#'.)8('/4'3"#$($
! !#%+('%'#/H(&'#)8).'/*'.1('(*(&26'$+%#('/4'45'-.56$7,'1%.8
The second comment is that an ‘extraordinary claim requiresextraordinary proof’. This can be interpreted as implying that anystatistical separation between source and propagation effectswould need to be extraordinarily convincing, but also suggests thatcorroborating evidence from at least two classes of source shouldbe required, e.g., both GRBs and AGNs.
The above comments would certainly apply to any claim of aneffect. So far, none has been claimed, and only lower limits onthe parameters Mn have been quoted [at least by experimentsusing photons]. However, the above comments also apply to claimsof limits. At a minimum, they should be derived from a statisticalstudy of sufficiently many sources for propagation and source ef-fects to be separated. In the absence of such a separation, it wouldbe more conservative to regard them as sensitivities to Lorentz vio-lation. With this caveat in mind, we now review the experimentalprobes to date, focusing our attention initially on photons but withsome comments later on other particles such as electrons andneutrinos.
After the initial estimates of sensitivities to Lorentz violationthat could be furnished by different types of astrophysical source[2], one of the stronger early probes, to M1 ! 1:8" 1015 GeV, wasbased on EGRET observations of the Crab pulsar in the energyrange from 70 MeV to 2 GeV [17]. By comparison with AGNs andGRBs, studies of pulsars benefit from the very precise timing, inthe millisecond range, and the possibility of measuring many dif-ferent pulses. On the other hand, the prospective sensitivity to Lor-entz violation is limited by the small distances to pulsars, typically! 104 parsec [11]. Nevertheless, observations of the Crab pulsarprovide strong limits on Lorentz violation for electrons, as we men-tion below. Another early study was based on a TeV c-ray flarefrom the AGN Markarian 421 seen by the Whipple Observatory,which provided a sensitivity to M1 ! 4" 1016 GeV [18]. However,this first AGN study had relatively low statistics, and neither ofthese pioneering studies was able to disentangle source and prop-agation effects.
The first study to attempt this by combining data from severaldifferent sources at different distances was made using a sampleof GRB emissions observed by BATSE and OSSE [4], which gave asensitivity to M1 ! 1015 GeV. The use of nine GRBs with measuredredshifts between z ¼ 0:0085 and 3.9 laid the basis for a more ro-bust analysis that was sensitive to M1 ! 6:9" 1015 GeV [19], butthe fact that GRB emissions are very irregular, with no obvious‘standard lighthouse’ characteristics, complicated the disentangle-ment of source effects. This analysis was subsequently upgraded toa fit analyzing emissions from 35 GRBs with measured redshiftsz 6 6:29 observed by the BATSE, HETE and SWIFT instruments,which yielded the robust lower limit M1 J1:4" 1016 GeV at the95% CL [20], despite a strong correlation between the source andpropagation parameters in the fit.
Fig. 1 compares the sensitivities of different experiments to thetime-lag/energy ratio Dt=E as functions of the quantity KðzÞ definedby
KðzÞ & 1ð1þ zÞ
Z z
0
ð1þ zÞdzhðzÞ
; ð2Þ
where the Hubble expansion rate hðzÞ ¼ffiffiffiffiffiffiffiffiffiffiffiffiffiffiffiffiffiffiffiffiffiffiffiffiffiffiffiffiffiffiffiffiffiffiffiffiXK þXMð1þ zÞ3
q, which
measures the distance of the source from the observation point.As seen in Fig. 1, greater sensitivities to Dt=E, and hence M1, havebeen found more recently in two analyses of AGN flares. The firstwas a flare of c-rays with energies K10 TeV from Markarian 501at z ¼ 0:034 observed by the MAGIC telescope, which had sensitiv-ity to M1 ! 2" 1017 GeV [22]. The second was a flare of c-rays withenergies K1 TeV from PKS 2155-304 at redshift z ¼ 0:116 observedby the H.E.S.S. telescope, which yielded sensitivity to M1 ! 2"1018 GeV [23]. Several factors contributed to the greater sensitivity
of this observation: the higher redshift, the higher range of c ener-gies and the larger statistics. All of these are features that CTA mayhope to improve further, principally by virtue of its much greatercollection power.
The principal competition for these AGN observations is cur-rently provided by Fermi GBM/LAT measurements of energetic c-rays from GRBs. As also seen in Fig. 1, the most sensitive of theseto date has been provided by observations of GRB 090510 atz ¼ 0:90, in particular the observation of a single photon withEc ! 31 GeV. The sensitivity to M1 inferred from this single photondepends whether one assumes (most conservatively) that it wasnot emitted before the start of any detectable emission below1 MeV, M1 ! 1:4" 1019 GeV, or that it was not emitted before thestart of emission above 1 GeV, M1 ! 1:2" 1020 GeV, or (mostaggressively) that it was associated with the nearest 1 MeV emis-sion spike, in which case the sensitivity is to M1 ! 1:2" 1021 GeV[24]. This remarkable sensitivity is traceable in part to the cosmo-logical redshift and the fine time structure, which are typical ofGRB emissions, as well as to the observation of the highest-energyc-ray seen from a GRB so far.
The previous paragraphs focused on the possibility of a photonspeed decreasing linearly with energy, where the finer time struc-ture of GRB emissions gives them an advantage over AGN emis-sions. However, the boot is on the other foot when one considersa quadratic dependence: dv ! (ðE=M2Þ2. In this case, the higherenergies seen in AGN emissions confer on them a significantadvantage. For example, the MAGIC data on Markarian 501 yielda sensitivity to M2 ! 2:6" 1010 GeV [22] and those on PKS 2155-304 are sensitive to M2 ! 6:4" 1010 GeV [23], with which theobservations of GRB 090510 [24] are not competitive.
As mentioned in Section 2, Lorentz-violating effects on thepropagation of different particle species are not expected to be uni-versal, and sensitivities to (constraints on) Lorentz violation forelectrons, protons and neutrinos are of independent interest intheir own rights. We note, in particular, that broadband observa-tions of electromagnetic radiation from the Crab Nebula restrictvery severely any possible Lorentz violation for the electron, sothat the corresponding Me
1 ) MP [11]. Important constraints onLorentz violation for other particles are provided by observationsof ultra-high-energy cosmic rays (UHECRs), via constraints on both
Fig. 1. Comparison of data on delays Dt in the the arrival times of energetic gammarays from various astrophysical sources with models in which the velocity of light isreduced by an amount linear in the photon energy [21]. The graph plots on alogarithmic scale the quantity Dt=E and a function of the red-shift, KðzÞ, which isessentially the distance of the source from the observation point. The data includetwo AGNs, Mkn 501 [22] and PKS 2155-304 [23], and three GRBs observed by theFermi satellite, 090510, 09092B and 080916c [24].
52 J. Ellis, N.E. Mavromatos / Astroparticle Physics 43 (2013) 50–55
delay in arrival time of ϒ-ray per energy vs redshift line shows model where the velocity of light is reduced by an amount linear in photon energy
M. Doro et al. 2013, APh, 43, 189
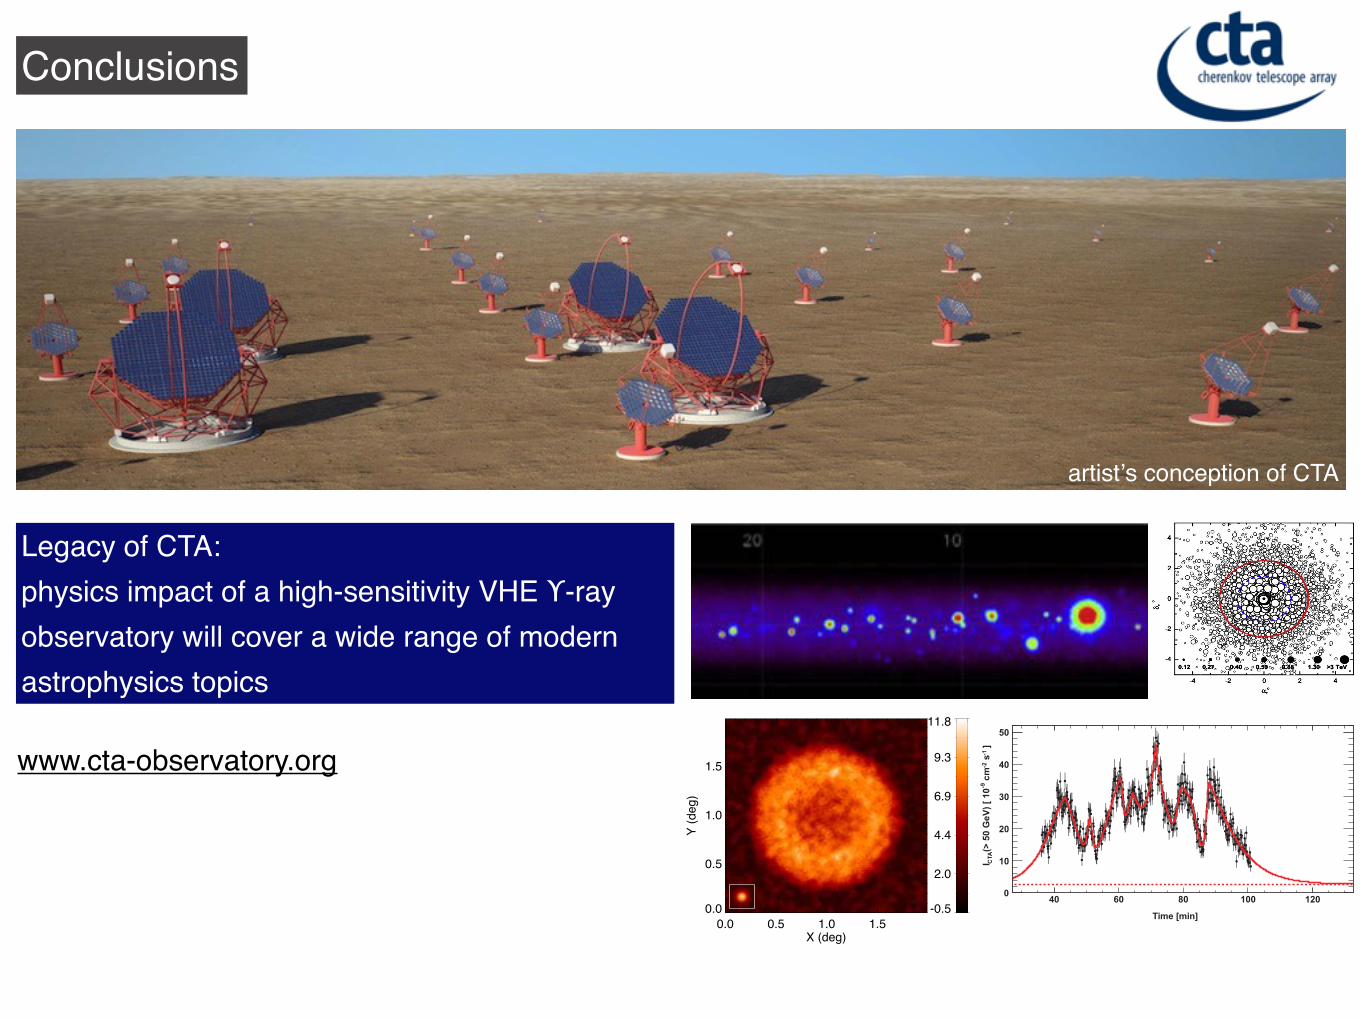
Conclusions
artistʼs conception of CTA
Legacy of CTA:physics impact of a high-sensitivity VHE ϒ-ray observatory will cover a wide range of modern astrophysics topics
One specific CTA lightcurve realization is shown in Fig. 16. Pro-vided the red noise behavior extends to higher frequencies, addi-tional substructures which could not have been resolved byH.E.S.S. are revealed by the peak finding and fitting procedure. Dur-ing such an event, the shortest significant rise time accessible toCTA would be sr ¼ 25" 4 s (second peak on Fig. 16), which isapproximately seven times smaller than sr H:E:S:S: ¼ 173" 28 s. Suchan upper limit on the smallest variability time scale constrains theratio of the size of the emission region over the Doppler factor toRd#1 6 csr=ð1þ ZÞ ' 6:7( 1011 cm, implying e.g. an emission re-gion smaller than 1 AU for a Doppler factor of 20, an unusual valuein the current acceleration models used for AGN. The detection ofsuch short time scale events would be a real challenge for jet for-mation models.
This first example illustrates the great CTA timing capabilitieswhich could detect events almost ten times shorter than the short-est ones detected by current IACT. This temporal resolution, belowthe minute time scale under exceptional circumstances, could im-pose severe constraints on acceleration mechanisms and raise thequestion of the maximal Fourier frequency accessible to very highenergy sources. However, such events are relatively rare and willrequire long term monitoring of large samples of AGN and the trig-gering of observations under alarm to be efficiently detected. Be-low we present a more general statistical study which aims atassessing the typical gain in terms of temporal resolution of flaringevents that CTA could monitor.
To perform this statistical study, we chose to adopt unbinned,non-parametric methods, in order to take into account all theavailable timing information present in the light-curves and allowto probe for short variability events in a model-independent way.We generated a family of light-curves [180], with an empiricalPSD index b ' 2, which are independent realizations of the processdescribing the H.E.S.S. observations of 2006. A second group oflight-curves was also generated, extending the PSD to the higherfrequencies which would be accessible by CTA, as described inour first example. These unbinned sequences of time-taggedevents were further analyzed for variability using the BayesianBlocks algorithm [181–183], which aim at finding the best parti-tion of a sequence of events in a non-parametric fashion. The opti-mization of the Bayesian priors of the analysis is described inAppendix B.
Two groups of 1,000 light-curves were derived for H.E.S.S. andfor the CTA extrapolation. Observe that the power law describingthe PSD being essentially the same for both groups, the only differ-ence between the two data sets is the sampling provided by theinstrument. The distribution of flare doubling times sd for both
samples is shown in Fig. 17. Many of the light-curve features notresolved in the H.E.S.S. sample can be separated in different eventswith the CTA resolution, shifting the peak of the distribution to-wards shorter duration events and thus revealing additional infor-mation about the timing structure of the source which waspreviously unnoticed. In particular, the most probable flare sd de-rived for H.E.S.S. is of the order of 5 min, a typical value for theH.E.S.S. light-curve of PKS 2155-304 in 2006. With CTA, this valueis expected to shift to 100 s, a factor of 3 shorter than H.E.S.S.
The probability of occurrence and detection of a given ultra-fastflare as presented in the beginning of this section can be assessedby comparing the cumulative distribution of the flare durations asderived from our MC simulations (Fig. 18). If short events are pres-ent in PKS 2155-like light-curves, these will be better sampled byCTA, up to the high resolution limit of the instrument. In the PKS2155-304 light-curve as seen by H.E.S.S. in 2006 [2], the shortestvariability event was of 173 s, which from simulations has an esti-mated probability of occurrence and detection by an instrumentlike H.E.S.S. of '13% (a rare event). With the improved capabilities
Time [min]40 60 80 100 120
]-1
s-2
cm
-9(>
50
GeV
) [ 1
0C
TAI
0
10
20
30
40
50
Fig. 16. Simulated integral flux of PKS 2155-304 above 50 GeV as CTA would monitor it. This simulation relies on an extension of the red noise behavior to high frequencies,generating the short time scale structures (second and fourth peaks). The data are binned in 7.5 s intervals.
Fig. 17. Kernel density estimates for the distributions of the sizes of variabilityfeatures detected from the H.E.S.S. and CTA simulated light-curve samples. Themost probable typical flare size as seen with CTA, of the order of 100 s, isapproximately 1r from the typical values of 5 min observed today.
H. Sol et al. / Astroparticle Physics 43 (2013) 215–240 231
La Thuille, 9-16 March 2013 G.Lamanna
Surveys specifications put as examples
!"#
$%&#'()*+(,-#'(#!"""#.%/&)#012#,+(#&-+,.#340&+5#)%/&,-)#65-**-&#*.+(#+(7#8%'(*-9#%5)-&:+*'%(#,%(9/,*-9#/8#*%#(%;<=####!"#$%&#'()$*#+,,#-./#2)3(4#5&&"#56#789#:"#$%&#;0(0<$:<#13=>&6?#
1.-)-#+&-#->+48?-)#;-??#;'*.'(#%5)-&:+*'%(+?#,%()*&+'(*)#6-=@=#9/*7#,7,?-<###
• # )/&:-7)#,+(#5-#->*-(9-9#'(#,%:-&+@-##
• # )/&:-7)#,+(#5-#&-8-+*-9#'(#*'4-#
M. Renaud: SNRs and PWNe in the CTA era 285
0.0 0.5 1.0 1.5X (deg)
0.0
0.5
1.0
1.5
Y (d
eg)
-0.5
2.0
4.4
6.9
9.3
11.8
0.0 0.2 0.4 0.6 0.8 1.0Offset (deg)
0
2
4
6
Surfa
ce b
right
ness
(cts
.arc
min
-2)
0.0 0.5 1.0 1.5X (deg)
0.0
0.5
1.0
1.5
Y (d
eg)
-0.5
1.6
3.6
5.7
7.7
9.8
0.0 0.1 0.2 0.3Offset (deg)
0
1
2
3
4
5
6
Surfa
ce b
right
ness
(cts
.arc
min
-2)
Fig. 3. Upper panels: CTA-I simulated images ofRX J1713.7−3946-like SNR located at 1 (left) and4 (right) kpc. The color bars give the correlated sig-nificance, and the CTA-I PSF is shown in the insets.Lower panels: Radial profiles of the VHE surfacebrightness at 1 (left) and 4 (right) kpc. The blue andred lines represent the best-fit curves for uniform-sphere and shell-type morphologies, respectively.
as the distance at which the source has apeak significance of 5, while the horizon ofresolvability (for shell-type SNRs) representsthe distance up to which a shell-type fit on thesource radial profile (see Figure 3, bottom) isfavored at ≥ 3 σ over a simple gaussian fit(i.e. the shell is identified as such, and statisti-cally favored over a PWN-like shape). Thesetwo horizons can be translated into fractionsof the total number of detectable/resolvablesources with CTA, based on a model of theGalactic source distribution. The logarithmicspiral arms model of Vallee [17] is assumed,with a galactocentric distribution given byCase & Bhattacharya [7], and an arm disper-sion as a function of the galactocentric radiusfollowing the Galactic dust model of Drimmel& Spergel [10]2. The resulting source distri-bution is shown in Figure 4, together withthe fraction of visible3 SNRs and PWNe as afunction of the distance to the Sun.2 With regard to PWNe, any potential displace-
ment from pulsar birth place due to the kick velocityhas been ignored.3 The visibility is defined here as the fraction of
the sky seen by an observatory located at the samelatitude as the H.E.S.S. site, at zenith angles ≤ 45.
As seen in Figure 4 (middle), a large frac-tion fSNR (∼0.3–0.9) of RXJ1713-, VelaJr- andRCW86-like Galactic SNRs should be de-tectable with CTA-I/D (both configurationsbeing definitively favored in comparison toB, discarded in the following), but only asmall fraction of them (∼0.1–0.2) would ac-tually be resolvable. Although the timescale(τSNR) during which a SNR shines in the VHEdomain is very sensitive to many parame-ters (related to the stellar progenitor, the ac-celeration process and the ambient medium),it is assumed to be identical among all theSNRs. Therefore, the fractions given aboveare converted into numbers following NSNR ∼75 fSNR (τSNR/3kyr) (νSN/2.5), where νSN is theGalactic SN rate [in SNe per century, see 14].This leads to ∼20–70 detectable TeV SNRs,among which ∼7–15 would be resolved withCTA-I/D. The same simulations have been car-ried out by improving the CTA PSF by a factorof 2 (i.e. ! 1′ at 1 TeV, see Figure 1) in order toquantify the effect of the angular resolution onthe number of detectable (Ndetect) and resolv-able (Nresolv) SNRs. While Ndetect gets larger byonly 20% at most, Nresolv increases by a factorof (1.5–1.9).
As for PWNe, a large fraction fPWN (∼0.4–0.8) of G21.5-, HESSJ1356- and Kes75-like nebulae should be detectable with CTA-I/D (see Figure 4, right). de Jager & Djannati-Ataı [9] have estimated the lifetime of TeV-emitting leptons in such sources to be ∼40 kyr(for B = 3 µG, similar to what has been foundin several PWNe such as Vela X). This givesNPWN ∼ 800 fPWN (τPWN/40kyr) (νPSR/2), andimplies that ∼ (300–600) PWNe should be de-tected with CTA-I/D. Again, these estimatesshould be taken with care as they do not ac-count for any time evolution of the TeV lumi-nosity in these sources, which itself depends onmany parameters [e.g. 12].
4. ConclusionsIn this contribution, simulations of Galacticshell-type SNRs and PWNe in the VHE do-main as seen with CTA have been presented,for three different array configurations. Asshown above, the configurations optimized at
tended emission with IGMF dependent size, which emission benefitsfrom Doppler boosting.
There have been no clear observational indications for eitherpair echo or halo emission so far, and deriving lower bounds toIGMF strengths from upper limits to such components obtainedby GeV–TeV observations of selected blazars appears very promis-ing and still a matter of debate [219–225]. Existing limits rely on acombination of data obtained with different types of telescopes inthe GeV and TeV bands. CTA will have the great advantage of beingable to cover all the relevant energy range, from 10 GeV up to10 TeV, within one observational facility. Improving the time cov-erage to better determine the GeV and TeV light-curves with Fermiand hopefully future GeV gamma-ray satellites, together with aglobal network of IACT including the two sites of CTA, would sig-nificantly benefit to this issue.
The positive detection of the pair echo or extended emissioncomponents would provide highly valuable information on theIGMF, a goal that is expected to be achievable with CTA. Pair echoscould be detected in the case of very tiny IGMF (6 10!16 G), and ex-tended emission for higher IGMF values. CTA will conduct detailedmeasurements of spectral variability with higher sensitivity andtime resolution over a wider energy band compared to currentgamma-ray telescopes, potentially allowing us to disentangle andpositively identify the echo component from the primary emission,and thereby probing very weak IGMF in the range B 6 10!16 G, to-tally out of reach with other means of investigation.
A fruitful synergy with wide-field instruments such as HAWC orLHAASO can be expected in the CTA era, since regular, long-termcoverage of the multi-TeV emission of blazars by such facilitiesshould greatly improve our knowledge of their TeV activity ontimescales of years to decades, giving us a much better handle onthe light curve of the primary emission as input for more reliablepredictions of the pair echo and extended emission properties.The prediction of the level of the cascade emission will be greatlyimproved also with the detailed measurements of the blazar spec-tra in the 10 TeV band with CTA itself, which will give the details ofabsorption of the primary gamma-rays in the intergalacticmedium.
If IGMF strengths are in a stronger range, B " 10!16 ! 10!12 G,the spatially-extended emission may be detectable and resolvableby CTA by virtue of its high sensitivity and angular resolution (seeFig. 19), in which case one would probe not only IGMF but also thelifetime of TeV activity for the source. High signal-to-noise detec-tions of pair halos around nearby blazars (z " 0:1! 0:2) would al-low us to study the energy-dependent radial profile and therebydeduce unique information on the IGMF and on the EBL [226].
If the IGMF is B P 10!12 G and strong enough to effectively isot-ropize the secondary pairs, the detection of isotropic pair halosfrom distant AGNs should be feasible [216,228]. Fig. 20 showsthe expected sizes of such isotropic pair halos as a function of red-shift, generated by 10 TeV primary photons giving rise to"100 GeV secondary photons, and using the EBL model of Frances-chini et al. [41]. Even though the properties of such isotropic halosno longer depend explicitly on the IGMF, observation of their iso-tropic nature would still provide indicative lower bounds on its va-lue, allow to check the self-consistency of our EBL description, andalso give important information on the high-energy spectrum andbeaming angle of the primary emission.
Although the halos are very large for redshifts z < 0:5, a halowith a radius <1! at z > 0:5 would fit into the field of view ofCTA telescopes and would allow for reliable background subtrac-tion. If one assumes that the source has a constant mFm-flux from100 GeV to 10 TeV, a simple estimate shows that the halo fluxesare below a couple of percent compared to the primary 100 GeVemission. The halo fluxes would be much larger if the photon indexat the source was much harder than C ¼ 2. This is to be compared
to the pair halo detection limits which should be actually reachablewith CTA.
The expected flux sensitivity for pair halo detection with CTAhas been calculated for four separate approaches. In all cases a dif-ferential angular distribution of a pair halo at z = 0.129 and Ec >100 GeV, taken from Fig. 6 of [229] was used as our model haloprofile, with a functional form: dN/ dh2 / h5=3. The differential en-ergy flux sensitivity for the four different approaches is shown inFig. 21. Methods A and B rely on a 5 r excess above the expectedbackground, calculated using Eq. 17 in [61]. Method A searchesfor some overall extended emission with a halo profile forh < 0:32$. Method B probes a region in which a point-like centralsource would no longer be dominant (0:11$ < h < 0:32$) and there-fore provides the most basic method of establishing the detectionof extended emission. For methods C and D the ‘‘goodness of fit’’for a halo profile (convolved with the CTA PSF) fitted to simulated
Fig. 19. The arrival directions of the primary and secondary gamma-rays (circles)from a source at a distance D = 120 Mpc. The IGMF strength is 10!14 G (upperpanel) and 10!15 G (lower panel). The sizes of the circles representing each photonare proportional to the photon energies. The AGN intrinsic gamma-ray spectrum istypically described as dN=dE " E!2expð!E=EcutÞ with the cutoff energyEcut " 300 TeV. The blue dashed and red solid circles are radii of 1.5$ and 2.5$ ,respectively, and would perfectly fit into the FoV of CTA. See [227] for details. (Forinterpretation of the references to color in this figure legend, the reader is referredto the web version of this article.)
234 H. Sol et al. / Astroparticle Physics 43 (2013) 215–240
www.cta-observatory.org