Science of the Total Environment...Defining fish community structure in Lake Winnipeg using stable...
14
Defining fish community structure in Lake Winnipeg using stable isotopes (δ 13 C, δ 15 N, δ 34 S): Implications for monitoring ecological responses and trophodynamics of mercury & other trace elements Amy F.A. Ofukany a,1 , Leonard I. Wassenaar b,2 , Alexander L. Bond b, ⁎, Keith A. Hobson b a Toxicology Centre, University of Saskatchewan, 44 Campus Drive, Saskatoon, Saskatchewan S7N 5B3, Canada b Environment Canada, 11 Innovation Boulevard, Saskatoon, Saskatchewan S7N 3H5, Canada HIGHLIGHTS • Anthropogenic eutrophication & non-native species affect Lake Winnipeg’s ecosystem. • We measured stable isotopes and trace elements in 15 native fish species. • There was more evidence for growth dilution than biomagnification for most elements. • The trophic structures of the north and south basins were different. • These results will help determine the effects of recent arrival of zebra mussels. abstract article info Article history: Received 3 April 2014 Received in revised form 30 July 2014 Accepted 31 July 2014 Available online xxxx Editor: F. Riget Keywords: Biomagnification Growth dilution Mercury Stable isotopes Trace elements The ecological integrity of freshwater lakes is influenced by atmospheric and riverine deposition of contaminants, shoreline development, eutrophication, and the introduction of non-native species. Changes to the trophic structure of Lake Winnipeg, Canada, and consequently, the concentrations of contaminants and trace elements measured in tissues of native fishes, are likely attributed to agricultural runoff from the 977,800 km 2 watershed and the arrival of non-native zooplankters and fishes. We measured δ 13 C, δ 15 N, and δ 34 S along with concentra- tions of 15 trace elements in 17 native fishes from the north and south basins of Lake Winnipeg in 2009 and 2010. After adjusting for differences in isotopic baseline values between the two basins, fishes in the south basin had consistently higher δ 13 C and δ 34 S, and lower δ 15 N. We found little evidence of biomagnification of trace elements at the community level, but walleye (Sander vitreus) and freshwater drum (Aplodinotus grunniens) had higher mercury and selenium concentrations with increased trophic position, coincident with increased piscivory. There was evidence of growth dilution of cobalt, copper, manganese, molybdenum, thallium, and vanadium, and bioaccumulation of mercury, which could be explained by increases in algal (and consequently, lake and fish) productivity. We conclude that the north and south basins of Lake Winnipeg represent very different communities with different trophic structures and trace element concentrations. © 2014 Elsevier B.V. All rights reserved. 1. Introduction Aquatic ecosystems throughout the world are affected by agricultural, urban, and industrial developments (Schindler, 1987; Sharpley et al., 1994; Zeng and Arnold, 2014). Associated changes to the relative abun- dance of nutrients entering lacustrine environments can affect the numbers and nutritional quality of organisms at the base of the food web, thereby affecting the overall condition of upper-level consumers (Hebert et al., 2006). Increased atmospheric deposition and riverine loading of contaminants to lakes, estuaries and oceans have also raised concerns about the integrity of aquatic communities (Brumbaugh et al., 2005; Campbell et al., 2005; Ikemoto et al., 2008). In many instances, altered trophic interactions among aquatic biota have been concomitant with pollution of their habitats (Gewurtz et al., 2006; Ikemoto et al., 2008). Changes in food web structure and trophodynamics may modulate contaminant biomagnification and the rates at which toxic compounds accumulate in biota (Gustin et al., 2005; Jardine et al., 2006; Lavoie et al., 2013). For example, increases in lake productivity following nutrient enrichment and shifts in species diversity or abundance may Science of the Total Environment 497–498 (2014) 239–249 ⁎ Corresponding author at: RSPB Centre for Conservation Science, Royal Society for the Protection of Birds, The Lodge, Sandy, Bedfordshire SG19 2DL, United Kingdom. Tel.: + 44 1767 693432. E-mail address: [email protected] (A.L. Bond). 1 Current Address: Golder Associates Ltd., 1721 8th Street East, Saskatoon, Saskatchewan S7H 0T4, Canada. 2 Current Address: International Atomic Energy Agency, 1400 Vienna, Austria. http://dx.doi.org/10.1016/j.scitotenv.2014.07.125 0048-9697/© 2014 Elsevier B.V. All rights reserved. Contents lists available at ScienceDirect Science of the Total Environment journal homepage: www.elsevier.com/locate/scitotenv
Transcript of Science of the Total Environment...Defining fish community structure in Lake Winnipeg using stable...
Science of the Total Environment 497–498 (2014) 239–249
Contents lists available at ScienceDirect
Science of the Total Environment
j ourna l homepage: www.e lsev ie r .com/ locate /sc i totenv
Defining fish community structure in Lake Winnipeg using stableisotopes (δ13C, δ15N, δ34S): Implications for monitoring ecologicalresponses and trophodynamics of mercury & other trace elements
Amy F.A. Ofukany a,1, Leonard I. Wassenaar b,2, Alexander L. Bond b,⁎, Keith A. Hobson b
a Toxicology Centre, University of Saskatchewan, 44 Campus Drive, Saskatoon, Saskatchewan S7N 5B3, Canadab Environment Canada, 11 Innovation Boulevard, Saskatoon, Saskatchewan S7N 3H5, Canada
H I G H L I G H T S
• Anthropogenic eutrophication & non-native species affect Lake Winnipeg’s ecosystem.• We measured stable isotopes and trace elements in 15 native fish species.• There was more evidence for growth dilution than biomagnification for most elements.• The trophic structures of the north and south basins were different.• These results will help determine the effects of recent arrival of zebra mussels.
⁎ Corresponding author at: RSPB Centre for Conservathe Protection of Birds, The Lodge, Sandy, BedfordshirTel.: +44 1767 693432.
E-mail address: [email protected] (A.L. Bond).1 CurrentAddress: GolderAssociates Ltd., 17218th Stree
S7H 0T4, Canada.2 Current Address: International Atomic Energy Agency
http://dx.doi.org/10.1016/j.scitotenv.2014.07.1250048-9697/© 2014 Elsevier B.V. All rights reserved.
a b s t r a c t
a r t i c l e i n f oArticle history:Received 3 April 2014Received in revised form 30 July 2014Accepted 31 July 2014Available online xxxx
Editor: F. Riget
Keywords:BiomagnificationGrowth dilutionMercuryStable isotopesTrace elements
The ecological integrity of freshwater lakes is influenced by atmospheric and riverine deposition of contaminants,shoreline development, eutrophication, and the introduction of non-native species. Changes to the trophicstructure of Lake Winnipeg, Canada, and consequently, the concentrations of contaminants and trace elementsmeasured in tissues of native fishes, are likely attributed to agricultural runoff from the 977,800 km2 watershedand the arrival of non-native zooplankters and fishes. We measured δ13C, δ15N, and δ34S along with concentra-tions of 15 trace elements in 17 native fishes from the north and south basins of Lake Winnipeg in 2009 and2010. After adjusting for differences in isotopic baseline values between the two basins, fishes in the southbasin had consistently higher δ13C and δ34S, and lower δ15N. We found little evidence of biomagnification oftrace elements at the community level, butwalleye (Sander vitreus) and freshwater drum (Aplodinotus grunniens)had higher mercury and selenium concentrations with increased trophic position, coincident with increasedpiscivory. There was evidence of growth dilution of cobalt, copper, manganese, molybdenum, thallium, andvanadium, and bioaccumulation of mercury, which could be explained by increases in algal (and consequently,lake andfish) productivity.We conclude that the north and south basins of LakeWinnipeg represent very differentcommunities with different trophic structures and trace element concentrations.
© 2014 Elsevier B.V. All rights reserved.
1. Introduction
Aquatic ecosystems throughout theworld are affected by agricultural,urban, and industrial developments (Schindler, 1987; Sharpley et al.,1994; Zeng and Arnold, 2014). Associated changes to the relative abun-dance of nutrients entering lacustrine environments can affect the
tion Science, Royal Society fore SG19 2DL, United Kingdom.
t East, Saskatoon, Saskatchewan
, 1400 Vienna, Austria.
numbers and nutritional quality of organisms at the base of the foodweb, thereby affecting the overall condition of upper-level consumers(Hebert et al., 2006). Increased atmospheric deposition and riverineloading of contaminants to lakes, estuaries and oceans have also raisedconcerns about the integrity of aquatic communities (Brumbaugh et al.,2005; Campbell et al., 2005; Ikemoto et al., 2008). In many instances,altered trophic interactions among aquatic biota have been concomitantwith pollution of their habitats (Gewurtz et al., 2006; Ikemoto et al.,2008). Changes in foodweb structure and trophodynamicsmaymodulatecontaminant biomagnification and the rates at which toxic compoundsaccumulate in biota (Gustin et al., 2005; Jardine et al., 2006; Lavoie et al.,2013). For example, increases in lake productivity following nutrientenrichment and shifts in species diversity or abundance may
240 A.F.A. Ofukany et al. / Science of the Total Environment 497–498 (2014) 239–249
significantly alter the availability of contaminants as well as the trophicinteractions which facilitate their dietary transport (Stewart et al.,2003). Permanent changes in fish community structure may alsooccur in response to the introduction of non-native organisms or over-exploitation, and potentially depletion, of predatory fish populations(Bocking, 1997; Munawar et al., 2005) (Cucherousset et al., 2012).Such gains or losses of trophic linkages may ultimately decrease orincrease the rates at which mercury (Hg) and other toxic compoundsbiomagnify through aquatic food webs (Jardine et al., 2006).
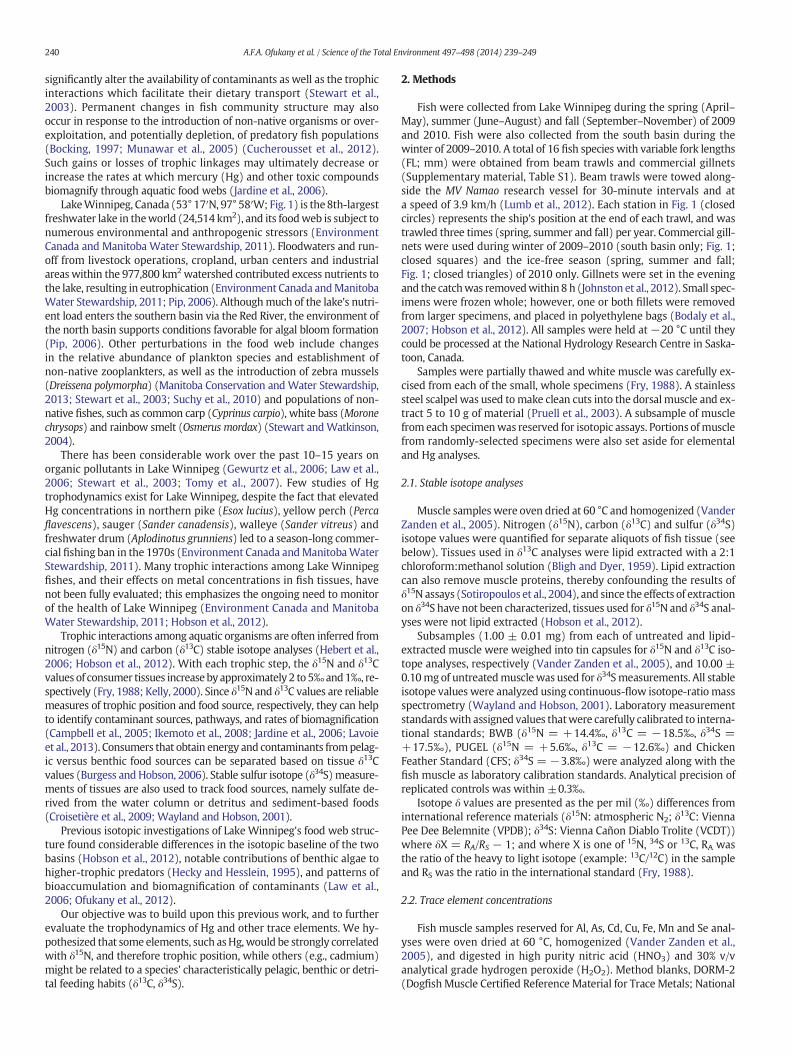
LakeWinnipeg, Canada (53° 17′N, 97° 58′W;Fig. 1) is the 8th-largestfreshwater lake in theworld (24,514 km2), and its foodweb is subject tonumerous environmental and anthropogenic stressors (EnvironmentCanada and Manitoba Water Stewardship, 2011). Floodwaters and run-off from livestock operations, cropland, urban centers and industrialareas within the 977,800 km2watershed contributed excess nutrients tothe lake, resulting in eutrophication (Environment Canada andManitobaWater Stewardship, 2011; Pip, 2006). Althoughmuch of the lake's nutri-ent load enters the southern basin via the Red River, the environment ofthe north basin supports conditions favorable for algal bloom formation(Pip, 2006). Other perturbations in the food web include changesin the relative abundance of plankton species and establishment ofnon-native zooplankters, as well as the introduction of zebra mussels(Dreissena polymorpha) (Manitoba Conservation andWater Stewardship,2013; Stewart et al., 2003; Suchy et al., 2010) and populations of non-native fishes, such as common carp (Cyprinus carpio), white bass (Moronechrysops) and rainbow smelt (Osmerus mordax) (Stewart andWatkinson,2004).
There has been considerable work over the past 10–15 years onorganic pollutants in Lake Winnipeg (Gewurtz et al., 2006; Law et al.,2006; Stewart et al., 2003; Tomy et al., 2007). Few studies of Hgtrophodynamics exist for Lake Winnipeg, despite the fact that elevatedHg concentrations in northern pike (Esox lucius), yellow perch (Percaflavescens), sauger (Sander canadensis), walleye (Sander vitreus) andfreshwater drum (Aplodinotus grunniens) led to a season-long commer-cial fishing ban in the 1970s (Environment Canada andManitobaWaterStewardship, 2011). Many trophic interactions among Lake Winnipegfishes, and their effects on metal concentrations in fish tissues, havenot been fully evaluated; this emphasizes the ongoing need to monitorof the health of Lake Winnipeg (Environment Canada and ManitobaWater Stewardship, 2011; Hobson et al., 2012).
Trophic interactions among aquatic organisms are often inferred fromnitrogen (δ15N) and carbon (δ13C) stable isotope analyses (Hebert et al.,2006; Hobson et al., 2012). With each trophic step, the δ15N and δ13Cvalues of consumer tissues increase by approximately 2 to 5‰ and1‰, re-spectively (Fry, 1988; Kelly, 2000). Since δ15N and δ13C values are reliablemeasures of trophic position and food source, respectively, they can helpto identify contaminant sources, pathways, and rates of biomagnification(Campbell et al., 2005; Ikemoto et al., 2008; Jardine et al., 2006; Lavoieet al., 2013). Consumers that obtain energy and contaminants frompelag-ic versus benthic food sources can be separated based on tissue δ13Cvalues (Burgess and Hobson, 2006). Stable sulfur isotope (δ34S)measure-ments of tissues are also used to track food sources, namely sulfate de-rived from the water column or detritus and sediment-based foods(Croisetière et al., 2009; Wayland and Hobson, 2001).
Previous isotopic investigations of Lake Winnipeg's food web struc-ture found considerable differences in the isotopic baseline of the twobasins (Hobson et al., 2012), notable contributions of benthic algae tohigher-trophic predators (Hecky and Hesslein, 1995), and patterns ofbioaccumulation and biomagnification of contaminants (Law et al.,2006; Ofukany et al., 2012).
Our objective was to build upon this previous work, and to furtherevaluate the trophodynamics of Hg and other trace elements. We hy-pothesized that some elements, such asHg,would be strongly correlatedwith δ15N, and therefore trophic position, while others (e.g., cadmium)might be related to a species' characteristically pelagic, benthic or detri-tal feeding habits (δ13C, δ34S).
2. Methods
Fish were collected from Lake Winnipeg during the spring (April–May), summer (June–August) and fall (September–November) of 2009and 2010. Fish were also collected from the south basin during thewinter of 2009–2010. A total of 16 fish species with variable fork lengths(FL; mm) were obtained from beam trawls and commercial gillnets(Supplementary material, Table S1). Beam trawls were towed along-side the MV Namao research vessel for 30-minute intervals and ata speed of 3.9 km/h (Lumb et al., 2012). Each station in Fig. 1 (closedcircles) represents the ship's position at the end of each trawl, and wastrawled three times (spring, summer and fall) per year. Commercial gill-nets were used during winter of 2009–2010 (south basin only; Fig. 1;closed squares) and the ice-free season (spring, summer and fall;Fig. 1; closed triangles) of 2010 only. Gillnets were set in the eveningand the catchwas removedwithin 8 h (Johnston et al., 2012). Small spec-imens were frozen whole; however, one or both fillets were removedfrom larger specimens, and placed in polyethylene bags (Bodaly et al.,2007; Hobson et al., 2012). All samples were held at −20 °C until theycould be processed at the National Hydrology Research Centre in Saska-toon, Canada.
Samples were partially thawed and white muscle was carefully ex-cised from each of the small, whole specimens (Fry, 1988). A stainlesssteel scalpel was used tomake clean cuts into the dorsalmuscle and ex-tract 5 to 10 g of material (Pruell et al., 2003). A subsample of musclefrom each specimenwas reserved for isotopic assays. Portions ofmusclefrom randomly-selected specimens were also set aside for elementaland Hg analyses.
2.1. Stable isotope analyses
Muscle samples were oven dried at 60 °C and homogenized (VanderZanden et al., 2005). Nitrogen (δ15N), carbon (δ13C) and sulfur (δ34S)isotope values were quantified for separate aliquots of fish tissue (seebelow). Tissues used in δ13C analyses were lipid extracted with a 2:1chloroform:methanol solution (Bligh and Dyer, 1959). Lipid extractioncan also remove muscle proteins, thereby confounding the results ofδ15N assays (Sotiropoulos et al., 2004), and since the effects of extractionon δ34S have not been characterized, tissues used for δ15N and δ34S anal-yses were not lipid extracted (Hobson et al., 2012).
Subsamples (1.00 ± 0.01 mg) from each of untreated and lipid-extracted muscle were weighed into tin capsules for δ15N and δ13C iso-tope analyses, respectively (Vander Zanden et al., 2005), and 10.00 ±0.10mgof untreatedmusclewas used for δ34Smeasurements. All stableisotope values were analyzed using continuous-flow isotope-ratio massspectrometry (Wayland and Hobson, 2001). Laboratory measurementstandardswith assigned values thatwere carefully calibrated to interna-tional standards; BWB (δ15N = +14.4‰, δ13C = −18.5‰, δ34S =+17.5‰), PUGEL (δ15N = +5.6‰, δ13C = −12.6‰) and ChickenFeather Standard (CFS; δ34S = −3.8‰) were analyzed along with thefish muscle as laboratory calibration standards. Analytical precision ofreplicated controls was within ±0.3‰.
Isotope δ values are presented as the per mil (‰) differences frominternational reference materials (δ15N: atmospheric N2; δ13C: ViennaPee Dee Belemnite (VPDB); δ34S: Vienna Cañon Diablo Trolite (VCDT))where δX = RA/RS − 1; and where X is one of 15N, 34S or 13C, RA wasthe ratio of the heavy to light isotope (example: 13C/12C) in the sampleand RS was the ratio in the international standard (Fry, 1988).
2.2. Trace element concentrations
Fish muscle samples reserved for Al, As, Cd, Cu, Fe, Mn and Se anal-yses were oven dried at 60 °C, homogenized (Vander Zanden et al.,2005), and digested in high purity nitric acid (HNO3) and 30% v/vanalytical grade hydrogen peroxide (H2O2). Method blanks, DORM-2(Dogfish Muscle Certified Reference Material for Trace Metals; National

Fig. 1. LakeWinnipeg,Manitoba, Canada. Fish specimenswere collectedduring the ice-free seasons of 2009 and 2010 (beam trawls: closed circles; gillnets: closed triangles) and thewinterof 2009–2010 (gillnets: closed squares). The basins are separated by the narrows one-third of the way north.
241A.F.A. Ofukany et al. / Science of the Total Environment 497–498 (2014) 239–249
Research Council Canada; Ottawa, ON) and duplicate samples wereincluded in each digestion batch at a ratio of one blank, referenceand duplicate for every ten unknowns. Elemental concentrations werequantified via Inductively Coupled Plasma Mass Spectrometry (ICP-MS)at the Toxicology Centre, University of Saskatchewan, Saskatoon, Canada(Phibbs et al., 2011). Acceptable elemental recoveries from DORM-2and coefficients of variation (CV) on duplicate samples were ± 20%and ± 15%, respectively (Brumbaugh et al., 2005). Limits of detection(LoD) for Al, As, Cd, Cu, Fe, Mn and Se were better than 0.9 μg/g,1.1 × 10−3 μg/g, 1.8 × 10⁻³ μg/g, 5.0 × 10⁻³ μg/g, 0.1 μg/g, 1.3 × 10⁻³
and 8.0 × 10⁻⁴ μg/g dry weight (dw), respectively.
2.3. Mercury
Fresh, rather than dried, fish muscle samples were microwavedigested (US EPA, 1996) and analyzed for total Hg (hereafter “Hg”) viacold-vapor atomic fluorescence spectrometry (CVAFS; Baker et al.,2004). Digestions and analyses were conducted at the Saskatchewan Re-search Council (SRC) Environmental Analytical Laboratory in Saskatoon,Canada. Blanks, reference materials and duplicates were analyzed alongwith the muscle samples. Recoveries of Hg from DORM-2 were between85 and 100%, except for two low recoveries of 75% and 78%. The CV onduplicate samples was within 15%, and the limit of detection (LoD) was
0.01 μg/g wet weight (ww). Since all other concentrations are presentedon a dw basis, percent moisture data for each muscle sample were usedto convert the ww Hg data to units of μg/g dw.
2.4. Statistical analyses
Baseline δ15N, δ13C and δ34S values of nutrients, primary producers,and primary consumers differ between Lake Winnipeg's north andsouth basins (Hobson et al., 2012; Ofukany, 2012). The spatial isotopicheterogeneity identified for zooplankton (δ15NZoop), dissolved sulfate(δ34SDS) and dissolved inorganic carbon (DIC; δ13CDIC) may confoundthe interpretation of isotopic data for higher consumers (Ofukany,2012; Post, 2002). In order to compensate for this variability, isotopevalues for fish muscle were normalized according to:
δXCorrected ¼ δXFish–δXBaseline ð2Þ
where X was one of 15N, 13C or 34S, and δXBaseline was the mean δ15NZoop
(north = +3.4 ± 1.9‰, n = 31; south = +9.6 ± 2.8‰, n = 27),δ13CDIC (north = −3.4 ± 2.0‰, n = 31; south = −8.4 ± 1.0‰, n =30) or δ34SDS (north = −4.7 ± 3.1‰, n = 30; south = −8.2 ± 2.5‰,n = 29) value for the basin where the fish was captured (Hobson et al.,2012; Post, 2002). Mean δ15NZoop, δ13CDIC and δ34SDS values for each
242 A.F.A. Ofukany et al. / Science of the Total Environment 497–498 (2014) 239–249
basin were used in Eq. (2) in order to compensate for within-basin fishmovements. The potential seasonal migration of fishes between the twobasinswas assumed to be negligible (Hobson et al., 2012). Details regard-ing the measurement of δ15NZoop, δ13CDIC and δ34SDS in zooplankton, DICand dissolved sulfate respectively, are presented by Ofukany (2012).
Trophic position (TP) was determined for each species within eachsub-basin, andwas used to compare δ15Ndata across systems. Estimatesof TP were calculated from δ15N values in fish muscle and zooplankton(δ15NZoop), where zooplankton was assumed to occupy a TP = 2 andall subsequent fish TPs were derived from:
TPFish ¼ 2þ δ15NFish−δ15NZoop
� �=3:4‰
where δ15NFish was the nitrogen isotope value for fish tissue and thedietary isotopic discrimination factor (Δ15N) at each trophic step was3.4‰ (Gewurtz et al., 2006; Jardine et al., 2006).
A general linear model with Tukey's Honest Significant Difference(HSD) formultiple comparisonswas used to determinewhether isotopicdata for north and south basin fishes came from the same distribution.A plot of species- and basin-specific δ15N, δ13C and δ34S values was usedto examine fish community structure in terms of three-dimensionalisotopic space. Concentrations of trace elements were log-transformedprior to all statistical analyses to meet assumptions of normality basedon Shapiro–Wilks' test (Shapiro and Wilk, 1965).
We used general linearmodels to describe trace element concentra-tions in fish muscle based on species, sampling period, dietary parame-ters (δ15N, δ13C, and δ34S) and fish size (FL), and Tukey's HonestSignificant Differences for post-hoc comparisons. Statistical analyseswere conducted in R 3.0.2 (R Development Core Team, 2013), andeffects were considered significant when p b 0.05.
3. Results
3.1. Stable isotope values
There were significant differences in stable isotope δ values amongspecies (Wilks' λ = 0.396, F48,4132 = 31.49, p b 0.0001), sub-basins(Wilks' λ= 0.407, F3,1389 = 675.87, p b 0.0001), and the species × basininteraction was also significant (Wilks' λ = 0.849, F33,4093 = 7.07,p b 0.0001). Univariate analyses showed that δ13C varied by species(F16,1704 = 41.18, p b 0.0001), basin (F1,1704 = 986.62, p b 0.0001),and the species × basin interaction was significant (F12,1704 = 3.42,p b 0.0001). Within each species, δ13C was consistently lower innorth basin fish, and the difference was significant for all species(Tukey's HSD, p = b0.0001–0.028) except for longnose sucker, whichdid not differ in δ13C between basins (Tukey's HSD, p = 0.433), thiswas likely a function of the small sample size and high variance insouth basin samples (Table 1).
North basin goldeye had the lowest δ13C values of all species, whichindicated they were the most pelagic fishes in either basin (France,1995). Carbon isotope values for north basin white bass and emeraldshiner were also among the lowest. For longnose sucker and whitesucker collected from the north basin, δ13C values in the muscle wererepresentative of relatively benthivorous feeding strategies (Stewartand Watkinson, 2004). Lake whitefish also had δ13C profiles which felltoward the benthic end of the δ13C spectrum; however their marginallyhigher δ15N (Table 1) may be indicative of some piscivory.
The distribution of south basin fishes along the pelagic–benthicδ13C gradient was different from the north basin. Rainbow smelt andtroutperch, rather than goldeye, white bass or emerald shiner, had thelowest δ13C values of any south basin species (Table 1). Longnose suckercollected from the south basin had the highest δ13C values (Table 1,Fig. 2); however values for south basin freshwater drum and walleyewere also among the largest.
Fishmuscle δ15N also differed significantly among species (F16,1656=45.43, p b 0.0001) and basin (F1,1656 = 1894.62, p b 0.0001); thespecies × basin interaction was also significant (F11,1656 = 10.61,p b 0.0001). Within-species differences were identified where fishdata were available for both basins; δ15N was consistently higher inthe north basin for all species (Tukey's HSD, p = b0.0001–0.001),except white bass (Tukey's HSD, p = 0.37) and longnose sucker(Tukey's HSD, p = 0.99).
Walleye and sauger had the highest δ15N of north basin fish(Table 1). Within the south basin fish community, white bass, northernpike and sauger had the highest δ15N. South basin emerald shiner andcisco occupied the lowest TPs identified for all Lake Winnipeg fishes(TPEMSH = 3.1 ± 0.4; TPCISC = 3.2 ± 0.5; Table 1, Fig. 2).
The δ34S values of fishmuscle showed the same overall pattern, differ-ing among species (F16,1426= 14.86, p b 0.0001), basins (F1,1426= 306.49,p b 0.0001), andwith a significant species × basin interaction (F12,1426=4.94, p b 0.0001). Within each species, δ34S was higher in south basincisco, emerald shiner, freshwater drum, rainbow smelt, sauger, andwhite bass (p b 0.001), while there was no difference in δ34S in longnosesucker, northern pike, white sucker, or yellow perch from the two basins(p N 0.11). The overlap in δ34S values (δ34Soverlap ≈ 8.0‰) between thenorth and south basin fish communities was much greater than thatof δ13C (δ13Coverlap ≈ 4.5‰).
Troutperch collected from the lake's north basin had the lowest δ34Svalues of all species, which would indicate that this group was mostreliant on detrital sources of sulfate (Croisetière et al., 2009). Troutperchfrom the south basin also had much lower δ34S values than other southbasin fishes, except for longnose sucker (Table 1). The highest meanδ34S value for north basin fishes was that of ninespine stickleback;however, δ values for northern pike, walleye, rainbow smelt, and whitesucker were statistically similar (Tukey's HSD, p ≤ 0.05; Table 1).These speciesweremost likely to have rejected detrital sources of sulfate(see below; Ahlgren, 1996; Croisetière et al., 2009). Rainbow smelt hadthe greatest δ34S values of all south basin fishes (Table 1, Fig. 2).
3.2. Trace element concentrations
Of all the elements measured in fish muscle, Fe was found in thegreatest concentrations, and ranged from 3.06 to 60.43 μg/g dw insouth basin walleye and goldeye, respectively. Concentrations of Alwere consistently below the LoD, except in one north basin rainbowsmelt (Table 2; 0.77 μg/g dw, n = 15). Therefore, no models for Alwere evaluated. Three and six of the Hg concentrations measured innorth basin ciscoes (n= 28) and rainbow smelt (n= 26), respectively,were below the LoD. A single south basin yellow perch (n= 9) also fellbelow the Hg LoD. These specimens were assigned Hg concentrationsequal to half the LoD. All concentrations of As, Cd, Fe, Mn and Se wereabove their respective LoDs.
We found species to be the most frequent significant predictor oftrace element concentrations (13/15 elements), followed by fork length(7/15 elements), δ13C (3/15 elements), δ15N (1/15 elements), and δ34S(1/15 elements; Table 3). Only species influenced the As concentrationsin fishmuscle. Lakewhitefish, rainbow smelt, and freshwater drumhadthe highest concentrations, while northern pike, sauger, white bass,emerald shiner, and goldeye had the lowest As concentrations (Table 3).Cadmium was also influenced only by species, with rainbow smelt, andemerald shiner with the highest concentrations, and walleye, northernpike, cisco, freshwater drum, goldeye, and lake whitefish with lowerconcentrations (Table 3).
Concentrations of Co in fish muscle were negatively related to forklength (β±SE=−0.007± 0.002). Among species, thehighest concen-trationswere in cisco, goldeye, freshwater drum, rainbow smelt and lakewhitefish, and the lowest in northern pike and walleye, though thedifferences among specieswere small (Table 3). Cuwas negatively relat-ed to δ13C (β=−0.047± 0.017), δ15N (β=−0.027± 0.025), and forklength (β=−0.002± 0.001). Emerald shiner and longnose sucker had
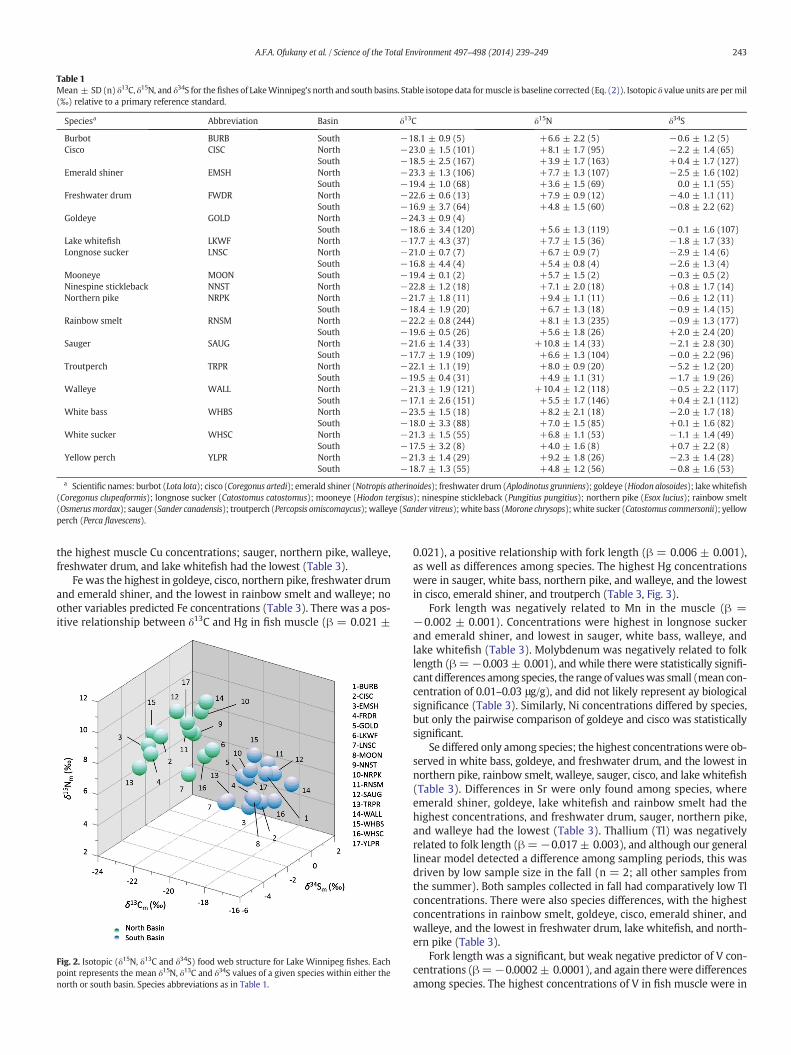
Table 1Mean ± SD (n) δ13C, δ15N, and δ34S for thefishes of LakeWinnipeg's north and south basins. Stable isotope data formuscle is baseline corrected (Eq. (2)). Isotopic δ value units are permil(‰) relative to a primary reference standard.
Speciesa Abbreviation Basin δ13C δ15N δ34S
Burbot BURB South −18.1 ± 0.9 (5) +6.6 ± 2.2 (5) −0.6 ± 1.2 (5)Cisco CISC North −23.0 ± 1.5 (101) +8.1 ± 1.7 (95) −2.2 ± 1.4 (65)
South −18.5 ± 2.5 (167) +3.9 ± 1.7 (163) +0.4 ± 1.7 (127)Emerald shiner EMSH North −23.3 ± 1.3 (106) +7.7 ± 1.3 (107) −2.5 ± 1.6 (102)
South −19.4 ± 1.0 (68) +3.6 ± 1.5 (69) 0.0 ± 1.1 (55)Freshwater drum FWDR North −22.6 ± 0.6 (13) +7.9 ± 0.9 (12) −4.0 ± 1.1 (11)
South −16.9 ± 3.7 (64) +4.8 ± 1.5 (60) −0.8 ± 2.2 (62)Goldeye GOLD North −24.3 ± 0.9 (4)
South −18.6 ± 3.4 (120) +5.6 ± 1.3 (119) −0.1 ± 1.6 (107)Lake whitefish LKWF North −17.7 ± 4.3 (37) +7.7 ± 1.5 (36) −1.8 ± 1.7 (33)Longnose sucker LNSC North −21.0 ± 0.7 (7) +6.7 ± 0.9 (7) −2.9 ± 1.4 (6)
South −16.8 ± 4.4 (4) +5.4 ± 0.8 (4) −2.6 ± 1.3 (4)Mooneye MOON South −19.4 ± 0.1 (2) +5.7 ± 1.5 (2) −0.3 ± 0.5 (2)Ninespine stickleback NNST North −22.8 ± 1.2 (18) +7.1 ± 2.0 (18) +0.8 ± 1.7 (14)Northern pike NRPK North −21.7 ± 1.8 (11) +9.4 ± 1.1 (11) −0.6 ± 1.2 (11)
South −18.4 ± 1.9 (20) +6.7 ± 1.3 (18) −0.9 ± 1.4 (15)Rainbow smelt RNSM North −22.2 ± 0.8 (244) +8.1 ± 1.3 (235) −0.9 ± 1.3 (177)
South −19.6 ± 0.5 (26) +5.6 ± 1.8 (26) +2.0 ± 2.4 (20)Sauger SAUG North −21.6 ± 1.4 (33) +10.8 ± 1.4 (33) −2.1 ± 2.8 (30)
South −17.7 ± 1.9 (109) +6.6 ± 1.3 (104) −0.0 ± 2.2 (96)Troutperch TRPR North −22.1 ± 1.1 (19) +8.0 ± 0.9 (20) −5.2 ± 1.2 (20)
South −19.5 ± 0.4 (31) +4.9 ± 1.1 (31) −1.7 ± 1.9 (26)Walleye WALL North −21.3 ± 1.9 (121) +10.4 ± 1.2 (118) −0.5 ± 2.2 (117)
South −17.1 ± 2.6 (151) +5.5 ± 1.7 (146) +0.4 ± 2.1 (112)White bass WHBS North −23.5 ± 1.5 (18) +8.2 ± 2.1 (18) −2.0 ± 1.7 (18)
South −18.0 ± 3.3 (88) +7.0 ± 1.5 (85) +0.1 ± 1.6 (82)White sucker WHSC North −21.3 ± 1.5 (55) +6.8 ± 1.1 (53) −1.1 ± 1.4 (49)
South −17.5 ± 3.2 (8) +4.0 ± 1.6 (8) +0.7 ± 2.2 (8)Yellow perch YLPR North −21.3 ± 1.4 (29) +9.2 ± 1.8 (26) −2.3 ± 1.4 (28)
South −18.7 ± 1.3 (55) +4.8 ± 1.2 (56) −0.8 ± 1.6 (53)
a Scientific names: burbot (Lota lota); cisco (Coregonus artedi); emerald shiner (Notropis atherinoides); freshwater drum (Aplodinotus grunniens); goldeye (Hiodonalosoides); lakewhitefish(Coregonus clupeaformis); longnose sucker (Catostomus catostomus); mooneye (Hiodon tergisus); ninespine stickleback (Pungitius pungitius); northern pike (Esox lucius); rainbow smelt(Osmerusmordax); sauger (Sander canadensis); troutperch (Percopsis omiscomaycus);walleye (Sander vitreus);white bass (Morone chrysops);white sucker (Catostomus commersonii); yellowperch (Perca flavescens).
243A.F.A. Ofukany et al. / Science of the Total Environment 497–498 (2014) 239–249
the highest muscle Cu concentrations; sauger, northern pike, walleye,freshwater drum, and lake whitefish had the lowest (Table 3).
Fe was the highest in goldeye, cisco, northern pike, freshwater drumand emerald shiner, and the lowest in rainbow smelt and walleye; noother variables predicted Fe concentrations (Table 3). There was a pos-itive relationship between δ13C and Hg in fish muscle (β = 0.021 ±
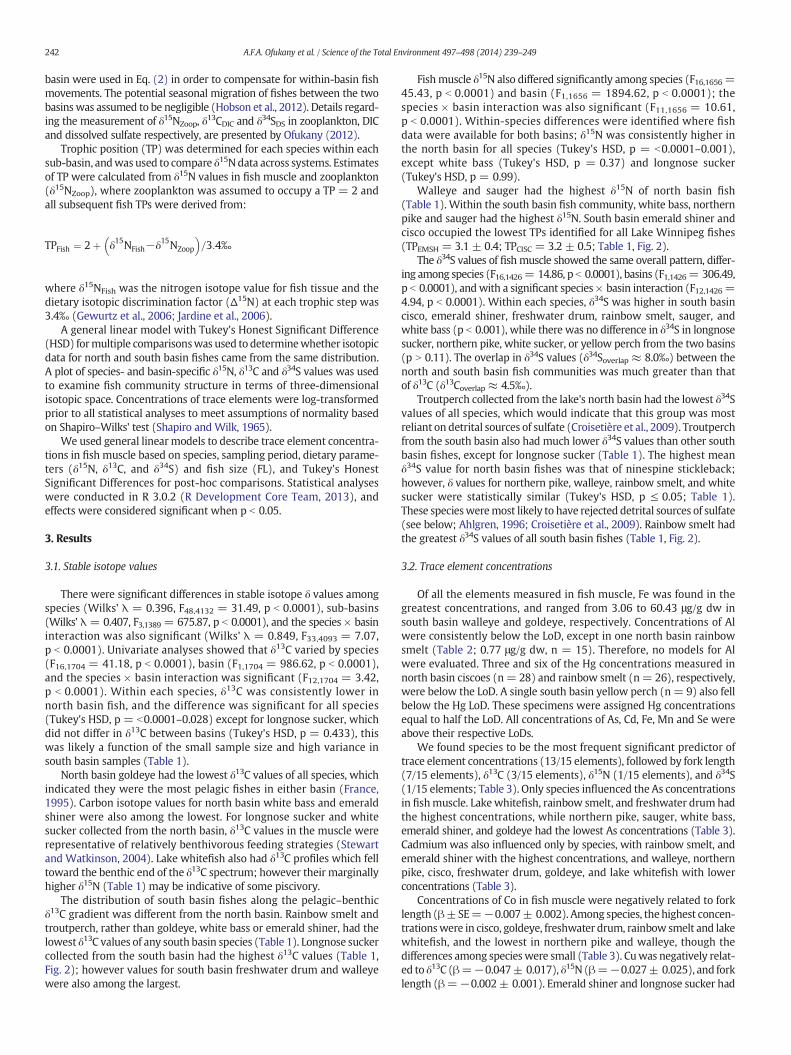
Fig. 2. Isotopic (δ15N, δ13C and δ34S) food web structure for Lake Winnipeg fishes. Eachpoint represents the mean δ15N, δ13C and δ34S values of a given species within either thenorth or south basin. Species abbreviations as in Table 1.
0.021), a positive relationship with fork length (β = 0.006 ± 0.001),as well as differences among species. The highest Hg concentrationswere in sauger, white bass, northern pike, and walleye, and the lowestin cisco, emerald shiner, and troutperch (Table 3, Fig. 3).
Fork length was negatively related to Mn in the muscle (β =−0.002 ± 0.001). Concentrations were highest in longnose suckerand emerald shiner, and lowest in sauger, white bass, walleye, andlake whitefish (Table 3). Molybdenum was negatively related to folklength (β=−0.003 ± 0.001), and while there were statistically signifi-cant differences among species, the range of valueswas small (mean con-centration of 0.01–0.03 μg/g), and did not likely represent ay biologicalsignificance (Table 3). Similarly, Ni concentrations differed by species,but only the pairwise comparison of goldeye and cisco was statisticallysignificant.
Se differed only among species; the highest concentrationswere ob-served in white bass, goldeye, and freshwater drum, and the lowest innorthern pike, rainbow smelt, walleye, sauger, cisco, and lake whitefish(Table 3). Differences in Sr were only found among species, whereemerald shiner, goldeye, lake whitefish and rainbow smelt had thehighest concentrations, and freshwater drum, sauger, northern pike,and walleye had the lowest (Table 3). Thallium (Tl) was negativelyrelated to folk length (β=−0.017 ± 0.003), and although our generallinear model detected a difference among sampling periods, this wasdriven by low sample size in the fall (n = 2; all other samples fromthe summer). Both samples collected in fall had comparatively low Tlconcentrations. There were also species differences, with the highestconcentrations in rainbow smelt, goldeye, cisco, emerald shiner, andwalleye, and the lowest in freshwater drum, lake whitefish, and north-ern pike (Table 3).
Fork length was a significant, but weak negative predictor of V con-centrations (β=−0.0002± 0.0001), and again therewere differencesamong species. The highest concentrations of V in fish muscle were in
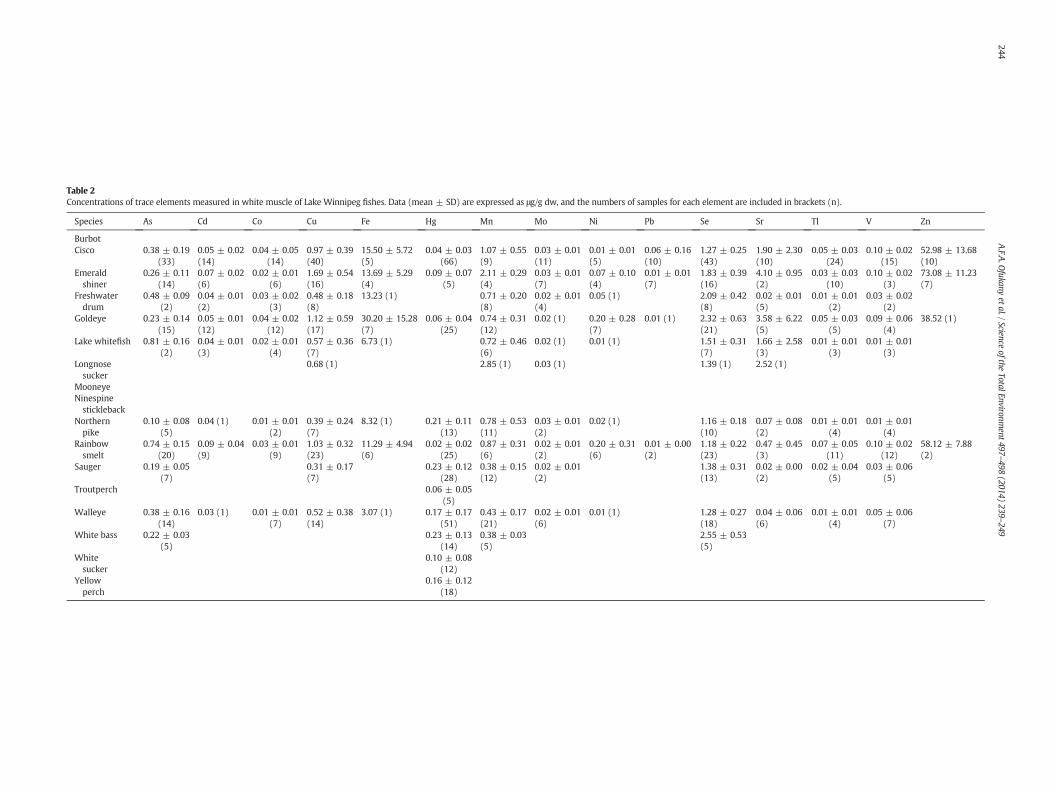
Table 2Concentrations of trace elements measured in white muscle of Lake Winnipeg fishes. Data (mean ± SD) are expressed as μg/g dw, and the numbers of samples for each element are included in brackets (n).
Species As Cd Co Cu Fe Hg Mn Mo Ni Pb Se Sr Tl V Zn
BurbotCisco 0.38 ± 0.19
(33)0.05 ± 0.02(14)
0.04 ± 0.05(14)
0.97 ± 0.39(40)
15.50 ± 5.72(5)
0.04 ± 0.03(66)
1.07 ± 0.55(9)
0.03 ± 0.01(11)
0.01 ± 0.01(5)
0.06 ± 0.16(10)
1.27 ± 0.25(43)
1.90 ± 2.30(10)
0.05 ± 0.03(24)
0.10 ± 0.02(15)
52.98 ± 13.68(10)
Emeraldshiner
0.26 ± 0.11(14)
0.07 ± 0.02(6)
0.02 ± 0.01(6)
1.69 ± 0.54(16)
13.69 ± 5.29(4)
0.09 ± 0.07(5)
2.11 ± 0.29(4)
0.03 ± 0.01(7)
0.07 ± 0.10(4)
0.01 ± 0.01(7)
1.83 ± 0.39(16)
4.10 ± 0.95(2)
0.03 ± 0.03(10)
0.10 ± 0.02(3)
73.08 ± 11.23(7)
Freshwaterdrum
0.48 ± 0.09(2)
0.04 ± 0.01(2)
0.03 ± 0.02(3)
0.48 ± 0.18(8)
13.23 (1) 0.71 ± 0.20(8)
0.02 ± 0.01(4)
0.05 (1) 2.09 ± 0.42(8)
0.02 ± 0.01(5)
0.01 ± 0.01(2)
0.03 ± 0.02(2)
Goldeye 0.23 ± 0.14(15)
0.05 ± 0.01(12)
0.04 ± 0.02(12)
1.12 ± 0.59(17)
30.20 ± 15.28(7)
0.06 ± 0.04(25)
0.74 ± 0.31(12)
0.02 (1) 0.20 ± 0.28(7)
0.01 (1) 2.32 ± 0.63(21)
3.58 ± 6.22(5)
0.05 ± 0.03(5)
0.09 ± 0.06(4)
38.52 (1)
Lake whitefish 0.81 ± 0.16(2)
0.04 ± 0.01(3)
0.02 ± 0.01(4)
0.57 ± 0.36(7)
6.73 (1) 0.72 ± 0.46(6)
0.02 (1) 0.01 (1) 1.51 ± 0.31(7)
1.66 ± 2.58(3)
0.01 ± 0.01(3)
0.01 ± 0.01(3)
Longnosesucker
0.68 (1) 2.85 (1) 0.03 (1) 1.39 (1) 2.52 (1)
MooneyeNinespinestickleback
Northernpike
0.10 ± 0.08(5)
0.04 (1) 0.01 ± 0.01(2)
0.39 ± 0.24(7)
8.32 (1) 0.21 ± 0.11(13)
0.78 ± 0.53(11)
0.03 ± 0.01(2)
0.02 (1) 1.16 ± 0.18(10)
0.07 ± 0.08(2)
0.01 ± 0.01(4)
0.01 ± 0.01(4)
Rainbowsmelt
0.74 ± 0.15(20)
0.09 ± 0.04(9)
0.03 ± 0.01(9)
1.03 ± 0.32(23)
11.29 ± 4.94(6)
0.02 ± 0.02(25)
0.87 ± 0.31(6)
0.02 ± 0.01(2)
0.20 ± 0.31(6)
0.01 ± 0.00(2)
1.18 ± 0.22(23)
0.47 ± 0.45(3)
0.07 ± 0.05(11)
0.10 ± 0.02(12)
58.12 ± 7.88(2)
Sauger 0.19 ± 0.05(7)
0.31 ± 0.17(7)
0.23 ± 0.12(28)
0.38 ± 0.15(12)
0.02 ± 0.01(2)
1.38 ± 0.31(13)
0.02 ± 0.00(2)
0.02 ± 0.04(5)
0.03 ± 0.06(5)
Troutperch 0.06 ± 0.05(5)
Walleye 0.38 ± 0.16(14)
0.03 (1) 0.01 ± 0.01(7)
0.52 ± 0.38(14)
3.07 (1) 0.17 ± 0.17(51)
0.43 ± 0.17(21)
0.02 ± 0.01(6)
0.01 (1) 1.28 ± 0.27(18)
0.04 ± 0.06(6)
0.01 ± 0.01(4)
0.05 ± 0.06(7)
White bass 0.22 ± 0.03(5)
0.23 ± 0.13(14)
0.38 ± 0.03(5)
2.55 ± 0.53(5)
Whitesucker
0.10 ± 0.08(12)
Yellowperch
0.16 ± 0.12(18)
244A.F.A
.Ofukany
etal./Scienceofthe
TotalEnvironment497
–498(2014)
239–249
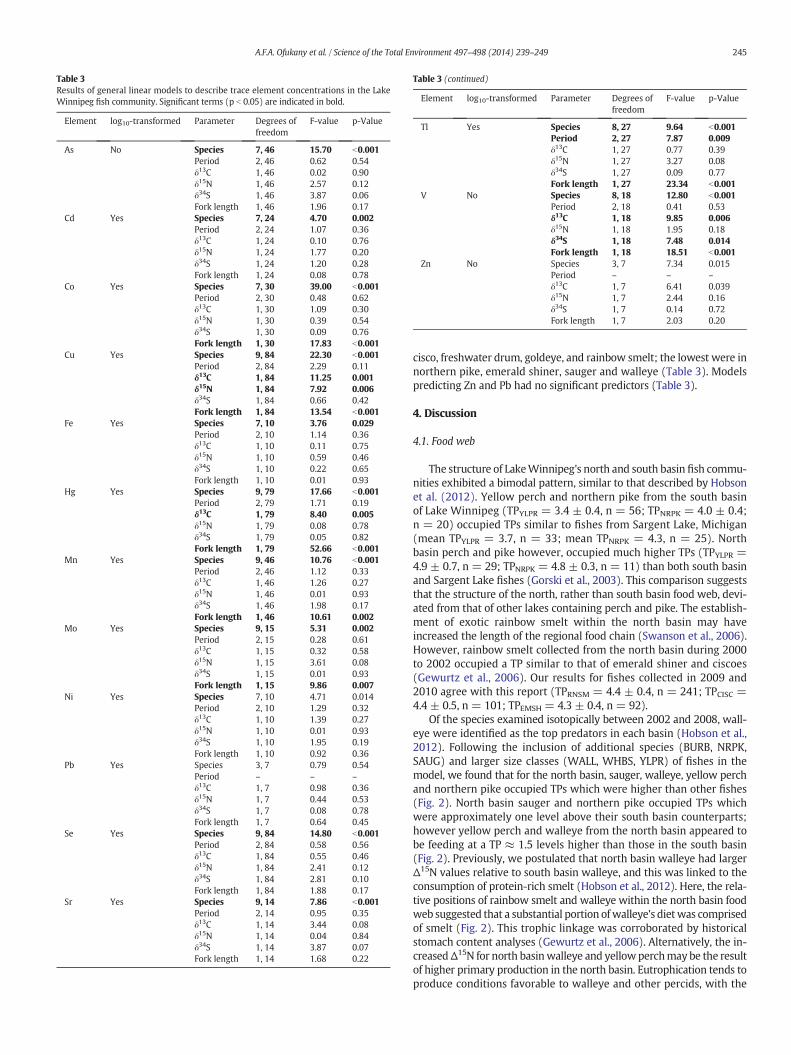
Table 3Results of general linear models to describe trace element concentrations in the LakeWinnipeg fish community. Significant terms (p b 0.05) are indicated in bold.
Element log10-transformed Parameter Degrees offreedom
F-value p-Value
As No Species 7, 46 15.70 b0.001Period 2, 46 0.62 0.54δ13C 1, 46 0.02 0.90δ15N 1, 46 2.57 0.12δ34S 1, 46 3.87 0.06Fork length 1, 46 1.96 0.17
Cd Yes Species 7, 24 4.70 0.002Period 2, 24 1.07 0.36δ13C 1, 24 0.10 0.76δ15N 1, 24 1.77 0.20δ34S 1, 24 1.20 0.28Fork length 1, 24 0.08 0.78
Co Yes Species 7, 30 39.00 b0.001Period 2, 30 0.48 0.62δ13C 1, 30 1.09 0.30δ15N 1, 30 0.39 0.54δ34S 1, 30 0.09 0.76Fork length 1, 30 17.83 b0.001
Cu Yes Species 9, 84 22.30 b0.001Period 2, 84 2.29 0.11δ13C 1, 84 11.25 0.001δ15N 1, 84 7.92 0.006δ34S 1, 84 0.66 0.42Fork length 1, 84 13.54 b0.001
Fe Yes Species 7, 10 3.76 0.029Period 2, 10 1.14 0.36δ13C 1, 10 0.11 0.75δ15N 1, 10 0.59 0.46δ34S 1, 10 0.22 0.65Fork length 1, 10 0.01 0.93
Hg Yes Species 9, 79 17.66 b0.001Period 2, 79 1.71 0.19δ13C 1, 79 8.40 0.005δ15N 1, 79 0.08 0.78δ34S 1, 79 0.05 0.82Fork length 1, 79 52.66 b0.001
Mn Yes Species 9, 46 10.76 b0.001Period 2, 46 1.12 0.33δ13C 1, 46 1.26 0.27δ15N 1, 46 0.01 0.93δ34S 1, 46 1.98 0.17Fork length 1, 46 10.61 0.002
Mo Yes Species 9, 15 5.31 0.002Period 2, 15 0.28 0.61δ13C 1, 15 0.32 0.58δ15N 1, 15 3.61 0.08δ34S 1, 15 0.01 0.93Fork length 1, 15 9.86 0.007
Ni Yes Species 7, 10 4.71 0.014Period 2, 10 1.29 0.32δ13C 1, 10 1.39 0.27δ15N 1, 10 0.01 0.93δ34S 1, 10 1.95 0.19Fork length 1, 10 0.92 0.36
Pb Yes Species 3, 7 0.79 0.54Period – – –
δ13C 1, 7 0.98 0.36δ15N 1, 7 0.44 0.53δ34S 1, 7 0.08 0.78Fork length 1, 7 0.64 0.45
Se Yes Species 9, 84 14.80 b0.001Period 2, 84 0.58 0.56δ13C 1, 84 0.55 0.46δ15N 1, 84 2.41 0.12δ34S 1, 84 2.81 0.10Fork length 1, 84 1.88 0.17
Sr Yes Species 9, 14 7.86 b0.001Period 2, 14 0.95 0.35δ13C 1, 14 3.44 0.08δ15N 1, 14 0.04 0.84δ34S 1, 14 3.87 0.07Fork length 1, 14 1.68 0.22
(continued on next page)
Table 3 (continued)
Element log10-transformed Parameter Degrees offreedom
F-value p-Value
Tl Yes Species 8, 27 9.64 b0.001Period 2, 27 7.87 0.009δ13C 1, 27 0.77 0.39δ15N 1, 27 3.27 0.08δ34S 1, 27 0.09 0.77Fork length 1, 27 23.34 b0.001
V No Species 8, 18 12.80 b0.001Period 2, 18 0.41 0.53δ13C 1, 18 9.85 0.006δ15N 1, 18 1.95 0.18δ34S 1, 18 7.48 0.014Fork length 1, 18 18.51 b0.001
Zn No Species 3, 7 7.34 0.015Period – – –
δ13C 1, 7 6.41 0.039δ15N 1, 7 2.44 0.16δ34S 1, 7 0.14 0.72Fork length 1, 7 2.03 0.20
245A.F.A. Ofukany et al. / Science of the Total Environment 497–498 (2014) 239–249
cisco, freshwater drum, goldeye, and rainbow smelt; the lowest were innorthern pike, emerald shiner, sauger and walleye (Table 3). Modelspredicting Zn and Pb had no significant predictors (Table 3).
4. Discussion
4.1. Food web
The structure of LakeWinnipeg's north and south basin fish commu-nities exhibited a bimodal pattern, similar to that described by Hobsonet al. (2012). Yellow perch and northern pike from the south basinof Lake Winnipeg (TPYLPR = 3.4 ± 0.4, n = 56; TPNRPK = 4.0 ± 0.4;n = 20) occupied TPs similar to fishes from Sargent Lake, Michigan(mean TPYLPR = 3.7, n = 33; mean TPNRPK = 4.3, n = 25). Northbasin perch and pike however, occupied much higher TPs (TPYLPR =4.9 ± 0.7, n = 29; TPNRPK = 4.8 ± 0.3, n = 11) than both south basinand Sargent Lake fishes (Gorski et al., 2003). This comparison suggeststhat the structure of the north, rather than south basin food web, devi-ated from that of other lakes containing perch and pike. The establish-ment of exotic rainbow smelt within the north basin may haveincreased the length of the regional food chain (Swanson et al., 2006).However, rainbow smelt collected from the north basin during 2000to 2002 occupied a TP similar to that of emerald shiner and ciscoes(Gewurtz et al., 2006). Our results for fishes collected in 2009 and2010 agree with this report (TPRNSM = 4.4 ± 0.4, n = 241; TPCISC =4.4 ± 0.5, n = 101; TPEMSH = 4.3 ± 0.4, n = 92).
Of the species examined isotopically between 2002 and 2008, wall-eye were identified as the top predators in each basin (Hobson et al.,2012). Following the inclusion of additional species (BURB, NRPK,SAUG) and larger size classes (WALL, WHBS, YLPR) of fishes in themodel, we found that for the north basin, sauger, walleye, yellow perchand northern pike occupied TPs which were higher than other fishes(Fig. 2). North basin sauger and northern pike occupied TPs whichwere approximately one level above their south basin counterparts;however yellow perch and walleye from the north basin appeared tobe feeding at a TP ≈ 1.5 levels higher than those in the south basin(Fig. 2). Previously, we postulated that north basin walleye had largerΔ15N values relative to south basin walleye, and this was linked to theconsumption of protein-rich smelt (Hobson et al., 2012). Here, the rela-tive positions of rainbow smelt and walleye within the north basin foodweb suggested that a substantial portion ofwalleye's dietwas comprisedof smelt (Fig. 2). This trophic linkage was corroborated by historicalstomach content analyses (Gewurtz et al., 2006). Alternatively, the in-creasedΔ15N for north basinwalleye and yellowperchmay be the resultof higher primary production in the north basin. Eutrophication tends toproduce conditions favorable to walleye and other percids, with the
246 A.F.A. Ofukany et al. / Science of the Total Environment 497–498 (2014) 239–249
increased availability and quality of dietary items generally leading togreater nitrogen isotopic discrimination (Aberle and Malzahn, 2007;Leach et al., 1977). The lack of a similar effect in north basin sauger islikely because environmental conditions within the south, rather thannorth basin, are more favorable for this species (Johnston et al., 2012).
In lakes of northwestern Ontario, pelagic consumers generally haveδ13C values between−38 and−26‰, and consumers classified as char-acteristically benthivorous tend to have δ13C values in the range of−32to−16‰ (France, 1995). Although fishes from the north and south ba-sins of Lake Winnipeg were within the increasingly benthic range ofvalues (δ13C = −24 to −16‰; Fig. 2) identified for Ontario lakes, theterms “pelagic” and “benthic” were used in the present study to referto relative position along a δ13C gradient.
The greatest relative dependence on pelagic (low δ13C) versus ben-thic (high δ13C) energy sources was observed for white bass and emer-ald shiner in the north basin (Fig. 2). The results for white bass werecorroborated by our earlier isotopic survey of Lake Winnipeg fishes(2002 to 2008), wherein white bass (FL b 350 mm) collected from thenorth basin had a relatively pelagic feeding strategy (Hobson et al.,2012). The fact that emerald shiner were among fishes with the lowestδ13C values in each basin was also not surprising, as fish survey datafrom the 1990s identified it as an important pelagic species within thelake (Stewart and Watkinson, 2004). The isotopic data for south basinburbot was also similar to historical dietary observations, and indicatedthat the diet of this group has changed very little over the past 60 years.In the early 1950s, Hewson (1955) conducted controlled diet studies onburbot from Lake Winnipeg's south basin and found that ciscoes werethe species' preferred prey. The isotope values here match these earlierfindings, given that burbot occupy a TP one step (Δ15N = 3.4‰) aboveciscoes, δ13C values for burbot muscle are greater than mean values forciscoes by≈ 1‰, and the δ34S values of the two species are similar (Δ34S≤ 0.5‰).
In recent decades, the density of benthic invertebrates available tobenthivores like troutperch, lakewhitefish and suckers in LakeWinnipeghas increased substantially (Environment Canada and Manitoba WaterStewardship, 2011). This greater abundance of benthic fauna wasreflected in the δ34S values of white sucker. White sucker feed
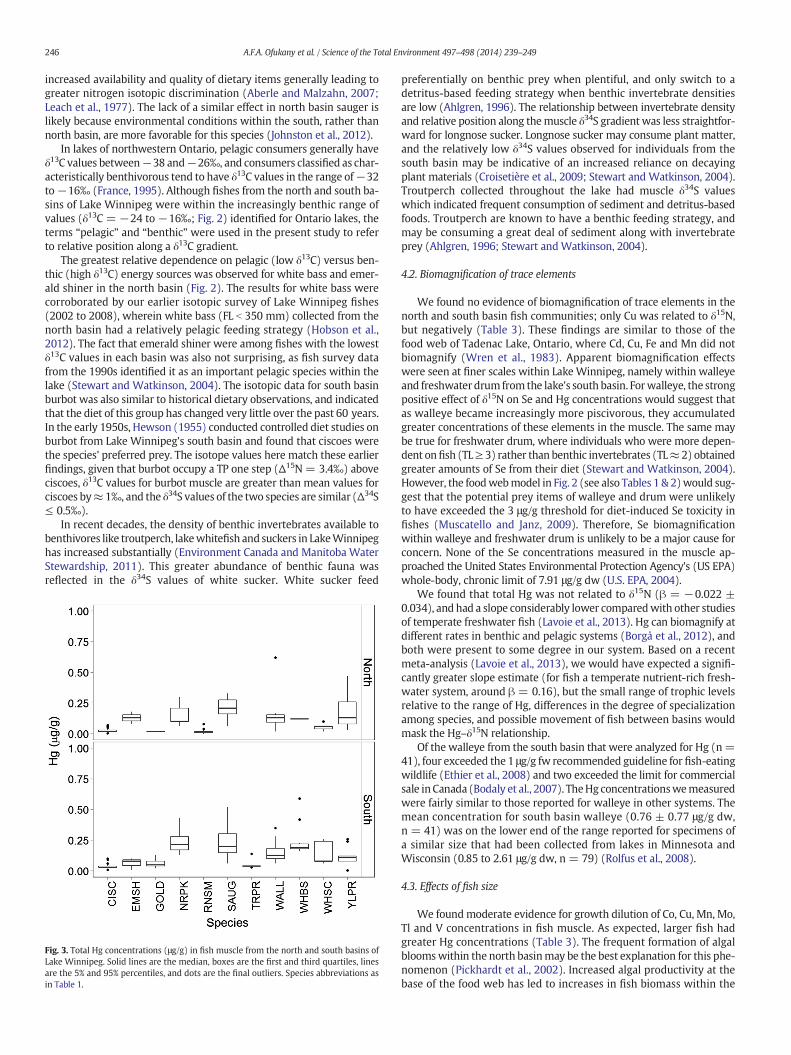
Fig. 3. Total Hg concentrations (μg/g) in fish muscle from the north and south basins ofLake Winnipeg. Solid lines are the median, boxes are the first and third quartiles, linesare the 5% and 95% percentiles, and dots are the final outliers. Species abbreviations asin Table 1.
preferentially on benthic prey when plentiful, and only switch to adetritus-based feeding strategy when benthic invertebrate densitiesare low (Ahlgren, 1996). The relationship between invertebrate densityand relative position along themuscle δ34S gradient was less straightfor-ward for longnose sucker. Longnose sucker may consume plant matter,and the relatively low δ34S values observed for individuals from thesouth basin may be indicative of an increased reliance on decayingplant materials (Croisetière et al., 2009; Stewart and Watkinson, 2004).Troutperch collected throughout the lake had muscle δ34S valueswhich indicated frequent consumption of sediment and detritus-basedfoods. Troutperch are known to have a benthic feeding strategy, andmay be consuming a great deal of sediment along with invertebrateprey (Ahlgren, 1996; Stewart andWatkinson, 2004).
4.2. Biomagnification of trace elements
We found no evidence of biomagnification of trace elements in thenorth and south basin fish communities; only Cu was related to δ15N,but negatively (Table 3). These findings are similar to those of thefood web of Tadenac Lake, Ontario, where Cd, Cu, Fe and Mn did notbiomagnify (Wren et al., 1983). Apparent biomagnification effectswere seen at finer scales within LakeWinnipeg, namely within walleyeand freshwater drum from the lake's south basin. Forwalleye, the strongpositive effect of δ15N on Se and Hg concentrations would suggest thatas walleye became increasingly more piscivorous, they accumulatedgreater concentrations of these elements in the muscle. The same maybe true for freshwater drum, where individuals who were more depen-dent onfish (TL≥ 3) rather than benthic invertebrates (TL≈ 2) obtainedgreater amounts of Se from their diet (Stewart and Watkinson, 2004).However, the foodwebmodel in Fig. 2 (see also Tables 1 & 2)would sug-gest that the potential prey items of walleye and drum were unlikelyto have exceeded the 3 μg/g threshold for diet-induced Se toxicity infishes (Muscatello and Janz, 2009). Therefore, Se biomagnificationwithin walleye and freshwater drum is unlikely to be a major cause forconcern. None of the Se concentrations measured in the muscle ap-proached the United States Environmental Protection Agency's (US EPA)whole-body, chronic limit of 7.91 μg/g dw (U.S. EPA, 2004).
We found that total Hg was not related to δ15N (β = −0.022 ±0.034), and had a slope considerably lower comparedwith other studiesof temperate freshwater fish (Lavoie et al., 2013). Hg can biomagnify atdifferent rates in benthic and pelagic systems (Borgå et al., 2012), andboth were present to some degree in our system. Based on a recentmeta-analysis (Lavoie et al., 2013), we would have expected a signifi-cantly greater slope estimate (for fish a temperate nutrient-rich fresh-water system, around β = 0.16), but the small range of trophic levelsrelative to the range of Hg, differences in the degree of specializationamong species, and possible movement of fish between basins wouldmask the Hg–δ15N relationship.
Of the walleye from the south basin that were analyzed for Hg (n=41), four exceeded the 1 μg/g fw recommended guideline for fish-eatingwildlife (Ethier et al., 2008) and two exceeded the limit for commercialsale in Canada (Bodaly et al., 2007). TheHg concentrationswemeasuredwere fairly similar to those reported for walleye in other systems. Themean concentration for south basin walleye (0.76 ± 0.77 μg/g dw,n = 41) was on the lower end of the range reported for specimens ofa similar size that had been collected from lakes in Minnesota andWisconsin (0.85 to 2.61 μg/g dw, n = 79) (Rolfus et al., 2008).
4.3. Effects of fish size
We foundmoderate evidence for growth dilution of Co, Cu, Mn, Mo,Tl and V concentrations in fish muscle. As expected, larger fish hadgreater Hg concentrations (Table 3). The frequent formation of algalbloomswithin the north basinmay be the best explanation for this phe-nomenon (Pickhardt et al., 2002). Increased algal productivity at thebase of the food web has led to increases in fish biomass within the
247A.F.A. Ofukany et al. / Science of the Total Environment 497–498 (2014) 239–249
north basin (Environment Canada and Manitoba Water Stewardship,2011). If the concentrations of trace elements available for uptake byforage fisheswere to remain fairly constant, the increase in fish biomasswould ultimately decrease the amounts of those elements per unit ofgrowth in fishes (Gewurtz et al., 2006; Swanson et al., 2006). Growthdilution may be more evident in rapidly-growing forage fishes versuslarger, slower growing organisms, since the duration of exposure andaccumulation per unit of increased length or weight is much lower infast-growing species (Newman and Unger, 2003).
4.4. Identifying sources of trace elements in diet
The influence of δ34S and δ13C on trace element concentrations infish muscle was largely dependent on species. Hg concentrationstended to increase with increasing dependence on benthic foods (highδ13C), while Cu and V increased with decreasing δ13C (more pelagicforaging). Yellow perch collected from lakes near Clyde Forks, Ontariohad muscle Hg concentrations which were negatively correlated withδ13C (Ethier et al., 2008), while rainbow smelt and pike which werefeeding near the sediment in Tadenac Lake, Ontario, accumulated greaterconcentrations of metals in tissues than relatively pelagic organisms(Wren et al., 1983). The mean Hg concentration for northern pike col-lected from Tadenac Lake was 4.04 μg/g dw (n = 20), assuming themoisture content of pike muscle was 75% (Gorski et al., 2003; Wrenet al., 1983). This is substantially higher than themean Hg concentrationfor pike from LakeWinnipeg's south basin (1.16± 0.50 μg/g dw, n= 7).
It is important to note that there were some exceptions to thecommunity-wide generalizations mentioned above for the south basinfishes. For example, goldeye that fed toward the benthic end of theδ13C spectrum had lower Cu and greaterMn concentrations in themus-cle than would be expected, given the community-level model. Southbasin goldeye were more similar to north basin fishes in this regard,since Cu concentrations in north basin emerald shiner, lake whitefish,walleye and northern pike tended to be smaller in individuals thatobtained dietary energy from the near the sediment, rather than fromthe water-column. However, rainbow smelt and yellow perch fromthe same basin tended to exhibit greater concentrations of Cu in themuscle with increased reliance on benthic carbon sources.
4.5. The concentration–diet disconnect
Concentrations ofmany elementswere not related to δ15N, δ13C, δ34S,or fish length. For example, we expected to see a general decrease in Cdconcentrations with increasing TP (Campbell et al., 2005). Despite theapparent disconnect between Cd and TP, concentrationswere sufficient-ly low so as not to pose a significant risk to human consumers. The EU'smaximum level (ML) of Cd allowed in commercial fishes is 0.05 μg/g FW(Ciardullo et al., 2008). None of the concentrations measured in fishmuscle exceeded this limit (Table 2), and the maximum concentration,which was measured in a north basin rainbow smelt, was equal to0.17 μg/g dw, or approximately 0.03 μg/g fw.
Themean Hg concentration in themuscle of northern pike (mean±SD = 0.69 ± 0.43 μg/g dw, n = 5) was approximately one-fifth that ofnorthern pike collected from Tadenac Lake, Ontario (Wren et al., 1983),and slightly below the range of concentrations reported for northernpike collected from 17 lakes throughout Minnesota and Wisconsin(0.79 to 5.15 μg/g dw, n = 401) (Rolfus et al., 2008). Selenium concen-trations in the muscle of north basin northern pike (Table 2) were wellbelow thewhole-body guidelines for fish in the United States (U.S. EPA,2004). However, Se may be a potential problem for white bass popula-tions within Lake Winnipeg. Of the n = 3 north basin white bass forwhich there were Se concentration data, two (4.43 and 5.61 μg/g dw)approached the US EPA threshold of 5.85 μg/g dw, above which furthermonitoring is recommended (U.S. EPA, 2004), though drawing defini-tive conclusions is not possible with such a small sample size. A thirdspecimen had a muscle-Se concentration (9.62 μg/g dw) which
exceeded the US EPA's 7.91 μg/g dw draft criterion (U.S. EPA, 2004).Unfortunately, due to the small Se sample size for north basin whitebass, we were unable to evaluate any potential food web models andidentify any diet-related factors which could have contributed to theelevated Se concentrations we observed. Further monitoring of Se con-centrations in Lake Winnipeg white bass is recommended.
An important consideration when comparing stable isotope valuesand elemental concentrations in tissues is their relative periods of integra-tion of information. For the comparison to be informative, the stable iso-topes and trace elements must reflect the same processes (e.g., dietaryintake) over the same period (Bond, 2010). A direct comparison alsoassumes negligible (or similar) routing of particular isotopes or elementsto different macromolecules (e.g., carbohydrates vs. lipids) (Boecklenet al., 2011; Voigt et al., 2008; Wolf et al., 2009). Stable isotope valuesin fish muscle integrate diet over roughly 75–100 days prior to sampling(e.g., Buchheister and Latour, 2010). However, Hg and other bioaccumu-lating trace elements tend to increase with age (and size) (Qian et al.,2001; Somers and Jackson, 1993), especially when older fish feed onprey with higher Hg concentrations; accumulation is ultimately relatedto metabolism and energetics (Trudel and Rasmussen, 2006). Whileusing stable isotope values to predict trace element concentrations inaquatic systems is a common practice (Jardine et al., 2006; Lavoie et al.,2013), recent evidence suggests that residency of trace elements in fishmuscle, and Hg in particular, could bemuch longer than C and N typicallyused in isotopic assays (Madenjian et al., 2012; Van Walleghem et al.,2007, 2013). Alternatively, if the assayed tissue provides isotopic informa-tion consistent with long periods of integration (i.e. in cases where dietor location of feeding changes little over an annual cycle), then the iso-topic information would be an appropriate indicator of those processes(e.g. biomagnification) influencing trace element dynamics.
5. Conclusions
This study is thefirst extensive investigation into the influence of foodweb structure and diet on Hg and other trace elements measured in themuscle of Lake Winnipeg fishes. Isotopic food web data (δ15N, δ13C andδ34S) indicated that fishes in the lake's north basin generally had lowerδ13C and δ34S values, but greater δ15N or TP values, than fishes from thesouth basin, similar to our 2002–2008 study (Hobson et al., 2012) andfurther validate our earlier suggestion that the north and south basinsof Lake Winnipeg be considered as separate systems when examiningfood web structure. In terms of trace element trophodynamics, specieswas often the strongest modulator of concentrations at the community-wide level, and concentrationswere rarely related to trophic parameters.
Isotopic studies of the trophic interactions among organisms in LakeWinnipeg's north and south basinsmay serve as a valuable tool formon-itoring effects to the fish community and other high-level consumers(e.g., avian and mammalian piscivores) that may result from changesin nutrient loading and sources, introduction of invasive species, andclimate change.
Although trace element concentrations in fish tissues collected fromLakeWinnipeg did not appear to be related to trophic parameters, ongo-ing, concurrent sampling of fish for stable isotopic studies and metalsanalysismay be informative, given larger samples sizes are used. The ex-tent of the commercial fishery on LakeWinnipeg, coupled with the lackof information regarding sources, accumulation and biomagnification ofmetals in fish tissues, emphasizes the ongoing need to monitor thehealth of the Lake Winnipeg fish community.
Supplementary data to this article can be found online at http://dx.doi.org/10.1016/j.scitotenv.2014.07.125.
Acknowledgments
Funding for this study was provided through the Lake WinnipegBasin Initiative and Environment Canada (LIW, KAH). We thank thecrew of the MV Namao and the Lake Winnipeg Research Foundation
248 A.F.A. Ofukany et al. / Science of the Total Environment 497–498 (2014) 239–249
for facilitating and assisting with the trawls and sampling. Commentsfrom two anonymous reviewers improved this manuscript.
References
Aberle N, Malzahn AM. Interspecific and nutrient-dependent variations in stable isotopefractionation: experimental studies simulating pelagic multitrophic systems.Oecologia 2007;154:291–303.
Ahlgren MO. Selective ingestion of detritus by a north temperate omnivorous fish, thejuvenile white sucker, Catostomus commersonii. Environ Biol Fish 1996;46:375–81.
Baker RF, Blanchfield PJ, Paterson MJ, Flett RJ, Wesson L. Evaluation of nonlethal methodsfor the analysis of mercury in fish tissue. Transactions of the American Fisheries Soci-ety 2004;133:568–76.
Bligh EG, DyerWJ. A rapid method of total lipid extraction and purification. Can J BiochemPhysiol 1959;37:911–7.
Bocking S. Fishing the inland seas: Great Lakes research, fisheries management, and envi-ronmental policy in Ontario. Environ Hist 1997;2:52–73.
Bodaly RA, Jansen WA, Majewski AR, Fudge RJP, Strange NE, Derkson AJ, et al.Postimpoundment time course of increased mercury concentrations in fish in hydro-electric reservoirs of northernManitoba, Canada. Arch Environ Contam Toxicol 2007;53:379–89.
Boecklen WJ, Yarnes CT, Cook BA, James AC. On the use of stable isotopes in trophicecology. Annu Rev Ecol Evol Syst 2011;42:411–40.
Bond AL. Relationships between stable isotopes and metal contaminants in feathers arespurious and biologically uninformative. Environ Pollut 2010;158:1182–4.
Borgå K, Kidd KA, Muir DCG, Berglund O, Conder JM, Gobas FAPC, et al. Trophic magnifica-tion factors: considerations of ecology, ecosystems, and study design. Integr EnvironManag Assess 2012;8:64–84.
Brumbaugh WG, Schmitt CJ, May TW. Concentrations of cadmium, lead and zinc in fishfrommining-influencedwaters of Northeastern Oklahoma: sampling of blood, carcass,and liver for aquatic biomonitoring. Arch Environ Contam Toxicol 2005;49:76–88.
Buchheister A, Latour RJ. Turnover and fractionation of carbon and nitrogen stableisotopes in tissues of a migratory coastal predator, summer flounder (Paralichthysdentatus). Can J Fish Aquat Sci 2010;67:445–61.
Burgess NM, Hobson KA. Bioaccumulation of mercury in yellow perch and common loonsin relation to lake chemistry in Atlantic Canada. Hydrobiologia 2006;567:275–82.
Campbell LM, Norstrom RJ, Hobson KA, Muir DCG, Backus S, Fisk AT. Mercury and othertrace elements in a pelagic Arctic marine food web (Northwater Polynya, Baffin Bay).Sci Total Environ 2005;351–352:247–63.
Ciardullo S, Aureli F, Coni E, Guandalini E, Iosi F, Raggi A, et al. Bioaccumulation potentialof dietary arsenic, cadmium, lead, mercury, and selenium in organs and tissues ofrainbow trout (Oncorhynchus mykiss) as a function of fish growth. J Agric FoodChem 2008;56:2442–51.
Croisetière L, Hare L, Tessier A, Cabana G. Sulphur stable isotopes can distinguish trophicdependence on sediments and plankton in boreal lakes. Freshw Biol 2009;54:1006–15.
Cucherousset J, Bouletrau S,Martino A, Roussel J-M, Santoul F. Using stable isotope analysisto determine the ecological effects of non-native fishes. Fish Manag Ecol 2012;19:111–9.
Environment Canada, Manitoba Water Stewardship. State of Lake Winnipeg: 1999 to2007 technical report. Winnipeg: Public Works & Government Services of Canada;2011. p. 209.
Ethier ALM, Scheuhammer AM, Bond DE. Correlates of mercury in fish from lakes nearClyde Forks, Ontario, Canada. Environ Pollut 2008;154:89–97.
France RL. Differentiation between littoral and pelagic foodwebs in lakes using stable carbonisotopes. Limnol Oceanogr 1995;40:1310–3.
Fry B. Food web structure on Georges Bank from stable C, N, and S isotopic compositions.Limnol Oceanogr 1988;33:1182–90.
Gewurtz S, Gandhi N, Stern GA, FranzinWG, Rosenberg B, DiamondML. Dynamics of PCBsin the foodweb of Lake Winnipeg. J Great Lakes Res 2006;32:712–27.
Gorski PR, Cleckner LB, Hurley JP, Sierszen ME, Armstrong DE. Factors affecting enhancedmercury bioaccumulation in inland lakes of Isle Royale National Park, USA. Sci TotalEnviron 2003;304:327–48.
Sexauer Gustin M, Saito L, Peacock M. Anthropogenic impacts on mercury concentrationsand nitrogen and carbon isotope ratios in fish muscle tissue of the Truckee Riverwatershed, Nevada, USA. Sci Total Environ 2005;347:282–94.
Hebert CE, Arts MT, Weseloh DVC. Ecological tracers can quantify food web structure andchange. Environ Sci Technol 2006;40:5618–23.
Hecky RE, Hesslein RH. Contributions of benthic algae to lake food webs as revealed bystable isotope analysis. J N Am Benthol Soc 1995;14:631–53.
Hewson LC. Age, maturity, spawning, and food of burbot, Lota lota, in Lake Winnipeg.J Fish Res Board Can 1955;12:930–40.
Hobson KA, Ofukany AFA, Soto DX, Wassenaar LI. An isotopic baseline (δ13C, δ15N) forfishes of Lake Winnipeg: implications for investigating impacts of eutrophicationand invasive species. J Great Lakes Res 2012;38:58–65.
Ikemoto T, Tu NPC, Okuda N, Iwata A, Omori K, Tanabe S, et al. Biomagnification of traceelements in the aquatic food web in the Mekong Delta, South Vietnam using stablecarbon and nitrogen isotope analysis. Arch Environ Contam Toxicol 2008;54:504–15.
Jardine TD, Kidd KA, Fisk AT. Applications, considerations, and sources of uncertaintywhen using stable isotope analysis in ecotoxicology. Environ Sci Technol 2006;40:7501–11.
Johnston TA, LysackW, LeggettWC. Abundance, growth, and life history characteristics ofsympatric walleye (Sander vitreus) and sauger (Sander canadensis) in Lake Winnipeg,Manitoba. J Great Lakes Res 2012;38:35–46.
Kelly JF. Stable isotopes of carbon and nitrogen in the study of avian and mammaliantrophic ecology. Can J Zool 2000;78:1–27.
Lavoie RA, Jardine TD, ChumchalMM, KiddKA, Campbell LM. Biomagnification ofmercuryin aquatic food webs: a worldwide meta-analysis. Environ Sci Technol 2013;47:13385–94.
Law K, Halldorson T, Danell R, Stern G, Gewurtz S, Alaee M, et al. Bioaccumulation andtrophic transfer of some brominated flame retardants in a Lake Winnipeg (Canada)food web. Environ Toxicol Chem 2006;25:2177–86.
Leach JH, Johnson MG, Hartmann J, Nümann W, Entz B. Responses of percid fishes andtheir habitats to eutrophication. J Fish Res Board Can 1977;34:1964–71.
Lumb CE, Franzin WG, Watkinson DA. Temporal and spatial patterns in pelagic trawl fishcatches in Lake Winnipeg. J Great Lakes Res 2012;38:14–25.
Madenjian CP, David SR, Krabbenhoft DP. Trophic transfer efficiency of methylmercuryand inorganic mercury to lake trout Salvelinus namaycush from its prey. Arch EnvironContam Toxicol 2012;63:262–9.
Manitoba Conservation and Water Stewardship. Adult zebra mussels found in LakeWinnipeg. Media release, 17 October 2013 http://news.gov.mb.ca/news/index.html?item=19256, 2013. [Winnipeg, MB].
Munawar M, Munawar IF, Mandrak NE, Fitzpatrick M, Dermott R, Leach J. An overview ofthe impact of non-indigenous species on the food web integrity of North AmericanGreat Lakes: Lake Erie example. Aquat Ecosyst Health Manag 2005;8:375–95.
Muscatello JR, Janz DM. Selenium accumulation in aquatic biota downstream of a uraniummining and milling operation. Sci Total Environ 2009;407:1318–25.
Newman MC, Unger MA. Fundamentals of ecotoxicology. 2nd ed. Boca Raton: LewisPublishers; 2003.
Ofukany AFA. Stable isotopes as intrinsic markers of contaminant dynamics in the LakeWinnipeg food web [M.Sc. Thesis] Saskatoon: University of Saskatchewan; 2012.
Ofukany AFA, Hobson KA, Wassenaar LI. Connecting breeding and wintering habitatsof migratory piscivorous birds: implications for tracking contaminants (Hg) usingmultiple stable isotopes. Environ Sci Technol 2012;46:3263–72.
Phibbs J, Wiramanaden CIE, Hauck D, Pickering IJ, Liber K, Janz DM. Selenium uptake andspeciation in wild and caged fish downstream of a metal mining and millingdischarge. Ecotoxicol Environ Saf 2011;74:1139–50.
Pickhardt PC, Folt CL, Chen CY, Klaue B, Blum JD. Algal blooms reduce the uptake of toxicmethylmercury in freshwater food webs. Proc Natl Acad Sci U S A 2002;99:4419–23.
Pip E. Littoralmollusc communities andwater quality in southern LakeWinnipeg, Manitoba,Canada. Biodivers Conserv 2006;15:3637–52.
Post DM. Using stable isotopes to estimate trophic position: models, methods andassumptions. Ecology 2002;83:703–18.
Pruell RJ, Taplin BK, Cicchelli K. Stable isotope ratios in archived striped bass scalessuggest changes in trophic structure. Fish Manag Ecol 2003;10:329–36.
Qian SS,Warren-HicksW, Keating J, Moore DRJ, Teed S. A predictivemodel of fishmercurytissue concentrations for the southeastern United States. Environ Sci Technol 2001;35:941–7.
R Development Core Team. R: a language and environment for statistical computing. Ver-sion 3.0.2 [computer program]. Vienna, Austria: R Foundation for Statistical Comput-ing; 2013.
Rolfus KR, Sandheinrich MB, Wiener JG, Bailey SW, Thoreson KA, Hammerschmidt CR.Analysis of fin clips as a nonlethal method for monitoring mercury in fish. EnvironSci Technol 2008;42:871–7.
Schindler DW. Detecting ecosystem responses to anthropogenic stress. Can J Fish AquatSci 1987;44:6–25.
Shapiro SS, Wilk MB. An analysis of variance test for normality (complete samples).Biometrika 1965;52:591–611.
Sharpley AN, Chapra SC, Wedepohl R, Sims JT, Daniel TC, Reddy KR. Managing agriculturalphosphorus for protection of surface waters: issues and options. J Environ Qual 1994;23:437–51.
Somers KM, Jackson DA. Adjustingmercury concentration for fish-size covariation: a mul-tivariate alternative to bivariate regression. Can J Fish Aquat Sci 1993;50:2388–96.
Sotiropoulos MA, TonnWA, Wassenaar LI. Effects of lipid extraction on stable carbon andnitrogen isotope analyses of fish tissues: potential consequences for food web studies.Ecol Freshw Fish 2004;15:155–69.
Stewart KM,Watkinson DA. The freshwater fishes of Manitoba. Winnipeg, MB: Universityof Manitoba Press; 2004.
Stewart AR, Stern GA, LockhartWL, Kidd KA, Salki AG, Stainton MP, et al. Assessing trendsin organochlorine concentrations in LakeWinnipeg fish following the 1997 Red Riverflood. J Great Lakes Res 2003;29:332–54.
Suchy KD, Salki AG, Hann BJ. Investigating the invasion of the nonindigenous zooplankter,Eubosmina coregoni, in Lake Winnipeg, Manitoba, Canada. J Great Lakes Res 2010;36:159–66.
Swanson HK, Johnston TA, Schindler DW, Bodaly RA, Whittle DM. Mercury bioaccumula-tion in forage fish communities invaded by rainbow smelt (Osmerus mordax). EnvironSci Technol 2006;40:1439–46.
Tomy GT, Pleskach K, Ismail N, Whittle DM, Helm PA, Sverko E, et al. Isomers ofdechlorane plus in Lake Winnipeg and Lake Ontario food webs. Environ Sci Technol2007;41:2249–54.
Trudel M, Rasmussen JB. Bioenergetics and mercury dynamics in fish: a modellingperspective. Can J Fish Aquat Sci 2006;63:1890–902.
U.S. EPA. Method 3052: Microwave assisted acid digestion of siliceous and organicallybased matrices. Washington, DC: United States Environmental Protection Agency;1996.
U.S. EPA. Draft aquatic life water quality criteria for selenium. EPA-822-D-04-001.Washington, DC:United States Environmental ProtectionAgency, Office ofWater, Officeof Science and Technology; 2004. p. 82.
Van Walleghem JLA, Blanchfield PJ, Hintelmann H. Elimination of mercury by yellowperch in the wild. Environ Sci Technol 2007;41:5895–901.

249A.F.A. Ofukany et al. / Science of the Total Environment 497–498 (2014) 239–249
VanWalleghem JLA, Blanchfield PJ, Hrenchuk LE, HintelmannH. Mercury elimination by atop predator, Esox lucius. Environ Sci Technol 2013:4147–54.
Vander Zanden MJ, Vadeboncoeur Y, Diebel MW, Jeppesen E. Primary consumer stablenitrogen isotopes as indicators of nutrient source. Environ Sci Technol 2005;39:7509–15.
Voigt CC, Rex K, Michener RH, Speakman JR. Nutrient routing in omnivorous animalstracked by stable carbon isotopes in tissue and exhaled breath. Oecologia 2008;157:31–40.
WaylandM, Hobson KA. Stable carbon, nitrogen, and sulfur isotope ratios in riparian foodwebs on rivers receiving sewage and pulp-mill effluents. Can J Zool 2001;79:5–15.
Wolf N, Carleton SA, Martínez del Rio C. Ten years of experimental animal isotopicecology. Funct Ecol 2009;23:17–26.
Wren CD, MacCrimmon HR, Loescher BR. Examination of bioaccumulation andbiomagnification of metals in a Precambrian Shield lake. Water Air Soil Pollut 1983;19:277–91.
Zeng T, Arnold WA. Clustering chlorine reactivity of haloacetic acid precursors in inlandlakes. Environ Sci Technol 2014;48:139–48.
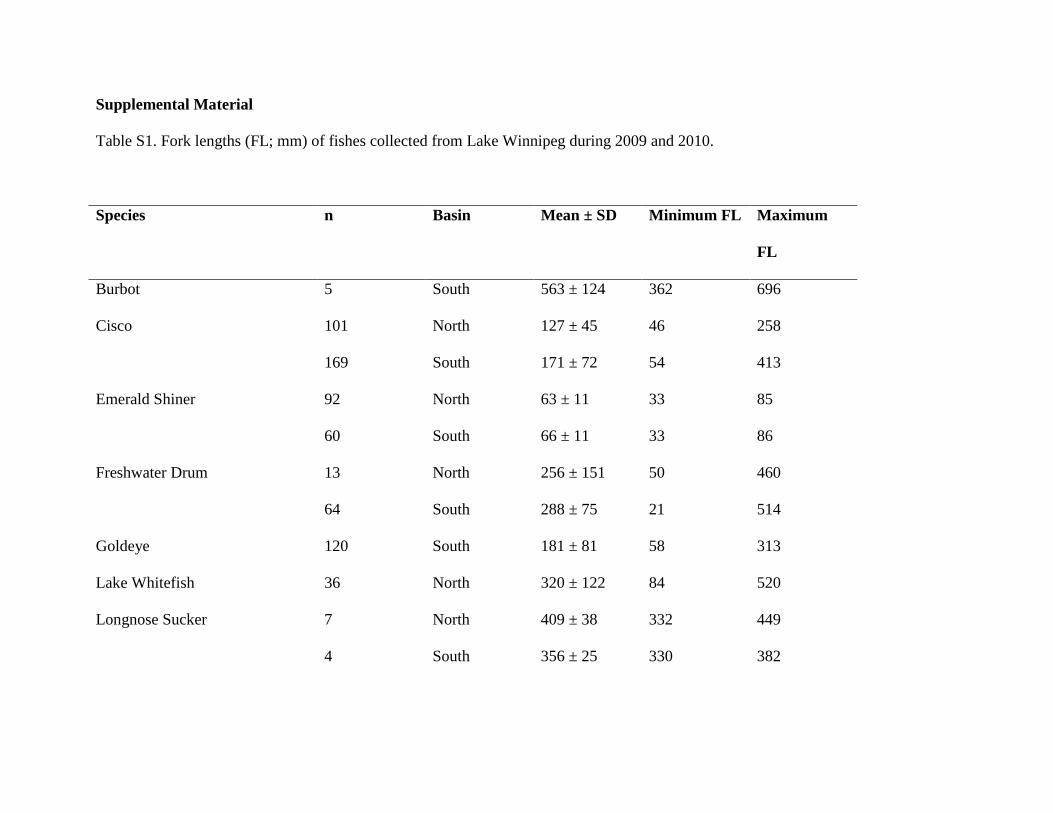
Supplemental Material
Table S1. Fork lengths (FL; mm) of fishes collected from Lake Winnipeg during 2009 and 2010.
Species n Basin Mean ± SD Minimum FL Maximum
FL
Burbot 5 South 563 ± 124 362 696
Cisco 101 North 127 ± 45 46 258
169 South 171 ± 72 54 413
Emerald Shiner 92 North 63 ± 11 33 85
60 South 66 ± 11 33 86
Freshwater Drum 13 North 256 ± 151 50 460
64 South 288 ± 75 21 514
Goldeye 120 South 181 ± 81 58 313
Lake Whitefish 36 North 320 ± 122 84 520
Longnose Sucker 7 North 409 ± 38 332 449
4 South 356 ± 25 330 382
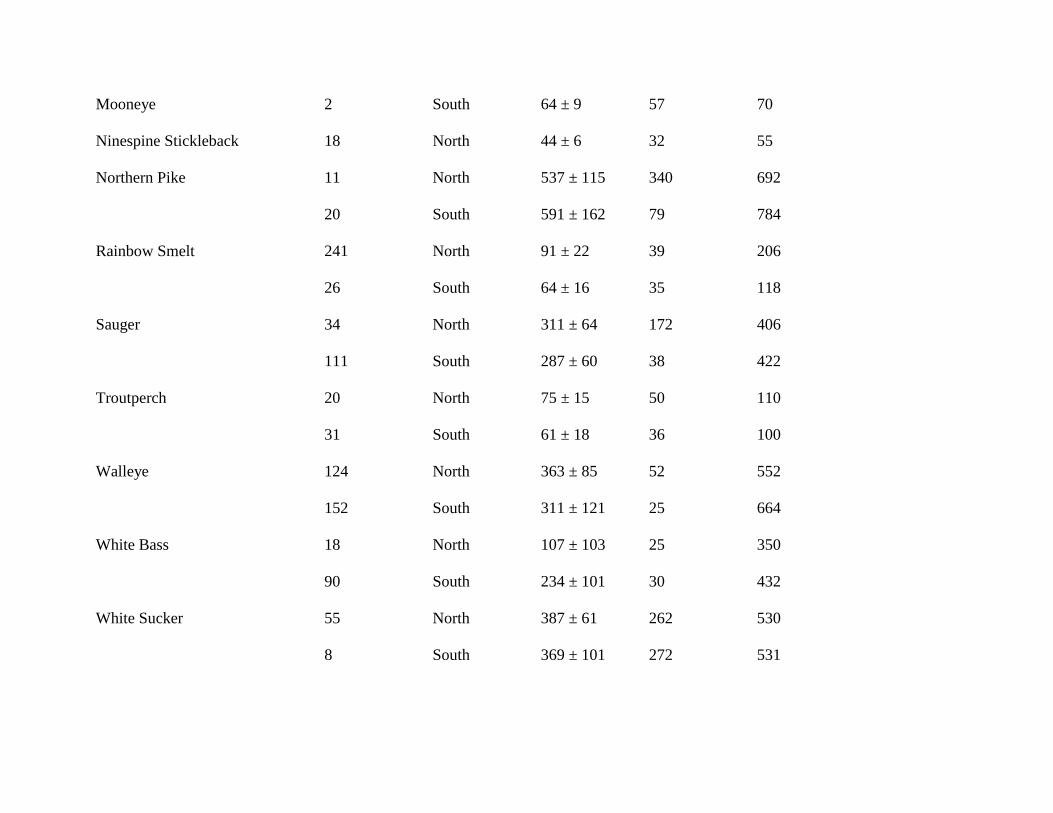
Mooneye 2 South 64 ± 9 57 70
Ninespine Stickleback 18 North 44 ± 6 32 55
Northern Pike 11 North 537 ± 115 340 692
20 South 591 ± 162 79 784
Rainbow Smelt 241 North 91 ± 22 39 206
26 South 64 ± 16 35 118
Sauger 34 North 311 ± 64 172 406
111 South 287 ± 60 38 422
Troutperch 20 North 75 ± 15 50 110
31 South 61 ± 18 36 100
Walleye 124 North 363 ± 85 52 552
152 South 311 ± 121 25 664
White Bass 18 North 107 ± 103 25 350
90 South 234 ± 101 30 432
White Sucker 55 North 387 ± 61 262 530
8 South 369 ± 101 272 531
Yellow Perch 29 North 199 ± 77 31 304
56 South 154 ± 72 37 256