Satellite Remote Sensing (Kasatochi eruption)
17
Service de Chimie Quantique et Photophysique Université Libre de Bruxelles (ULB) Research activity from January to June 2009 Federico Karagulian
-
Upload
federico-karagulian -
Category
Education
-
view
279 -
download
4
Transcript of Satellite Remote Sensing (Kasatochi eruption)
Service de Chimie Quantique et PhotophysiqueUniversité Libre de Bruxelles (ULB)
Research activity from January to June 2009
Federico Karagulian
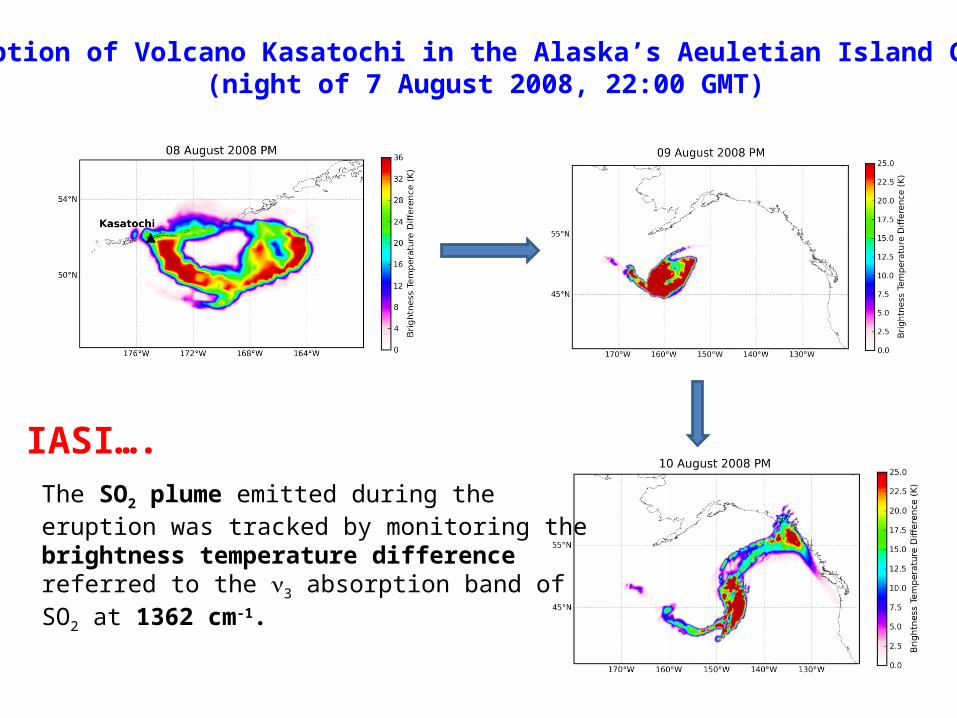
Eruption of Volcano Kasatochi in the Alaska’s Aeuletian Island Chain (night of 7 August 2008, 22:00 GMT)
The SO2 plume emitted during the eruption was tracked by monitoring thebrightness temperature differencereferred to the 3 absorption band of SO2 at 1362 cm-1.
IASI….
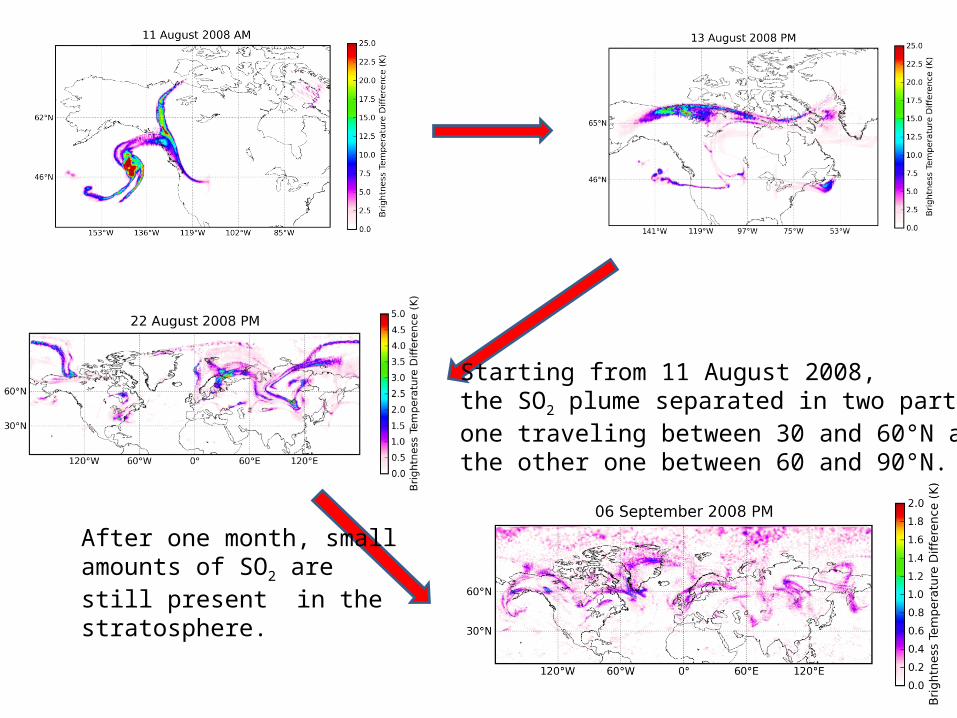
Starting from 11 August 2008,the SO2 plume separated in two parts,one traveling between 30 and 60°N and the other one between 60 and 90°N.
After one month, small amounts of SO2 are still present in the stratosphere.
8x10⁻⁶
6
4
2
0Ra
dia
nce
(W
/cm
2 .Sr.
m-1
)
2520250024802460wavenumber (cm
-1)
Observed Calculated Residual
25
20
15
10
Alti
tude
(km
)
6543210-1SO2 [ppmv]
0.01
0.1
1
10
100
1000
Pre
ssure (hP
a)
20
18
16
14
12
10
8
Alti
tud
e (
km)
0.40.30.20.10.0-0.1Averaging Kernel
8-10 km 10-12 km 12-14 km 14-16 km 16-18 km 18-20 km 20-22 km
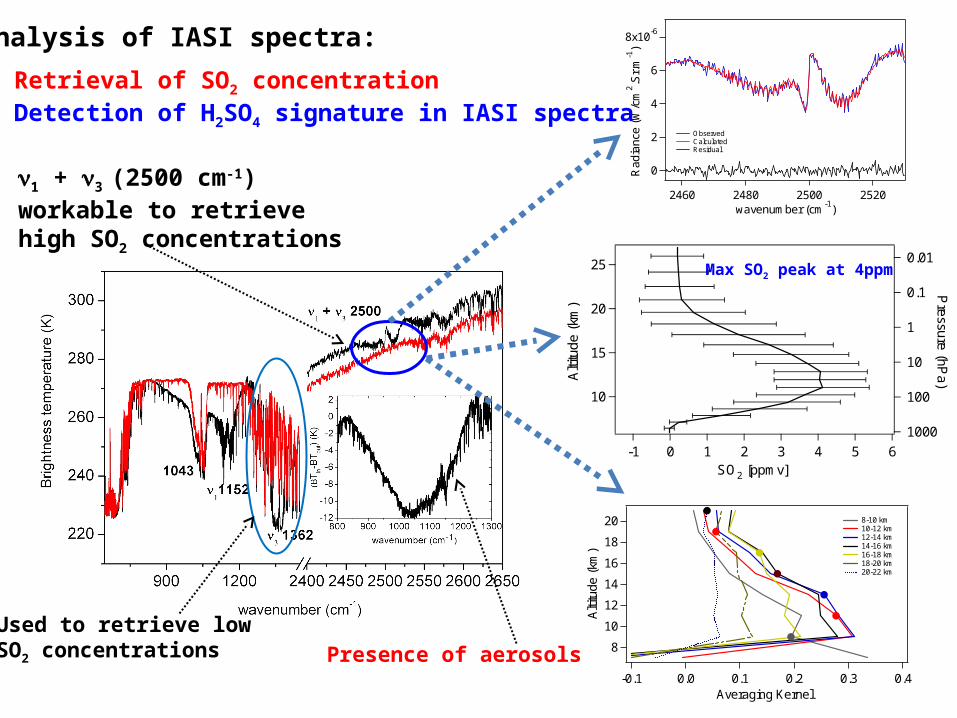
Analysis of IASI spectra:
Retrieval of SO2 concentration Detection of H2SO4 signature in IASI spectra
1 + 3 (2500 cm-1) workable to retrieve high SO2 concentrations
Used to retrieve low SO2 concentrations Presence of aerosols
Max SO2 peak at 4ppm
-15
-10
-5
0
5
10(B
Tin-
BT
out)
(K)
1300120011001000900800wavenumber (cm
-1)
t Aug08 am Aug08 pm Aug09 am Aug09 pm Aug10 am Aug10 pm
08-am
08-pm
09-am/pm
10-am/pm
830
1018
1047
1066
1081
-10
-5
0
5
10
(BT
in-
BT
ou
t) (K
)
1300120011001000900800wavenumber (cm
-1)
t
Aug08 am Ash r = 0.75m Aug10 pm H2SO4 - H2O, r = 1.2m
ash
H2SO4 - H2O
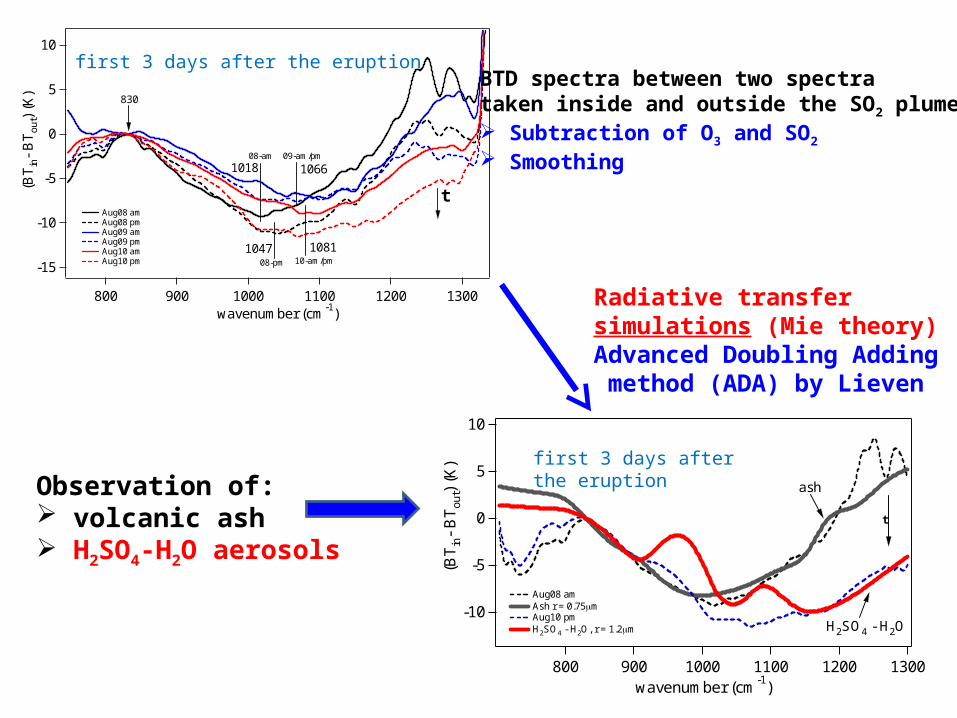
BTD spectra between two spectra taken inside and outside the SO2 plume: Subtraction of O3 and SO2
Smoothing
Observation of: volcanic ash H2SO4-H2O aerosols
Radiative transfer simulations (Mie theory)Advanced Doubling Adding method (ADA) by Lieven
first 3 days after the eruption
first 3 days after the eruption
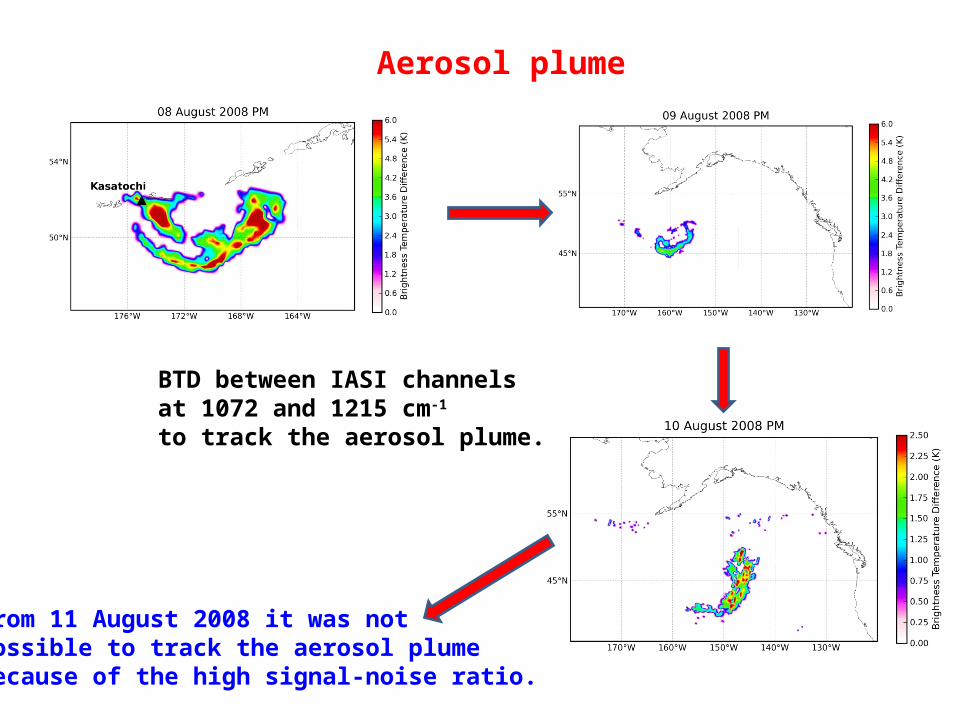
Aerosol plume
BTD between IASI channels at 1072 and 1215 cm-1 to track the aerosol plume.
From 11 August 2008 it was not possible to track the aerosol plume because of the high signal-noise ratio.
-0.8
-0.6
-0.4
-0.2
0.0
0.2
BT
(K
)
1300120011001000900800wavenumber (cm
-1)
904
1160
1042
2.0x10⁶
1.5
1.0
0.5
0.0
SO
2 m
ass
(Ton
s)
20151050days from 08 August 2008
1080
1070
1060
1050
1040
1030
1020
B
T(K
) min
imu
m (cm
-1)
8pm
9pm
10am10pm
11am
18pm 20pm
20am
26am
26pm
30pm
30am
9pm
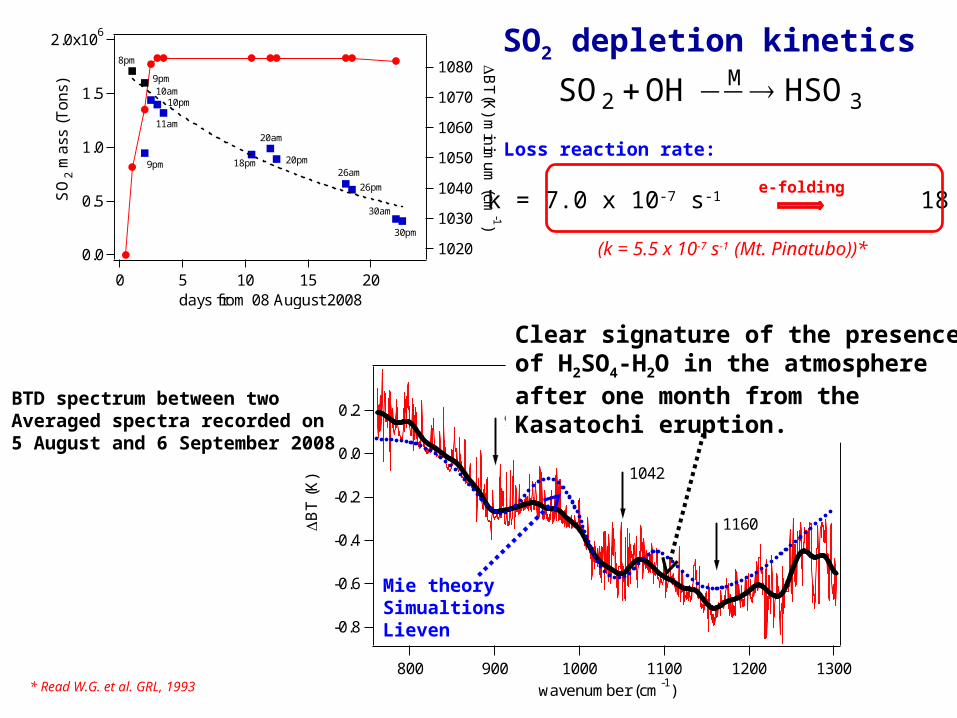
BTD spectrum between two Averaged spectra recorded on 5 August and 6 September 2008
Mie theorySimualtionsLieven
Clear signature of the presenceof H2SO4-H2O in the atmosphere after one month from theKasatochi eruption.
SO2 depletion kinetics
3M
2 HSOOHSO
k = 7.0 x 10⁻⁷ s-1 18 dayse-folding
Loss reaction rate:
(k = 5.5 x 10⁻⁷ s-1 (Mt. Pinatubo))*
* Read W.G. et al. GRL, 1993
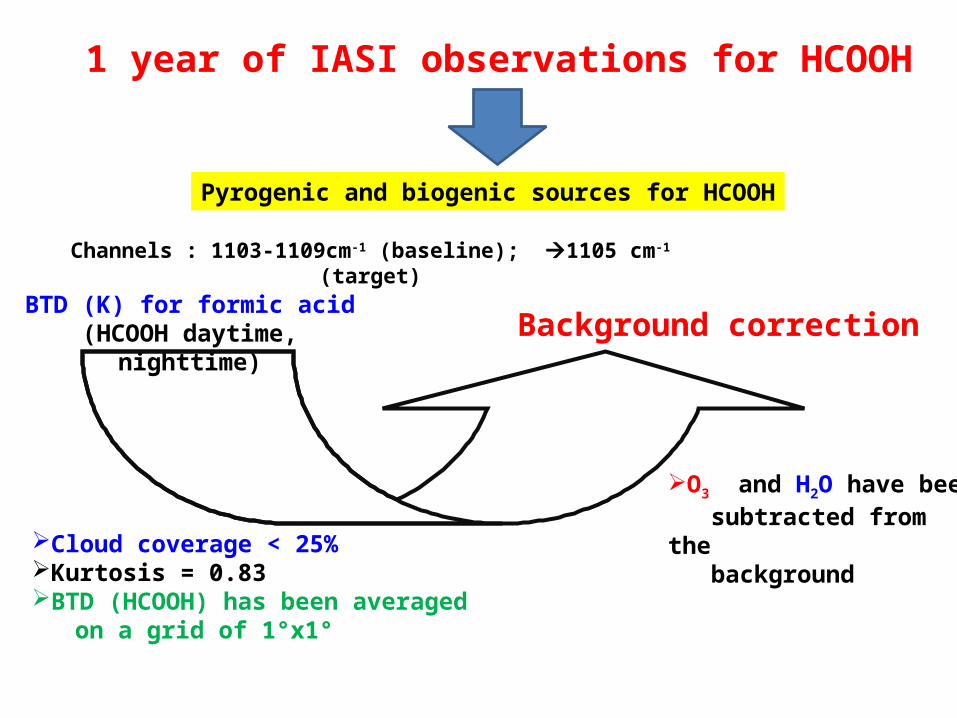
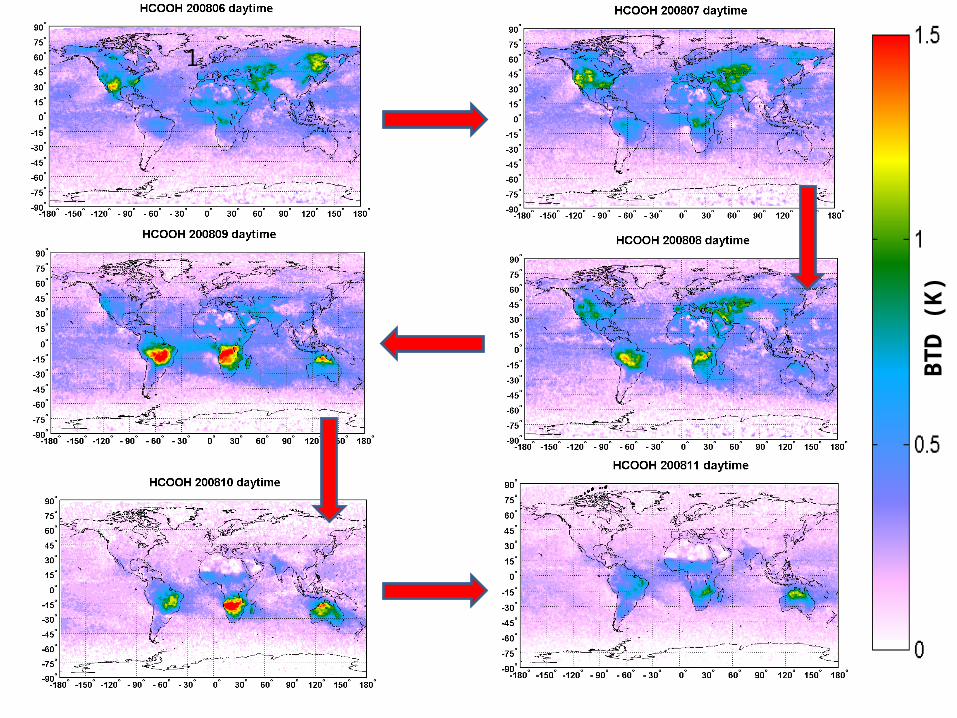
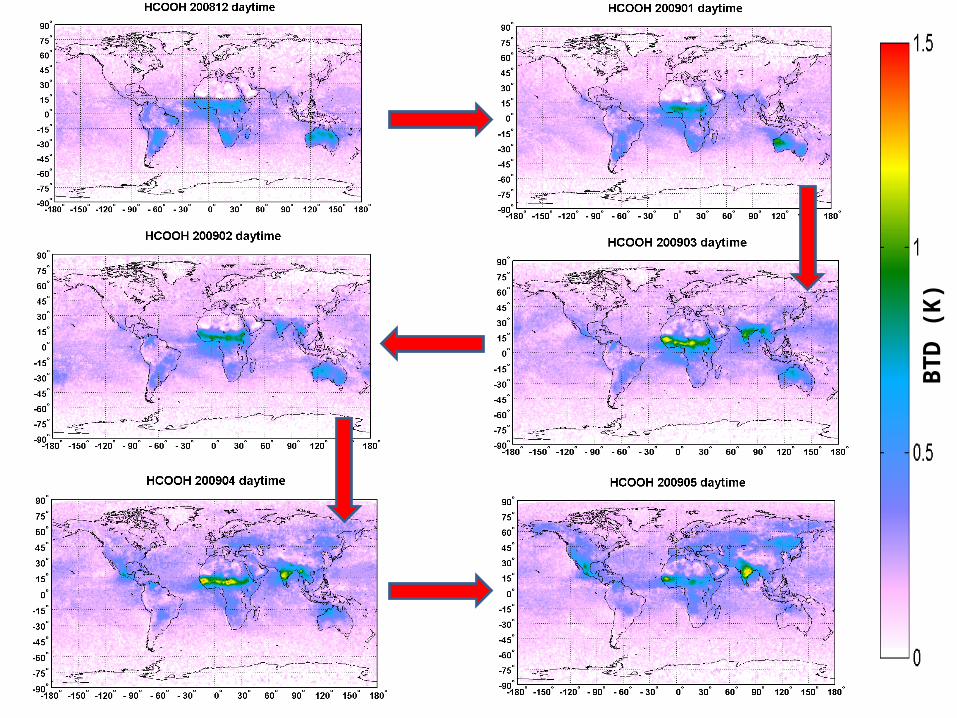
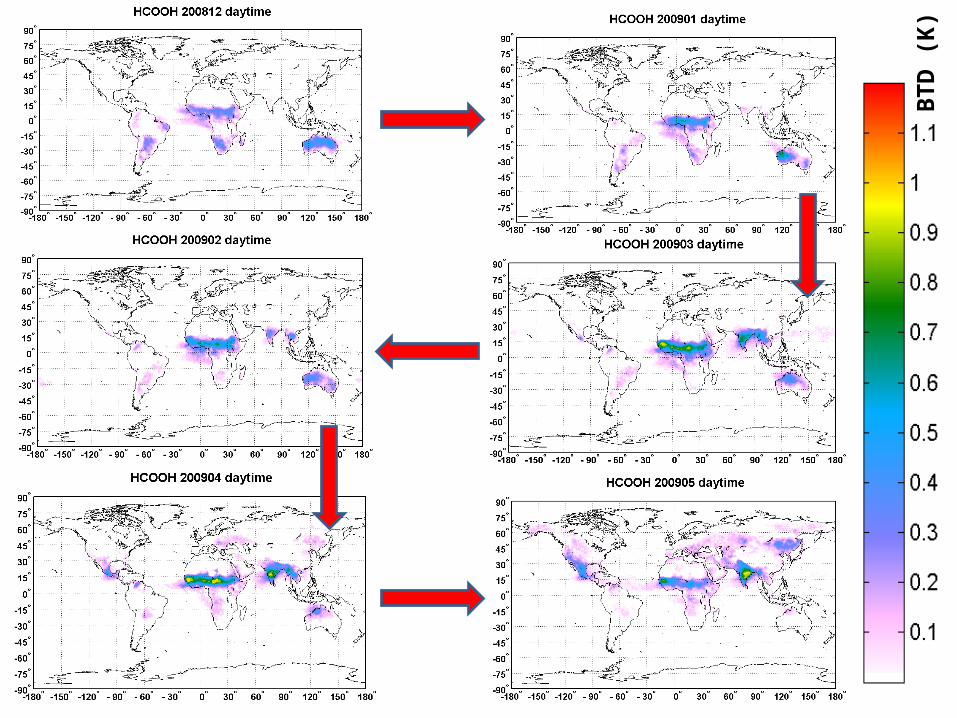
BTD (K) for formic acid(HCOOH daytime, nighttime)
Cloud coverage < 25%Kurtosis = 0.83BTD (HCOOH) has been averaged on a grid of 1°x1°
Pyrogenic and biogenic sources for HCOOH
Background correction
1 year of IASI observations for HCOOH
O3 and H2O have been subtracted from the background
Channels : 1103-1109cm-1 (baseline); 1105 cm-1 (target)
1
BT
D (
K)
BT
D (
K)
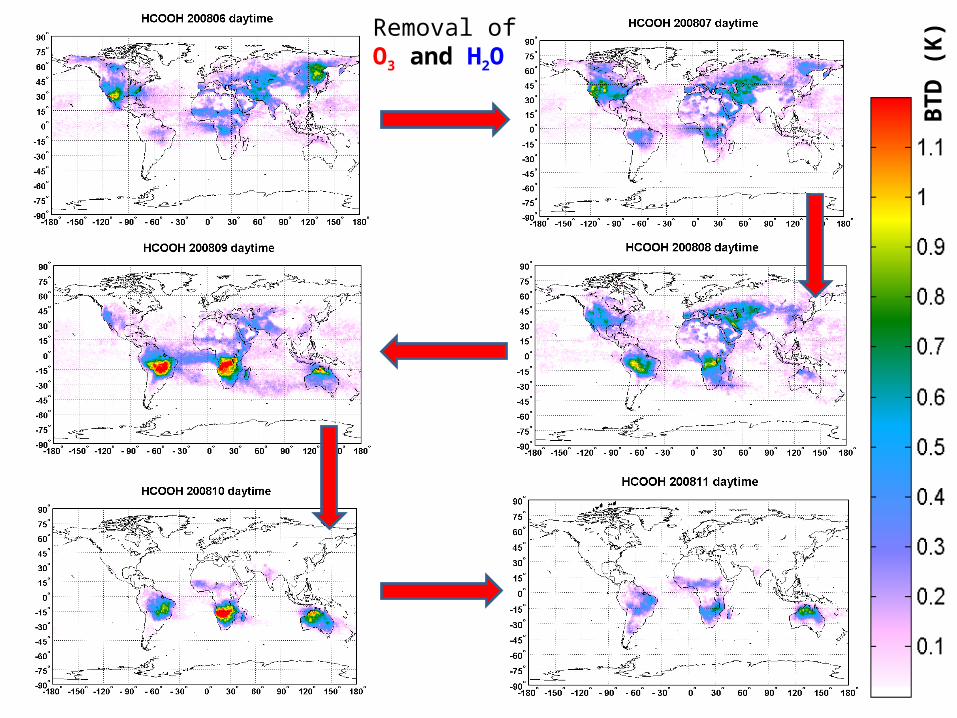
Removal of O3 and H2O
BT
D (
K)
BT
D (
K)
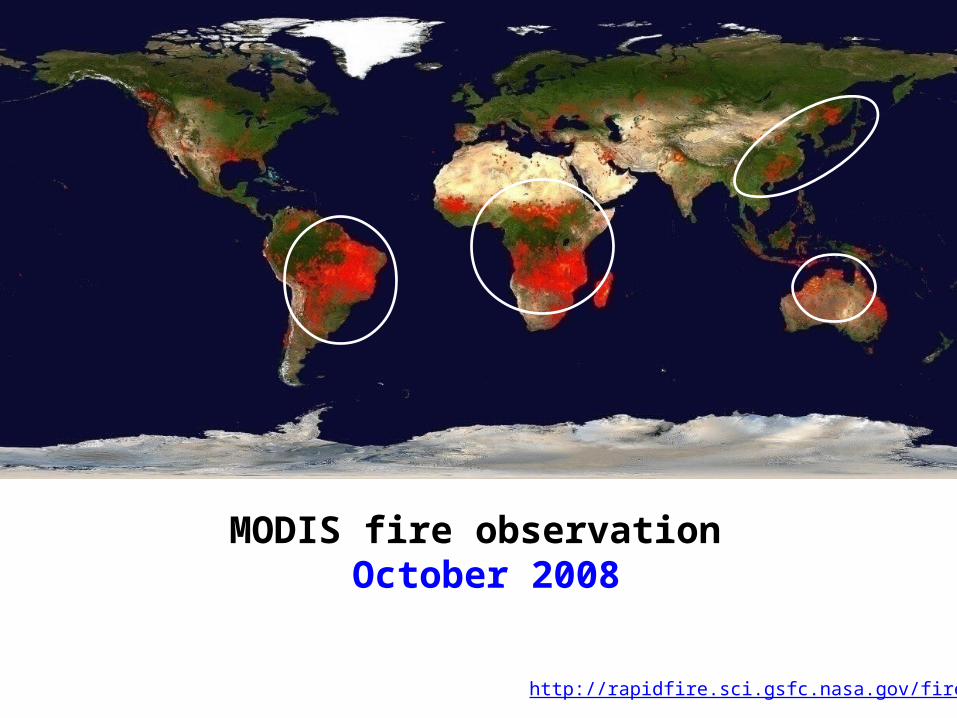
MODIS fire observation October 2008
http://rapidfire.sci.gsfc.nasa.gov/firemaps/
-3x10⁻⁵
-2
-1
0
Ra
dia
nce
(W
/cm
2 .Sr.
m-1
)11401130112011101100109010801070
wavenumber (cm-1
)
1.0
0.8
0.6
0.4
Tra
smitta
nce
(a.u)
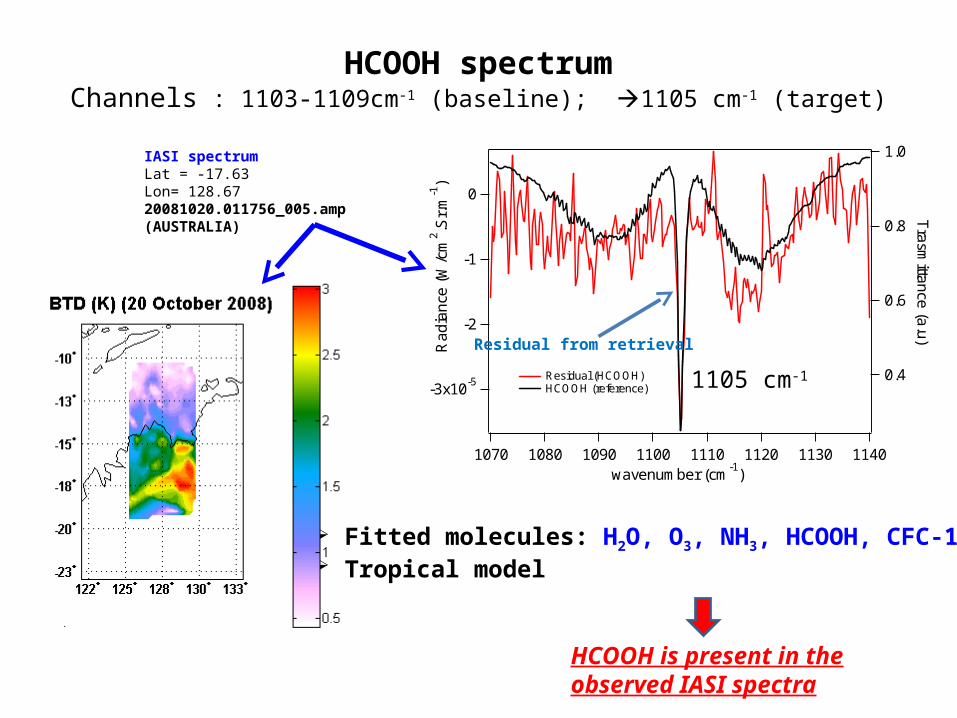
Residual (HCOOH) HCOOH (reference)
Residual from retrieval
HCOOH spectrumChannels : 1103-1109cm-1 (baseline); 1105 cm-1 (target)
Fitted molecules: H2O, O3, NH3, HCOOH, CFC-12 Tropical model
1105 cm-1
IASI spectrumLat = -17.63 Lon= 128.6720081020.011756_005.amp (AUSTRALIA)
HCOOH is present in the observed IASI spectra
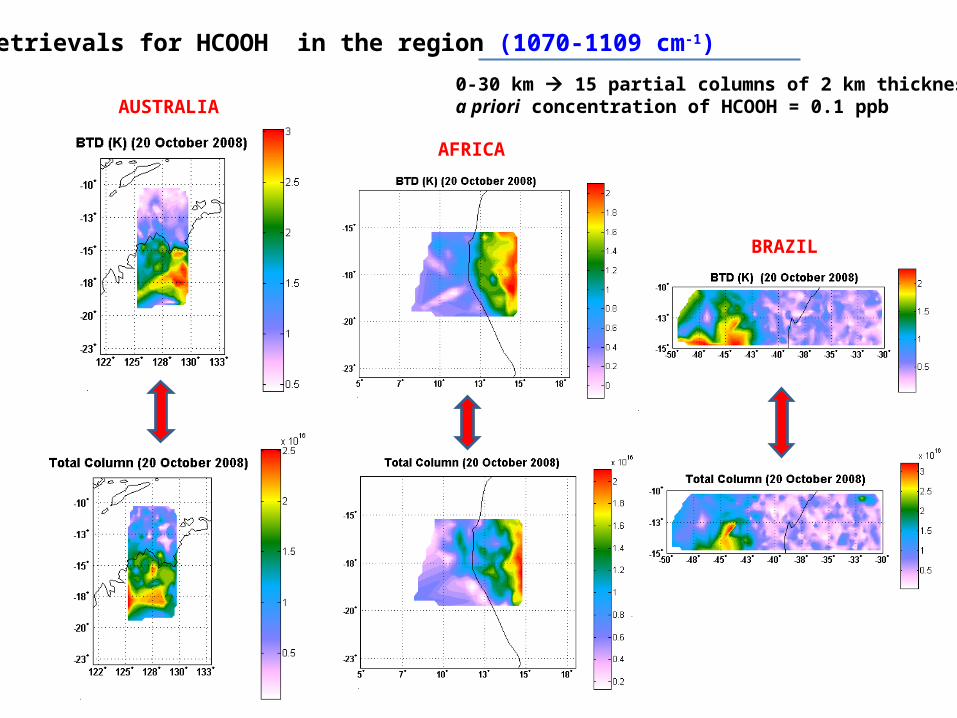
Retrievals for HCOOH in the region (1070-1109 cm-1)
AUSTRALIA
AFRICA
BRAZIL
0-30 km 15 partial columns of 2 km thicknessa priori concentration of HCOOH = 0.1 ppb
25
20
15
10
5
Alti
tud
e (
Km
)
0.200.150.100.050.00Averaging Kernel
AUSTRALIA 5 Km 17 Km
2.5x10¹⁶
2.0
1.5
1.0
0.5
0.0
Tot
al C
olum
n (#
/cm
2)
3.02.52.01.51.00.50.0BTD (K)
AUSTRALIA 2.0x10¹⁶
1.5
1.0
0.5
0.0
Tot
al C
olum
n (#
/cm
2)
2.01.51.00.50.0BTD (K)
AFRICA3.0x10
16
2.5
2.0
1.5
1.0
0.5
0.0
Tot
al C
olum
n (#
/cm
2)
2.01.51.00.50.0BTD (K)
25
20
15
10
5
Alti
tude
(K
m)
0.200.150.100.050.00Averaging Kernel
BRAZIL 7 Km 15 Km
25
20
15
10
5
Alti
tude
(K
m)
0.200.150.100.050.00Averaging Kernel
AFRICA 5 Km 15 Km
30
25
20
15
10
5
Alti
tud
e (K
m)
2.0x10¹⁰
1.51.00.50.0molecules cm-3
AFRICA
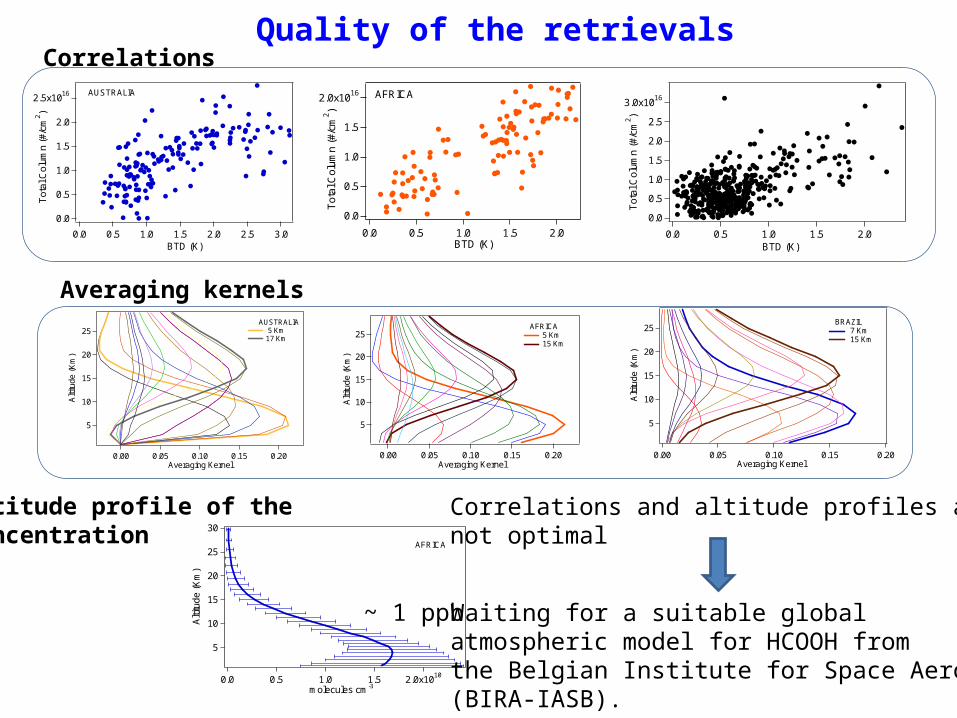
Quality of the retrievalsCorrelations
Averaging kernels
Altitude profile of the concentration
Correlations and altitude profiles are not optimal
Waiting for a suitable global atmospheric model for HCOOH fromthe Belgian Institute for Space Aeronomy (BIRA-IASB).
~ 1 ppb
Acknowledgments:
• Pierre, for help and discussions
• Lieven for “initiation”, programming, discussion and troubleshooting
• Chaterine, Ariane and Daniel for miscellaneous
• Antoine for help with Kasatochi images
Thanks for your attention!