SAR assessment of transmit arrays: Deterministic ...
1
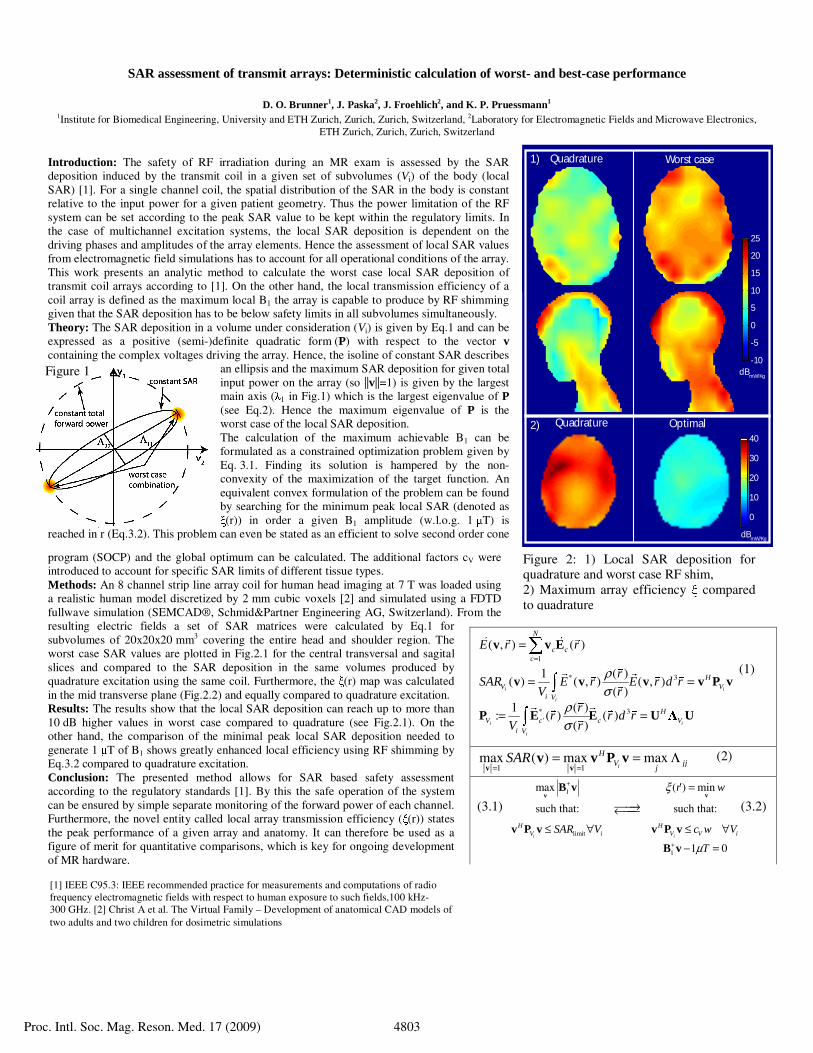
1 * 3 * 3 ' (,) () 1 () () (,) (,) () 1 () : () () () i i i i i i N c c c H V V iV H V c c V iV E r r r SAR E r E rdr V r r r rdr V r ρ σ ρ σ = = = = = = v vE v v v vPv P E E U U (1) 1 1 max () max max i H V jj j SAR = = = = Λ v v v vPv (2) (3.1) 1 limit 1 max () min such that: such that: 1 0 i i H H V i V V i r w SAR V cw V T ξ μ + + = ⎯⎯→ ←⎯⎯ ≤ ∀ ≤ ∀ − = v v Bv vPv vPv Bv (3.2) -10 -5 0 5 10 15 20 25 dB mW/Kg dB mW/Kg Quadrature Worst case 0 10 20 30 40 Quadrature Optimal 1) 2) Figure 2: 1) Local SAR deposition for quadrature and worst case RF shim, 2) Maximum array efficiency compared to quadrature SAR assessment of transmit arrays: Deterministic calculation of worst- and best-case performance D. O. Brunner 1 , J. Paska 2 , J. Froehlich 2 , and K. P. Pruessmann 1 1 Institute for Biomedical Engineering, University and ETH Zurich, Zurich, Zurich, Switzerland, 2 Laboratory for Electromagnetic Fields and Microwave Electronics, ETH Zurich, Zurich, Zurich, Switzerland Introduction: The safety of RF irradiation during an MR exam is assessed by the SAR deposition induced by the transmit coil in a given set of subvolumes (V i ) of the body (local SAR) [1]. For a single channel coil, the spatial distribution of the SAR in the body is constant relative to the input power for a given patient geometry. Thus the power limitation of the RF system can be set according to the peak SAR value to be kept within the regulatory limits. In the case of multichannel excitation systems, the local SAR deposition is dependent on the driving phases and amplitudes of the array elements. Hence the assessment of local SAR values from electromagnetic field simulations has to account for all operational conditions of the array. This work presents an analytic method to calculate the worst case local SAR deposition of transmit coil arrays according to [1]. On the other hand, the local transmission efficiency of a coil array is defined as the maximum local B 1 the array is capable to produce by RF shimming given that the SAR deposition has to be below safety limits in all subvolumes simultaneously. Theory: The SAR deposition in a volume under consideration (V i ) is given by Eq.1 and can be expressed as a positive (semi-)definite quadratic form (P) with respect to the vector v containing the complex voltages driving the array. Hence, the isoline of constant SAR describes an ellipsis and the maximum SAR deposition for given total input power on the array (so ||v||=1) is given by the largest main axis ( 1 in Fig.1) which is the largest eigenvalue of P (see Eq.2). Hence the maximum eigenvalue of P is the worst case of the local SAR deposition. The calculation of the maximum achievable B 1 can be formulated as a constrained optimization problem given by Eq. 3.1. Finding its solution is hampered by the non- convexity of the maximization of the target function. An equivalent convex formulation of the problem can be found by searching for the minimum peak local SAR (denoted as (r)) in order a given B 1 amplitude (w.l.o.g. 1 T) is reached in r (Eq.3.2). This problem can even be stated as an efficient to solve second order cone program (SOCP) and the global optimum can be calculated. The additional factors c V were introduced to account for specific SAR limits of different tissue types. Methods: An 8 channel strip line array coil for human head imaging at 7 T was loaded using a realistic human model discretized by 2 mm cubic voxels [2] and simulated using a FDTD fullwave simulation (SEMCAD®, Schmid&Partner Engineering AG, Switzerland). From the resulting electric fields a set of SAR matrices were calculated by Eq.1 for subvolumes of 20x20x20 mm 3 covering the entire head and shoulder region. The worst case SAR values are plotted in Fig.2.1 for the central transversal and sagital slices and compared to the SAR deposition in the same volumes produced by quadrature excitation using the same coil. Furthermore, the (r) map was calculated in the mid transverse plane (Fig.2.2) and equally compared to quadrature excitation. Results: The results show that the local SAR deposition can reach up to more than 10 dB higher values in worst case compared to quadrature (see Fig.2.1). On the other hand, the comparison of the minimal peak local SAR deposition needed to generate 1 T of B 1 shows greatly enhanced local efficiency using RF shimming by Eq.3.2 compared to quadrature excitation. Conclusion: The presented method allows for SAR based safety assessment according to the regulatory standards [1]. By this the safe operation of the system can be ensured by simple separate monitoring of the forward power of each channel. Furthermore, the novel entity called local array transmission efficiency ( (r)) states the peak performance of a given array and anatomy. It can therefore be used as a figure of merit for quantitative comparisons, which is key for ongoing development of MR hardware. Figure 1 [1] IEEE C95.3: IEEE recommended practice for measurements and computations of radio frequency electromagnetic fields with respect to human exposure to such fields,100 kHz- 300 GHz. [2] Christ A et al. The Virtual Family – Development of anatomical CAD models of two adults and two children for dosimetric simulations Proc. Intl. Soc. Mag. Reson. Med. 17 (2009) 4803
Transcript of SAR assessment of transmit arrays: Deterministic ...
1
* 3
* 3'
( , ) ( )
1 ( )( ) ( , ) ( , )
( )1 ( )
: ( ) ( )( )
i i
i
i i
i
N
c cc
HV V
i V
HV c c V
i V
E r r
rSAR E r E r d r
V rr
r r d rV r
ρσ
ρσ
=
=
= =
= =
∑
∫
∫
v v E
v v v v P v
P E E U Λ U
r r
r r
r
r r
r r r
r
r
r r
r r r
r
(1)
1 1max ( ) max max
i
HV jj
jSAR
= == = Λ
v vv v P v (2)
(3.1) 1
limit
1
max ( ) min
such that: such that:
1 0i i
H HV i V V i
r w
SAR V c w V
T
ξ
μ
+
+
=
⎯⎯→←⎯⎯≤ ∀ ≤ ∀
− =
vvB v
v P v v P v
B v
r
(3.2)
-10
-5
0
5
10
15
20
25
dBmW/Kg
dBmW/Kg
Quadrature Worst case
0
10
20
30
40
Quadrature Optimal
1)
2)
Figure 2: 1) Local SAR deposition for quadrature and worst case RF shim, 2) Maximum array efficiency ξ compared to quadrature
SAR assessment of transmit arrays: Deterministic calculation of worst- and best-case performance
D. O. Brunner1, J. Paska2, J. Froehlich2, and K. P. Pruessmann1 1Institute for Biomedical Engineering, University and ETH Zurich, Zurich, Zurich, Switzerland, 2Laboratory for Electromagnetic Fields and Microwave Electronics,
ETH Zurich, Zurich, Zurich, Switzerland
Introduction: The safety of RF irradiation during an MR exam is assessed by the SAR deposition induced by the transmit coil in a given set of subvolumes (Vi) of the body (local SAR) [1]. For a single channel coil, the spatial distribution of the SAR in the body is constant relative to the input power for a given patient geometry. Thus the power limitation of the RF system can be set according to the peak SAR value to be kept within the regulatory limits. In the case of multichannel excitation systems, the local SAR deposition is dependent on the driving phases and amplitudes of the array elements. Hence the assessment of local SAR values from electromagnetic field simulations has to account for all operational conditions of the array. This work presents an analytic method to calculate the worst case local SAR deposition of transmit coil arrays according to [1]. On the other hand, the local transmission efficiency of a coil array is defined as the maximum local B1 the array is capable to produce by RF shimming given that the SAR deposition has to be below safety limits in all subvolumes simultaneously. Theory: The SAR deposition in a volume under consideration (Vi) is given by Eq.1 and can be expressed as a positive (semi-)definite quadratic form (P) with respect to the vector v containing the complex voltages driving the array. Hence, the isoline of constant SAR describes
an ellipsis and the maximum SAR deposition for given total input power on the array (so ||v||=1) is given by the largest main axis (λ1 in Fig.1) which is the largest eigenvalue of P (see Eq.2). Hence the maximum eigenvalue of P is the worst case of the local SAR deposition. The calculation of the maximum achievable B1 can be formulated as a constrained optimization problem given by Eq. 3.1. Finding its solution is hampered by the non-convexity of the maximization of the target function. An equivalent convex formulation of the problem can be found by searching for the minimum peak local SAR (denoted as ξ(r)) in order a given B1 amplitude (w.l.o.g. 1 μT) is
reached in r (Eq.3.2). This problem can even be stated as an efficient to solve second order cone
program (SOCP) and the global optimum can be calculated. The additional factors cV were introduced to account for specific SAR limits of different tissue types. Methods: An 8 channel strip line array coil for human head imaging at 7 T was loaded using a realistic human model discretized by 2 mm cubic voxels [2] and simulated using a FDTD fullwave simulation (SEMCAD®, Schmid&Partner Engineering AG, Switzerland). From the resulting electric fields a set of SAR matrices were calculated by Eq.1 for subvolumes of 20x20x20 mm3 covering the entire head and shoulder region. The worst case SAR values are plotted in Fig.2.1 for the central transversal and sagital slices and compared to the SAR deposition in the same volumes produced by quadrature excitation using the same coil. Furthermore, the ξ(r) map was calculated in the mid transverse plane (Fig.2.2) and equally compared to quadrature excitation. Results: The results show that the local SAR deposition can reach up to more than 10 dB higher values in worst case compared to quadrature (see Fig.2.1). On the other hand, the comparison of the minimal peak local SAR deposition needed to generate 1 μT of B1 shows greatly enhanced local efficiency using RF shimming by Eq.3.2 compared to quadrature excitation. Conclusion: The presented method allows for SAR based safety assessment according to the regulatory standards [1]. By this the safe operation of the system can be ensured by simple separate monitoring of the forward power of each channel. Furthermore, the novel entity called local array transmission efficiency (ξ(r)) states the peak performance of a given array and anatomy. It can therefore be used as a figure of merit for quantitative comparisons, which is key for ongoing development of MR hardware.
Figure 1
[1] IEEE C95.3: IEEE recommended practice for measurements and computations of radio frequency electromagnetic fields with respect to human exposure to such fields,100 kHz-300 GHz. [2] Christ A et al. The Virtual Family – Development of anatomical CAD models of two adults and two children for dosimetric simulations
Proc. Intl. Soc. Mag. Reson. Med. 17 (2009) 4803


![Section 10-VLSI.ppt [Λειτουργία συμβατότητας]tsiatouhas/MYE018-VLSI/Section_10-2p.pdf– Χρήση διατάξεων λογικής (logic arrays) – Χρήση](https://static.fdocument.org/doc/165x107/5f40734e54435a1a9225c716/section-10-vlsippt-foe-tsiatouhasmye018-vlsisection10-2ppdf.jpg)