Sample Size Determination - ICSSC advice, or a pilot study To estimate σwe can use previous...
22
Sample Size Determination The Fundamentals of Biostatistics in Clinical Research Workshop India, March 2007 Mario Chen
Transcript of Sample Size Determination - ICSSC advice, or a pilot study To estimate σwe can use previous...
Sample Size Determination
The Fundamentals of Biostatistics in Clinical Research WorkshopIndia, March 2007Mario Chen
Framework
ObjectivesType of Inference: Estimation or Estimation or Hypothesis TestingHypothesis TestingStudy Design: Type of Study and Sample SizeSample SizeData CollectionData ManagementData AnalysisData Analysis
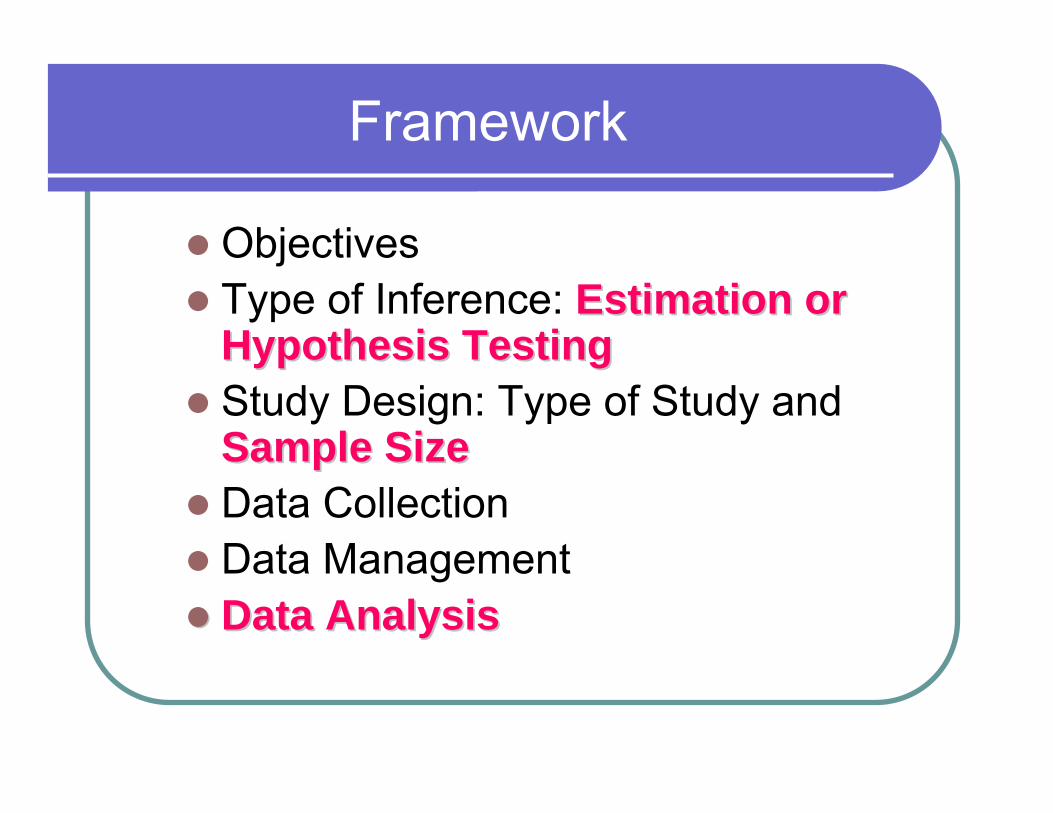
Selection of summary measure
ObjectiveObjective
EndpointEndpoint
Summary measure*Summary measure*
ParameterParameter
PopulationPopulation
IndividualIndividual
SampleSample
PopulationPopulation
* Depends of primary analysis method
Sample Size for Estimation
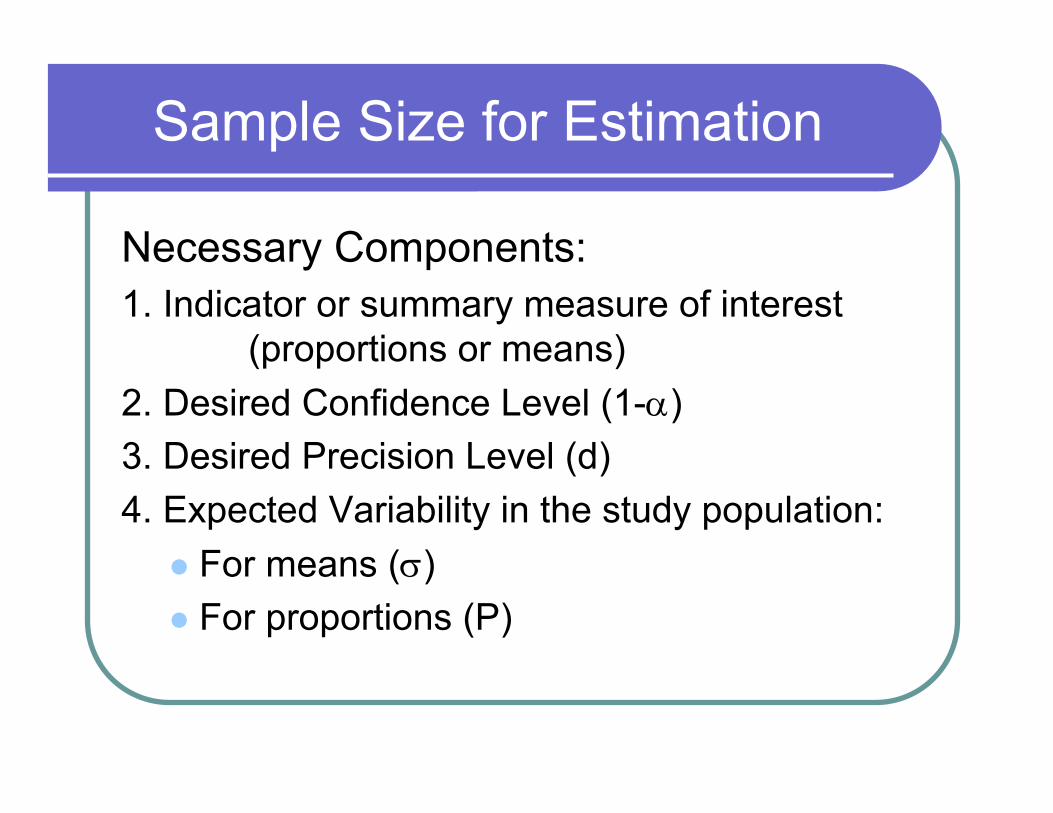
Necessary Components:1. Indicator or summary measure of interest
(proportions or means)2. Desired Confidence Level (1-α)3. Desired Precision Level (d)4. Expected Variability in the study population:
For means (σ)For proportions (P)
Sample Size for Estimation (Proportions)
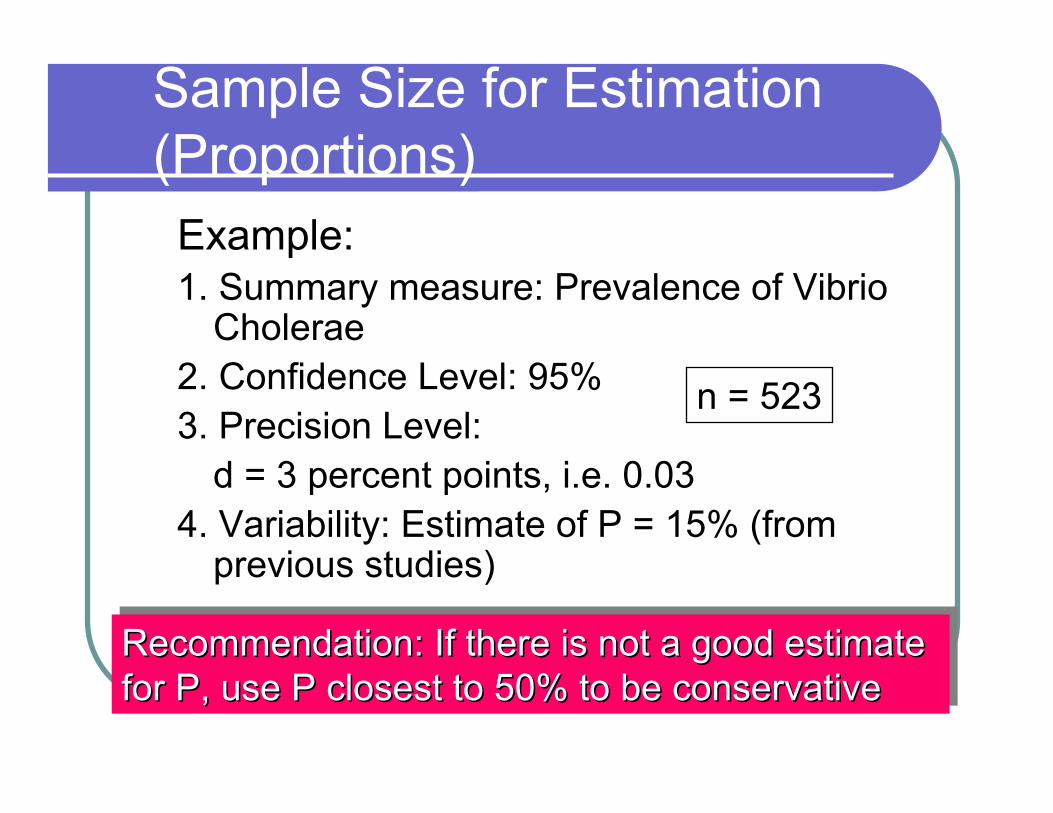
Example:1. Summary measure: Prevalence of Vibrio
Cholerae2. Confidence Level: 95%3. Precision Level:
d = 3 percent points, i.e. 0.034. Variability: Estimate of P = 15% (from
previous studies)
Recommendation: If there is not a good estimate for P, use P closest to 50% to be conservativeRecommendation: If there is not a good estimate Recommendation: If there is not a good estimate for P, use P closest to 50% to be conservativefor P, use P closest to 50% to be conservative
n = 523
Sample Size for Estimation (Means)
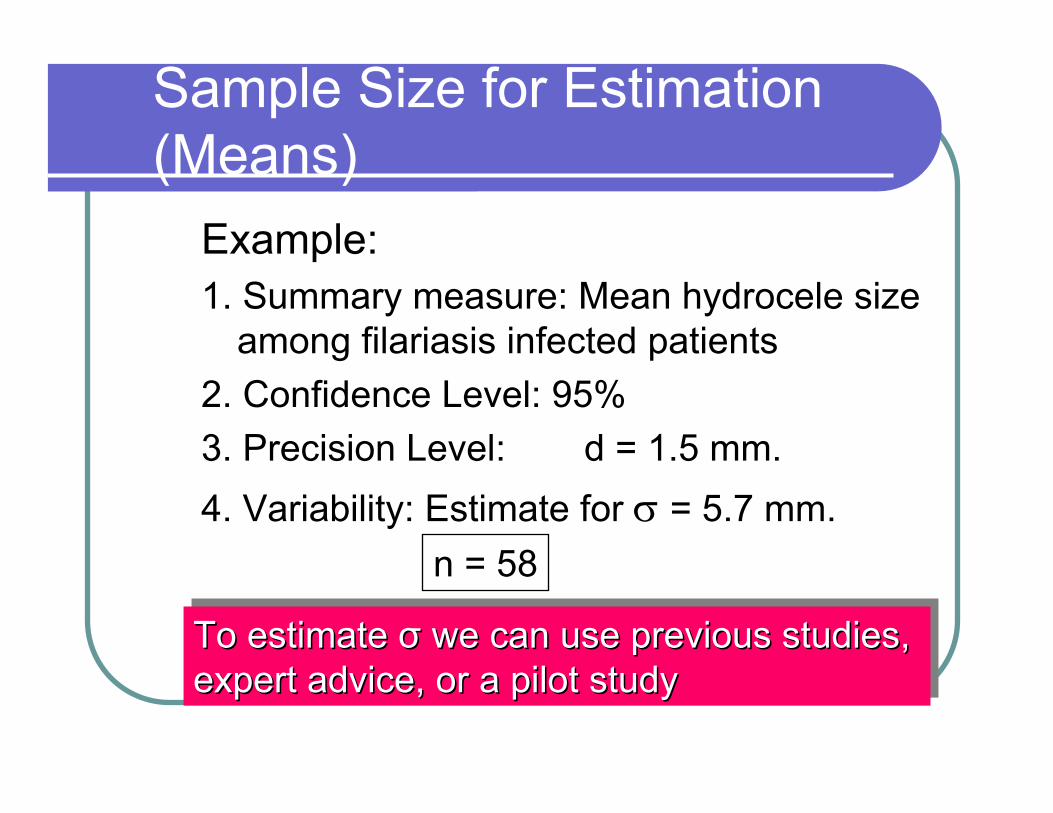
Example:1. Summary measure: Mean hydrocele size
among filariasis infected patients2. Confidence Level: 95%3. Precision Level: d = 1.5 mm.4. Variability: Estimate for σ = 5.7 mm.
To estimate σ we can use previous studies, expert advice, or a pilot studyTo estimate To estimate σσ we can use previous studies, we can use previous studies, expert advice, or a pilot studyexpert advice, or a pilot study
n = 58
Sample Size for Hypothesis Testing
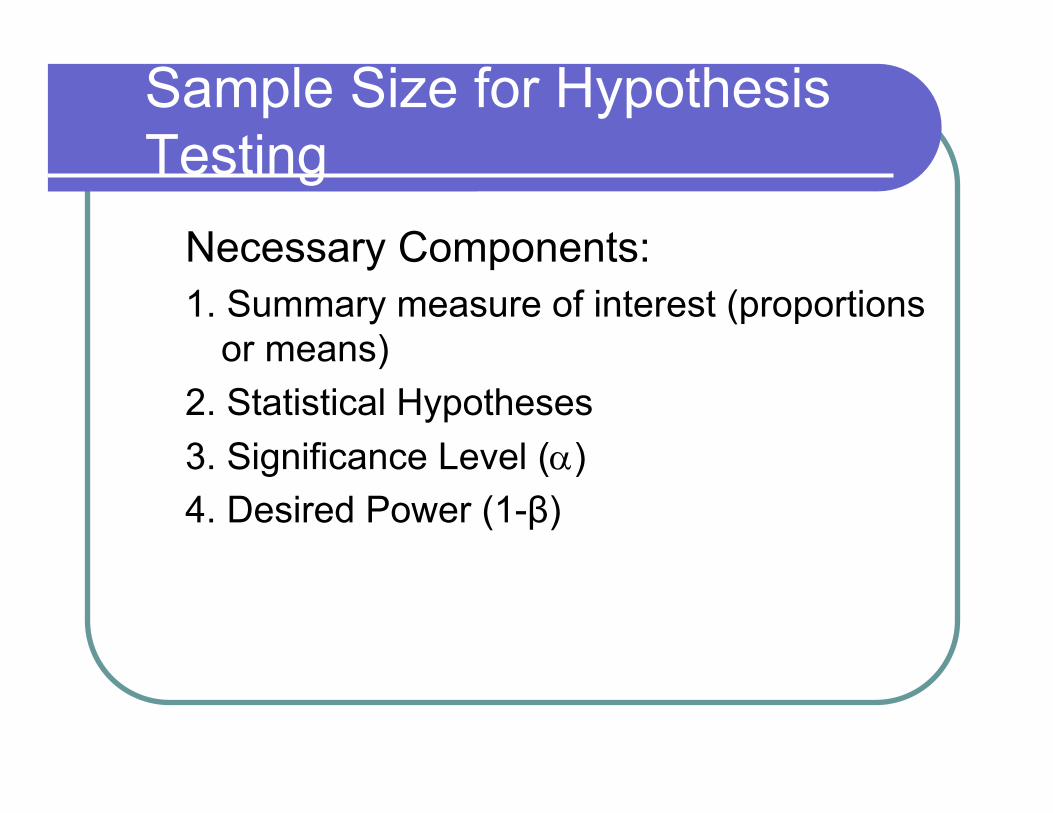
Necessary Components:1. Summary measure of interest (proportions
or means)2. Statistical Hypotheses3. Significance Level (α)4. Desired Power (1-β)
Sample Size for Hypothesis Testing
Necessary Components (cont’d):5. Effect Size: Smallest difference worth
detecting (clinically)
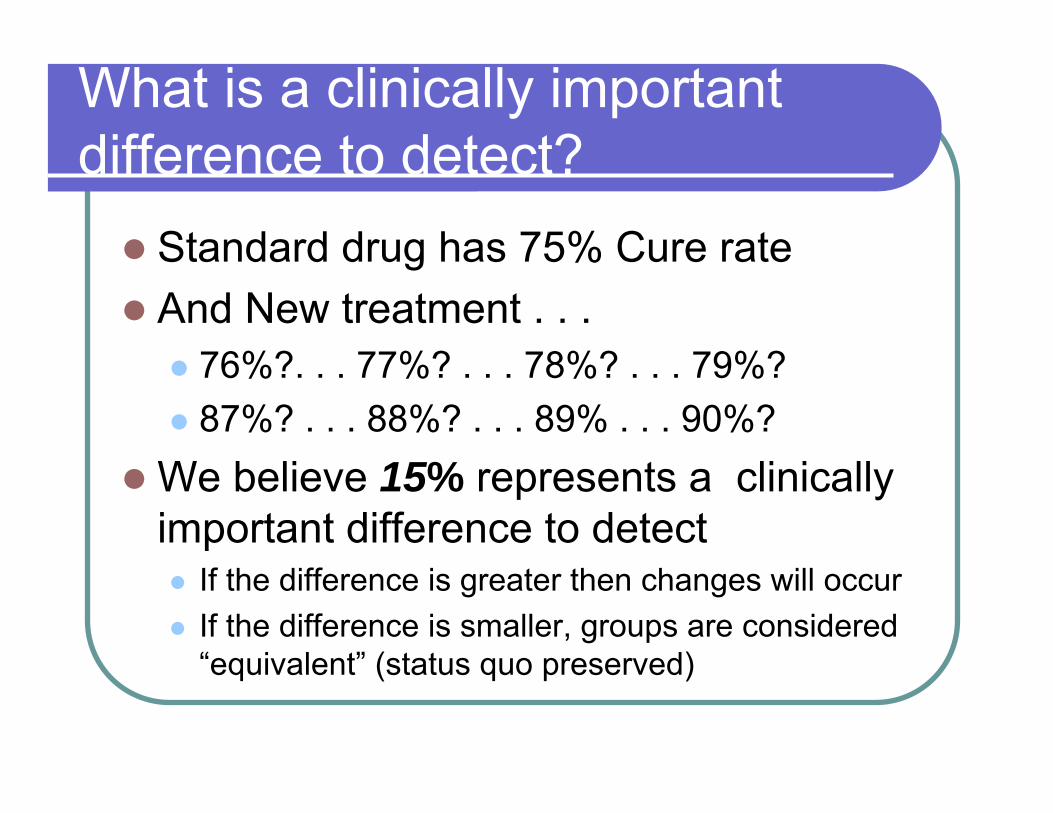
What is a clinically important difference to detect?
Standard drug has 75% Cure rateAnd New treatment . . .
76%?. . . 77%? . . . 78%? . . . 79%? 87%? . . . 88%? . . . 89% . . . 90%?
Cured rate for the New Treatment?
“Ridiculous notion” . . .“How would I know this – I’m doing the study to estimate the effect.”“I have no data on which to base an estimate.”
--------------------True, but----------------------You do not estimate the cure rate for the new treatment!You determine the cure rate reflecting the clinically important difference to detect, which may have no relation to the actual cure rate
Example
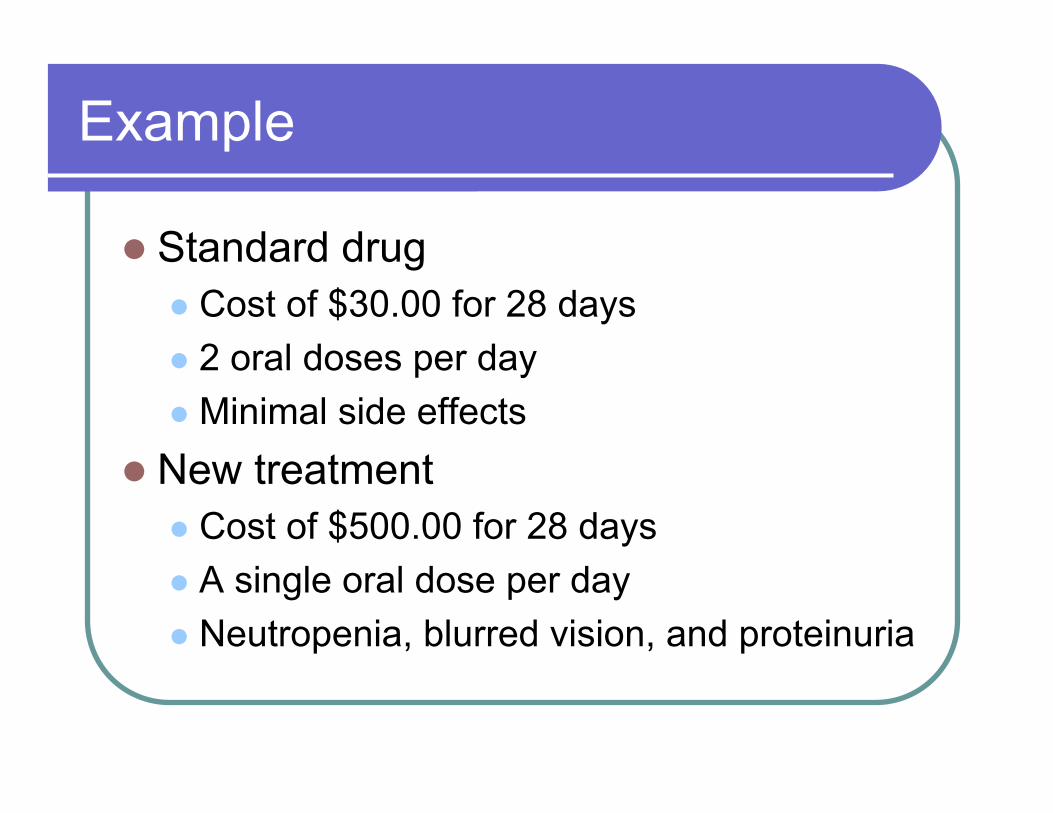
Standard drugCost of $30.00 for 28 days2 oral doses per dayMinimal side effects
New treatmentCost of $500.00 for 28 days A single oral dose per dayNeutropenia, blurred vision, and proteinuria
What is a clinically important difference to detect?
Standard drug has 75% Cure rateAnd New treatment . . .
76%?. . . 77%? . . . 78%? . . . 79%? 87%? . . . 88%? . . . 89% . . . 90%?
We believe 15% represents a clinically important difference to detect
If the difference is greater then changes will occurIf the difference is smaller, groups are considered “equivalent” (status quo preserved)
Sample Size for Hypothesis Testing
Necessary Components (cont’d):6. Variability expected in the population
For means (σ1, σ2)For proportions (P1, P2)
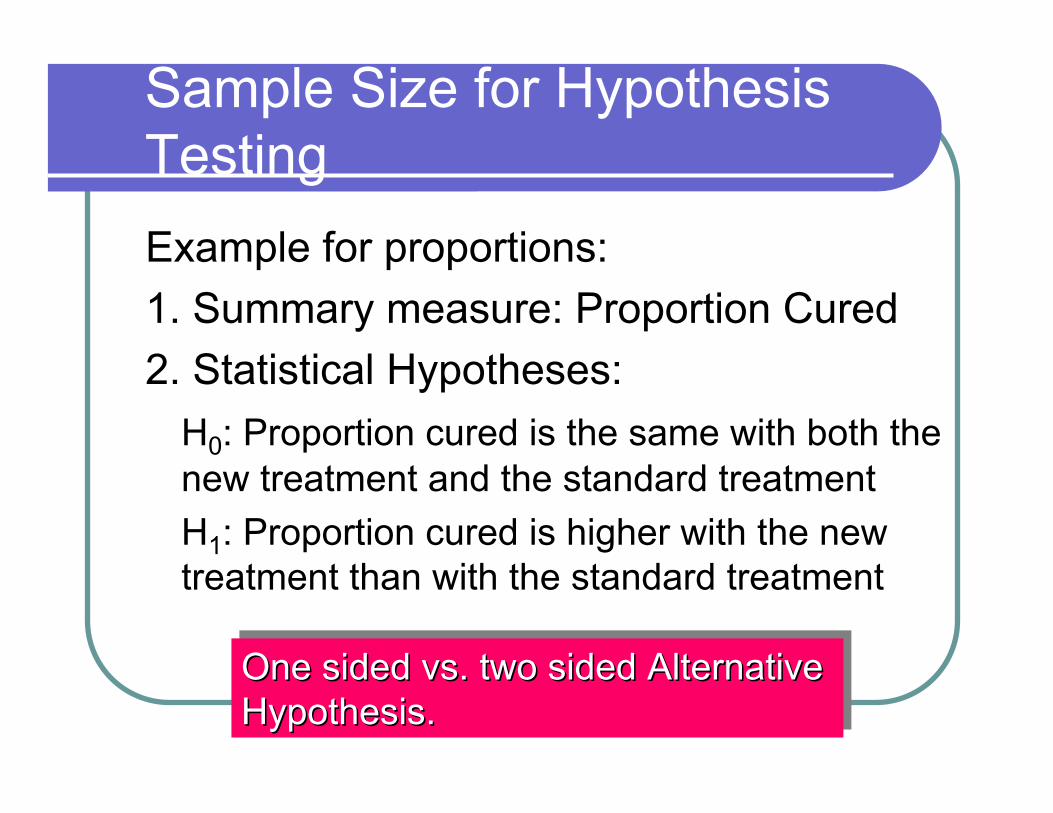
Sample Size for Hypothesis TestingExample for proportions:1. Summary measure: Proportion Cured2. Statistical Hypotheses:
H0: Proportion cured is the same with both the new treatment and the standard treatmentH1: Proportion cured is higher with the new treatment than with the standard treatment
One sided vs. two sided Alternative Hypothesis.One sided vs. two sided Alternative One sided vs. two sided Alternative Hypothesis.Hypothesis.
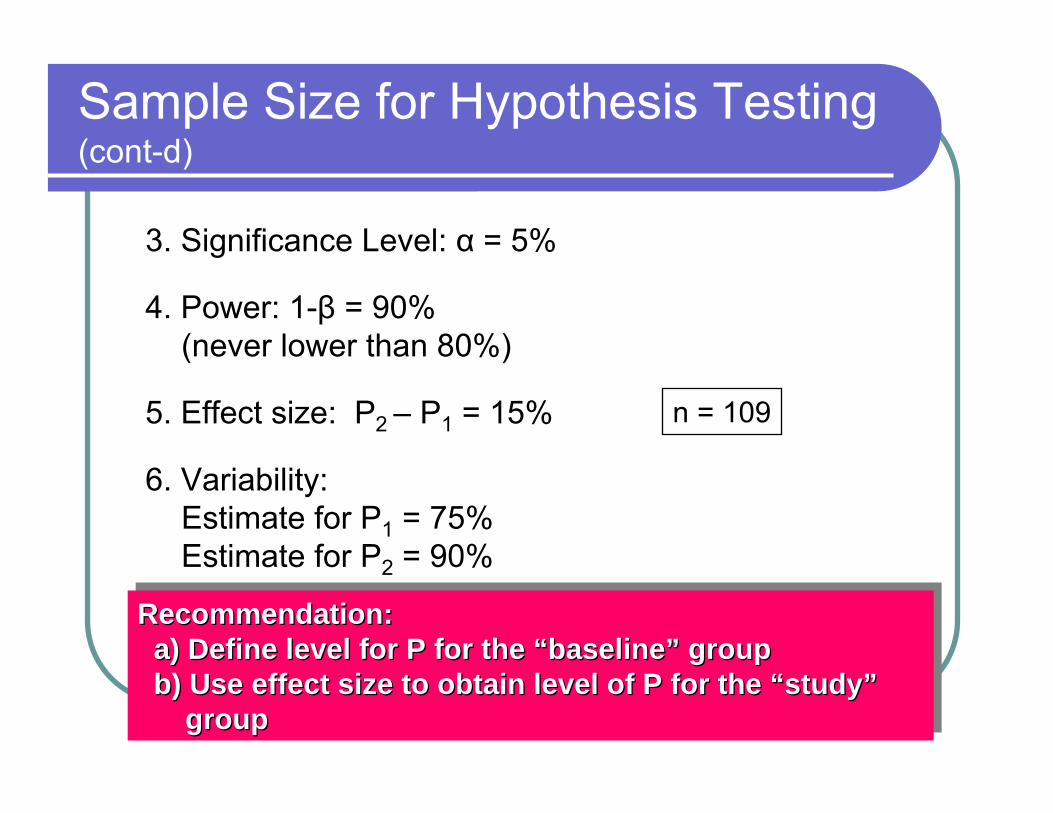
Recommendation:a) Define level for P for the “baseline” groupb) Use effect size to obtain level of P for the “study”
group
Recommendation:Recommendation:a) Define level for P for the a) Define level for P for the ““baselinebaseline”” groupgroupb) Use effect size to obtain level of P for the b) Use effect size to obtain level of P for the ““studystudy””
groupgroup
n = 109
Sample Size for Hypothesis Testing (cont-d)
3. Significance Level: α = 5%
4. Power: 1-β = 90% (never lower than 80%)
5. Effect size: P2 – P1 = 15%
6. Variability:Estimate for P1 = 75% Estimate for P2 = 90%
Main Determinant of Study SizeRecommendations when budget is not enough:1. (Estimation) Lower desired precision.2. (Hypothesis Testing) Lower desired power or increase
minimum detectable effect size.3. It is not recommended to change confidence levels,
significance levels, or variance estimates.4. If after all these changes, budget is still insufficient,
one has to decide between:• Not conducting the study until enough budget has
been obtained, or • go ahead with the study knowing that the results
are likely to be inconclusive (pilot study or exploratory).
Adjustments to Sample Size
Non-Response (and attrition):n2 = n1/(1-NR)
n2 = final size, n1 = effective sizeNR = Non-response (and attrition) rate
Other Considerations
Data dependencies (e.g., Matching, Repeated Measures).
Multivariate methods (e.g., control for confounding).Multiplicity issues (e.g., Multiple testing, endpoints, treatments, interim analyses).
Other variables of interest (e.g., time to event).
Other hypotheses (e.g., equivalence).
Software
PASS (www.ncss.com/pass.html)nQUERY(www.statsolusa.com/nquery/nquery.htm)EPI-INFO (www.cdc.gov/epiinfo)EPIDAT (www.paho.org/English/SHA/epidat.htm)
What should be included in theprotocol?
Justification in terms of power or precision for the primary endpointMethod used to calculate the sample size
should be consistent with the primary method for data analysis and appropriate for the study design
Historical data to support the assumptionsJustification in terms of feasibility

Questions?
Exercise: Case Scenarios
Statistical HypothesesSignificance level and desired powerEffect size discussion