Role of the Glucagon and Glucagon-like Peptides in … · thank my brothers Mr. Arshed Ali and Mr....
172
Role of the Glucagon and Glucagon-like Peptides in pancreatic β- cell and cardiovascular function By Safina Ali A thesis submitted in conformity with the requirements for the degree of Doctor of Philosophy Laboratory Medicine and Pathobiology University of Toronto ©Copyright by Safina Ali 2014
-
Upload
vuongnguyet -
Category
Documents
-
view
219 -
download
0
Transcript of Role of the Glucagon and Glucagon-like Peptides in … · thank my brothers Mr. Arshed Ali and Mr....
Role of the Glucagon and Glucagon-like Peptides in pancreatic β-cell and cardiovascular function
By
Safina Ali
A thesis submitted in conformity with the requirements for the degree of Doctor of Philosophy
Laboratory Medicine and Pathobiology University of Toronto
©Copyright by Safina Ali 2014
ii
Role of Glucagon and Glucagon-like peptides in pancreatic β-cell and
cardiovascular function
Safina Ali
Doctor of Philosophy
Laboratory Medicine and Pathobiology
University of Toronto
2014
ABSTRACT
Glucagon is inappropriately elevated in diabetes, and inhibition of glucagon receptor (Gcgr) signaling is
beneficial for glycemic control. However, the mechanism through which inhibition of Gcgr signaling leads to
improved glycemic control is unknown. Additionally, Gcgr is expressed in the cardiovascular system; however
the role of Gcgr signaling in the cardiovascular system is unexplored. In order to develop therapies targeting
Gcgr signaling for the treatment of type 2 diabetes (T2D) it is vital to understand Gcgr’ s role in regulation of
glucose homeostasis and cardiovascular function.
In mice, genetic deletion of the glucagon receptor results in increased levels of the insulinotropic hormone,
glucagon-like peptide-1 (GLP-1). I hypothesized Glp1r signaling contributed substantially to the improved
glucose tolerance observed in Gcgr-/- mice. I have generated and characterized the Gcgr and Glp-1 receptor
double knockout (Gcgr-/-:Glp1r-/-) mice. My studies demonstrate that Glp1r substantially contributes to the
delayed gastric emptying and improved intraperitoneal glucose tolerance in Gcgr-/- mice, but it did not
contribute to the improved oral glucose tolerance seen in the Gcgr-/- mice. Interestingly, expression of non-
classical incretin receptors and sensitivity to their exogenous agonists were increased in Gcgr-/-:Glp1r-/- mice,
suggesting that in the absence of the classical incretin receptors the non-classical incretin receptors compensate
to maintain the enteroinsular axis.
iii
I explored the role of Gcgr signaling in the cardiovascular system under normal and ischemic
conditions. My studies showed that exogenous glucagon increased mortality from myocardial infarction in WT
mice in a p38 MAPK-dependent manner. Conversely, Gcgr+/- and cardiac specific Gcgr-/- mice (GcgrCM-/-
)
had improved survival following myocardial infarction. Gene expression profiling of hearts from GcgrCM-/-
mice
showed reduced expression of fatty acid oxidation gene, consistent with a reduction in long-chain acylcarnitines
observed upon metabolic profiling of GcgrCM-/-
hearts. Therefore, partial or cardiomyocyte specific loss of Gcgr
signaling enhanced protection to ischemic injury by regulating fatty acid oxidation.
In conclusion, my studies suggest Gcgr signaling is essential for β-cell nutrient sensing and fuel metabolism
in cardiomyocytes and therapies aiming at modulating Gcgr signaling for the treatment of T2D require careful
assessment of cardiovascular outcomes.

iv
ACKNOWLEDGMENTS
I am forever grateful to my supervisor Dr. Daniel Drucker for his unconditional support, guidance,
encouragement, motivation and optimism during difficult situations. He has been a great mentor and has always
encouraged me to do great science and motivated me to stay on track in my career. Without Dr. Drucker’s
guidance, support and mentorship it would have been impossible for me to reach my career goals.
I would like to extend sincere thanks and appreciation to my program advisory committee members, Dr.
Amira Klip and Dr. Patricia Brubaker for their guidance and thoughtful advice throughout the years. I am also
thankful to my thesis defense examiners, for their review of this work.
I have been fortunate to share my PhD experience with a group of very talented and kind colleagues. Dr.
Ben Lamont, Dr. Christine Longuet and Dr. John Ussher were invaluable scientific collaborators and mentors.
The knowledge and tremendous generosity of Dr. Laurie Baggio will always be valued and appreciated. I would
like to thank Xiemin Cao for her skilled assistance and for rescuing me from the woes of islet isolation. Special
thanks are in order to the many other Drucker laboratory past and present members including Dr. Irene
Hadjiyanni, Dr. Jackie Koehler, Dr. Adriano Maida, Dr. Bernardo Yusta, Dr. Grace Flock, Dr. Jon Campbell,
Dr. Erin Muller, Dr. Holly Bates, Dr. Min Suk Kim, Kabir Gholam and Dianne Holland.
I am thankful to my family for their support and continued encouragement. I am most grateful to my
father late Mr. Kamran Rashed Ali who passed away during my doctoral studies for being my inspiration to do
research in diabetes and heart disease. I would like to thank my mother Mrs. Shamim Ali and my sisters Ms.
Sumaira Ali and Ms. Saima Naz, for their unconditional support, encouragement and assistance during my hard
times, without their love and support my doctorate journey would not have been possible. I would like to also
thank my brothers Mr. Arshed Ali and Mr. Murshed Ali for being a father figure to me and providing me with
their moral support.
v
TABLE OF CONTENTS
ABSTRACT ...................................................................................................................................................... ii
TABLE OF CONTENTS ................................................................................................................................ v
LIST OF FIGURES ........................................................................................................................................ ix
LIST OF TABLES ......................................................................................................................................... xii
ABREVIATIONS .......................................................................................................................................... xiii
CHAPTER 1: Introduction ............................................................................................................................. 1
1.1. Proglucagon .......................................................................................................................................... 2
1.2. Glucagon ............................................................................................................................................... 3
1.2.1. Glucagon synthesis and secretion ........................................................................................... 3
1.2.2. Glucagon metabolism and clearance ...................................................................................... 5
1.2.3. Glucagon action and the Gcgr ................................................................................................. 5
1.2.4. Glucagon and the Pathophysiology of Type 1 and 2 Diabetes ........................................... 15
1.2.5. Therapeutic potential of glucagon ........................................................................................ 16
1.3. Glucagon and the Cardiovascular System ....................................................................................... 20
1.3.1. Glucagon and blood vessels ................................................................................................... 21
1.3.2. Glucagon and calcium ions ................................................................................................... 22
1.3.3. Glucagon and blood pressure ............................................................................................... 22
1.3.4. Glucagon and cardiac ischemia ............................................................................................ 23
1.3.5. Glucagon and cardiac fuel metabolism ................................................................................ 25
1.3.6. Glucagon and myocardial oxygen consumption ................................................................. 26
1.4. Introduction to the incretins ............................................................................................................. 27
1.4.1. Incretin secretion and synthesis ............................................................................................ 27
vi
1.4.2. Incretin action in the pancreas ............................................................................................. 27
1.4.3. Incretin action in the adipose tissue ..................................................................................... 30
1.4.4. Incretin action in the liver ..................................................................................................... 31
1.4.5. GLP-1 and gastric emptying ................................................................................................. 31
1.4.6. Incretin action in the heart.................................................................................................... 32
1.4.7. Insight from incretin receptor knockout mice .................................................................... 34
1.5. Rationale & Hypotheses .................................................................................................................... 35
CHAPTER 2: Dual elimination of the glucagon and GLP-1receptors in mice reveals plasticity in the
incretin axis ................................................................................................................................................ 38
2.1 Research Summary ............................................................................................................................ 39
2.2 Introduction ........................................................................................................................................ 40
2.3 Materials and Methods ...................................................................................................................... 41
2.3.1 Animal studies ........................................................................................................................ 41
2.3.2 Peptides & drugs .................................................................................................................... 41
2.3.3 Assessment of food intake and energy expenditure ............................................................ 42
2.3.4 Tissue isolation and histological analysis ............................................................................. 42
2.3.5 Glucose, insulin tolerance test and measurement of plasma metabolites ......................... 43
2.3.6 Solid and liquid phase gastric emptying .............................................................................. 44
2.3.7 Islet isolation ........................................................................................................................... 44
2.3.8 Real-time qRT-PCR............................................................................................................... 45
2.3.9 Statistical Analysis ................................................................................................................. 45
2.4 Results ................................................................................................................................................. 45
2.4.1 Glp1r is not required for pancreas enlargement or α-cell hyperplasia in Gcgr-/-mice. ... 45
2.4.2 Disruption of Glp1r leads to increased fasting glycaemia in Gcgr-/-mice. ........................ 46
2.4.3 Elimination of Glp1r reverses improvements in i.p. glucose tolerance in Gcgr-/-mice. ... 51
vii
2.4.4 The GLP-1 receptor mediates reduced gastric emptying; however, oral glucose tolerance
remains improved independent of Glp1r in Gcgr-/-mice. ................................................... 51
2.4.5 Islets from Gcgr-/-:Glp1r-/-mice display increased sensitivity to GIP. .............................. 51
2.4.6 Plasticity of the incretin axis revealed through reduction of Gcgr action in Glp1r-/-
:Gipr-/-mice. ............................................................................................................................ 55
2.4.7 Gcgr-/-:Glp1r-/-mice display increased sensitivity to Gpr119 and Cckar agonists. ......... 68
2.5 Discussion............................................................................................................................................ 68
CHAPTER 3: Disruption of cardiomyocyte glucagon receptor signaling decreases flux through fatty
acid oxidation and enhances survival following ischemic injury .......................................................... 73
3.1 Research Summary ............................................................................................................................ 74
3.2 Introduction ........................................................................................................................................ 75
3.3 Materials and Methods ...................................................................................................................... 77
3.3.1 Animal studies ........................................................................................................................ 77
3.3.2 Peptide and drug injections: ................................................................................................. 77
3.3.3 Coronary artery ligation ....................................................................................................... 77
3.3.4 Ischemia reperfusion protocol .............................................................................................. 78
3.3.5 Blood pressure and heart rate measurements ..................................................................... 78
3.3.6 Myocardium metabolic profiling .......................................................................................... 78
3.3.7 Heart histology ....................................................................................................................... 78
3.3.8 Glucose tolerance and measurement of plasma insulin...................................................... 79
3.3.9 Western blotting ..................................................................................................................... 79
3.3.10 Heart RNA analyses ............................................................................................................... 80
3.3.11 PPARα Nuclear Translocation Immunoblotting in Primary Atrial Cardiomyocytes..... 80
3.3.12 Culture of HL-1 Atrial Cardiac Myocytes........................................................................... 80
3.3.13 PPARα Nuclear versus cytoplasmic expression .................................................................. 81
3.3.14 In vitro HL-1 cellular injury model ...................................................................................... 81
3.3.15 Statistical Analysis ................................................................................................................. 81
viii
3.4 Results: Glucagon impairs outcomes after myocardial infarction in a p38 MAPK-dependent
manner. ............................................................................................................................................... 82
3.4.2 Exogenous glucagon increases fatty acid oxidation in the ischemic heart ........................ 91
3.4.3 Partial deletion of whole body Gcgr signaling impairs survival following MI and
exacerbates LV remodeling ................................................................................................... 91
3.4.4 Loss of Gcgr signaling protects and glucagon perfusion worsens outcome from
ischemia/reperfusion injury in isolated mouse hearts. ....................................................... 91
3.4.5 Generation of cardiomyocyte-specific glucagon receptor knockout mice ........................ 94
3.4.6 Inactivation of Gcgr expression in cardiomyocytes increases survival after myocardial
infarction ................................................................................................................................. 94
3.4.7 Deletion of the cardiomyocyte Gcgr leads to reduced expression of genes and proteins
regulating fatty acid oxidation ............................................................................................ 105
3.4.8 Targeted metabolomics illustrates reduced fatty acid oxidation in normal and insulin-
resistant hearts with selective loss of Gcgr signaling ........................................................ 105
3.5 Discussion.......................................................................................................................................... 106
CHAPTER 4: General Discussion and Future Direction ......................................................................... 112
REFERENCES ............................................................................................................................................. 127
ix
LIST OF FIGURES
Figure 1.1. Structures of proglucagon ............................................................................................................ 2
Figure 1.2. Glucagon action in hepatic and extrahepatic tissues. .................................................................... 7
Figure 2.1. Body weight, food intake and energy expenditure…………………………………………...…47
Figure 2.2. Plasma levels of total GIP, active GLP-1, total GLP-2 and glucagon……………………..……48
Figure 2.3. Glp1r is not required for development of increased pancreas weight or α
Gcgr-/-mice. .......................................................................................................................................................... 49
Figure 2.4. Glp1r controls fasting and fed glycemia in Gcgr-/-mice. ........................................................... 50
Figure 2.5. Loss of Glp1r reverses improvements in i.p. glucose tolerance without altering insulin
sensitivity in Gcgr-/-mice. .................................................................................................................................... 53
Figure 2.6. Glp1r mediates reduced gastric emptying but not improved oral glucose tolerance in Gcgr-/-
mice. ...................................................................................................................................................................... 54
Figure 2.7. Function of GPCRs in isolated islets. .......................................................................................... 56
Figure 2.8. Gcgr-/-:Glp1r-/-mice exhibit enhanced sensitivity to [D-Ala2]GIP…………………...…. 57
Figure 2.9. Enteroinsular axis is maintained in DIRKO mice treated with Gcgr ASOs. ............................... 58
Figure 2.10. Expression of insulinotropic GPCRs in islets. ........................................................................... 59
Figure 2.11. GRP action in WT and knockout mice…………………………………………...……………60
Figure 2.12. PACAP action in WT and knockout mice……………………………………………….….....61
Figure 2.13. Gcgr-/-:Glp1r-/-mice exhibit enhanced sensitivity to the GPR119 agonist AR231453
(5mg/kg). ............................................................................................................................................................... 62
Figure 2.14. Gcgr-/-:Glp1r-/-mice exhibit enhanced sensitivity to the GPR119 agonist AR231453
(20mg/kg). ........................................................................................................................................................... 623
x
Figure 2.15. Gcgr-/-:Glp1r-/-mice exhibit increased sensitivity to CCK (9ug/kg)………………….... 64
Figure 2.16. Enhanced sensitivity to CCKAr ligand CCK (18ug/kg)………………………..………..65
Figure 2.17. Gut peptide gene expression in re-fed mice……………………………………………..66
Figure 2.18. Schematic of proposed model.................................................................................................... 67
Figure 3.1. Blood glucose and body weight before and after glucagon administration and LAD ligation. .. 84
Figure 3.2. Glucagon impairs survival after myocardial infarction in a p38 MAPK-dependent manner ...... 85
Figure 3.3. Glucagon impairs survival after myocardial infarction in a cardiac Gcgr-dependent manner ... 86
Figure 3.4. Glucagon has no effects onAd-βgal transfected HL-1 cell lines. ................................................ 87
Figure 3.5. Glucagon increases PPAR-αnuclear translocation, levels of cleaved caspase-3, and PDH
phosphorylation..................................................................................................................................................... 88
Figure 3.6. Glucagon increases long and medium chain fatty acid content in the heart. ............................... 90
Figure 3.7. Whole body Gcgr+/- mice have significantly improved survival following MI ........................ 92
Figure 3.8. Loss of Gcgr signaling protects whereas glucagon impairs recovery of ventricular developed
pressure after ischemia-reperfusion injury in the isolated heart ex vivo .............................................................. 93
Figure 3.9. Generation of mice and analysis of Gcgrexpression ................................................................... 95
Figure 3.10. Body weight, glucose tolerance and heart weight in mice with cardiac -specific inactivation of
the Gcgr ................................................................................................................................................................ 97
Figure 3.11. (A-C) Heart rate, systolic and diastolic blood pressure in αMHCCre
and GcgrCM-/-
mice were
measured. .............................................................................................................................................................. 98
Figure 3.12. Loss of cardiac Gcgr signaling enhances survival following MI and attenuates adverse LV
remodeling .......................................................................................................................................................... 100
xi
Figure 3.13. Selective loss of Gcgr signaling in cardiomyocytes lead to reduced expression of fatty
acid oxidation genes and proteins ....................................................................................................................... 100
Figure 3.14. Targeted metabolomics reveals reduced fatty acid oxidation in GcgrCM-/-
hearts ................... 102
Figure 3.15. Targeted metabolomics reveals reduced fatty acid oxidation in hearts from high fat fed mice
with loss of cardiac Gcgr signaling .................................................................................................................... 103
Figure 3.16. Schematic of proposed model .................................................................................................. 104

xii
LIST OF TABLES
Table 1. Heart rate and blood pressure measurements in GcgrCM-/-
mice.. ..................................................... 99
xiii
ABREVIATIONS
αIRKO α insulin receptor knockout
AMPK Adenosine monophosphate kinase
ANOVA Analysis of variance
ATP Adenosine triphosphate
ADP Adenosine diphosphate
AMP Adenosine monophosphate
AUC Area under the curve
ASOs Anti-sense oligonucleotides
N-glycosylation Asn-linked glycosylation
BAT Brown adipose tissue
BrDU Bromodeoxyuridine
Ca2+ Calcium
cAMP Cyclic adenosine monophosphate
CCK-8 Cholecystokinin
CHIP Chromatin immunoprecipitation
cDNA Complimentary DNA
CNS Central nervous system
CRE Cre recombinase
CREB Cyclic AMP response element-binding protein
C-terminal Carboxyl-terminus
db/db Leptin receptor knockout mice
DIRKO Double incretin knockout mice
DMEM Dulbecco's Modified Eagle Medium
DNA Deoxyribonucleic acid
DPPIV Dipeptidylpeptidase IV
EDTA Ethylenediaminetetraacetic acid
EGF Epidermal growth factor
EGFR Epidermal growth factor receptor
ELISA The enzyme-linked immunosorbent assay
Epac Exchange protein directly activated by cAMP
Ex (9-39) Exendin 9-39
Ex-4 Exendin-4
FBS Fetal Bovine Serum
FDA Federal drug administration
FGF21-/- Fibroblast growth factor 21 knockout mice
GABA Gamma aminobuteric acid
G protein G-protein coupled receptor 119
Gcgr ASO Glucagon receptor antisense oligonucleotide
GPCR Gprotein coupled receptor
GPR119 Gprotein coupled receptor 119
Gcg Glucagon
Gcgr Glucagon receptor
GI Gastrointestinal
GIP Gastric inhibitory peptide
xiv
GLP-1 Glucagon like-peptide 1
GLP-2 Glucagon like-peptide 2
Gcgr-/- Glucagon receptor knockout mice
Glp1r-/- Glucagon-like-peptide-1 receptor knockout mice
Gipr-/- Gastric inhibitory peptide receptor knockout mice
Gcgr-/-:Glp1r-/- Glucagon receptor and Glucagon-like peptide-1 receptor double knockout mice
Gsα Guanine nucleotide binding protein α
Gsα:Glp1r-/- Guanine nucleotide binding protein α and Glucagon-like peptide-1 receptor double
knockout mice
Gq Guanine nucleotide binding protein
GRP Gastrin releasing peptide
HFD High fat diet
IP-1 Intervening peptide-1
IP-2 Intervening peptide-2
IGF-1 Insulin growth factor-1
Isl-1 Islet-1
MBH Medial basal hypothalamus
MPGF Major proglucagon fragment
NEP24.11 Neutral endopeptidase 24.11
OXM Oxyntomodulin
PKA Protein kinase A
PKC Protein kinase C α
PI3k Protein inhibitory 3 kinase
PC2 Prohormone convertase 2
PC1/3 Prohormone convertase 1/3
K+
Potassium ion
RNA Ribonucleic acid
Rfx6 Regulatory Factor X 6
Sst Somatostatin
T1D Type 1 Diabetes
T2D Type 2 Diabetes
TCF7L2 Transcription factor 7-like 2
UCP2 Uncoupling protein 2
WAT White Adipose Tissue
xv
Methodological abbreviations
% Percent
BP Blood pressure
°C Degrees Celsius
Da Dalton
g Gram
h Hour(s)
l Litres
LVDP Left ventricular diastolic pressure
M Molar (moles/l)
min Minute(s)
mol Moles
sec Second(s)
U Units
wk Week
wt Weight
vol Volume
i.v. Intravenous
ip Intraperitoneal
s.c. Subcutaneous
Prefixes
k kilo- (x 103)
c centi- (x 10-2
)
m milli- (x 10-3
)
μ micro- (x 10-6
)
n nano- (x 10-9
)
p pico- (x 10-12
)

1
CHAPTER 1: Introduction
CHAPTER 1: Introduction
2
1.1. Proglucagon
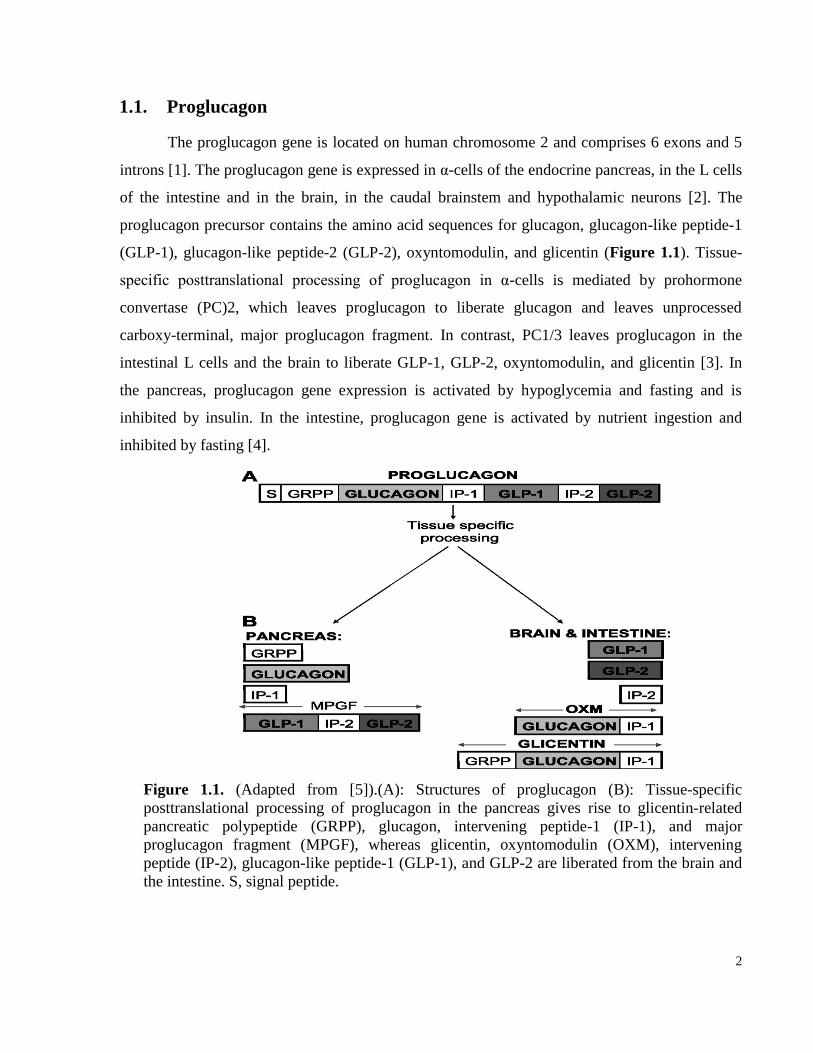
The proglucagon gene is located on human chromosome 2 and comprises 6 exons and 5
introns [1]. The proglucagon gene is expressed in α-cells of the endocrine pancreas, in the L cells
of the intestine and in the brain, in the caudal brainstem and hypothalamic neurons [2]. The
proglucagon precursor contains the amino acid sequences for glucagon, glucagon-like peptide-1
(GLP-1), glucagon-like peptide-2 (GLP-2), oxyntomodulin, and glicentin (Figure 1.1). Tissue-
specific posttranslational processing of proglucagon in α-cells is mediated by prohormone
convertase (PC)2, which leaves proglucagon to liberate glucagon and leaves unprocessed
carboxy-terminal, major proglucagon fragment. In contrast, PC1/3 leaves proglucagon in the
intestinal L cells and the brain to liberate GLP-1, GLP-2, oxyntomodulin, and glicentin [3]. In
the pancreas, proglucagon gene expression is activated by hypoglycemia and fasting and is
inhibited by insulin. In the intestine, proglucagon gene is activated by nutrient ingestion and
inhibited by fasting [4].
Figure 1.1. (Adapted from [5]).(A): Structures of proglucagon (B): Tissue-specific
posttranslational processing of proglucagon in the pancreas gives rise to glicentin-related
pancreatic polypeptide (GRPP), glucagon, intervening peptide-1 (IP-1), and major
proglucagon fragment (MPGF), whereas glicentin, oxyntomodulin (OXM), intervening
peptide (IP-2), glucagon-like peptide-1 (GLP-1), and GLP-2 are liberated from the brain and
the intestine. S, signal peptide.
3
1.2. Glucagon
1.2.1. Glucagon synthesis and secretion
Glucagon is a 29-amino acid peptide hormone encoded within a single proglucagon
precursor. Studies with PC2 knockout mice showed how essential PC2 was for glucagon as
deletion of PC2 led to hypoglycemia and α-cell hyperplasia. These phenotypes were solely the
result of lack of glucagon as replacing glucagon by osmotic mini-pump normalized the
hypoglycemia and reduced the α-cell hyperplasia [6].
Glucagon secretion by α-cells is highly regulated and is achieved by specific electrical
machinery in the α-cells (ion channels). Multiple stimuli activate ion channels in the α-cells but
the most important stimuli are glucose and insulin [7]. Low glucose levels activate specific
channels in the pancreatic alpha cells, in particular the ATP-sensitive K+ (KATP) channel [8], to
generate action potentials of sodium and calcium currents, leading to glucagon secretion.
However, whether the modulating effect of glucose on glucagon secretion is predominantly
direct or indirect remains uncertain. Studies conducted with mouse and human α-cells show that
glucose can directly inhibit glucagon secretion. In contrast, studies with rat α-cells show that
glucose inhibits glucagon secretion in a paracrine manner [7]. High glucose mediated glucagon
suppression has been shown to be dependent on glucose stimulated somatostatin secretion.
Global deletion of somatostatin gene (Sst) in mice has been shown to increase basal glucagon
and insulin levels [9, 10]. Furthermore, high glucose failed to inhibit glucagon levels in islets
from Sst deleted mice suggesting the notion that somatostatin might be involved in high glucose
mediated inhibition of glucagon secretion [10]. Moreover, β-cell-derived products such as
insulin, GABA, and zinc can also inhibit glucagon secretion [11]. Many in vivo and ex-vivo
studies have demonstrated that insulin plays a pivotal role in regulation of glucagon secretion
[12-15]. Exogenous insulin administration led to suppression of glucagon secretion in
insulinopenic animal models, and infusion of anti-insulin antibody increased glucagon release.
The first direct genetic evidence that shows the significance of physiological insulin signaling in
inhibition of glucagon secretion in α-cells comes from studies conducted with the α-cell specific
insulin receptor knockout (αIRKO) mice. Deletion of insulin signaling in the αIRKO mice leads
to glucose intolerance, hyperglycemia, and increased plasma glucagon levels in the fed state.
Additionally, increased glucagon secretion is also observed following induction with L-arginine
4
in vivo and ex-vivo in whole pancreas perfusion suggesting deletion of insulin receptor from α-
cells leads to elevated glucagon levels. Furthermore, streptozotocin (STZ) treatment of αIRKO
mice leads to even higher plasma glucagon levels compared to glucagon levels in littermate
control mice. This suggests insulin receptor signaling on α-cells prevents glucagon secretion
during hyperglycemia and deletion of insulin receptor signaling from α-cells leads to elevated
glucagon secretion [16]. The mechanisms responsible for insulin-mediated inhibition of α-cell
glucagon secretion may involve insulin-mediated activation of GABA receptor and translocation
to the cell surface in an Akt-dependent manner [17]. Similarly, secretion of zinc from β-cells
appears to be important for suppression of glucagon secretion, and reduced zinc secretion
promotes enhanced glucagon secretion in response to hypoglycemia [18]. Nevertheless,
experiments using rat and human islets demonstrate that glucose-mediated suppression of
glucagon secretion may occur independently of GABA or zinc and requires functional KATP
channels [19]. Somatostatin inhibits glucagon secretion by inhibition of adenylate cyclase and
cAMP production, and genetic deletion of the somatostatin receptor subtype 2 is associated with
mild hyperglucagonemia and defective glucose- and somatostatin-mediated suppression of
glucagon secretion in isolated mice islets in vitro [20]. Similarly, the incretin hormone GLP-1
inhibits glucagon secretion in a glucose-dependent manner through mechanisms requiring the
somatostatin receptor subtype 2 [21]. Unlike GLP-1, the incretin hormone, Gastric inhibitory
polypeptide (GIP) has been shown to stimulate glucagon secretion under hyperglycemic
conditions [22]. In human subjects, infusion of GIP (20 ng/kg/min) led to elevation of glucagon
in plasma levels, and this resulted in hyperglycemia during a meal test. GIP mediated glucagon
secretion in α-cells can be direct as GIP receptors have been detected in human and rodent α-
cells [22].
Recent studies suggest uncoupling protein 2 (Ucp2) involvements in regulation of
glucagon secretion. UCP2 expression is increased in nutrient deprived human islets.
Additionally, uncoupling protein 2 knockout (Ucp2-/-) mice show a blunted glucagon response
in vivo 30 minutes after an insulin tolerance test. Furthermore, islets from Ucp2-/- mice have
impaired glucagon secretion under high to low glucose conditions compared to islets from
control mice [23]. Therefore, these studies suggest Ucp-2 plays an important role in normal
glucagon secretion.
5
1.2.2. Glucagon metabolism and clearance
Glucagon is metabolized by the membrane-bound zinc metallopeptidase, neutral
endopeptidase 24.11 (NEP 24.11) in vitro. NEP24.11 not only metabolizes glucagon but also
GLP-1 (7-36amide) [24]. Studies have shown that inhibition of NEP24.11 leads to an increase in
circulating levels of endogenously and exogenously administered glucagon in anesthetized pigs
[25]. This suggests NEP 24.11 plays an important role in glucagon metabolism. The mechanism
of glucagon clearance is not well understood in vivo, however, studies have found most cleaved
glucagon product in the kidney and very little in the liver [26]. Glucagon is cleaved by enzymes
at the glomerular brush border membrane of the proximal tubule prior to filtration out of the
kidney [27, 28]. Dipeptidyl peptidase-4 (DPPIV) is highly expressed in the circulation, kidney,
and to a lesser extent in the liver. Incubation of glucagon with purified porcine kidney DPPIV
leads to hydrolysis of glucagon (1-29) to glucagon (3-29), and glucagon (5-29) in vitro and in
human serum; these different processed glucagon fragments have been shown to be inactive
forms of glucagon as they fail to cause hyperglycemia in Wister rats upon intraperitoneal
injection [29]. Additionally, glucagon is processed by an endopeptidase in the circulation and by
target tissues such as the pancreas, the liver or the heart to liberate mini-glucagon (19-29) [30,
31]. A separate receptor for mini-glucagon has not been identified thus far, however mini-
glucagon has been shown to have biological function in the liver, the heart, and the pancreas [31,
32].
1.2.3. Glucagon action and the Gcgr
Glucagon receptor signaling
The major biological action of glucagon is to counteract the actions of insulin and
maintain normoglycemia during the fasting state by inducing hepatic glucose production.
Glucagon exerts its action on target tissues through activation of the glucagon receptor (Gcgr), a
G protein-coupled receptor, member of the class II G protein-coupled receptor superfamily [33].
Gcgr activation leads to signal transduction by G proteins (Gsα and Gq), whereby Gsα activates
adenylate cyclase, which causes cAMP production, resulting in an increase in levels of protein
kinase A. Gq activation leads to phospholipase, C-mediated increases in intracellular calcium
levels. Gcgr signaling in the liver results in increased hepatic glucose production by induction of
6
glycogenolysis and gluconeogenesis along with inhibition of glycogenesis [34]. The actions of
glucagon to promote increased hepatic glucose production are extremely rapid and reflect
changes in the activity of enzymes regulating gluconeogenesis and glycogenolysis. Glucagon-
stimulated increases in cAMP lead to activation of glycogen phosphorylase and inhibition of
glycogen synthase. The actions of glucagon to control gluconeogenesis are mediated through
coordinate regulation of the cAMP-regulated binding protein, regulated transcription coactivator
2, histone acetyltransferase p300, and the nutrient-sensing deacetylase sirtuin 1, resulting in
increased expression of genes regulating gluconeogenesis [35]. The Gcgr is also expressed in
extrahepatic tissues, which includes the heart, the intestinal smooth muscle, the kidney, the brain,
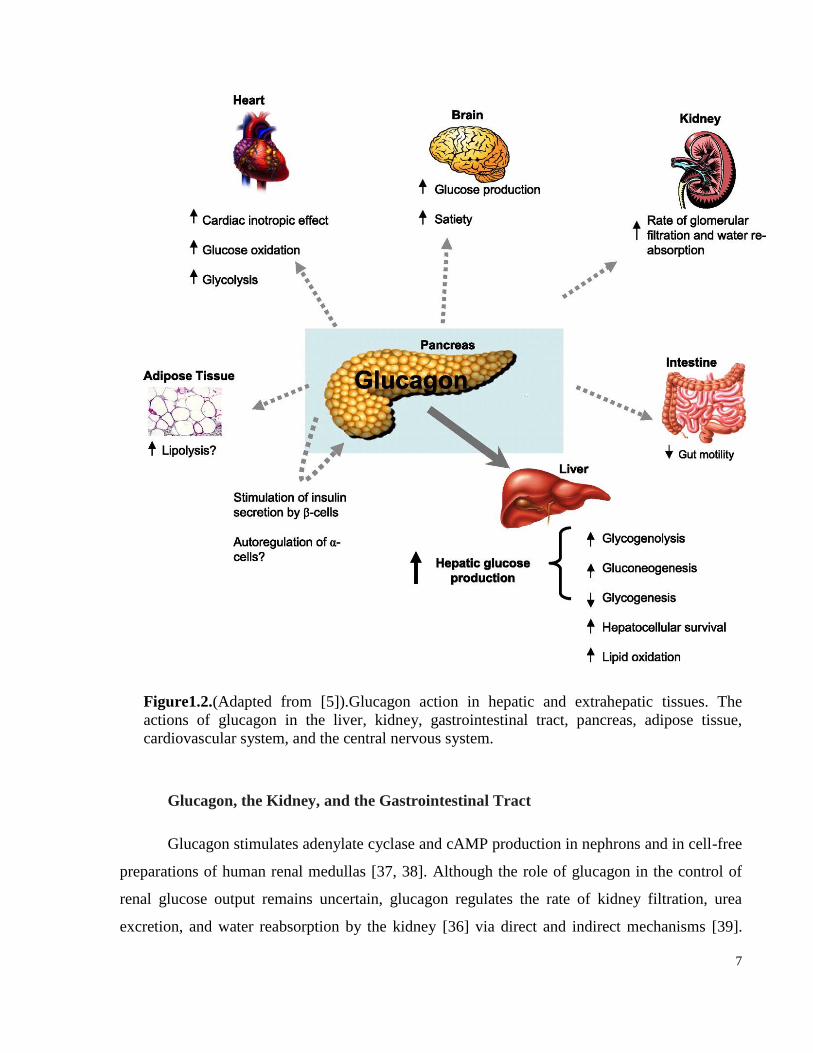
and the adipose tissue [36] (Figure 1.2).
7
Figure1.2.(Adapted from [5]).Glucagon action in hepatic and extrahepatic tissues. The
actions of glucagon in the liver, kidney, gastrointestinal tract, pancreas, adipose tissue,
cardiovascular system, and the central nervous system.
Glucagon, the Kidney, and the Gastrointestinal Tract
Glucagon stimulates adenylate cyclase and cAMP production in nephrons and in cell-free
preparations of human renal medullas [37, 38]. Although the role of glucagon in the control of
renal glucose output remains uncertain, glucagon regulates the rate of kidney filtration, urea
excretion, and water reabsorption by the kidney [36] via direct and indirect mechanisms [39].
8
Paradoxically, long-term infusion of glucagon in mice leads to kidney injury through the
development of hypertension, hypertrophy, and increased proliferation of mesangial cells [40].
Although the Gcgr is expressed in the gut, where it regulates motility, very little is known about
the physiological role of glucagon in the gut [41, 42]. However, pharmacological doses of
glucagon infusion in men have been shown to delay gastric emptying following a radiolabelled
meal in double-blind placebo-controlled study. Gastric release of nutrition was suppressed
during the first 60 min of glucagon infusion, and an increased insulin release was also observed
[43]. The mechanism through which glucagon inhibits gastric emptying is unknown.
Glucagon and the Endocrine Pancreas
Gcgr immunoreactivity and mRNA expression have been detected predominantly in β-
cells from rodent pancreas; however, subsets of α- and δ-cells also express the Gcgr [44].
Additionally, glucagon has been shown to regulate cAMP production in β-cells. However,
glucagon-mediated cAMP production in β-cells is less potent than that induced by the incretin
hormones GLP-1 and gastric inhibitory polypeptide (GIP) [45]. Nevertheless, glucagon induces
insulin secretion in human subjects. Moreover, insulin secretion is increased from perfused
pancreas and isolated β-cells in the presence of glucagon [44, 45]. The stimulatory actions of
glucagon on the islet’s β-cell may be mediated through dual activation of both the Gcgr and the
GLP-1 receptor (Glp1r) [46]. The research group headed by Gelling et al generated transgenic
mice overexpressing the Gcgr in pancreatic β-cells using the rat insulin promoter to understand
the role of the Gcgr in the β-cells and found these mice to have increased insulin secretion,
pancreatic insulin content, and β-cell mass. After high fat feeding, these mice were partially
protected against hyperglycemia and impaired glucose tolerance [47]. However, the molecular
mechanism(s) and physiological importance of glucagon-stimulated insulin secretion require
further explanation. Even less is known about the role of the Gcgr in α-cells; yet, several studies
have demonstrated Gcgr expression in at least a subset of rodent α-cells [44, 48]. Glucagon
stimulates cAMP production in a dose-dependent manner from rat and mouse α-cells and
increases α-cell exocytosis in a PKA-dependent manner, suggesting that it may regulate its own
secretion [44, 48]. Furthermore, glucagon is also important for α-cell proliferation and survival
as the PC2 knockout mice that lack glucagon action develop α-cell hyperplasia, and the
replacment of glucagon using mini-pump reduces α-cell hyperplasia. Similarly, Gcgr whole body
9
knockout mice develop α-cell hyperplasia. The effects of glucagon on α-cell proliferation may
not be direct as Longuet et al has elegantly showed that disruption of hepatic Gcgr signaling
leads to α-cell hyperplasia [49]. Furthermore, transplanting islets from wild-type mice into either
Gcgr-/- recipients, or liver specific Gcgr knockout recipients, results in proliferation of islet α-
cells underneath the kidney capsule. These findings imply that interruption of the liver glucagon
receptor pathways regulates islet α-cell proliferation independent of the normal islet localization
and pancreatic location. Nonetheless, the importance of direct glucagon action on α-cells is
uncertain.
Glucagon Action in the Brain
The proglucagon gene is expressed in the brainstem and, to a lesser extent, in the
hypothalamus, and different projections distribute proglucagon-derived peptides to diverse brain
regions [50, 51]. Glucagon binds to the brain membranes and to the mouse astrocytes and
stimulates adenylate cyclase and cAMP production respectively [52, 53]. Intracerebral
administration of pharmacological levels of glucagon in the brain produces dose-dependent
hyperglycemia in rodents through mechanisms requiring cholinergic and α-adrenergic neural
pathways [54, 55]. Glucagon infusion in the central nervous system also inhibits food intake, and
the anorectic actions of glucagon require functional vagal afferents [56, 57]. Moreover,
neutralization of endogenous glucagon via intraportal infusion of glucagon antibodies increases
meal size in normal rats, effects that are abolished in rats with selective hepatic vagotomy [58].
The satiety-promoting effects of glucagon may also involve suppression of ghrelin secretion,
actions that require an intact hypothalamic-pituitary axis, and ghrelin has been shown to regulate
feeding behavior, suggesting that the satiety effect of glucagon can be mediated through ghrelin
[59].
Recently, the research group headed by Mighiu et al explored the central role of glucagon
signaling in regulation of hepatic glucose production in mice and rats using mediobasal
hypothalamus (MBH) infusion of glucagon intravenously during a pancreatic euglycemic clamp.
The glucose was maintained at euglycemic level by continuous infusion, and insulinemia was
maintained, leading to inhibition of hepatic glucose production [60]. Furthermore, the inhibitory
effects of glucagon infusion on hepatic glucose production were dependent on brain PKA
activation [60]. Moreover, these effects of glucagon were absent in Gcgr-/- mice with infusion of
10
central glucagon and in rats treated with inhibitors of PKA signaling in the MBH or in rats after
hepatic vagotomy. These findings suggest central glucagon-mediated regulation of hepatic
glucose production requires central PKA signaling and neuronal signaling between the brain and
the liver. In addition, rats fed a high fat diet had higher plasma glucose concentrations and had
impaired MBH glucagon signaling. Therefore, this study suggests that hypothalamic glucagon
signaling is essential for inhibition of hepatic glucose production [60].
Glucagon and food intake
During a mixed meal glucagon levels increase higher than basal levels but lower than
fasting levels, and injecting glucagon antiserum before a meal increases food intake suggesting
elevated levels of endogenous glucagon during a meal may contribute to satiety [61-64]. A
substantial number of studies in rodents and humans have shown that pharmacological doses of
glucagon lead to reduced feeling of hunger and therefore reduced food intake [65-68]. Reduction
in food intake has been postulated to be solely a result of glucagon-mediated satiety and not
alteration in food taste as studies where rats are given glucagon before a meal show significant
reduction in overall meal size without alteration of inter-meal interval [69]. Additionally,
grooming and exploratory behavior is unaltered in glucagon-treated rats suggesting glucagon is
not causing toxicity which is resulting in reduced food intake [69]. Based on these studies
glucagon has been postulated to be a potent satiety factor.
Glucagon-mediated satiety may be mediated by vagal afferent fibers located in the
hepatic branch that transmits signal to the CNS [70]. This finding emerges from studies where
glucagon is administered via the hepatic portal vein in rats with sham-vagotomy leading to
reduced food intake. However, in rats with bilateral subdiaphagmatic truncal vagotomy glucagon
fails to reduce food intake [70-72]. Additionally, complete vagotomy ameliorates glucagon’s
suppression on food intake and sparing the vagal hepatic branch preserves glucagon-mediated
satiety effects [71].
The role of central glucagon receptor signaling in regulation of food intake is unknown.
However, high levels of glucagon immunoreactivity have been found in the hypothalamus, and
administration of glucagon into the third ventricle region of the brain in rats results in more
potent reduction in food intake compared to peripherally administered glucagon [56, 73, 74]. The
importance of central Gcgr signaling in food intake is not well understood and requires further
11
studies.
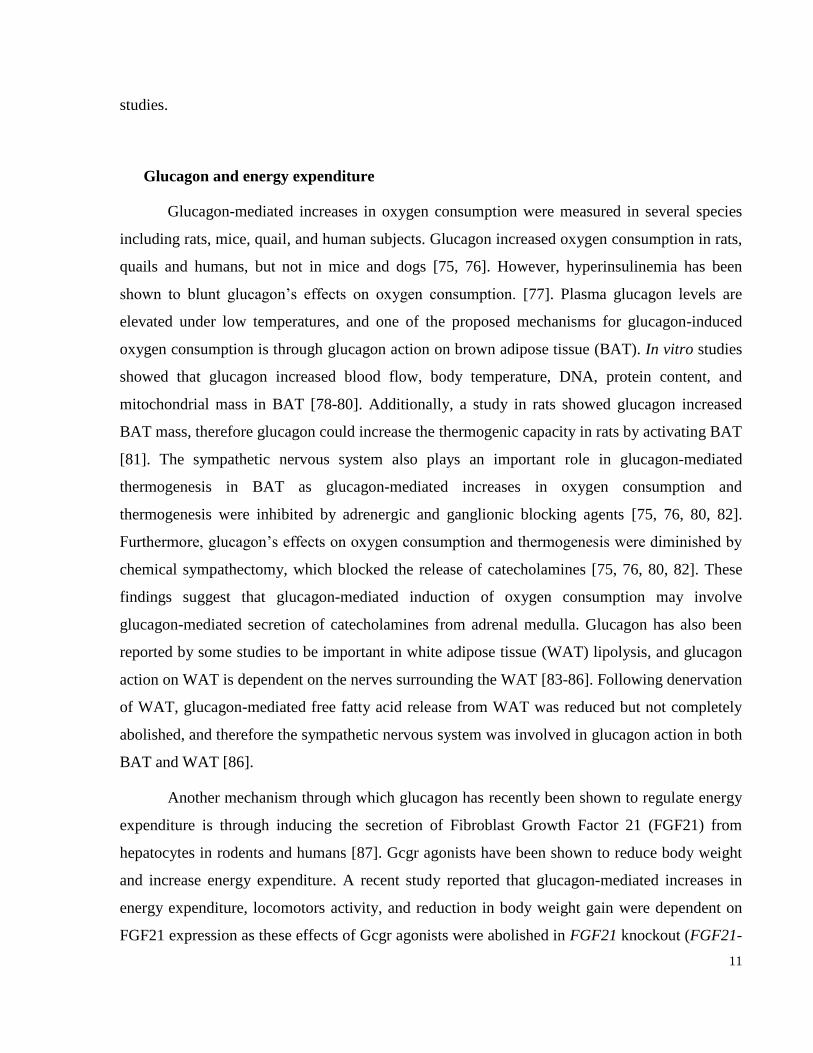
Glucagon and energy expenditure
Glucagon-mediated increases in oxygen consumption were measured in several species
including rats, mice, quail, and human subjects. Glucagon increased oxygen consumption in rats,
quails and humans, but not in mice and dogs [75, 76]. However, hyperinsulinemia has been
shown to blunt glucagon’s effects on oxygen consumption. [77]. Plasma glucagon levels are
elevated under low temperatures, and one of the proposed mechanisms for glucagon-induced
oxygen consumption is through glucagon action on brown adipose tissue (BAT). In vitro studies
showed that glucagon increased blood flow, body temperature, DNA, protein content, and
mitochondrial mass in BAT [78-80]. Additionally, a study in rats showed glucagon increased
BAT mass, therefore glucagon could increase the thermogenic capacity in rats by activating BAT
[81]. The sympathetic nervous system also plays an important role in glucagon-mediated
thermogenesis in BAT as glucagon-mediated increases in oxygen consumption and
thermogenesis were inhibited by adrenergic and ganglionic blocking agents [75, 76, 80, 82].
Furthermore, glucagon’s effects on oxygen consumption and thermogenesis were diminished by
chemical sympathectomy, which blocked the release of catecholamines [75, 76, 80, 82]. These
findings suggest that glucagon-mediated induction of oxygen consumption may involve
glucagon-mediated secretion of catecholamines from adrenal medulla. Glucagon has also been
reported by some studies to be important in white adipose tissue (WAT) lipolysis, and glucagon
action on WAT is dependent on the nerves surrounding the WAT [83-86]. Following denervation
of WAT, glucagon-mediated free fatty acid release from WAT was reduced but not completely
abolished, and therefore the sympathetic nervous system was involved in glucagon action in both
BAT and WAT [86].
Another mechanism through which glucagon has recently been shown to regulate energy
expenditure is through inducing the secretion of Fibroblast Growth Factor 21 (FGF21) from
hepatocytes in rodents and humans [87]. Gcgr agonists have been shown to reduce body weight
and increase energy expenditure. A recent study reported that glucagon-mediated increases in
energy expenditure, locomotors activity, and reduction in body weight gain were dependent on
FGF21 expression as these effects of Gcgr agonists were abolished in FGF21 knockout (FGF21-
12
/-) mice. This study suggested that FGF21 signaling was essential in regulation of energy
expenditure by glucagon [87].
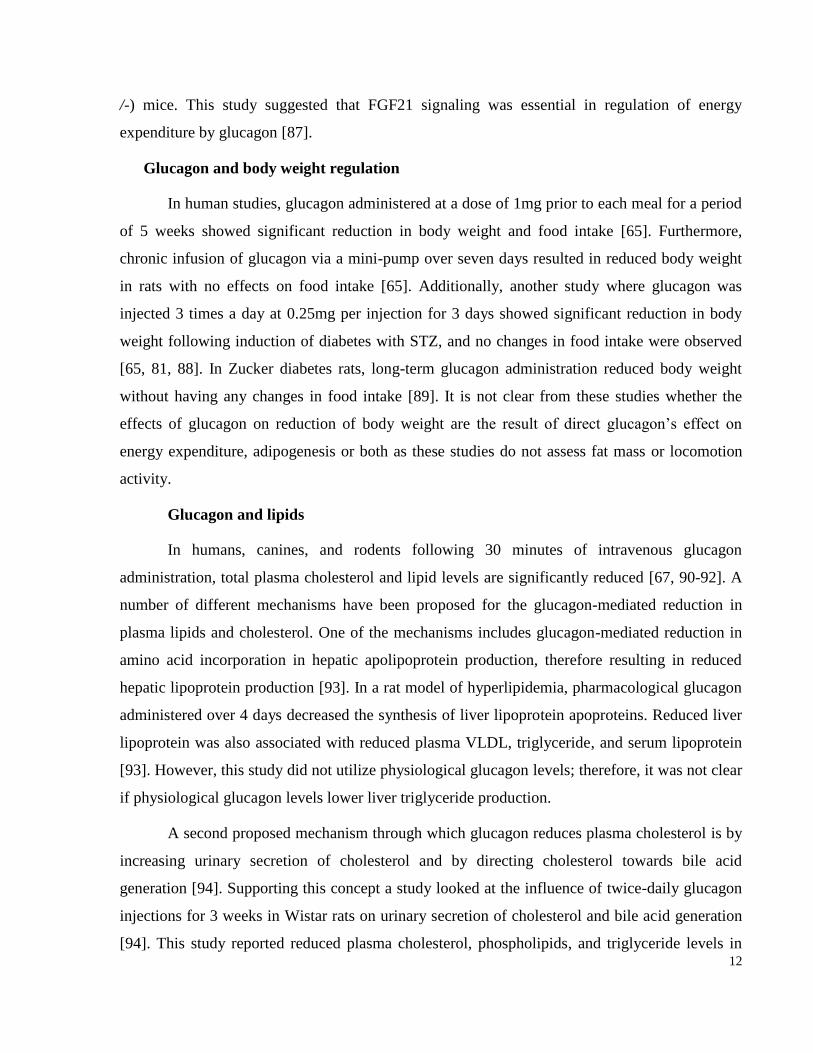
Glucagon and body weight regulation
In human studies, glucagon administered at a dose of 1mg prior to each meal for a period
of 5 weeks showed significant reduction in body weight and food intake [65]. Furthermore,
chronic infusion of glucagon via a mini-pump over seven days resulted in reduced body weight
in rats with no effects on food intake [65]. Additionally, another study where glucagon was
injected 3 times a day at 0.25mg per injection for 3 days showed significant reduction in body
weight following induction of diabetes with STZ, and no changes in food intake were observed
[65, 81, 88]. In Zucker diabetes rats, long-term glucagon administration reduced body weight
without having any changes in food intake [89]. It is not clear from these studies whether the
effects of glucagon on reduction of body weight are the result of direct glucagon’s effect on
energy expenditure, adipogenesis or both as these studies do not assess fat mass or locomotion
activity.
Glucagon and lipids
In humans, canines, and rodents following 30 minutes of intravenous glucagon
administration, total plasma cholesterol and lipid levels are significantly reduced [67, 90-92]. A
number of different mechanisms have been proposed for the glucagon-mediated reduction in
plasma lipids and cholesterol. One of the mechanisms includes glucagon-mediated reduction in
amino acid incorporation in hepatic apolipoprotein production, therefore resulting in reduced
hepatic lipoprotein production [93]. In a rat model of hyperlipidemia, pharmacological glucagon
administered over 4 days decreased the synthesis of liver lipoprotein apoproteins. Reduced liver
lipoprotein was also associated with reduced plasma VLDL, triglyceride, and serum lipoprotein
[93]. However, this study did not utilize physiological glucagon levels; therefore, it was not clear
if physiological glucagon levels lower liver triglyceride production.
A second proposed mechanism through which glucagon reduces plasma cholesterol is by
increasing urinary secretion of cholesterol and by directing cholesterol towards bile acid
generation [94]. Supporting this concept a study looked at the influence of twice-daily glucagon
injections for 3 weeks in Wistar rats on urinary secretion of cholesterol and bile acid generation
[94]. This study reported reduced plasma cholesterol, phospholipids, and triglyceride levels in
13
addition to reduced plasma glucose and insulin levels following chronic glucagon administration.
Interestingly, chronic glucagon administration in the study did not lead to hyperglycemia or
reduced liver triglyceride production. However, this study reported increased bile acid synthesis
in the liver and increased urinary secretion of cholesterol. Elevated bile acids following
glucagon treatment may be preventing hyperglycemia as studies have previously reported that
bile acids can improve glucose homeostasis [94]([95].
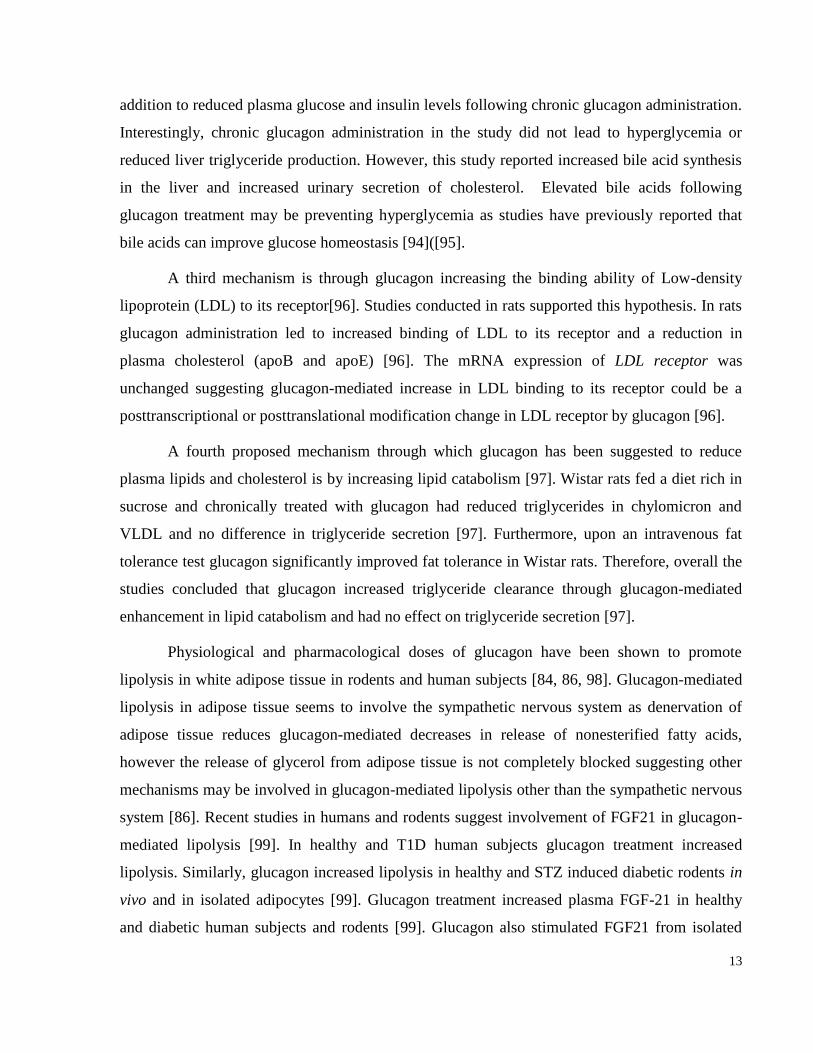
A third mechanism is through glucagon increasing the binding ability of Low-density
lipoprotein (LDL) to its receptor[96]. Studies conducted in rats supported this hypothesis. In rats
glucagon administration led to increased binding of LDL to its receptor and a reduction in
plasma cholesterol (apoB and apoE) [96]. The mRNA expression of LDL receptor was
unchanged suggesting glucagon-mediated increase in LDL binding to its receptor could be a
posttranscriptional or posttranslational modification change in LDL receptor by glucagon [96].
A fourth proposed mechanism through which glucagon has been suggested to reduce
plasma lipids and cholesterol is by increasing lipid catabolism [97]. Wistar rats fed a diet rich in
sucrose and chronically treated with glucagon had reduced triglycerides in chylomicron and
VLDL and no difference in triglyceride secretion [97]. Furthermore, upon an intravenous fat
tolerance test glucagon significantly improved fat tolerance in Wistar rats. Therefore, overall the
studies concluded that glucagon increased triglyceride clearance through glucagon-mediated
enhancement in lipid catabolism and had no effect on triglyceride secretion [97].
Physiological and pharmacological doses of glucagon have been shown to promote
lipolysis in white adipose tissue in rodents and human subjects [84, 86, 98]. Glucagon-mediated
lipolysis in adipose tissue seems to involve the sympathetic nervous system as denervation of
adipose tissue reduces glucagon-mediated decreases in release of nonesterified fatty acids,
however the release of glycerol from adipose tissue is not completely blocked suggesting other
mechanisms may be involved in glucagon-mediated lipolysis other than the sympathetic nervous
system [86]. Recent studies in humans and rodents suggest involvement of FGF21 in glucagon-
mediated lipolysis [99]. In healthy and T1D human subjects glucagon treatment increased
lipolysis. Similarly, glucagon increased lipolysis in healthy and STZ induced diabetic rodents in
vivo and in isolated adipocytes [99]. Glucagon treatment increased plasma FGF-21 in healthy
and diabetic human subjects and rodents [99]. Glucagon also stimulated FGF21 from isolated
14
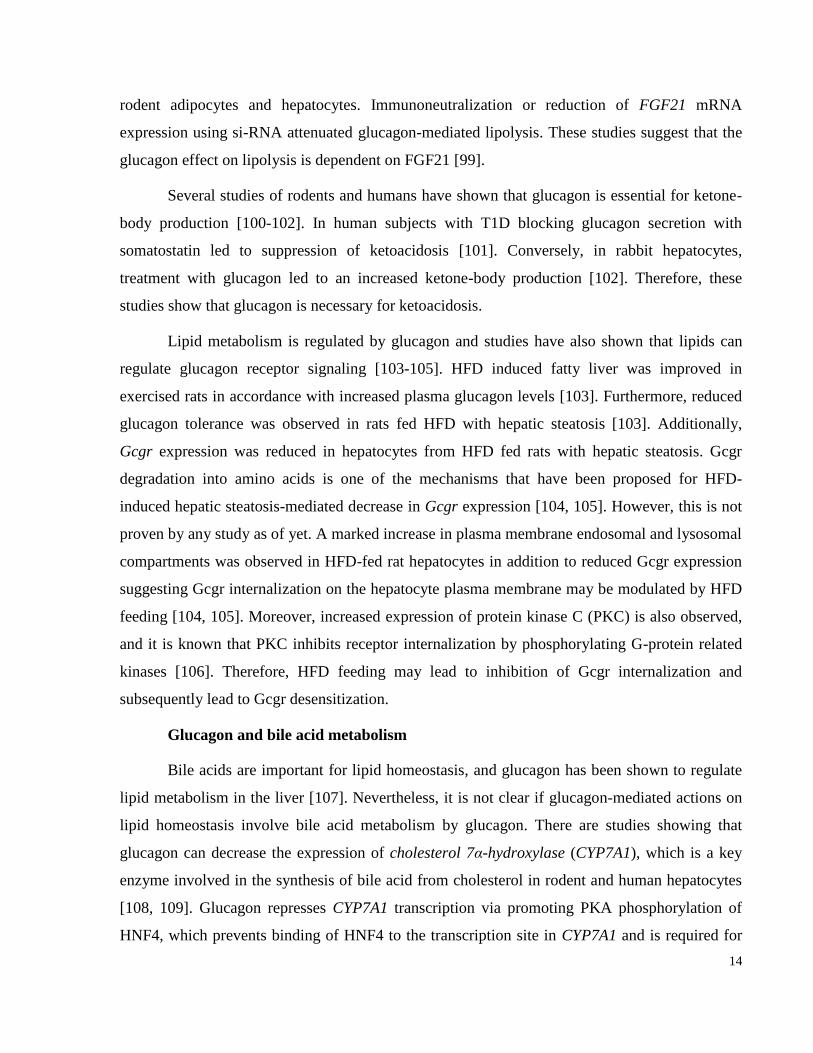
rodent adipocytes and hepatocytes. Immunoneutralization or reduction of FGF21 mRNA
expression using si-RNA attenuated glucagon-mediated lipolysis. These studies suggest that the
glucagon effect on lipolysis is dependent on FGF21 [99].
Several studies of rodents and humans have shown that glucagon is essential for ketone-
body production [100-102]. In human subjects with T1D blocking glucagon secretion with
somatostatin led to suppression of ketoacidosis [101]. Conversely, in rabbit hepatocytes,
treatment with glucagon led to an increased ketone-body production [102]. Therefore, these
studies show that glucagon is necessary for ketoacidosis.
Lipid metabolism is regulated by glucagon and studies have also shown that lipids can
regulate glucagon receptor signaling [103-105]. HFD induced fatty liver was improved in
exercised rats in accordance with increased plasma glucagon levels [103]. Furthermore, reduced
glucagon tolerance was observed in rats fed HFD with hepatic steatosis [103]. Additionally,
Gcgr expression was reduced in hepatocytes from HFD fed rats with hepatic steatosis. Gcgr
degradation into amino acids is one of the mechanisms that have been proposed for HFD-
induced hepatic steatosis-mediated decrease in Gcgr expression [104, 105]. However, this is not
proven by any study as of yet. A marked increase in plasma membrane endosomal and lysosomal
compartments was observed in HFD-fed rat hepatocytes in addition to reduced Gcgr expression
suggesting Gcgr internalization on the hepatocyte plasma membrane may be modulated by HFD
feeding [104, 105]. Moreover, increased expression of protein kinase C (PKC) is also observed,
and it is known that PKC inhibits receptor internalization by phosphorylating G-protein related
kinases [106]. Therefore, HFD feeding may lead to inhibition of Gcgr internalization and
subsequently lead to Gcgr desensitization.
Glucagon and bile acid metabolism
Bile acids are important for lipid homeostasis, and glucagon has been shown to regulate
lipid metabolism in the liver [107]. Nevertheless, it is not clear if glucagon-mediated actions on
lipid homeostasis involve bile acid metabolism by glucagon. There are studies showing that
glucagon can decrease the expression of cholesterol 7α-hydroxylase (CYP7A1), which is a key
enzyme involved in the synthesis of bile acid from cholesterol in rodent and human hepatocytes
[108, 109]. Glucagon represses CYP7A1 transcription via promoting PKA phosphorylation of
HNF4, which prevents binding of HNF4 to the transcription site in CYP7A1 and is required for
15
the transcriptional activation of CYP7A1 [109]. However, these studies did not measure plasma
or intestinal level of bile acids; therefore it is not clear if glucagon-mediated reduction of
CYP7A1 has any impact on plasma bile acid levels.
1.2.4. Glucagon and the Pathophysiology of Type 1 and 2 Diabetes
Glucagon and Type 1 Diabetes
Studies have reported perfusion of glucose in rat pancreas with anti-insulin serum or
normal guinea pig serum results in significant rise in glucagon levels. Terminating the perfusion
of anti-insulin serum results in glucagon levels return them back to baseline values. This
suggests that intraislet insulin levels are important for regulation of α-cell glucagon secretion
[15]. In subjects with Type 1 Diabetes (T1D) it has been observed that in the absence of insulin
signaling α-cell numbers increase; this has been suggested to contribute to the inappropriate
hyperglucagonemia in T1D subjects [110]. A study conducted by Lee et al[111] showed Gcgr
knockout mice did not develop T1D and diabetes complications, such as hyperglycemia, ketosis,
and cachexia, despite complete depletion of β-cells by streptozotocin treatment. These studies
suggest that without glucagon signaling some of the metabolic complications of T1D do not
occur. Therefore, the hepatic actions of glucagon such as glycogenolysis, gluconeogenesis,
cytogenesis, and hypercatabolism are enhanced in the absence of insulin, which may be
contributing to the ketoacidosis, cachexia, coma, and death observed in T1D [111].
Glucagon and Type 2 Diabetes
Type 2 Diabetes is characterized by impaired insulin secretion and/or action, and many
subjects also exhibit inappropriate levels of circulating glucagon in the fasting and postprandial
state. An increase in the glucagon/insulin ratio is likely an important determinant of the
hyperglycemia seen in Type 2 Diabetes patients [112-114]. Consistent with the importance of
glucagon for fasting hyperglycemia, infusion of low doses of glucagon leads to the development
of hyperglycemia, whereas suppression of glucagon secretion in the fasting state by somatostatin
infusion significantly reduces hepatic glucose production [112, 115]. Lack of suppression of
postprandial glucagon secretion in subjects with T2D also plays an important role in the
pathogenesis of postprandial hyperglycemia [101, 116, 117]. The molecular mechanisms
16
responsible for dysregulation of α-cell glucagon secretion in diabetic subjects remain unclear but
may include impaired glucose sensing by α-cells and/or resistance of α-cells to the inhibitory
actions of insulin or other β-cell secretory products such as zinc or GABA.
1.2.5. Therapeutic potential of glucagon
Reduction of Gcgr Signaling for the Treatment of Diabetes
Considerable preclinical evidence supports targeting of glucagon action as an effective
approach to reduction of hyperglycemia. Immunoneutralization of glucagon with a monoclonal
antibody produces significant improvements in plasma glucose in rats with streptozotocin-
induced diabetes [118]. Similarly, glucagon antibodies markedly reduce hepatic glucose
production and reduce the extent of hyperglycemia in normal and diabetic rabbits [119].
Additionally, immunoneutralization of plasma glucagon decreases hepatic glucose output and
reduces glucose and HbA1c in ob/ob mice, providing further evidence for the role of glucagon in
the pathogenesis of diabetic hyperglycemia [120]. Both peptide and nonpeptide glucagon
receptor antagonists have been generated for use as experimental tools to block glucagon action
[34]. Consistent with data from glucagon immunoneutralization studies, Gcgr antagonists lower
blood glucose in response to exogenous glucagon administration in nondiabetic rodents and
block the actions of endogenously elevated levels of glucagon, leading to reduction of
hyperglycemia in diabetic rodents [121-123]. Several different classes of small molecule-based,
orally available Gcgr antagonists have been identified, including trisubstituted ureas,
benzimidazole, alkylidene hydrazides, and β-alanine derivatives. These molecules are actively
following oral administration in dogs, rhesus monkeys, and nondiabetic and diabetic rodents
[124-127]. Furthermore, BAY27-995, a small-molecule Gcgr antagonist, successfully blocks
exogenous glucagon-stimulated glucose production in human subjects [128]. Complementary
strategies for reduction of hepatic Gcgr signaling have utilized antisense oligonucleotide (ASO)
to target hepatic Gcgr expression. Twice weekly intraperitoneal administration of Gcgr ASOs to
db/db mice significantly reduced plasma levels of glucose, triglycerides, and free fatty acids
without associated hypoglycemia [129]. Similarly, Gcgr ASOs reduced hyperglycemia in ob/ob
and db/db mice and Zucker diabetic fatty rats together with a reduction in plasma and hepatic
triglyceride content. Peculiarly, plasma levels of glucagon and GLP-1 were markedly elevated in
17
rodents treated with Gcgr ASOs, in association with the development of α-cell hyperplasia and
hypertrophy, findings that were reversible following discontinuation of ASO therapy [130].
Taken together, these studies demonstrate that transient inhibition of Gcgr expression and/or
glucagon action can inhibit hepatic glucose production, leading to improved glucose homeostasis
in rodents.
Elimination of Gcgr Signaling: Insights from Gcgr−/− Mice
Studies of mice with targeted disruption of the Gcgr gene (Gcgr-/-) have demonstrated
that Gcgr-/-mice are viable, exhibit mild fasting hypoglycemia and have relatively low blood
glucose throughout the day compared to control littermates [131, 132]. Gcgr-/- mice have
significantly improved intraperitoneal and oral glucose tolerance with a significant increase in
plasma insulin levels following glucose challenge compared to littermate control mice.
Additionally, insulin tolerance was also improved, and gastric emptying rates were delayed in
Gcgr-/- mice [120, 131]. Despite having improved glucose tolerance and increased plasma
insulin levels following glucose challenge in vivo, islets from Gcgr-/- mice displayed blunted
responses to glucose and various insulin secretagogues including GLP-1, GIP, carbachol,
arginine, and CCK-8. Moreover, Gcgr-/- mice islets also showed an impaired glucose oxidation
rate. Reduced response to various insulin secretagogues can be a result of impaired glucose
oxidation in the Gcgr-/- mice islets [120]. Therefore, Gcgr signaling seems essential for normal
islet function in the whole body of Gcgr-/- mice. However, in this study Gcgr is deleted in all
germline tissues, and hence it is not clear if Gcgr signaling is essential for normal glucose
oxidation under physiological conditions. Future studies are required with Gcgr β-cell specific
knockouts where Gcgr is deleted at a postnatal stage to understand the physiological importance
of Gcgr signaling in the regulation of glucose and insulin signaling in the islets.
Despite normal body weight, food intake, and energy expenditure the Gcgr-/- mice had
significantly reduced whole body adiposity, reduced plasma leptin levels, and increased lean
mass [131]. Gcgr-/- mice also had differential expression of compensatory hormones including a
decrease in plasma levels of insulin growth factor-1 (IGF-1) and a two-fold increase in fasting
corticosterone levels. In addition, Gcgr-/- mice exhibited increased cAMP responsiveness to
epinephrine in liver membranes suggesting that in the absence of Gcgr signaling there was
compensation from other counter-regulatory hormones [131]. Gcgr-/- mice exhibit α-cell
18
hyperplasia, an enlarged pancreas and enhanced somatostatin staining of islets, suggesting a
possible increase in delta cell numbers. Although similar random fed and fasted insulin levels
were observed, the plasma ambient and fasting glucagon levels were increased by 56 to 280-fold
in the Gcgr-/- mice, which could be a result of increased α-cell numbers in the pancreas [131]. In
the Gcgr-/- mice the pancreatic and plasma total and amidated GLP-1 levels were also increased
10-25 fold. It is not clear whether the elevated plasma GLP-1 levels in the Gcgr-/- mice are
solely a result of increased GLP-1 synthesis from the pancreas, and/or the gastrointestinal L cells
are also involved in amplifying the plasma GLP-1 levels in Gcgr-/- mice [131, 133].
Pancreas from 1 day old Gcgr-/- pups had normal weight suggesting the enlarged
pancreas phenotype in the Gcgr-/- mice was a postnatal event [131]. Gcgr signaling seems to be
vital to maintain normal glycaemia in the new born as some Gcgr-/- pups from Gcgr-/- mothers
die 24 hours after birth due to severe hypoglycemia [133]. Gcgr signaling is also essential for
normal fetal development and normal pregnancy as ablation of Gcgr leads to intra-uterine
growth retardation (IUGR), which is characterized by reduced fetal body weight and placental
nutrient deficiency. Gcgr-/- placentas have more edema, vessel necrosis, and narrowing of
vessels and downregulation of gene expression associated with growth, oxidation stress,
adrenergic signaling, and upregulation of apoptotic gene expression. Therefore, like insulin
signaling, Gcgr is essential for normal female reproductive function [134].
Deletion of Gcgr signaling in the whole body also resulted in delayed differentiation of β-
cells as the insulin positive cells appeared later in the Gcgr-/- embryos compared to littermate
control mice [133]. Additionally, Gcgr-/- embryos had increased α-, β-, and delta-cell
proliferation [133]. Although total β-cell area was not altered in the Gcgr-/- mice, the total
number of α-, delta- cells in islets were increased in pancreata from Gcgr-/- mice [133]. Islet
cells from the adult Gcgr-/-mice had embryonic traits; normally β-cells only express Glut2
however, α-cells from the Gcgr-/- mice also expressed Glut2 [133]. Additionally, in Gcgr+/+
pancreas, islet cells co-expressing insulin and glucagon were present early during development;
however Gcgr-/- pancreata had cells co-expressing insulin and glucagon at later stages of
development in adults. β cells from Gcgr-/- mice had reduced expression of Glut2, PC3/1, Ins-1,
Maf-A, and Pdx1 [133]. These findings suggest Gcgr expression is essential for islet cell
development and differentiation.
19
Under a high fat diet (HFD), Gcgr-/- mice gained 30 percent less body weight and were
significantly leaner than the Gcgr+/+ littermate controls. Food intake was also significantly
lower in the Gcgr-/- mice compared to littermate controls on HFD suggesting reduced body
weight gain under HFD in the Gcgr-/- mice could be a result of differences in food intake.
Additionally, Gcgr-/- mice also had significantly reduced white and brown fat compared to
littermate control on HFD. Gcgr-/- mice had improved oral and intraperitoneal glucose tolerance
and increased plasma insulin levels following glucose challenge compared to littermate controls
on HFD. Furthermore, Gcgr-/- mice on HFD were resistant to STZ induced hyperglycemia and
β-cell injury. Overall, Gcgr-/- mice are resistant to HFD-induced obesity and STZ-induced
diabetes [135].
Gcgr signaling is essential for maintaining normal glycaemia, and numerous independent
studies have shown deletion of Gcgr signaling leads to prolonged hypoglycemia in the Gcgr-/-
mice [134]. Metabolic stress from prolonged hypoglycemia in the Gcgr-/- mice has been
reported to cause loss of vision and eventual death of retinal cells in the Gcgr-/- mice [136].
Therefore, long-term hypoglycemia in diabetes may increase the likelihood of vision loss and/or
retinal complications as suggested by Gcgr-/- mice studies.
Gcgr-/- mice have been a useful tool to study Gcgr’s physiological role in hepatocyte
survival and lipid oxidation. Studies with the Gcgr-/- mice have suggested that Gcgr signaling is
essential for hepatocyte survival. Gcgr-/- mice exhibited an increased susceptibility to liver
injury, and that was reversed by partially restoring Gcgr expression in the liver. Gcgr-/- mice had
elevated plasma levels of triglycerides (TGs) and free fatty acids (FFA) following an overnight
fast. Fasting increased fatty acid (FA) oxidation in the hepatocytes from the Gcgr+/+ mice,
however, hepatocytes from Gcgr-/- mice fail to increase FA oxidation. Accordingly, fasting
failed to increase expression of hepatic FA oxidation genes in Gcgr-/- mice compared to
Gcgr+/+ mice. Gcgr signaling-mediated regulation of hepatocyte FA oxidation was dependent
on PPAR-α activation and translocation to the nucleus in a p38 MAPK signaling-dependent
manner [107]. This study suggests that Gcgr signaling is essential for fasting induced fatty acid
oxidation in murine hepatocytes.
Exercise has been shown to reduce the development of fatty liver and to increase
glucagon action in the liver, which enhances liver fatty acid oxidation. Gcgr-/- mice are also
20
more susceptible to developing liver steatosis on a HFD [107]. A study investigated whether
exercise mediated reduction in fatty liver development was associated with Gcgr signaling.
Wild-type mice on HFD exercised on treadmills had increased fat oxidation in the liver and
reduced liver fat composition, however in the Gcgr-/- mice, exercise had no effect on liver FA
oxidation or fat composition. Effects of exercise on reduction of liver fat composition were
independent of body weight and were solely due to changes in fuel metabolism by the liver
[137]. Therefore, exercise-induced increase in liver fat oxidation and elimination of liver fat
composition requires Gcgr signaling.
1.3. Glucagon and the Cardiovascular System
Glucagon receptor and cardiac contractility
Pharmacological doses of glucagon increase cardiac contractility [138-140]. The
mechanism(s) responsible for the contractility effects of glucagon in the heart is not dependent
on β-adrenergic receptor signaling. Glucagon-mediated increase in cAMP was also thought to be
a result of an increase in endogenous catecholamine levels. However, studies with reserpine to
deplete endogenous catecholamine levels failed to prevent glucagon induced increases in cardiac
contractility suggesting glucagon induced positive chronotropic effects were not dependent on
endogenous catecholamine levels [141, 142]. The glucagon-mediated increase in cardiac heart
rate was also independent of hyperglycemia induced by glucagon treatment. Maintenance of
normal glucose levels by insulin treatment failed to prevent glucagon-mediated increase in
cardiac contractility [143]. Positive chronotropic effects of glucagon were dependent on the
stimulation of Gcgr associated with Gs protein, which caused adenylase cyclase activation and
the consequent increase of cAMP production in the myocardium [144]. Glucagon-mediated
increases in cardiac contractility occur 6-8 minutes after glucagon administration and last up to
25 minutes after the administration [145]. Glucagon-mediated increases in cAMP in the
myocardium are hydrolyzed by cyclic nucleotide phosphodiesterase (PDE) enzymes 3 and 4;
therefore the contractile effects of glucagon are short-lived [146, 147]. The inotropic effects
mediated by glucagon in the cardiovascular system may be preferentially localized to the
ventricular myocardium. A study by Gonzalez-Munoz et al [148] showed higher expression of
Gcgr in the ventricle versus atria in the rat heart [148]. Although direct assessment of Gcgr
21
expression has not been examined in fetal hearts, glucagon-mediated induction of cAMP is
absent in fetal hearts of mice, rats, and sheep [149]. However, a cAMP response to glucagon is
detected in the hearts of rats and mice on days 13-22 post gestation, suggesting Gcgr expression
is delayed during development in the myocardium until weaning [149, 150]. Interestingly,
glucagon-mediated increases in cAMP and contractile force are dependent on the health of the
heart. Accordingly, glucagon failed to increase cardiac contractility in heart tissue obtained from
human heart failure patients, but was able to increase cAMP content in tissues from non-failing
hearts [151, 152]. Due to glucagon’s ability to increase cardiac contractility of the heart in
humans, canines, and rodents, glucagon is occasionally used for the treatment of poisoning
caused by cardio depressant drugs such as β-blockers or calcium channel blockers [144].
Recently a study investigated whether glucagon and oxyntomodulin-mediated increases
in heart rate were dependent on a functional Gcgr. 15 μg of oxyntomodulin and 1.5 μg of
glucagon were singly dosed through an i.p injection in mice. Both glucagon and oxyntomodulin
failed to increase heart rate in Gcgr-/- mice. Furthermore, Gcgr-/- mice had higher resting heart
rate than control mice (including Gcgr+/+ and Gcgr+/- mice) at thermal neutral temperature
(30°C). The authors speculated the elevated heart rate in the Gcgr-/- mice could be the result of
low parasympathetic system activity [153].
1.3.1. Glucagon and blood vessels
Glucagon-mediated relaxation and cAMP production were measured in strips of different
arteries or veins isolated from dogs. Glucagon-mediated cAMP production was more potent in
renal compared to mesenteric or coronary arteries. Similarly, glucagon had the highest effect on
relaxation of renal compared to mesenteric or coronary arteries. Furthermore, removal of
endothelium from renal artery did not alter glucagon-mediated relaxation suggesting glucagon
might have a direct effect on the renal artery or the smooth muscle cell. This study suggests
differential impact of glucagon on relaxation and cAMP production on different arteries, which
can be a result of heterogeneous expression of Gcgr in smooth muscle cells and blood vessels
[154]. Glucagon is a potent vasodilator, and a large number of studies in canines have shown that
a single injection of glucagon increased hepatic blood flow by 100% [155]. Glucagon had the
highest impact on superior mesenteric artery (SMA) blood flow, that increased by 190% [155]
22
compared to its impact on other arteries. As Gcgr expression was not assessed in different blood
vessels or cell types of blood vessels it was not clear whether these effects of glucagon on SMA
artery were the result of higher Gcgr expression in the smooth muscle cells in the SMA artery.
1.3.2. Glucagon and calcium ions
Glucagon has been reported to increase cAMP in cardiac tissues and cells. In turn cAMP
is known to upregulate calcium uptake and releases it from the sarcoplasmic reticulum leading to
cardiac action potentials and ultimately increases in cardiac contractility [139, 156, 157]. A
number of studies have shown that glucagon can increase both intracellular calcium
accumulation and mitochondrial calcium uptake in cardiac microsomal fraction and in isolated
cardiac cells [139, 156, 157]. Glucagon-mediated uptake of calcium in cardiac microsomal
fraction is not dependent on β-adrenergic receptor signaling as these effects of glucagon on
calcium signaling are not blocked by β-adrenergic blocking agents [139].
1.3.3. Glucagon and blood pressure
Gcgr signaling activation has been shown to increase blood pressure in dogs and rodents.
A study reported administration of pharmacological dose of glucagon into the pulmonary artery
increased heart rate, cardiac output, stroke volume aortic mean, and left ventricular end-diastolic
pressure [158]. Myocardial oxygen consumption was also increased with glucagon
administration, which was also associated with an increase in coronary flow. These effects of
glucagon lasted from 3 to 20 minutes following glucagon injection [158]. It has been
demonstrated that the induction of systemic hyperglucagonemia is also associated with increased
blood pressure. A study conducted by Li et al [159] showed glucagon administration in mice via
osmotic minipump resulted in elevation of serum glucagon levels by 129% and a raise in systolic
blood pressure [159]. An increase in kidney weight/body weight ratio was observed, and the 24
hour urinary albumin excretion augmented by 108%. Concurrent administration of a Gcgr
antagonist, [Des-His1-Glu9] glucagon with glucagon significantly attenuated glucagon-mediated
increase in systolic blood pressure, kidney weight/body weight ratio, and 24 hour urinary
albumin excretion [159]. The study suggested chronic glucagon administration led to systemic
hypertension [159], however whether the increased blood pressure was due to direct kidney
damage, vascular effects, and/or direct or indirect glucagon action on the heart, remained unclear
[40]. Conversely, studies have also reported down-regulation of cardiac Gcgr expression in
23
rodents with experimental hypertension, in association with the development of cardiac
hypertrophy [160], but the significance of this correlative observation is uncertain [160].
Additionally, G-->A/GT (Gly40Ser) polymorphism of the Gcgr gene has been associated with
hypertension in human subjects. G-->A/GT (Gly40Ser) polymorphism of the Gcgr has been
reported to lead to less responsiveness of the receptor to its ligand. An association study in
humans investigated the correlation between Gcgr polymorphism and the risk to develop
hypertension by measuring serum uric acid, fractional excretion of uric acid, and exogenous
lithium levels in individuals with or without hypertension. The study suggested that the Gly40Ser
polymorphism of the Gcgr gene was associated with higher risk of hypertension, and it could be
due to an enhanced renal sodium reabsorption associated with the polymorphism of the Gcgr
gene. [161]. Therefore, it is unclear if activation or inhibition of the Gcgr signaling is beneficial
or detrimental for the development of hypertension and requires further investigation.
1.3.4. Glucagon and cardiac ischemia
Following an acute myocardial infarction an increased incidence of hyperglycemia and
impaired glucose tolerance was observed in non-diabetic patients. These patients also had
elevated levels of plasma glucagon. This suggests myocardial infarction may induce secretion of
glucagon. However, the significance of the increase in glucagon levels following ischemia was
not explored [162]. A number of studies have examined the effects of physiological and
pharmacological dose of glucagon in ischemia; the majority of those were conducted in canines,
rats, and some in patients with myocardial infarction or chronic rheumatic heart disease [142,
158, 163-166]. Following myocardial infarction the contractility of the heart is depressed; left
ventricular performance is estimated by the relationship between left ventricular end-diastolic
pressure and left ventricular minute work. The left ventricular performance declines with cardiac
ischemia leading to reduced cardiac output and increased peripheral vascular resistance.
Glucagon has been shown to be a cardiac inotrophic and chronotropic agent in human subjects,
rodents, and canines, and hence, glucagon has been proposed to be an effective therapy to
prevent depression of cardiac contractility following myocardial infarction. A single dose of
glucagon (1-3 mg) directly injected into pulmonary artery of patients with acute myocardial
infarction resulted in a significant rise in blood pressure, slight rise in chronotropic effect and
temporary improvements in cardiac output [142, 158, 163-166]. Accordingly, glucagon’s effect
24
on patients with acute myocardial infarction or chronic rheumatic heart disease was investigated
following a single 2-5 mg injection or continuous infusion of glucagon (20 mg) into the
pulmonary artery. Cardiac parameters were measured 2, 5, 10, 20, 30 minutes following
glucagon injection or 24 or 48 hours following glucagon infusion. After a single injection of
glucagon a significant increase in cardiac inotropic action, cardiac output, and an enhanced
cardiac performance were observed in the acute phase of myocardial infarction. Those effects of
glucagon were noticeable 10 minutes following glucagon injection and lasted until 30 minutes
following injection. In the chronic rheumatic heart disease setting of mitral stenosis, glucagon
increased left atrial pressure, an undesirable effect as this might worsen the outcome [164].
Overall, in human studies glucagon administration in acute versus chronic disease had different
effects, and single versus continuous infusion also gave different results. Similar to human
studies, in dogs, a pharmacological dose of glucagon administered intravenously either as a bolus
or as an infusion following an acute myocardial infarction resulted in augmentation of the
contractile state of the non-infarcted portion of the left ventricle. Left ventricular performance
and overall cardiac output was increased following glucagon treatment suggesting the
dysfunctional impact of myocardial infarction on the left ventricle could be reversed with
pharmacological doses of glucagon [142]. In contrast to glucagon’s effect in chronic rheumatic
heart disease in humans, an improved outcome was noted in dogs with chronic myocardial
infarction after glucagon administration. In studies with dogs, 50 minutes following
pharmacological dose of glucagon infusion recovery from myocardial infarction was monitored.
The infusion of glucagon reduced left ventricular failure, which led to an increase in cardiac
performance in dogs. There were no significant changes in coronary flow nor myocardial oxygen
consumption with glucagon 1 hour or 1 week after myocardial ischemia suggesting glucagon
might be improving cardiac outcome from acute ischemia by increasing cardiac efficiency [158].
This study also suggested that the improvements in outcome from ischemia by glucagon could be
due in part to glucagon action to increase heart rate, which was similar to the effects of external
pacing of hearts in patients going through myocardial infarction. Additionally, another study
reported i.v. injection of 100ug/kg of glucagon led to increased heart rate, decreased blood
pressure, and an induction of positive chronotropic effect in anaesthetized dogs, but not in un-
anaesthetized dogs with ligation of the anterior descending branch of the left coronary artery
[165]. Although none of the studies have explored how glucagon protects the heart from
25
myocardial infarction mechanistically, one proposed mechanism through which glucagon can be
protecting the myocardium from ischemia is by increasing potassium ions (K+) flux into the
heart. Studies have shown that infusion of glucose, insulin, and potassium, or potassium alone in
the heart leads to improved outcome from myocardial infarction through a shift in cardiac fuel
metabolism from fatty acid to glucose utilization. Studies have also shown that depletion of K+ in
the heart leads to development of arrhythmia (abnormal heart rate) and impairs cardiac outcomes
from myocardial ischemia, and inhibition of K+
depletion can correct the arrhythmia and
improves outcomes from myocardial infarction. [142, 166]. In contrast, there are studies that
show that glucagon can impair outcome from myocardial infarction. In one study,
pharmacological levels of glucagon were perfused (1ug/ml) in the isolated working rat heart
model before ischemia, and recovery from ischemia was monitored. Glucagon impaired recovery
from ischemia and cardiac glycogen levels in those hearts were also depleted. The authors of this
study conclude that glucagon-mediated depletion of glycogen levels in the heart can be a
mechanism through which glucagon worsens outcomes from ischemia [167]. So, the role of
glucagon receptor signaling in the setting of cardiac ischemia is not clear and requires further
investigation.
1.3.5. Glucagon and cardiac fuel metabolism
Glucagon has been shown to play an important role in lipid metabolism in the liver;
however the role of glucagon in cardiac fuel metabolism is not fully explained. Perfusion of
pharmacological dose of glucagon in working, normal, and insulin-resistant rat hearts increased
inotropic and chronotropic activity of the heart followed by an increase in cardiac glucose and
palmitate oxidation [168]. Furthermore, glucagon caused an increase in fat oxidation in normal
hearts through a malonyl CoA-independent mechanism [168]. Similarly, infusion of glucagon in
perfused rat hearts at levels designed to achieve physiological concentrations led to induction of
glycolysis and glucose oxidation, similar to insulin actions in the heart that was mediated via
phosphatidylinositol 3-kinase-dependent and adenylate cyclase- and cAMP-independent
pathways [169]. Hence, unlike the effects of glucagon in the liver that generally oppose insulin
action, glucagon and insulin action in the heart may overlap in regards to stimulation of fuel
metabolism.
26
1.3.6. Glucagon and myocardial oxygen consumption
Infusion of pharmacological doses of glucagon stimulated cardiac contractility, increased
blood flow and caused elevation in myocardial oxygen consumption in humans and dogs [170].
In one study glucagon was infused in hearts of dogs, and left ventricular work per minute was
recorded. Glucagon increased the left ventricular work per minute; however, index for minute to
work efficiency was significantly lower in glucagon-treated hearts without any changes in ATP
levels suggesting the generation and utilization of energy was unchanged with glucagon. These
findings indicate that glucagon reduces the cardiac efficiency by increasing myocardial oxygen
consumption [145]. Yet in a different study pharmacological doses of glucagon in conscious
dogs with intact myocardial infarction did not produce any changes in myocardial oxygen
consumption. It is postulated that during myocardial infarction there are reciprocal changes in
factors that increase myocardial infarction such as elevations in circulating levels of glucagon
(increases cardiac inotrophy) whereas factors that decrease oxygen consumption (ventricular end
diastolic wall stress) may balance out leading to no overall changes in myocardial oxygen
consumption [171].
Mini glucagon and the heart:
Glucagon has been reported to be processed by target tissues locally such as the pancreas,
the liver, and the heart as well as in the circulation by a specific ectoendopeptidase to liberate
COOH-terminal (19-29) fragment, mini-glucagon [172]. Mini-glucagon has been shown to
contribute significantly to the positive cardiac contractile response of glucagon as the
unprocessed form of glucagon has minimal effects on cardiomyocyte contraction [173, 174].
However, both mini-glucagon and glucagon synergistically cause accumulation of Ca2+
into the
cardiac sarcoplasmic reticulum stores [173, 174]. Mini-glucagon does not act through the known
glucagon receptor. Mini-glucagon has no effect on cAMP, cGMP, or inositol 1,4,5-triphosphate
production in cardiac cells or tissues [174]. Therefore, the actions of mini-glucagon are not
dependent on the classical glucagon transduction pathways. Nonetheless, in the cardiac cells
mini-glucagon mediates release of arachadonic acid from ventricular chick cardiomyocytes, and
adding arachadonic acid to cardiomyocytes has similar effects as mini-glucagon on Ca2+
homeostasis and cell contraction. Hence, mini-glucagon actions on Ca2+ homeostasis and
cardiomyocyte contraction may be dependent on arachidonic acid release [174].
27
1.4. Introduction to the incretins
Incretins are gut hormones that are secreted from the gut during meal ingestion; they
induce insulin secretion by the pancreatic β-cells in a glucose-dependent manner. Two classical
incretins that have been the most studied thus far are glucagon-like peptide-1 (GLP-1) and
gastric inhibitory polypeptide (GIP). GLP-1 and GIP exert their actions on target tissues through
distinct G-protein coupled receptors (GPCRs): Glucagon-like peptide 1 receptor (Glp1r) and
Gastric inhibitory peptide receptor (Gipr) respectively. In addition to GLP-1 and GIP there are
numerous other peptide hormones, nutrients, bile acids, and lipid amides that are also secreted
following nutrient ingestion and many of these molecules also bind to receptors on islet β-cells
and stimulate insulin secretion.
1.4.1. Incretin secretion and synthesis
GLP-1 is derived from proglucagon, which is processed by prohormone convertase 1/3
(PC1/3) (Figure 1.1). GLP-1 is predominantly made in the L cells of the gut, circumvallate
papillae and adjacent salivary gland, and the central nervous system (mostly in the brainstem
from which it is delivered to other parts of the brain) [175]. GLP-1 expression is also detected in
a subset of α-cells and is stimulated by exogenous IL-6 or exercise [176]. Ingestion of nutrients
including carbohydrates, fats, and proteins can stimulate GLP-1 secretion through secretion of
other hormones, neural signals, and luminal nutrient interactions with the gut [177, 178].
Unlike GLP-1, GIP is synthesized and secreted from the K cells located in the intestinal
epithelium. GIP biosynthesis in gut K cells is not well understood. Studies have identified
regulatory factor X 6 (Rfx6) as an important factor in GIP secretion from K cells and for GIP
synthesis in K cells [179]. GIP has been detected in neurons, Schwann cells, and
oligodendrocytes in the CNS [180]. GIP is also detected in pancreatic α-cells and in islets from
glucagon knockout mice, GIP is detected in pancreatic β-cells [181, 182]. It is not clear if
detection of GIP from pancreatic cells suggests a possibility for intra-islet paracrine GIP action.
GIP secretion is stimulated by nutrients including fat [183].
1.4.2. Incretin action in the pancreas
One of the most important functions of GLP-1 and GIP is to stimulate insulin secretion
from the pancreatic β-cells in a glucose-dependent manner. GLP-1 and GIP stimulate insulin
28
secretion via numerous different mechanisms including 1) enhancement of glucose sensing
mechanisms by increasing β-cell expression of glucokinase and GLUT2; 2) direct inhibition of
KATP channels which leads to β-cell membrane depolarization; 3) influx of extracellular
Ca2+
through opening voltage-dependent Ca2+
channels, mobilization of intracellular Ca2+
through activation of nonselective cation channels; 4) membrane depolarization by increase in
mitochondrial ATP synthesis; 5) reduction in Kv currents which prevent β-cell repolarization by
closing voltage dependent Kv channels; 6) increase β-cell insulin storage granule exocytosis
[184]. In addition to stimulating insulin from β-cells, GLP-1 has also been shown to promote β-
cell proliferation, neogenesis, and glucose sensitivity to glucose-resistant β-cells and reduce β-
cell apoptosis[185]. However, these effects of GLP-1 are secluded to rodent islets as Glp1r
agonists do not have proliferative effects on human islets. One possible reason for the species
difference could be because the rates and capacity for islet cell turnover and growth in humans
are different from rodents [186]. Furthermore, it is difficult to assess beta cell mass in human
subjects noninvasively [186].
β-cell Glp1r signaling is dependent on β-arrestin-1 as GLP-1 mediated activation of cAMP,
CREB, and ERK1/2 activation is reduced following knock down of β-arrestin-1 with siRNA in
INS-1 cells [187]. Furthermore, GLP-1 mediated insulin secretion, and prevention of β-cell
apoptosis was ameliorated following knockdown of β-arrestin-1 with siRNA in MIN-6 cell lines
[187]. Therefore, β-arrestin-1 is essential for Glucagon-like peptide-1 receptor (GLP-1R)
signaling in β-cells. Additionally, another key transcription factor activated by GLP-1 is
TCF7L2, and is a downstream target of the Wnt/ β -catenin pathway [188]. In INS-1 cells and
primary islets in culture the GLP-1R agonist, exendin-4 (Ex-4) has been shown to activate the
canonical Wnt signaling pathway, enhance β-catenin/Tcf7l2 mediated cyclin D1 gene expression
and β-cell proliferation in a cAMP/PKA, AKT, and ERK1/2 dependent manner [188]. These
studies are consistent with the loss of function studies with Tcf7l2 pancreas-specific knockout
mice; GLP-1-stimulated insulin release from pancreas-specific Tcf7l2 knockout mice islets is
compromised [189]. Therefore, Tcf7l2 is an essential transcription factor for GLP-1’s action in
β-cells. GLP-1’s proliferative and anti-apoptotic actions on β-cells are also dependent on Insulin-
like growth factor 1/2 (IGF) signaling. GLP-1 fails to increase β-cell proliferation in islets from
Igf1r-/- mice. Furthermore, GLP-1 mediated activation of IGF pathway stimulates β-cell
29
proliferation in islets [190]. GLP-1 failed to prevent apoptosis and promote phosphorylation of
AKT and BAD in cytokine treated MIN-6 cells and mouse islets following knockdown of the
Igf-1/2 receptor [191]. Thus, IGF signaling is essential for GLP-1’s action regulating
proliferation and survival of β-cells.
Like GLP-1, GIP also stimulates insulin secretion in a glucose-dependent manner in islets
and INS-1 cells [192-196]. However, unlike GLP-1, which has been consistently shown to
promote β-cell proliferation and survival in multiple in vivo studies, GIP’s action on β-cell
proliferation and survival are inconsistent in in vivo studies. The research group headed by
Weidenmeir et al has shown that the GIP analog, [D-Ala2]GI treatment in vivo preserved β-cell
mass and prevented apoptosis in multiple rat models of T2D and in INS-1 cells [197]. Similarly,
in ZDF rats, iv injections of [D-Ala2]GIP for two weeks led to decreased Bax and upregulation
of Bcl-2 in β-cells. Conversely, Maida et al demonstrated that chronic treatment with [D-
Ala2]GIP had a modest effect in preventing apoptosis in β-cells and no effect on β-cell mass,
whereas chronic treatment with Ex-4 significantly increased β-cell mass and prevented β-cell
apoptosis in STZ treated diabetic mice [198]. Furthermore, deletion of Glp1r increased
susceptibility to STZ induced diabetes, however, deletion of Gipr did not increase susceptibility
to STZ-induced diabetes in mice [198]. Therefore, GIP’s anti-apoptosis and proliferative actions
on β-cells are not clearly understood and may require further investigation. GIP mediates its
insulinotropic actions on β-cells through cAMP/PKA and cAMP/Epac2 pathways, similar to
GLP-1 [192]. GIP and GLP-1 have both been shown to activate AKT independent of PI3K or
Thr (308) and Ser (473) phosphorylation [199]. GIP has been proposed by Widenmaier et al to
activate the AKT pathway through a non-canonical pathway [199]. Furthermore, in INS-1 cells
and mouse islets, GIP has been shown to increase antiapoptotic protein expression, Bcl-2,
through PKA-dependent phosphorylation of CREB [199]. Gipr signaling is not heavily studied
like the Glpr1r as downregulation of Gipr expression is observed in experimental and clinical
diabetes. A possible mechanism through which Gipr expression is downregulated in diabetes can
be linked to PPAR-γ; under glucotoxic conditions reduced PPAR-γ activity, and Gipr expression
has been observed [200]. Downregulation of Gipr is also associated with ubiquitination and
degradation of the Gipr during hyperglycemia in rodent and human islets [201]. In the majority
of the hyperglycemic subjects with T2D, GIP also fails to stimulate insulin secretion, and this
has been associated with SNP (rs10423928) in the GIPR gene. T2D subjects with this SNP
30
showed lower GIPR expression and had lower GIP-induced insulin response [202]. Therefore,
genetic and environmental stimuli may be involved in downregulation of Gipr during
hyperglycemia and diabetes.
1.4.3. Incretin action in the adipose tissue
Glp1r expression is controversial in white adipose tissues (WAT). Glp1r expression in
human or rodent WAT was not detectable even though GLP-1 bindings sites were detected in
human and rat WAT membranes using radiology and binding assays [203]. Studies suggest
GLP-1 mediates lipolysis in human primary adipocytes and in 3T3-L1 cell lines in vitro [204].
However, the lipolytic actions of GLP-1 on WAT in vivo were not clear and might be indirect
through the sympathetic nervous system as studies suggested direct infusion of GLP-1 into
abdominal subcutaneous adipose tissue failed to reduce WAT in human subjects[205].
Additionally, intracerebroventicular (icv) infusion of GLP-1 led to decreased WAT mass and
inhibition of Glp1r signaling using Exendin 9-39 (Ex-9) infusion icv led to increased fat mass.
The effect of central Glp1r signaling on WAT mass was independent of food intake and body
weight loss [206]. Glp1r expression was not detected in brown adipose tissue (BAT). A single
icv injection of GLP-1 led to an increase in BAT thermogenesis and increase in sympathetic
nerve activity in BAT in rodents [207]. Therefore, GLP-1 mediated BAT thermogenesis is
indirect via the central nervous system.
Gain and loss of function studies with GIP illustrates an essential role of Gipr signaling in
WAT lipolysis in rodents and humans [208-213]. Gipr signaling activation leads to an increase
in lipid uptake, secretion of adipokine, weight gain, and insulin resistance [208]. Conversely,
Gipr-/- mice or ablation of GIP action using immunoneutralizing antisera leads to protection
from diet-induced insulin resistance. Additionally, rescuing Gipr expression in the adipocyte in
whole body Gipr-/- mice leads to normal body weight gain, and these mice are no longer
resistant to diet induced obesity [213]. It is not clear if these effects of GIP on adipocytes are
direct or indirect via insulin. Asmar et al showed that in human subjects, in the absence of
hyperinsulinemia, GIP’s effects on lipid metabolism and free fatty acids were significantly
reduced. GIP infusion under hyperinsulinimic conditions led to increased adipose tissue blood
flow [214]. Therefore, this study suggests GIP’s action on adipose tissue may be insulin-
dependent. Gogebakan et al demonstrated that GIP infusion alone led to increased plasma insulin
31
levels, and lowered plasma free fatty acids in healthy nondiabetic subjects. However, it was not
clear if GIP infusion alone led to changes in free fatty acid or that was the result of increased
plasma insulin following GIP infusion [215]. Human subjects with a Gipr SNP (rs10423928)
had reduced adipogenesis. It is not clear if this SNP is associated with lower Gipr expression in
adipocyte or lower plasma insulin levels [216]. Therefore further investigation is required to
understand if GIP has direct effects in adipocyte or if the effects are indirect via insulin.
1.4.4. Incretin action in the liver
Glp1r agonists have been shown to lower liver lipid content, hepatic steatosis, liver weights, and
inhibit hepatic glucose output [217, 218]. Similarly, during a hyperinsulinemic-euglycemic
clamp, Glp1r-/- mice showed reduced phosphorylation of liver AKT and GSK-3β in the liver
and defective hepatic glucose output [219]. To date no full length GLP-1 receptor expression
has been detected in murine hepatocytes nor was a cAMP response detected in murine
hepatocytes following GLP-1 or Glp1r agonist treatment [220, 221]. However, in rat and human
hepatocytes, Glp1r mRNA expression was detected. Additionally, Glp1r binding sites were not
detected in human liver sections [222, 223]. Thus, Glp1r expression in the liver is controversial.
Glp1r mediated actions in the liver could be indirect through the brain as central administration
of GLP-1 led to inhibition of endogenous glucose production in rodent studies [224, 225].
Another possibility can be that GLP-1 promotes insulin secretion and inhibits glucagon
secretion, and this can result in reduction of hepatic glucose production indirectly by GLP-1.
However, the majority of the studies that examined GLP-1 mediated liver glucose output did not
control insulin nor glucagon levels. Therefore, it is difficult to make conclusions whether GLP-1
mediated hepatic glucose production is a result of changes in plasma insulin or glucagon levels.
1.4.5. GLP-1 and gastric emptying
GLP-1 has been shown universally to be a potent inhibitor of gastric emptying in rodents,
pigs and human studies[226], [227] [228] [229] [230].. GLP-1 mediated inhibition of gastric
emptying contributes significantly to the reduced glycemic excursion as such infusion of low
dose of GLP-1 inhibited gastric emptying and lowered glycemic excursion without changes in
insulin secretion [228]. Although GLP-1 has been shown to directly stimulate cAMP formation
in rat gastric gland preparations, GLP-1 mediated inhibition of gastric emptying is mediated
32
through vagal afferents as vagotomy prevented GLP-1 mediated inhibition of gastric emptying in
rats [229] [230].
1.4.6. Incretin action in the heart
Glp1r expression in the heart:
GLP-1 has been shown to have direct effects on the myocardium [231-234]. However,
numerous studies have shown reduced Glp1r expression in ventricular cardiomyocytes relative
to atria in multiple species [235-237]. Recent studies in mice by Kim et al[235] showed that the
level of Glp1r expression in the atrial cardiomyocyte is significantly higher compared to the
expression in ventricular cardiomyocyte [235]. In neonatal and adult cardiomyocytes from mice
and rats Glp1r activation is coupled to increased cAMP production [231, 238]. In whole
cardiomyocytes cell patch clamp studies from adult dogs, GLP-1 treatment increased cAMP
production and induced Ca2+ channel current in a PKA-dependent manner [239]. In neonatal
rodent cardiomyocytes and mouse atrial cardiomyocyte cell lines HL-1, activation of the Glp1r
led to increase in AKT and ERK phosphorylation and also reduced apoptosis in a PI3K and
ERK-dependent manner [240, 241] Therefore, these studies suggest GLP-1 has protective effect
on cardiomyocytes and activates cardioprotective signaling pathways in primary cardiomyocytes
in culture.
Findings from ex-vivo studies with GLP-1 on cardiac contractility are not consistent. In
one study perfusion of GLP-1 in the rat heart led to reduced left ventricular developed pressure,
and in another study a similar dose of GLP-1 increased left ventricular diastolic pressure (LVDP)
in mouse hearts [232, 233]. However, in both studies, GLP-1 perfusion led to increased glucose
uptake by the heart, and this was associated with increased activity of p38 MAPK, and increased
GLUT1 protein expression at the cardiac plasma membrane [232, 233]. Similar findings were
observed in isolated dog hearts, where GLP-1 infusion increased glucose uptake in a p38
MAPK-dependent manner [242]. GLP-1-mediated changes in heart rate (HR) and blood
pressure (BP) are complex depending on the species. GLP-1 administration in rodents increases
HR, and BP via a -adrenergic receptor signaling-independent, Glp1r-dependent manner. The
effects of GLP-1 on HR and BP disappear in the presence of Ex-9-39 and not with a -
adrenergic receptor antagonist [243-245]. In rodents the effects of GLP-1 on HR and BP involve
both CNS and peripheral mechanism. In vagotomized rats, icv GLP-1 failed to increase HR or
33
BP. Therefore this suggests GLP-1 mediated increases in BP and HR involves intact vagal
nerves and the central nervous system [246]. In rodents, central GLP-1 mediated regulation of
BP also involves vasopressin, which is a posterior pituitary gland hormone [247]. Vasopressin
receptor antagonist injected in the artery-prevented icv GLP-1 induced rise in BP in mice and
rats [247]. Therefore, GLP-1 mediated increases in HR and BP in rodents involves a complex
pathway from the CNS. Although Glp1r activation in healthy animals leads to increased HR and
BP, in obese/diabetic (db/db mice) mice that are fed salt to induce hypertension sustained Glp1r
activation leads to a reduction in BP [248, 249]. One of the potential mechanism via which
GLP-1 is mediating antihypertensive effects can be through induction of nitric oxide (NO)
secretion by endothelial cells, which has antihypertensive properties [250].
Studies on human subjects with T2D or heart failure reported inconsistent findings. In
some studies infusion of native GLP-1 or GLP-1R agonists led to an increase, and in other
studies it led to a reduction in HR and BP [251, 252]. These differences can possibly be
attributed to structural difference in GLP-1R agonists as these studies have utilized different
GLP-1R agonists. However, in the majority of the clinical trial studies with long-term GLP-
1Ragonists’ including exenatide and liraglutide, BP reduction was detected in non-diabetic obese
and T2D subjects [253-255]. Furthermore, the majority of the BP lowering effect of GLP-1R
agonists in clinical trials could attribute to reduced body weight as body weight was reduced in
most of the clinical trial studies [256, 257]. Therefore, it is not entirely clear if long term
treatments with GLP-1Ragonists leads to lower BP and HR as a result of reduction in body
weight or these effects of GLP-1R agonists are independent of changes in body weight and
require future investigation.
The majority of the studies have reported that native GLP-1 and Glp1r agonists have
cardioprotective effects in ex-vivo and in vivo models of ischemia [232, 233, 238, 258]. Direct
perfusion of GLP-1 or Ex-4 during reperfusion after ischemia led to improvement in LVDP in rat
and mice hearts [233, 238, 259]. Similarly, reduced infarct sizes were observed in studies with
temporary or permanent left anterior descending (LAD) ligations following iv or sc infusion/
injections of GLP-1 and Glp1r agonists in rats, mice, and pigs [258, 260-262]. Multiple
mechanisms for the beneficial effects of GLP-1 in cardiac ischemia have been proposed.
Albiglutide, which is a Glp1r agonist, has been shown to cause cardioprotective effects in the
34
heart through improving cardiac energetics. Injection of albiglutide for 3 days followed by
temporary LAD coronary artery occlusion in rats led to reduced infarct size, and this was
associated with reduced fatty acid oxidation and increased glucose oxidation rates [263].
Therefore, albiglutide has been suggested to improve recovery from ischemia through improving
fuel metabolism in the heart. Another proposed mechanism for Glp1r activation leading to
cardioprotection is in part through mechanisms requiring the heart to receive signals from the
vasculature, or neurons. Direct administration of liraglutide in coronary arteries at the onset of
reperfusion injury failed to protect the heart. However, liraglutide injection into mice in vivo
before ischemia/reperfusion led to improved LVDP [238]. Not all studies with GLP-1 or Glp1r
agonists have shown to be protective against cardiac ischemia suggesting that universal
activation of Glp1r does not lead to cardioprotection. Therefore, the exact mechanism involved
in GLP-1 mediated cardiac protection from ischemia is not clear. Furthermore, it is not clear if in
the setting of diabetes, GLP-1 is effective in protecting the heart against ischemia, and this
requires further investigation.
In human studies, GLP-1 infusion for 72h improved left ventricular (LV) ejection
fraction (LVEF) and wall motion of the infarcted area of the heart [242]. Furthermore, in
patients with coronary artery disease, iv infusion of GLP-1 protected against LV dysfunction and
prevented myocardial contractile abnormality following ischemia [264]. Furthermore, exenatide
reduced ischemic area following infusion for 6 hours in patients undergoing primary angioplasty
[265]. However, the majority of the studies in humans with Glp1r agonists were with small
patient numbers, were not double blinded, or Glp1r agonists were not given long term in these
studies. Hence, future studies need to investigate whether long term Glp1r agonist treatment is
cardioprotective in larger patient populations and subjects with T2D.
1.4.7. Insight from incretin receptor knockout mice
Genetic deletion of Glp1r led to a mild impairment in glucose-stimulated insulin
secretion and glucose homeostasis in vivo [192, 266]. Surprisingly, despite inhibitory effects of
GLP-1 on food intake, disruption of Glp1r did not impact food intake, or body weight and
paradoxically increased susceptibility to diet-induced obesity [266, 267]. Despite Glp1r’s action
in the cardiovascular system in reducing ischemia and blood pressure, Glp1r-/- mice in C57bL/6
background had mostly normal cardiac morphometric parameters including normal LV function
35
and heart rate basally [232, 233, 238, 258]. However, Glp1r-/- mice in the CD-1 background
had thicker ventricular walls and had significantly increased baseline LVDP during Langendorff
perfusion of the hearts under aerobic conditions suggesting Glp1r signaling might be important
for development of the heart in some mouse strains [231, 232].
Like Glp1r-/- mice, genetic deletion of the Gipr also led to mild impairment in glucose
stimulated insulin secretion. Gipr-/- mice are resistant to diet-induced obesity and are more
insulin sensitive than wild-type littermate control mice [268, 269]. Additionally, genetic
variation in the GIPR in humans has also been shown to be associated with increased body mass
index and elevated fasting glucose levels [270, 271].
Double incretin knockout (DIRKO) mice were first characterized by Hansotia et al [272];
despite loss of both classical incretin receptors, the DIRKO mice had normal body weight and
food intake but had impaired glucose tolerance during oral glucose challenge and not during an
ip glucose tolerance. Surprisingly, glucose-stimulated insulin secretion in perifused DIRKO mice
islets was preserved despite loss of both Gipr and Glp1r [272]. Furthermore, studies with
DIRKO mice have shown that DPPIV inhibitors work to reduce glucose excursion solely,
through elevation of GLP-1 and GIP levels as the effect of the DPPIV inhibitors
valinepyrrolidide (Val-Pyr) and SYR106124 are diminished in the DIRKO mice [272]. The most
surprising finding from the DIRKO studies was that despite the loss of both the incretins those
mice on an HFD had preservation of insulin sensitivity and elevated energy expenditure which
was associated with increased locomotor activity [267].
1.5. Rationale & Hypotheses
Glucagon secretion has been observed to be inappropriately increased in many T2D
subjects, which has fostered great interest in reduction of glucagon action for the treatment of
T2D [111, 112, 117, 273]. Genetic or pharmacological inhibition of Gcgr signaling leads to
improved glucose homeostasis, reduced fasting glycaemia, delayed gastric emptying, and
increased pancreas weight [118, 119, 128-130, 274, 275]. In addition to these phenotypes
antagonism or genetic deletion of Gcgr also leads to elevated plasma active and total GLP-1
levels [131]. It is unknown whether direct loss of Gcgr signaling is responsible for the
36
phenotypes observed in the Gcgr-/- mice or if the elevated GLP-1 levels contribute to the
phenotypes observed in the Gcgr-/- mice.
Cardiovascular disease is the most common complication in individuals with diabetes and
is the number one cause of death in diabetes [276-279]. Glucagon levels are elevated in diabetes,
and hyperglucagonemia is fundamental to the pathophysiology of hyperglycemia, ketoacidosis,
and impaired counter-regulation [111, 112, 117, 273]. Glucagon receptor antagonists and
Gcgr/Glp1rco-agonists show promising results to treat diabetes and obesity [118, 119, 128-130,
274, 280-282]. The Gcgr is expressed in the heart and promotes both cAMP production and
enhances cardiac contraction [146, 283]. However, the consequence of hyperglucagonemia in
the development of cardiovascular complications has not been explored in diabetes and obesity.
Furthermore, the physiological role of the Gcgr in the cardiovascular system is unknown.
The investigations began with the following research objective/question and hypotheses,
respectively:
Pharmacological levels of GLP-1 contribute to the improved glucose homeostasis, β-
cell function and delayed gastric emptying in the Gcgr-/- mice
The extent to which the improved metabolic phenotype of Gcgr−/− mice reflects the
direct loss of Gcgr signaling in liver vs. the contribution of enhanced GLP-1 action remains to be
determined. Multiple phenotypes are consistent with enhanced GLP-1 action, including
improved glucose homeostasis, improved β-cell function, increased insulin sensitivity, reduction
in fasting glycaemia, and delayed gastric emptying are observed in the Gcgr-/-mice (Table 1)
[131, 133, 135, 274, 280]. This has led me to hypothesize that GLP-1 receptor signalling
substantially determines the improved glucose tolerance, increased insulin sensitivity,
reduction in fasting glycaemia and delayed gastric emptying in the Gcgr-/-mice. I have
aimed to delineate the role of GLP-1 receptor signalling to the overall phenotype of the Gcgr-/-
mice using a newly generated double knockout mouse with a disruption of the known Glp1 and
Gcg receptors.
What is the physiological role of the glucagon receptor in the cardiovascular system
under normal and cardiac ischemic conditions?
A substantial body of literature supports the acute transient use of glucagon to reverse the
37
effects of β-adrenergic agonists, or to increase heart rate, blood pressure, and cardiac output in
subjects with circulatory collapse refractory to adrenergic stimulation [143, 284, 285]. In
contrast, more sustained administration of glucagon may increase the severity of ischemic
cardiac injury, and this has led me to hypothesize that enhancing Gcgr signalling may increase
and reducing Gcgr signalling may reduce susceptibility to cardiac ischemia [167, 286]. I
have aimed to identify the role of Gcgr signalling in cardiac ischemia by treating mice in vivo,
and using ex-vivo hearts and in vitro primary cardiomyocyte and atrial cardiac cell lines with
glucagon and by utilizing Gcgr+/- mice and by generating cardiac specific Gcgr-/- mice.
38
CHAPTER 2: Dual elimination of the glucagon and GLP-1receptors in mice reveals plasticity in the incretin axis
CHAPTER 2
Dual elimination of the glucagon and GLP-1receptors in mice reveals plasticity in the incretin axis
The work presented in this chapter corresponds to the following publication: Ali S., Lamont
B., Charron M., Drucker D.J. Journal of Clinical Investigation (2011) 121(5): 1917-29
Author contributions:
B. Lamont provided assistance in islet isolation and insulin secretion experiments (Figure
2.6).
39
2.1 Research Summary
Disordered glucagon secretion contributes to the symptoms of diabetes, and reduced
glucagon action is known to improve glucose homeostasis. In mice, genetic deletion of the
glucagon receptor (Gcgr) results in increased levels of the insulinotropic hormone glucagon-like
peptide 1 (GLP-1), which may contribute to the alterations in glucose homeostasis observed in
Gcgr-/-mice. Here, we assessed the contribution of GLP-1 receptor (Glp1r) signaling to the
phenotype of Gcgr-/- mice by generating Gcgr-/-:Glp1r-/- mice. Although insulin sensitivity was
similar in all genotypes, fasting glucose was increased in Gcgr-/-:Glp1r-/- mice. Elimination of
the Glp1r normalized gastric emptying and impaired intraperitoneal glucose tolerance in Gcgr-/-
mice. Unexpectedly, deletion of Glp1r in Gcgr-/-mice did not alter the improved oral glucose
tolerance and increased insulin secretion characteristic of that genotype. Although Gcgr-/-
:Glp1r-/ -islets exhibited increased sensitivity to the incretin glucose-dependent insulinotropic
polypeptide (GIP), mice lacking both Glp1r and the GIP receptor (Gipr) maintained preservation
of the enteroinsular axis following reduction of Gcgr signaling. Moreover, Gcgr-/-:Glp1r-/-
islets expressed increased levels of the cholecystokinin A receptor (Cckar) and G protein–
coupled receptor 119 (Gpr119) mRNA transcripts, and Gcgr-/-:Glp1r-/- mice exhibited
increased sensitivity to exogenous CCK and the GPR119 agonist AR231453. Our data reveal
extensive functional plasticity in the enteroinsular axis via induction of compensatory
mechanisms that control nutrient-dependent regulation of insulin secretion.
40
2.2 Introduction
Glucagon, a 29-amino-acid peptide hormone, is produced in pancreatic α-cells and,
together with insulin, plays a key role in regulating hepatic glucose production, serving as the
first line of defense against hypoglycemia [287]. Disordered control of glucagon secretion is
observed in Type 2 Diabetes (T2D) [288-290] and together with insulin deficiency or resistance
results in metabolic derangements characteristic of T2D [291]. Glucagon exerts its actions
through a class B family G protein–coupled receptor (GPCR), the glucagon receptor (Gcgr), that
is expressed not only in the liver, but in a broad range of tissues, including the heart, the kidney,
the endocrine pancreas, and the central nervous system [292-296]. The observations that
inappropriately increased levels of glucagon promote increased hepatic glucose production and
hyperglycemia [289, 297-300] had fostered efforts targeting suppression of glucagon action for
the treatment of T2D [34]. Reduction of glucagon activity using glucagon antagonists,
immunoneutralizing antisera, or antisense oligonucleotides (ASOs) directed against Gcgr
attenuates hyperglycemia in experimental models of diabetes [118, 121, 122, 129, 130, 301-303].
The importance of glucagon action has also been examined via generation and characterization
of the Gcgr-/- mouse. Surprisingly, mice with complete germline disruption of Gcgr are viable
and grow normally [131, 274]. Gcgr-/- mice exhibited normal body weight, food intake, and
energy expenditure, yet display improved glucose tolerance, enhanced β-cell function and
insulin sensitivity, resistance to streptozotocin-induced (STZ- induced) diabetes, and delayed
gastric emptying [131, 135, 280]. These favorable phenotypes support reduction of glucagon
action for the therapy of T2D.
Interpretation of metabolic derangements arising from loss of Gcgr signaling is
complicated by the concomitant finding of markedly increased circulating levels of glucagon-
like peptide 1 (GLP-1) in Gcgr-/- mice [131]. GLP-1, a related proglucagon-derived peptide
normally secreted from enteroendocrine L cells, produces many of the actions described in Gcgr-
/- mice. The increased circulating levels of GLP-1 in Gcgr-/- mice likely reflect increased
production of bioactive GLP-1 in the Gcgr-/- pancreas [131]. As GLP-1 improves β-cell
function and glucose tolerance, reduces gastric emptying, and promotes islet cell proliferation
and resistance to STZ-induced diabetes, attribution of precise mechanisms responsible for the
improved metabolic phenotype in Gcgr-/- mice is challenging. We now demonstrate that a
41
functional GLP-1 receptor (Glp1r) is essential for control of fasting and ambient glycaemia,
enhancement of glucose-stimulated insulin secretion following i.p. glucose challenge, and
inhibition of gastric emptying in Gcgr-/- mice. Unexpectedly, Gcgr-/-:Glp1r-/- mice continued
to exhibit improved oral glucose tolerance and enhanced β-cell function despite loss of two key
insulinotropic β-cell receptors. Although loss of GLP-1 action is classically compensated for by
upregulation of the other major incretin, glucose-dependent insulinotropic polypeptide (GIP)
[304], we demonstrate that reduction of Gcgr expression in mice with combined inactivation of
both Glp1r and the GIP receptor (Gipr) genes continues to be associated with preservation of
oral glucose tolerance and enhanced insulin secretion. Disruption of the classical (Glp1r and
Gipr) entero-insular axis was associated with enhanced expression and activity of the
cholecystokinin A receptor (Cckar) and G protein–coupled receptor 119 (Gpr119), functionally
related insulinotropic receptors that respond to nutrient-sensitive signals. These findings reveal
considerable plasticity in the incretin-related mechanisms regulating β-cell function and glucose
homeostasis.
2.3 Materials and Methods
2.3.1 Animal studies
Gcgr-/-:Glp1r-/- double knockout (DKO) mice were generated by crossing double
heterozygote Glp1r+/-and Gcgr+/- mice to obtain littermate Gcgr+/+:Glp1r+/+(WT), Gcgr-/-
andGlp1r-/- single knockouts, and Gcgr-/-:Glp1r-/- DKO mice. Gipr-/-mice were provided by
Y. Seino (Kansai Electric Power Hospital, Osaka, Japan) and used to generate DIRKO mice as
previously described [192]. All mice used in these studies were male and were housed up to 5
per cage under a light/dark cycle of 12 hours in the Toronto Centre for Phenogenomics animal
facility, with free access to food and water except where noted. All procedures were conducted
according to protocols and guidelines approved by the Toronto Centre for Phenogenomics
Animal Care Committee. For confirmation of genotypes, genomic DNA prepared from tail snips
was analyzed by PCR and Southern blotting as described previously [131, 266].
2.3.2 Peptides & drugs
Treatment of mice with Gcgr ASOs. DIRKO and WT mice (11–13 weeks old) were given
42
subcutaneous injections of Gcgr ASOs (Sigma-Aldrich, ISIS 180475, hybridizes to bases 1348–
1367 of mouse Gcgr sequence NM 008101.1 and bases 1398–1417 of rat Gcgr sequence
M96674.1) at a dose of 25 mg/kg every 3.5 days for a maximum of 6 injections (22).
Intraperitoneal glucose tolerance tests (IPGTTs) were performed after administration of 3
injections of the ASOs, and oral glucose tolerance tests (OGTTs) were performed after
administration of 4 injections of the ASOs. Mice were euthanized after administration of 6
injections of the ASOs, and islets and livers were obtained and examined for gene expression.
DIRKO and WT mice treated with the Gcgr ASOs were fasted for 6 hours prior to the glucose
tolerance tests.
Treatment of mice with peptides and agonists. Gcgr-/-:Glp1r-/- mice and littermate
controls were treated orally 30 minutes prior to IPGTT with vehicle (80% polyethylene glycol
(PEG) 400, 10% Tween 80, and 10% ethanol) or the Gpr119 agonist AR231453 (5 mg/kg and 20
mg/kg, Arena Pharmaceuticals) [305]. Gcgr-/-:Glp1r-/- mice and littermate controls were
injected i.p. with PBS vehicle, [D-Ala2]GIP (1 or 2 nmol/kg) (CHI Scientific), GRP (20
nmol/kg) (Bachem), CCK-8 (9 μg/kg or 18 μg/kg), or PACAP-38 (1.3 nmol/kg), immediately
prior to IPGTT (Sigma-Aldrich).
2.3.3 Assessment of food intake and energy expenditure
Assessment of food intake. 16-18 week-old mice were fasted overnight (16–18 hours),
weighed, and then placed in individual cages containing pre-weighed rodent chow, with free
access to water. Food was reweighed after 1, 2, 4, 8, and 24 hours, and food intake was
expressed as grams consumed per gram of body weight.
Indirect calorimetry. 8-10-week-old mice were placed in individual metabolic chambers,
with free access to food and water. Oxygen consumption, CO2 production, and total and
ambulatory activity were determined by indirect calorimetry using an Oxymax System
(Columbus Instruments) as described previously [267].
2.3.4 Tissue isolation and histological analysis
Pancreata from 20- 24-week-old male mice were weighed, fixed in 10% neutral buffered
43
formalin solution for 48 hours, and then embedded in paraffin. For assessment of islet area and
histology, pancreatic sections were immunostained for insulin and/or glucagon as previously
described in [198], followed by scanning using the ScanScope CS system (Aperio Technologies)
at ×20 magnification[198]. Digital images were analyzed with ScanScope software (Aperio
Technologies). Percent islet area was calculated as the sum of the total cross-sectional area of β
and α-cells/total pancreas area multiplied by 100.
For gut mRNA analyses, 16- to 18-week-old mice were fasted in individual cages
overnight (16 hours) and allowed access to a premeasured amount of rodent chow for 1 hour.
Subsequently, duodenums were isolated and snap frozen.
2.3.5 Glucose, insulin tolerance test and measurement of plasma metabolites
Glucose tolerance and measurement of plasma metabolites. Eight- to 11-week-old male
mice were fasted overnight (16–18 hours), and glucose (1.5 mg/g body weight) was administered
orally (through a gavage tube) or via injection into the peritoneal cavity (IPGTT). Blood samples
were drawn from the tail vein at 0, 15, 30, 60, 90, and 120 minutes after glucose administration,
and blood glucose levels were measured using a Glucometer Elite blood glucose meter
(Ascensia; Bayer HealthCare). For plasma insulin determinations, blood samples (100 μl) were
drawn from the tail vein during the 0- and 15-minute time periods following glucose
administration in a heparinized tube. Plasma was separated by centrifugation at 4°C and stored at
–80°C until assayed. Plasma was assayed for insulin using a mouse insulin ELISA kit (Alpco).
Plasma GLP-1 levels were measured using a mouse/rat total GLP-1 assay kit (Meso Scale
Discovery). Plasma GIP levels were assessed using a mouse/rat total GIP ELISA kit (Linco).
Plasma GLP-2 levels were assessed using a mouse/rat total GLP-2 assay kit (Alpco). Plasma
levels of active GLP-1 and glucagon were measured using a mouse Milliplex endocrine assay
(Millipore).
Insulin tolerance test. Twelve- to 13-week-old male mice were fasted for 5 hours and
given 0.7 U/kg insulin (Humulin R, 100 U/ml; Lilly) by i.p. injection. Blood samples for blood
glucose determination were drawn from the tail vein at 0, 20, 40, 60, 90, 120, and 180 minutes
following insulin administration.
44
2.3.6 Solid and liquid phase gastric emptying
Gastric emptying. Gastric emptying was assessed using two protocols. For measurement
of solid-phase gastric emptying, 12-week-old mice were fasted in individual cages overnight (16
hours) and allowed access to a pre-measured amount of rodent chow for 1 hour. Food intake was
determined by reweighing the rodent chow after 1 hour of refeeding. The stomach was isolated
and gastric contents retrieved and weighed. The gastric emptying was determined using the
following calculation: gastric emptying (%) = (1 – [stomach content wet weight/food intake]) ×
100. In the second protocol, liquid-phase gastric emptying was assessed using the acetaminophen
absorption test [306]. Ten- to 11-week-old mice were fasted overnight and administered a
solution containing acetaminophen at a dose of 100 mg/kg by gavage. Tail vein blood (50 μl)
was collected into heparinized tubes at 0 and 15 minutes after acetaminophen administration.
Plasma was separated by centrifugation at 4°C and stored at –20°C until measurement of
acetaminophen levels using an enzymatic- spectrophotometric assay (Diagnostic Chemicals
Ltd.).
2.3.7 Islet isolation
After CO2 euthanasia, pancreata from mice were inflated via the pancreatic duct with
collagenase type V (0.7 mg/ml in HBSS), excised, and digested at 37°C for 10–15 minutes. The
resulting digest was washed twice with cold HBSS (containing 0.25% wt/vol BSA), and islets
were separated using a Histopaque density gradient (Sigma-Aldrich). The interface containing
islets was removed and washed with HBSS plus BSA, and islets were resuspended in RPMI
medium containing 10% FBS, 2 mM l-glutamine, 11 mM glucose, 100 U/ml penicillin, and 100
μg/ml streptomycin. After 4 hours of incubation at 37°C, islets were handpicked into fresh
RPMI medium (containing 5.6 mM glucose) and allowed to recover overnight. Islets with
preserved architectural integrity were either used for insulin secretion experiments or washed
twice in PBS before being lysed by QIAshredder columns for RNA extraction using the RNeasy
Micro Kit (QIAGEN). For insulin secretion, islets were preincubated in Krebs-Ringer buffer
(KRB) containing 0.1% BSA, 10 mM HEPES (pH 7.4), and 2.8 mM glucose for 60 minutes.
Batches of 10 islets were distributed into wells containing 0.5 ml KRB with either 2.8 or 16.7
mM glucose, with or without [D-Ala2]GIP, L-arginine, PACAP, tolbutamide, or Ex-4 at the
45
indicated concentrations. After incubation for 1 hour at 37°C, secretion medium was collected
and stored at –20°C for assessment of insulin secretion. Islet insulin was extracted by transfer of
islets to cold acid-ethanol solution (70% ethanol, 0.18 M HCl) and brief sonication (10 seconds).
Insulin levels in secretion media and islet extracts were measured by RIA (Millipore). For cAMP
studies, batches of 10 islets were distributed into wells containing 0.5 ml KRB with 16.7 mM
glucose, with or without 1, 3, or 10 nM [D-Ala2]GIP for 1 hour at 37°C. Reactions were
terminated by the addition of ice-cold absolute ethanol, and cell extracts were collected and
stored at –80°C until measurement of cAMP using a cAMP RIA kit according to the
manufacturer’s instructions (Biomedical Technologies). CAMP levels were normalized to insulin
content.
2.3.8 Real-time qRT-PCR
RNA analyses. Following RNA isolation, first-strand complementary DNA was
synthesized from total RNA using the SuperScript III reverse transcriptase synthesis system
(Invitrogen) and random hexamers. Real-time PCR was performed with the ABI Prism 7900
Sequence Detection System using TaqMan Gene Expression Assays and TaqMan Universal PCR
Master Mix (Applied Biosystems). Levels of RNA transcripts were quantified using the 2–ΔΔCt
method normalized to peptidyl-propyl isomerase A (cyclophilin).
2.3.9 Statistical Analysis
Statistics. Results are presented as mean ± SEM. Statistical significance was determined
using 1-way or 2-way ANOVA with Bonferroni post-hoc tests (as appropriate) using GraphPad
Prism 4.0 (GraphPad Software Inc.). Statistical significance was noted when P values were less
than 0.05.
2.4 Results
2.4.1 Glp1r is not required for pancreas enlargement or α-cell hyperplasia in Gcgr-/-mice.
Body weight, food intake, physical activity, and energy expenditure were comparable in
WT, single incretin receptor knockout, and Gcgr-/-:Glp1r-/- mice (Figure 2.1). As Gcgr-/-mice
exhibit increased pancreatic mass, marked islet, and α-cell hyperplasia [307], and Glp1r
46
activation promotes expansion of islet and pancreatic mass [308-310], we assessed the
contribution of Glp1r to the development of these abnormalities in Gcgr-/- mice. Consistent with
previous findings, Gcgr-/- mice exhibited very high circulating levels of GLP-1 (Figure 2.2A),
significantly increased pancreas weight, and an approximately 4-fold increase in islet area
(Figure 2.3); however, islet area and pancreatic mass remained significantly increased to a
similar extent in Gcgr-/-:Glp1r-/- mice (Figure 2.3, A and B). Immunohistochemical analysis
revealed that the increased islet area was predominantly due to α-cell hyperplasia, with most
Gcgr-/- and Gcgr-/-:Glp1r-/- islets containing a core of β-cells surrounded by an expanded
mantle of hyperplastic α-cells (Figure 2.3C). Hence, Glp1r is not required for development of
increased pancreatic mass and islet hyperplasia following loss of Gcgr action.
2.4.2 Disruption of Glp1r leads to increased fasting glycaemia in Gcgr-/-mice.
Both fasting and random glucose were reduced in Gcgr-/- mice (Figure 2.4, A and B),
consistent with the central role of glucagon in the maintenance of euglycemia [131]. Basal GLP-
1R signaling also regulates fasting glycaemia [266] classically through suppression of glucagon
secretion [311]. Surprisingly, a significant increase in fasting glucose was observed in Gcgr-/-
:Glp1r-/- compared with Gcgr-/- mice (Figure 2.4A) and elimination of the Glp1r normalized
random-fed glycaemia in Gcgr-/-:Glp1r-/- mice (Figure 2.4B). Hence, loss of Glp1r substantially
attenuates improvements in both ambient and fasting glycaemia in Gcgr-/- mice [131].
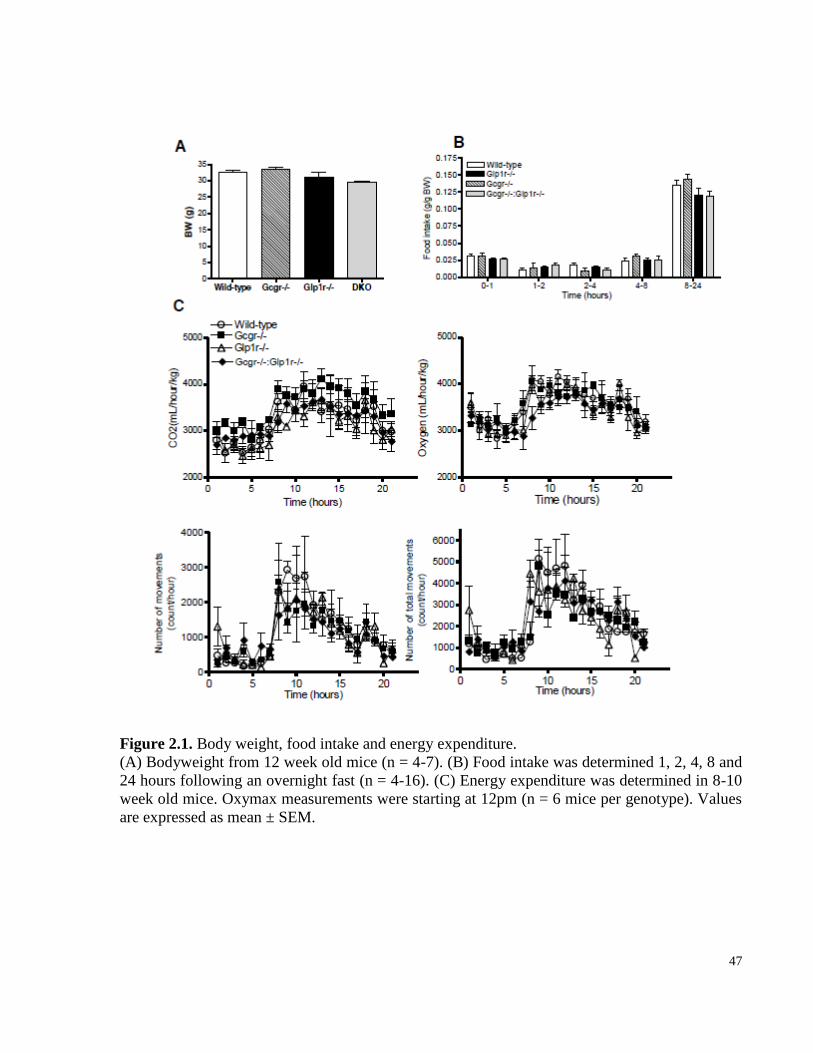
47
Figure 2.1. Body weight, food intake and energy expenditure.
(A) Bodyweight from 12 week old mice (n = 4-7). (B) Food intake was determined 1, 2, 4, 8 and
24 hours following an overnight fast (n = 4-16). (C) Energy expenditure was determined in 8-10
week old mice. Oxymax measurements were starting at 12pm (n = 6 mice per genotype). Values
are expressed as mean ± SEM.
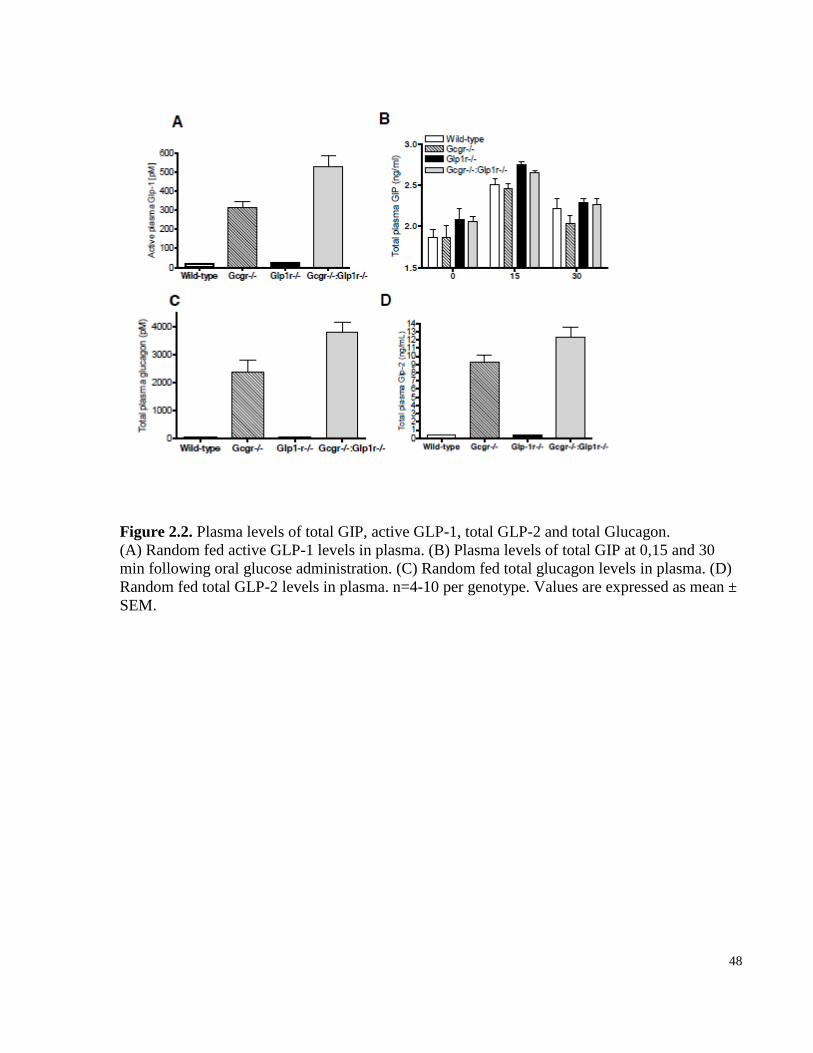
48
Figure 2.2. Plasma levels of total GIP, active GLP-1, total GLP-2 and total Glucagon.
(A) Random fed active GLP-1 levels in plasma. (B) Plasma levels of total GIP at 0,15 and 30
min following oral glucose administration. (C) Random fed total glucagon levels in plasma. (D)
Random fed total GLP-2 levels in plasma. n=4-10 per genotype. Values are expressed as mean ±
SEM.
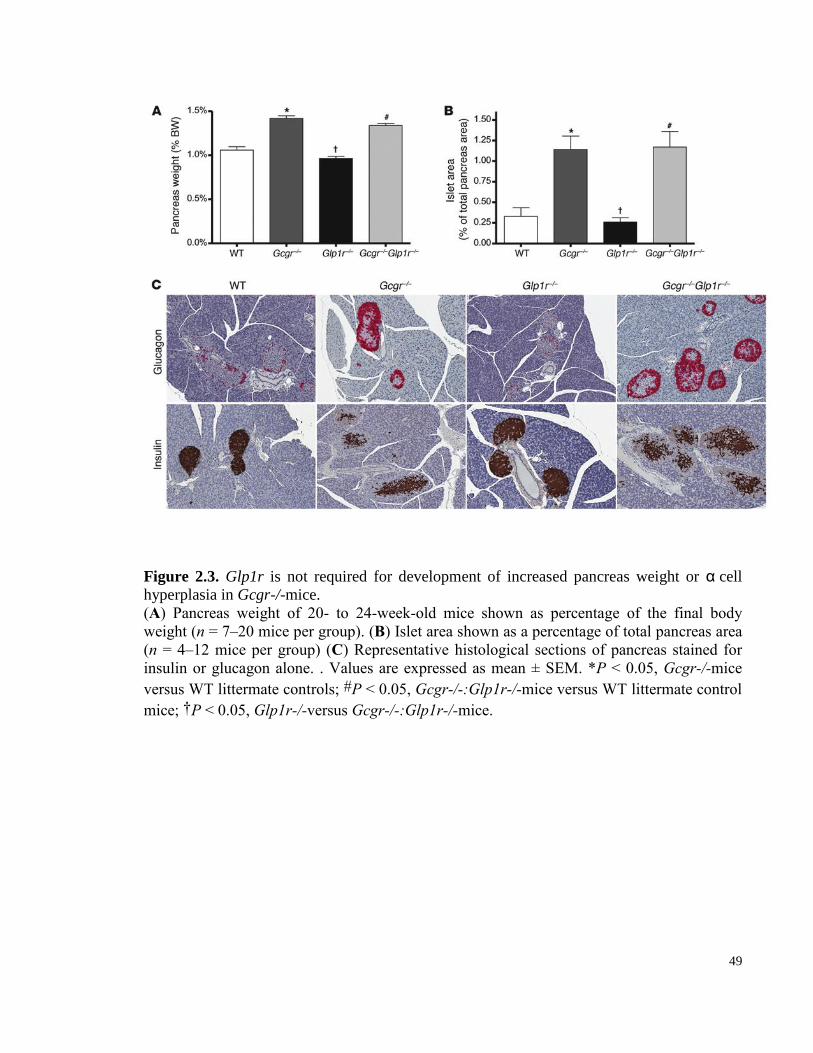
49
Figure 2.3. Glp1r is not required for development of increased pancreas weight or αcell
hyperplasia in Gcgr-/-mice.
(A) Pancreas weight of 20- to 24-week-old mice shown as percentage of the final body
weight (n = 7–20 mice per group). (B) Islet area shown as a percentage of total pancreas area
(n = 4–12 mice per group) (C) Representative histological sections of pancreas stained for
insulin or glucagon alone. . Values are expressed as mean ± SEM. *P < 0.05, Gcgr-/-mice
versus WT littermate controls; #P < 0.05, Gcgr-/-:Glp1r-/-mice versus WT littermate control
mice; †P < 0.05, Glp1r-/-versus Gcgr-/-:Glp1r-/-mice.
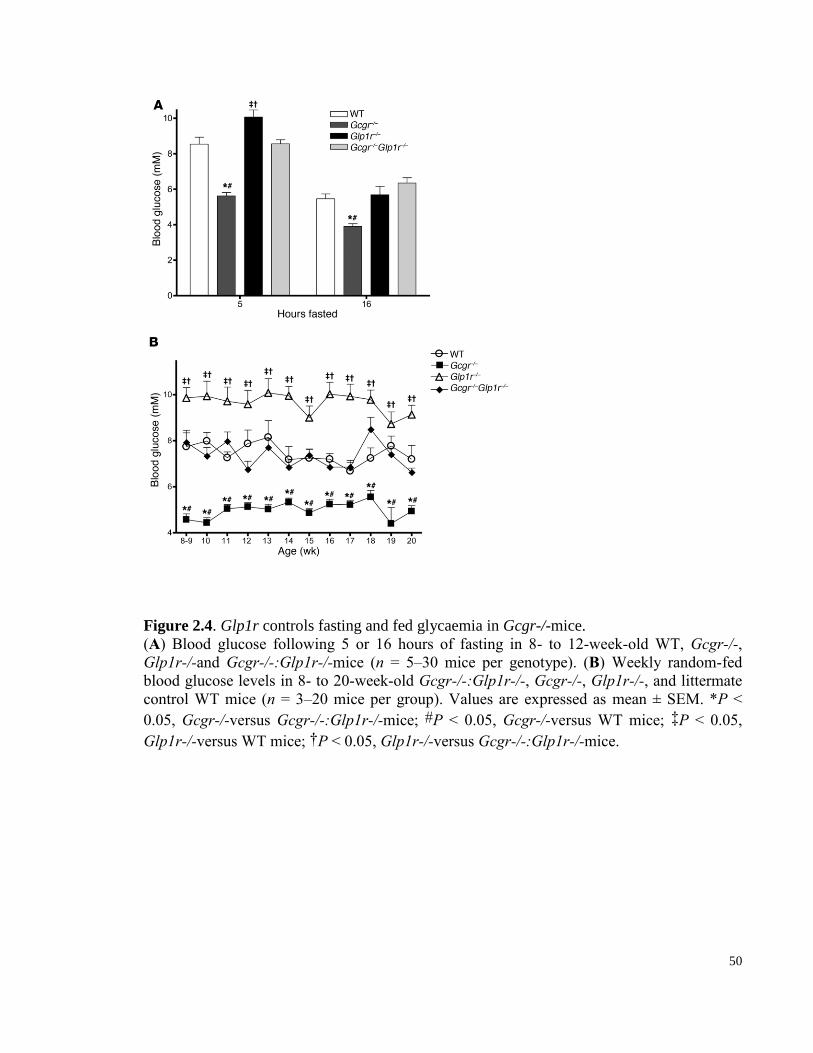
50
Figure 2.4. Glp1r controls fasting and fed glycaemia in Gcgr-/-mice.
(A) Blood glucose following 5 or 16 hours of fasting in 8- to 12-week-old WT, Gcgr-/-,
Glp1r-/-and Gcgr-/-:Glp1r-/-mice (n = 5–30 mice per genotype). (B) Weekly random-fed
blood glucose levels in 8- to 20-week-old Gcgr-/-:Glp1r-/-, Gcgr-/-, Glp1r-/-, and littermate
control WT mice (n = 3–20 mice per group). Values are expressed as mean ± SEM. *P <
0.05, Gcgr-/-versus Gcgr-/-:Glp1r-/-mice; #P < 0.05, Gcgr-/-versus WT mice; ‡P < 0.05,
Glp1r-/-versus WT mice; †P < 0.05, Glp1r-/-versus Gcgr-/-:Glp1r-/-mice.
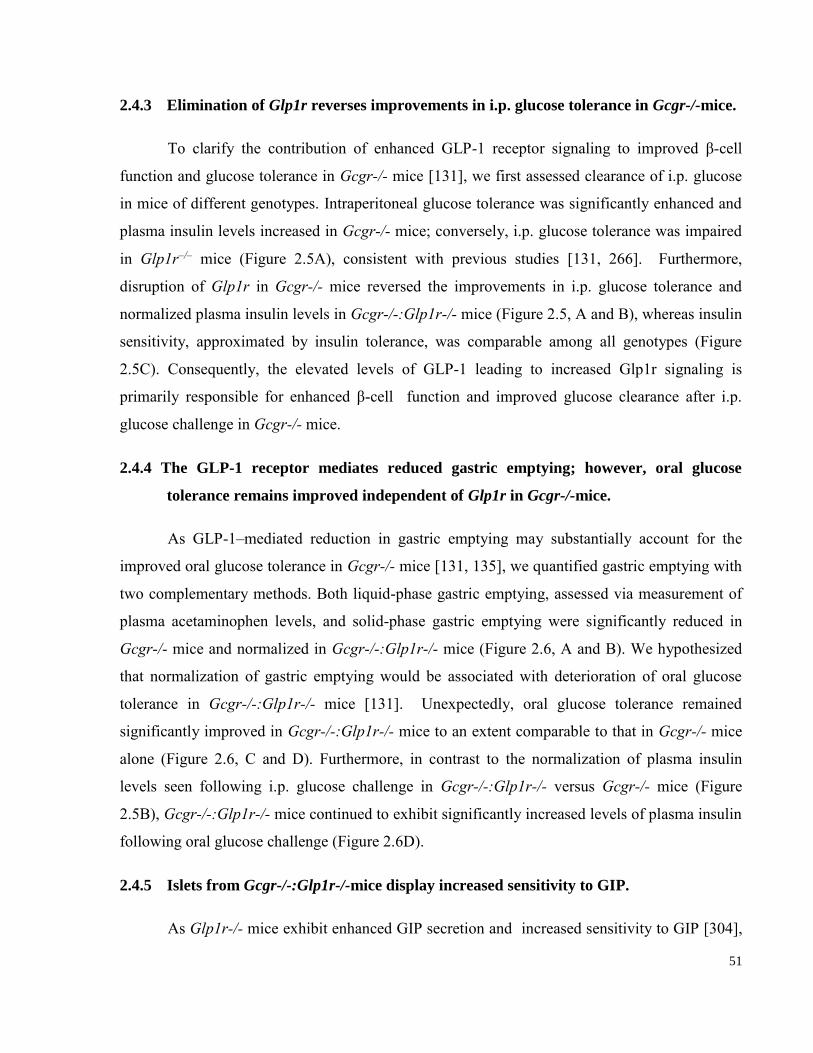
51
2.4.3 Elimination of Glp1r reverses improvements in i.p. glucose tolerance in Gcgr-/-mice.
To clarify the contribution of enhanced GLP-1 receptor signaling to improved β-cell
function and glucose tolerance in Gcgr-/- mice [131], we first assessed clearance of i.p. glucose
in mice of different genotypes. Intraperitoneal glucose tolerance was significantly enhanced and
plasma insulin levels increased in Gcgr-/- mice; conversely, i.p. glucose tolerance was impaired
in Glp1r–/– mice (Figure 2.5A), consistent with previous studies [131, 266]. Furthermore,
disruption of Glp1r in Gcgr-/- mice reversed the improvements in i.p. glucose tolerance and
normalized plasma insulin levels in Gcgr-/-:Glp1r-/- mice (Figure 2.5, A and B), whereas insulin
sensitivity, approximated by insulin tolerance, was comparable among all genotypes (Figure
2.5C). Consequently, the elevated levels of GLP-1 leading to increased Glp1r signaling is
primarily responsible for enhanced β-cell function and improved glucose clearance after i.p.
glucose challenge in Gcgr-/- mice.
2.4.4 The GLP-1 receptor mediates reduced gastric emptying; however, oral glucose
tolerance remains improved independent of Glp1r in Gcgr-/-mice.
As GLP-1–mediated reduction in gastric emptying may substantially account for the
improved oral glucose tolerance in Gcgr-/- mice [131, 135], we quantified gastric emptying with
two complementary methods. Both liquid-phase gastric emptying, assessed via measurement of
plasma acetaminophen levels, and solid-phase gastric emptying were significantly reduced in
Gcgr-/- mice and normalized in Gcgr-/-:Glp1r-/- mice (Figure 2.6, A and B). We hypothesized
that normalization of gastric emptying would be associated with deterioration of oral glucose
tolerance in Gcgr-/-:Glp1r-/- mice [131]. Unexpectedly, oral glucose tolerance remained
significantly improved in Gcgr-/-:Glp1r-/- mice to an extent comparable to that in Gcgr-/- mice
alone (Figure 2.6, C and D). Furthermore, in contrast to the normalization of plasma insulin
levels seen following i.p. glucose challenge in Gcgr-/-:Glp1r-/- versus Gcgr-/- mice (Figure
2.5B), Gcgr-/-:Glp1r-/- mice continued to exhibit significantly increased levels of plasma insulin
following oral glucose challenge (Figure 2.6D).
2.4.5 Islets from Gcgr-/-:Glp1r-/-mice display increased sensitivity to GIP.
As Glp1r-/- mice exhibit enhanced GIP secretion and increased sensitivity to GIP [304],
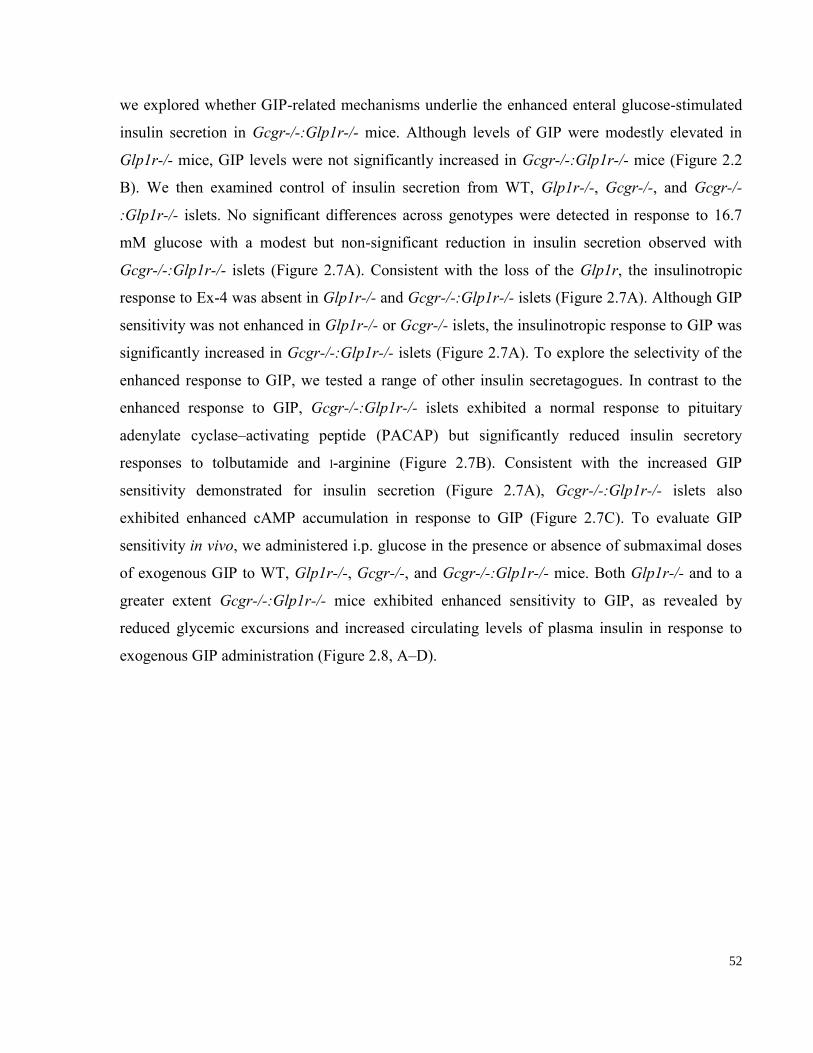
52
we explored whether GIP-related mechanisms underlie the enhanced enteral glucose-stimulated
insulin secretion in Gcgr-/-:Glp1r-/- mice. Although levels of GIP were modestly elevated in
Glp1r-/- mice, GIP levels were not significantly increased in Gcgr-/-:Glp1r-/- mice (Figure 2.2
B). We then examined control of insulin secretion from WT, Glp1r-/-, Gcgr-/-, and Gcgr-/-
:Glp1r-/- islets. No significant differences across genotypes were detected in response to 16.7
mM glucose with a modest but non-significant reduction in insulin secretion observed with
Gcgr-/-:Glp1r-/- islets (Figure 2.7A). Consistent with the loss of the Glp1r, the insulinotropic
response to Ex-4 was absent in Glp1r-/- and Gcgr-/-:Glp1r-/- islets (Figure 2.7A). Although GIP
sensitivity was not enhanced in Glp1r-/- or Gcgr-/- islets, the insulinotropic response to GIP was
significantly increased in Gcgr-/-:Glp1r-/- islets (Figure 2.7A). To explore the selectivity of the
enhanced response to GIP, we tested a range of other insulin secretagogues. In contrast to the
enhanced response to GIP, Gcgr-/-:Glp1r-/- islets exhibited a normal response to pituitary
adenylate cyclase–activating peptide (PACAP) but significantly reduced insulin secretory
responses to tolbutamide and l-arginine (Figure 2.7B). Consistent with the increased GIP
sensitivity demonstrated for insulin secretion (Figure 2.7A), Gcgr-/-:Glp1r-/- islets also
exhibited enhanced cAMP accumulation in response to GIP (Figure 2.7C). To evaluate GIP
sensitivity in vivo, we administered i.p. glucose in the presence or absence of submaximal doses
of exogenous GIP to WT, Glp1r-/-, Gcgr-/-, and Gcgr-/-:Glp1r-/- mice. Both Glp1r-/- and to a
greater extent Gcgr-/-:Glp1r-/- mice exhibited enhanced sensitivity to GIP, as revealed by
reduced glycemic excursions and increased circulating levels of plasma insulin in response to
exogenous GIP administration (Figure 2.8, A–D).
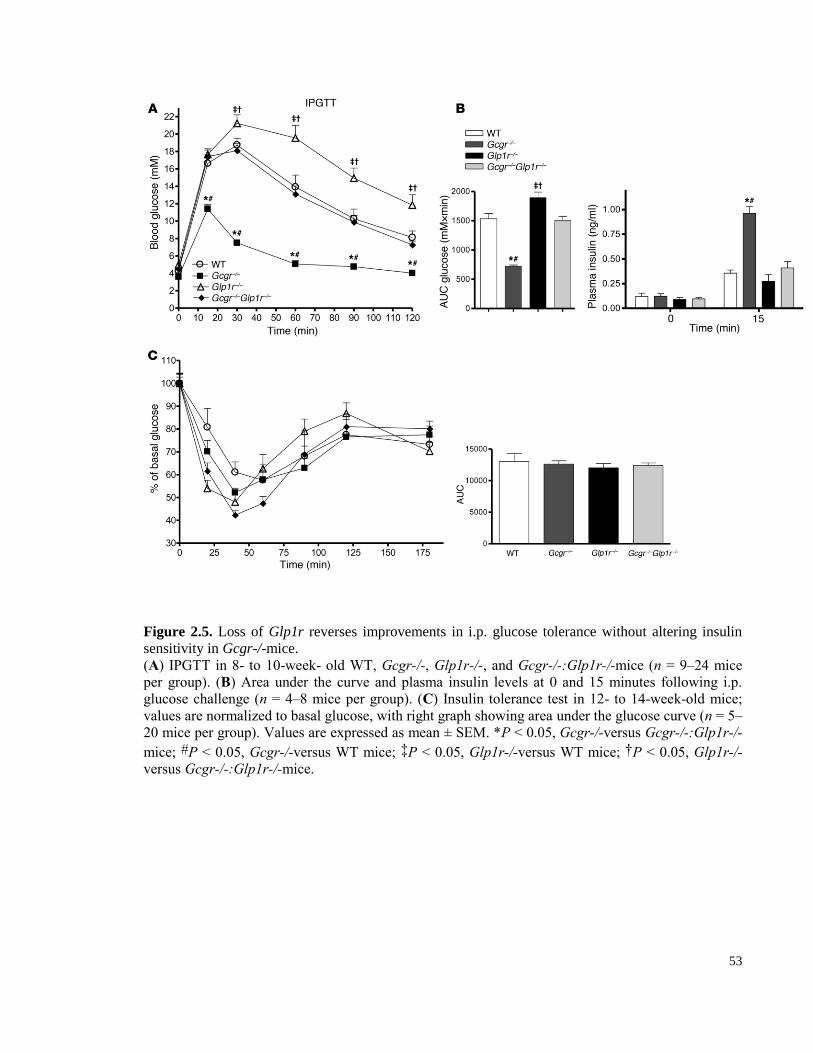
53
Figure 2.5. Loss of Glp1r reverses improvements in i.p. glucose tolerance without altering insulin
sensitivity in Gcgr-/-mice.
(A) IPGTT in 8- to 10-week- old WT, Gcgr-/-, Glp1r-/-, and Gcgr-/-:Glp1r-/-mice (n = 9–24 mice
per group). (B) Area under the curve and plasma insulin levels at 0 and 15 minutes following i.p.
glucose challenge (n = 4–8 mice per group). (C) Insulin tolerance test in 12- to 14-week-old mice;
values are normalized to basal glucose, with right graph showing area under the glucose curve (n = 5–
20 mice per group). Values are expressed as mean ± SEM. *P < 0.05, Gcgr-/-versus Gcgr-/-:Glp1r-/-
mice; #P < 0.05, Gcgr-/-versus WT mice; ‡P < 0.05, Glp1r-/-versus WT mice; †P < 0.05, Glp1r-/-
versus Gcgr-/-:Glp1r-/-mice.
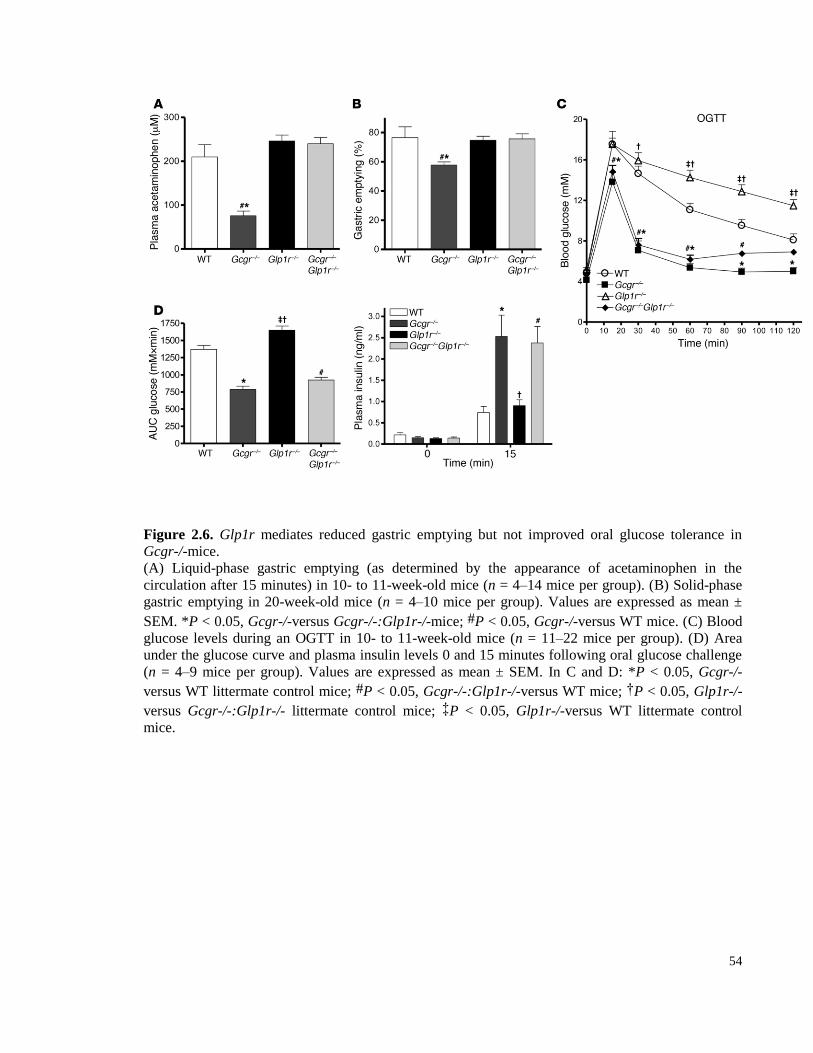
54
Figure 2.6. Glp1r mediates reduced gastric emptying but not improved oral glucose tolerance in
Gcgr-/-mice.
(A) Liquid-phase gastric emptying (as determined by the appearance of acetaminophen in the
circulation after 15 minutes) in 10- to 11-week-old mice (n = 4–14 mice per group). (B) Solid-phase
gastric emptying in 20-week-old mice (n = 4–10 mice per group). Values are expressed as mean ±
SEM. *P < 0.05, Gcgr-/-versus Gcgr-/-:Glp1r-/-mice; #P < 0.05, Gcgr-/-versus WT mice. (C) Blood
glucose levels during an OGTT in 10- to 11-week-old mice (n = 11–22 mice per group). (D) Area
under the glucose curve and plasma insulin levels 0 and 15 minutes following oral glucose challenge
(n = 4–9 mice per group). Values are expressed as mean ± SEM. In C and D: *P < 0.05, Gcgr-/-
versus WT littermate control mice; #P < 0.05, Gcgr-/-:Glp1r-/-versus WT mice; †P < 0.05, Glp1r-/-
versus Gcgr-/-:Glp1r-/- littermate control mice; ‡P < 0.05, Glp1r-/-versus WT littermate control
mice.
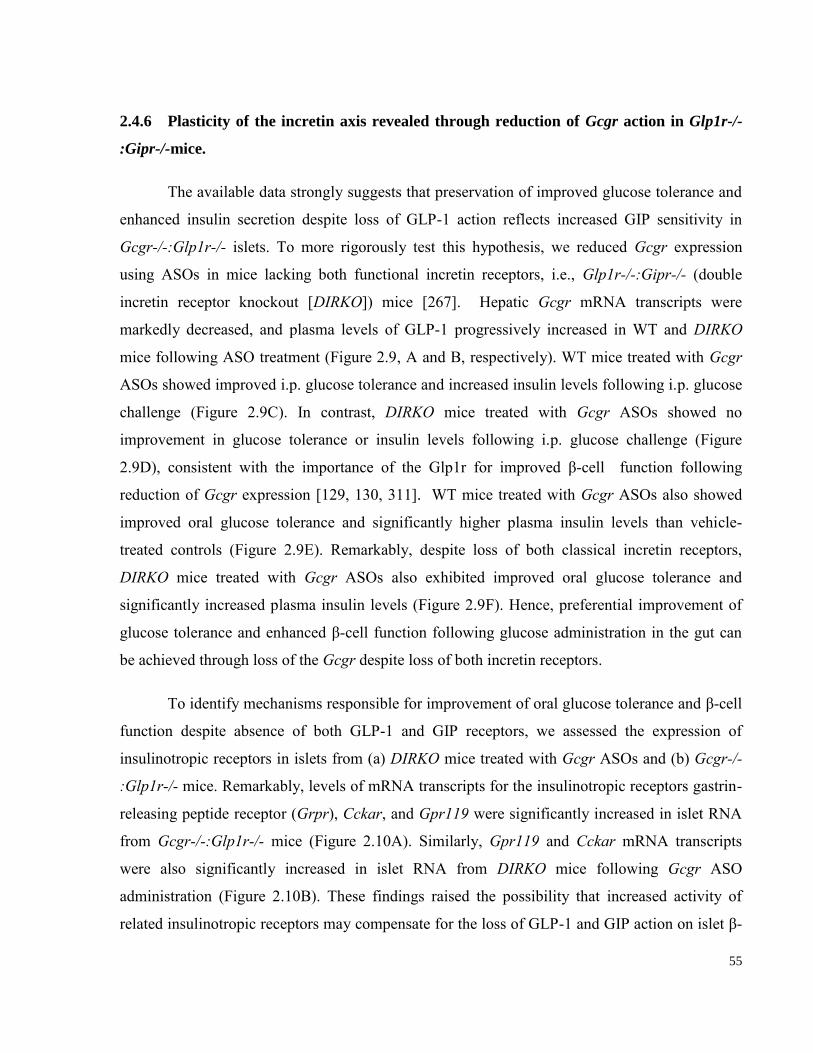
55
2.4.6 Plasticity of the incretin axis revealed through reduction of Gcgr action in Glp1r-/-
:Gipr-/-mice.
The available data strongly suggests that preservation of improved glucose tolerance and
enhanced insulin secretion despite loss of GLP-1 action reflects increased GIP sensitivity in
Gcgr-/-:Glp1r-/- islets. To more rigorously test this hypothesis, we reduced Gcgr expression
using ASOs in mice lacking both functional incretin receptors, i.e., Glp1r-/-:Gipr-/- (double
incretin receptor knockout [DIRKO]) mice [267]. Hepatic Gcgr mRNA transcripts were
markedly decreased, and plasma levels of GLP-1 progressively increased in WT and DIRKO
mice following ASO treatment (Figure 2.9, A and B, respectively). WT mice treated with Gcgr
ASOs showed improved i.p. glucose tolerance and increased insulin levels following i.p. glucose
challenge (Figure 2.9C). In contrast, DIRKO mice treated with Gcgr ASOs showed no
improvement in glucose tolerance or insulin levels following i.p. glucose challenge (Figure
2.9D), consistent with the importance of the Glp1r for improved β-cell function following
reduction of Gcgr expression [129, 130, 311]. WT mice treated with Gcgr ASOs also showed
improved oral glucose tolerance and significantly higher plasma insulin levels than vehicle-
treated controls (Figure 2.9E). Remarkably, despite loss of both classical incretin receptors,
DIRKO mice treated with Gcgr ASOs also exhibited improved oral glucose tolerance and
significantly increased plasma insulin levels (Figure 2.9F). Hence, preferential improvement of
glucose tolerance and enhanced β-cell function following glucose administration in the gut can
be achieved through loss of the Gcgr despite loss of both incretin receptors.
To identify mechanisms responsible for improvement of oral glucose tolerance and β-cell
function despite absence of both GLP-1 and GIP receptors, we assessed the expression of
insulinotropic receptors in islets from (a) DIRKO mice treated with Gcgr ASOs and (b) Gcgr-/-
:Glp1r-/- mice. Remarkably, levels of mRNA transcripts for the insulinotropic receptors gastrin-
releasing peptide receptor (Grpr), Cckar, and Gpr119 were significantly increased in islet RNA
from Gcgr-/-:Glp1r-/- mice (Figure 2.10A). Similarly, Gpr119 and Cckar mRNA transcripts
were also significantly increased in islet RNA from DIRKO mice following Gcgr ASO
administration (Figure 2.10B). These findings raised the possibility that increased activity of
related insulinotropic receptors may compensate for the loss of GLP-1 and GIP action on islet β-
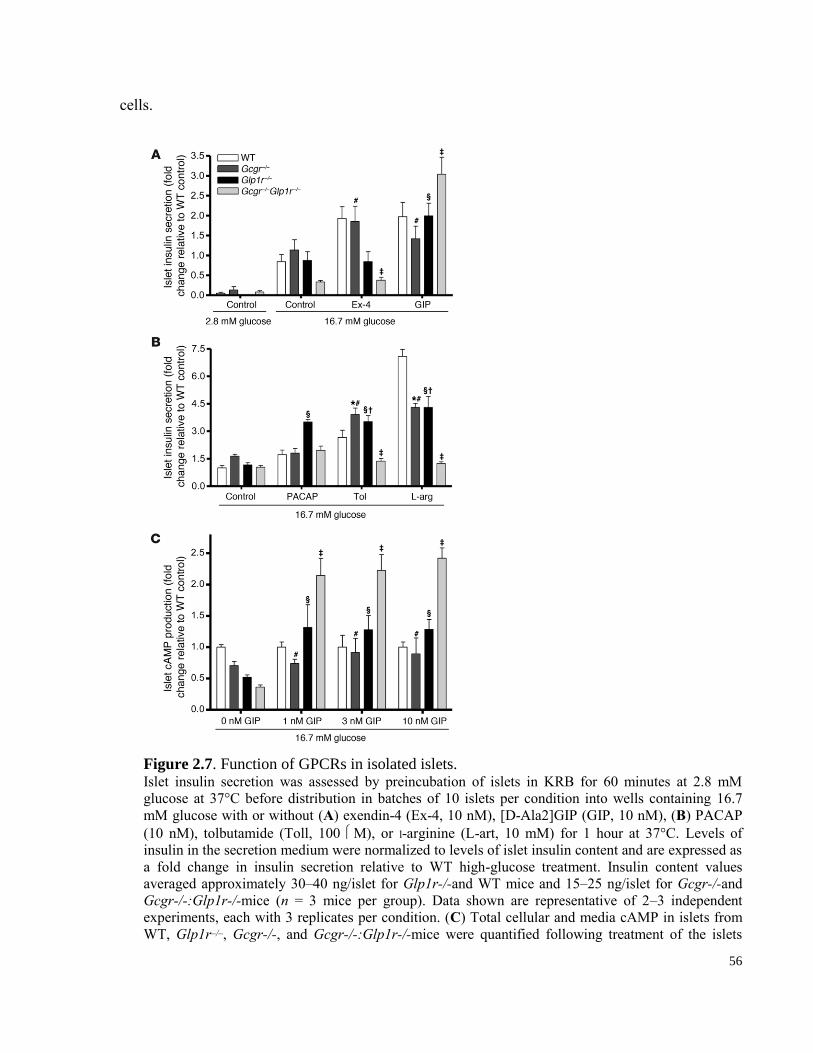
56
cells.
Figure 2.7. Function of GPCRs in isolated islets. Islet insulin secretion was assessed by preincubation of islets in KRB for 60 minutes at 2.8 mM
glucose at 37°C before distribution in batches of 10 islets per condition into wells containing 16.7
mM glucose with or without (A) exendin-4 (Ex-4, 10 nM), [D-Ala2]GIP (GIP, 10 nM), (B) PACAP
(10 nM), tolbutamide (Toll, 100 M), or l-arginine (L-art, 10 mM) for 1 hour at 37°C. Levels of
insulin in the secretion medium were normalized to levels of islet insulin content and are expressed as
a fold change in insulin secretion relative to WT high-glucose treatment. Insulin content values
averaged approximately 30–40 ng/islet for Glp1r-/-and WT mice and 15–25 ng/islet for Gcgr-/-and
Gcgr-/-:Glp1r-/-mice (n = 3 mice per group). Data shown are representative of 2–3 independent
experiments, each with 3 replicates per condition. (C) Total cellular and media cAMP in islets from
WT, Glp1r–/–, Gcgr-/-, and Gcgr-/-:Glp1r-/-mice were quantified following treatment of the islets
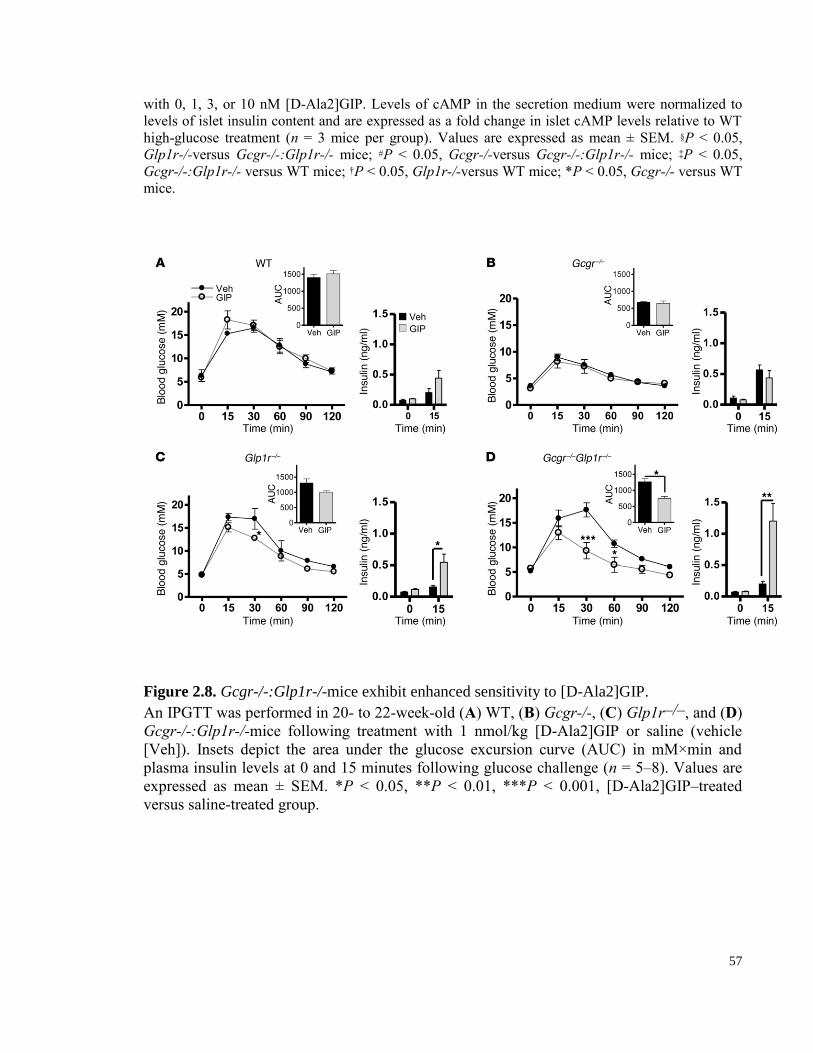
57
with 0, 1, 3, or 10 nM [D-Ala2]GIP. Levels of cAMP in the secretion medium were normalized to
levels of islet insulin content and are expressed as a fold change in islet cAMP levels relative to WT
high-glucose treatment (n = 3 mice per group). Values are expressed as mean ± SEM. §P < 0.05,
Glp1r-/-versus Gcgr-/-:Glp1r-/- mice; #P < 0.05, Gcgr-/-versus Gcgr-/-:Glp1r-/- mice; ‡P < 0.05,
Gcgr-/-:Glp1r-/- versus WT mice; †P < 0.05, Glp1r-/-versus WT mice; *P < 0.05, Gcgr-/- versus WT
mice.
Figure 2.8. Gcgr-/-:Glp1r-/-mice exhibit enhanced sensitivity to [D-Ala2]GIP.
An IPGTT was performed in 20- to 22-week-old (A) WT, (B) Gcgr-/-, (C) Glp1r–/–, and (D)
Gcgr-/-:Glp1r-/-mice following treatment with 1 nmol/kg [D-Ala2]GIP or saline (vehicle
[Veh]). Insets depict the area under the glucose excursion curve (AUC) in mM×min and
plasma insulin levels at 0 and 15 minutes following glucose challenge (n = 5–8). Values are
expressed as mean ± SEM. *P < 0.05, **P < 0.01, ***P < 0.001, [D-Ala2]GIP–treated
versus saline-treated group.
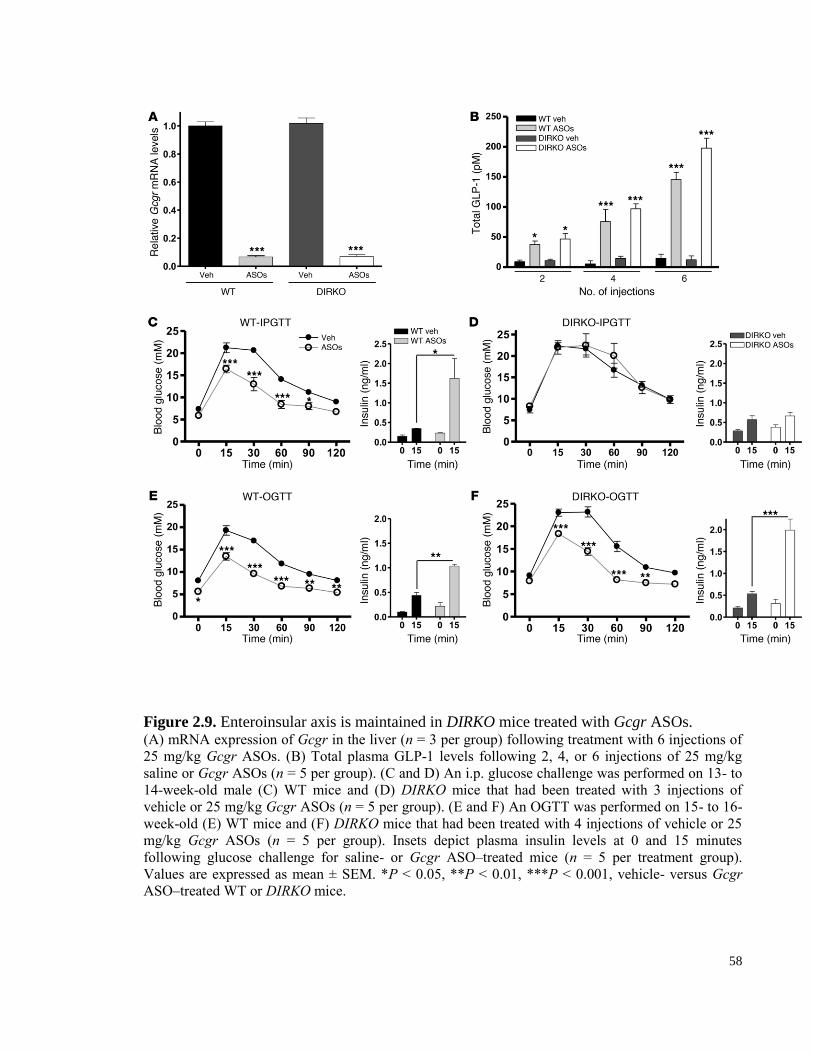
58
Figure 2.9. Enteroinsular axis is maintained in DIRKO mice treated with Gcgr ASOs. (A) mRNA expression of Gcgr in the liver (n = 3 per group) following treatment with 6 injections of
25 mg/kg Gcgr ASOs. (B) Total plasma GLP-1 levels following 2, 4, or 6 injections of 25 mg/kg
saline or Gcgr ASOs (n = 5 per group). (C and D) An i.p. glucose challenge was performed on 13- to
14-week-old male (C) WT mice and (D) DIRKO mice that had been treated with 3 injections of
vehicle or 25 mg/kg Gcgr ASOs (n = 5 per group). (E and F) An OGTT was performed on 15- to 16-
week-old (E) WT mice and (F) DIRKO mice that had been treated with 4 injections of vehicle or 25
mg/kg Gcgr ASOs (n = 5 per group). Insets depict plasma insulin levels at 0 and 15 minutes
following glucose challenge for saline- or Gcgr ASO–treated mice (n = 5 per treatment group).
Values are expressed as mean ± SEM. *P < 0.05, **P < 0.01, ***P < 0.001, vehicle- versus Gcgr
ASO–treated WT or DIRKO mice.
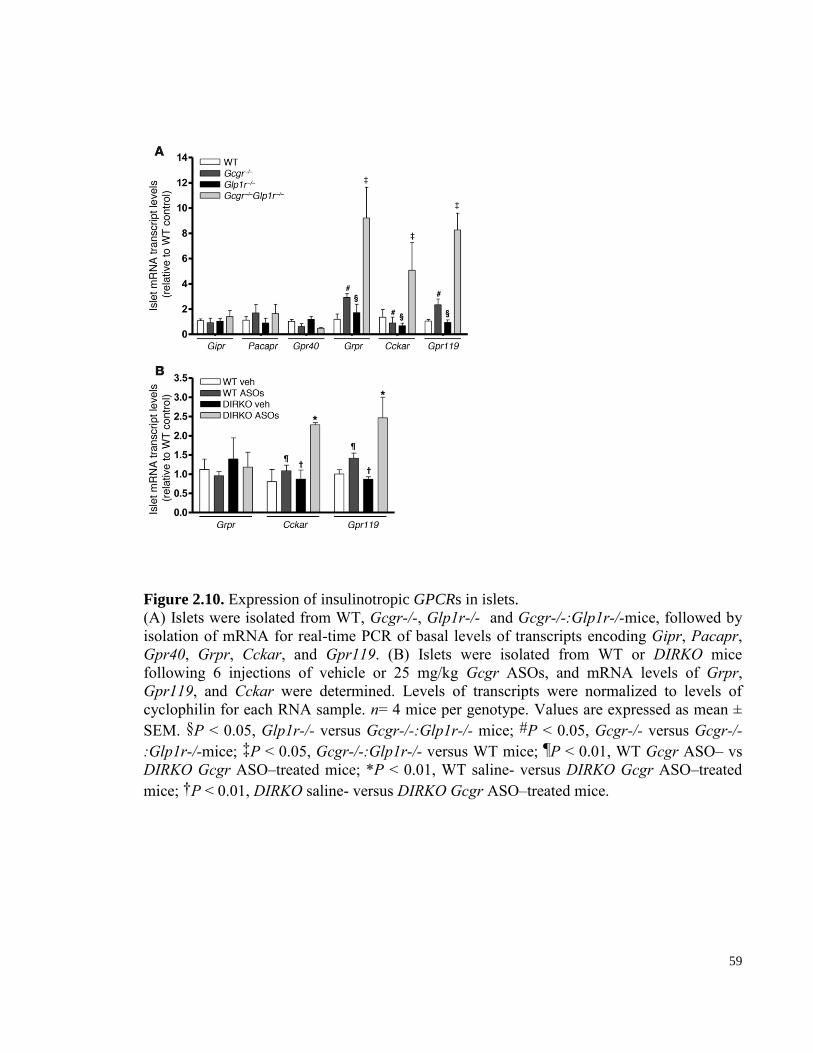
59
Figure 2.10. Expression of insulinotropic GPCRs in islets.
(A) Islets were isolated from WT, Gcgr-/-, Glp1r-/- and Gcgr-/-:Glp1r-/-mice, followed by
isolation of mRNA for real-time PCR of basal levels of transcripts encoding Gipr, Pacapr,
Gpr40, Grpr, Cckar, and Gpr119. (B) Islets were isolated from WT or DIRKO mice
following 6 injections of vehicle or 25 mg/kg Gcgr ASOs, and mRNA levels of Grpr,
Gpr119, and Cckar were determined. Levels of transcripts were normalized to levels of
cyclophilin for each RNA sample. n= 4 mice per genotype. Values are expressed as mean ±
SEM. §P < 0.05, Glp1r-/- versus Gcgr-/-:Glp1r-/- mice; #P < 0.05, Gcgr-/- versus Gcgr-/-
:Glp1r-/-mice; ‡P < 0.05, Gcgr-/-:Glp1r-/- versus WT mice; ¶P < 0.01, WT Gcgr ASO– vs
DIRKO Gcgr ASO–treated mice; *P < 0.01, WT saline- versus DIRKO Gcgr ASO–treated
mice; †P < 0.01, DIRKO saline- versus DIRKO Gcgr ASO–treated mice.
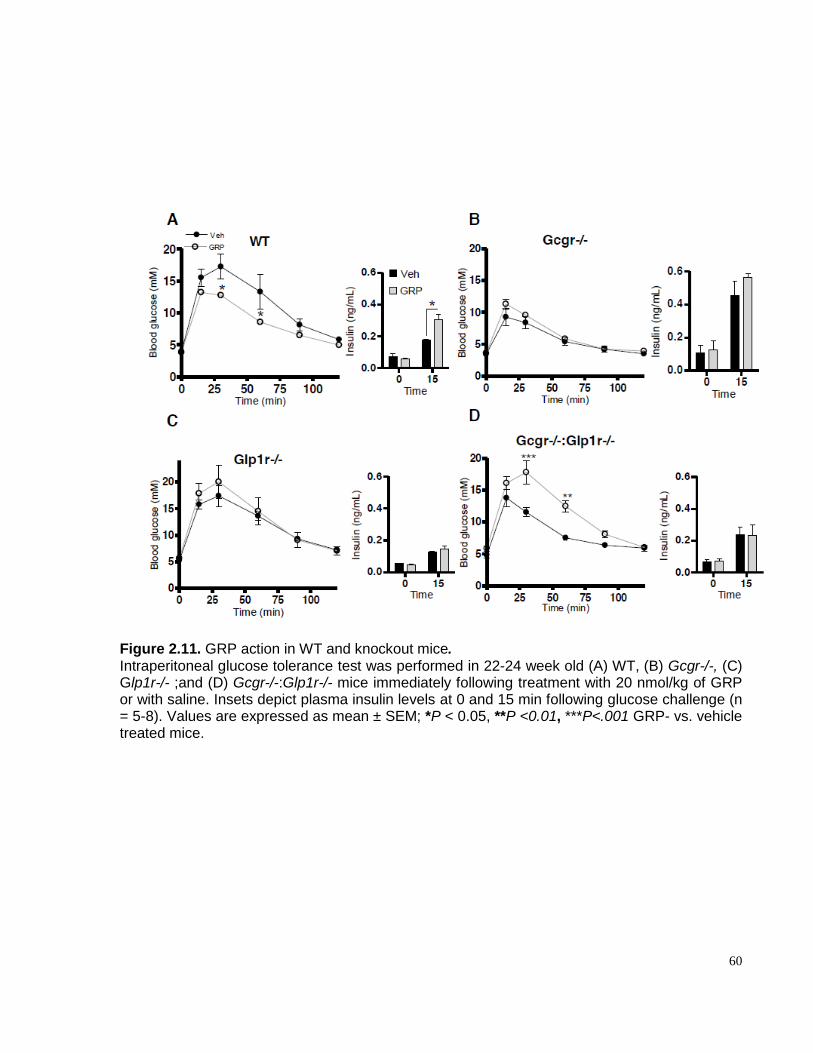
60
Figure 2.11. GRP action in WT and knockout mice. Intraperitoneal glucose tolerance test was performed in 22-24 week old (A) WT, (B) Gcgr-/-, (C) Glp1r-/- ;and (D) Gcgr-/-:Glp1r-/- mice immediately following treatment with 20 nmol/kg of GRP or with saline. Insets depict plasma insulin levels at 0 and 15 min following glucose challenge (n = 5-8). Values are expressed as mean ± SEM; *P < 0.05, **P <0.01, ***P<.001 GRP- vs. vehicle treated mice.
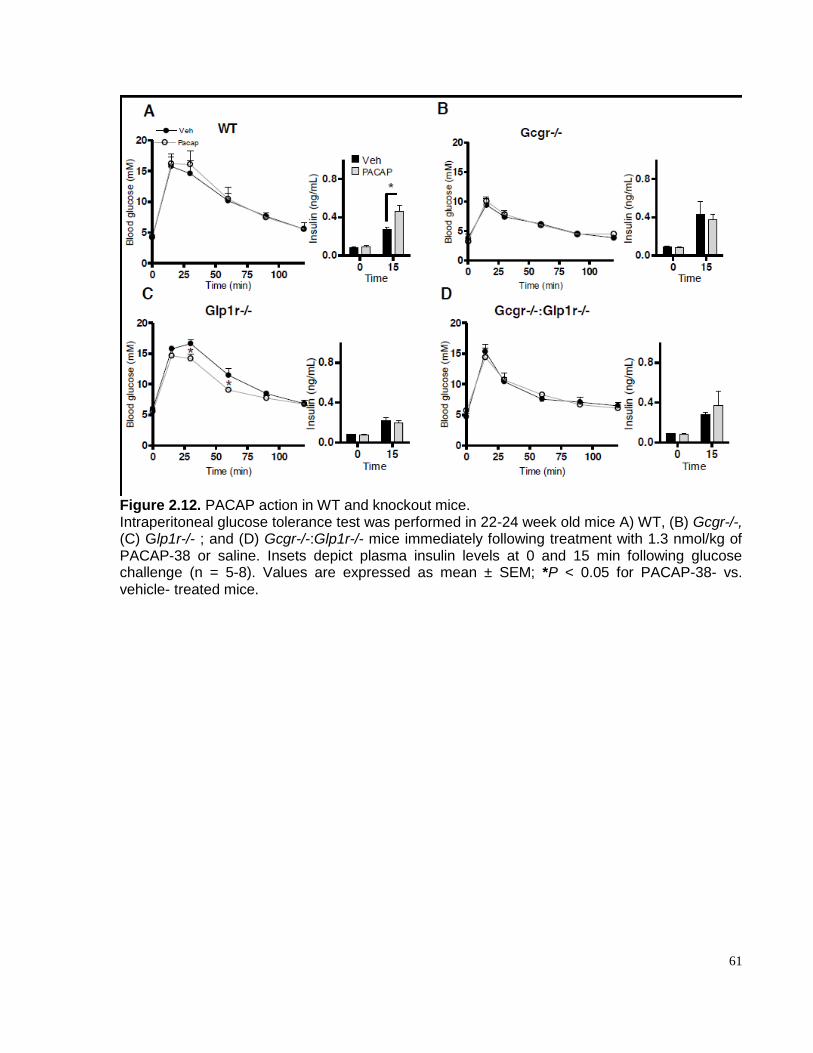
61
Figure 2.12. PACAP action in WT and knockout mice. Intraperitoneal glucose tolerance test was performed in 22-24 week old mice A) WT, (B) Gcgr-/-, (C) Glp1r-/- ; and (D) Gcgr-/-:Glp1r-/- mice immediately following treatment with 1.3 nmol/kg of PACAP-38 or saline. Insets depict plasma insulin levels at 0 and 15 min following glucose challenge (n = 5-8). Values are expressed as mean ± SEM; *P < 0.05 for PACAP-38- vs. vehicle- treated mice.
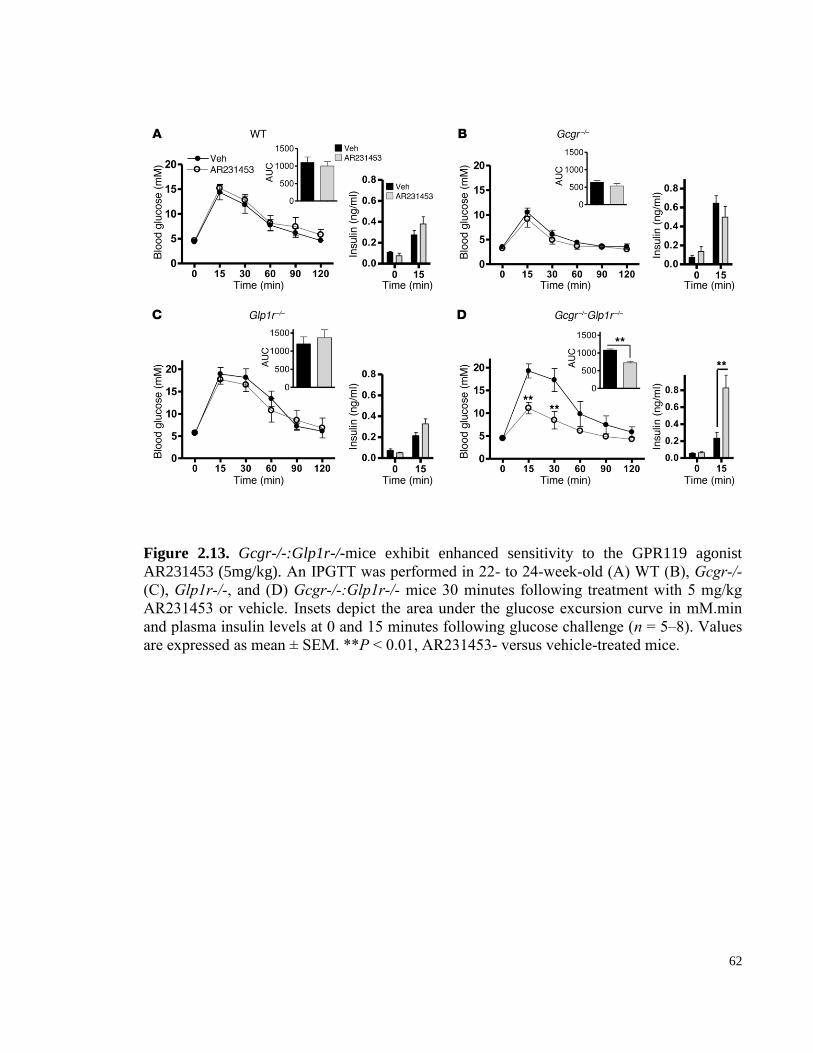
62
Figure 2.13. Gcgr-/-:Glp1r-/-mice exhibit enhanced sensitivity to the GPR119 agonist
AR231453 (5mg/kg). An IPGTT was performed in 22- to 24-week-old (A) WT (B), Gcgr-/-
(C), Glp1r-/-, and (D) Gcgr-/-:Glp1r-/- mice 30 minutes following treatment with 5 mg/kg
AR231453 or vehicle. Insets depict the area under the glucose excursion curve in mM.min
and plasma insulin levels at 0 and 15 minutes following glucose challenge (n = 5–8). Values
are expressed as mean ± SEM. **P < 0.01, AR231453- versus vehicle-treated mice.
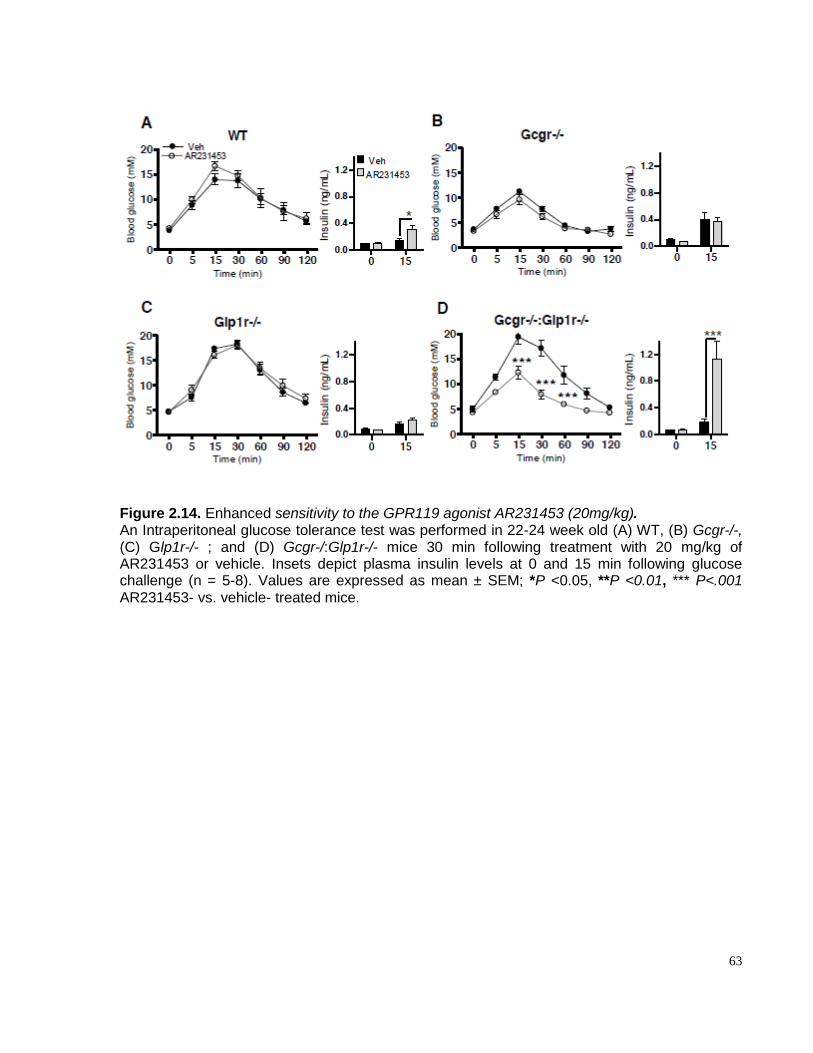
63
Figure 2.14. Enhanced sensitivity to the GPR119 agonist AR231453 (20mg/kg). An Intraperitoneal glucose tolerance test was performed in 22-24 week old (A) WT, (B) Gcgr-/-, (C) Glp1r-/- ; and (D) Gcgr-/:Glp1r-/- mice 30 min following treatment with 20 mg/kg of AR231453 or vehicle. Insets depict plasma insulin levels at 0 and 15 min following glucose challenge (n = 5-8). Values are expressed as mean ± SEM; *P <0.05, **P <0.01, *** P<.001 AR231453- vs. vehicle- treated mice.
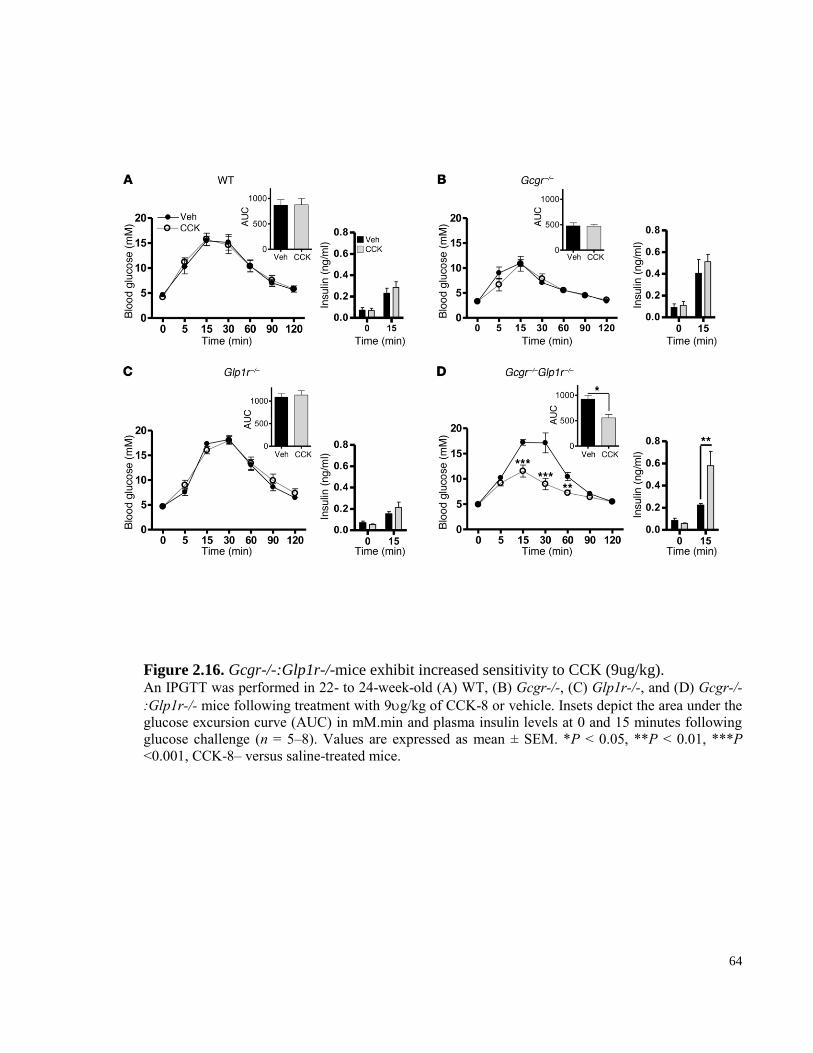
64
Figure 2.16. Gcgr-/-:Glp1r-/-mice exhibit increased sensitivity to CCK (9ug/kg). An IPGTT was performed in 22- to 24-week-old (A) WT, (B) Gcgr-/-, (C) Glp1r-/-, and (D) Gcgr-/-
:Glp1r-/- mice following treatment with 9g/kg of CCK-8 or vehicle. Insets depict the area under the
glucose excursion curve (AUC) in mM.min and plasma insulin levels at 0 and 15 minutes following
glucose challenge (n = 5–8). Values are expressed as mean ± SEM. *P < 0.05, **P < 0.01, ***P
<0.001, CCK-8– versus saline-treated mice.
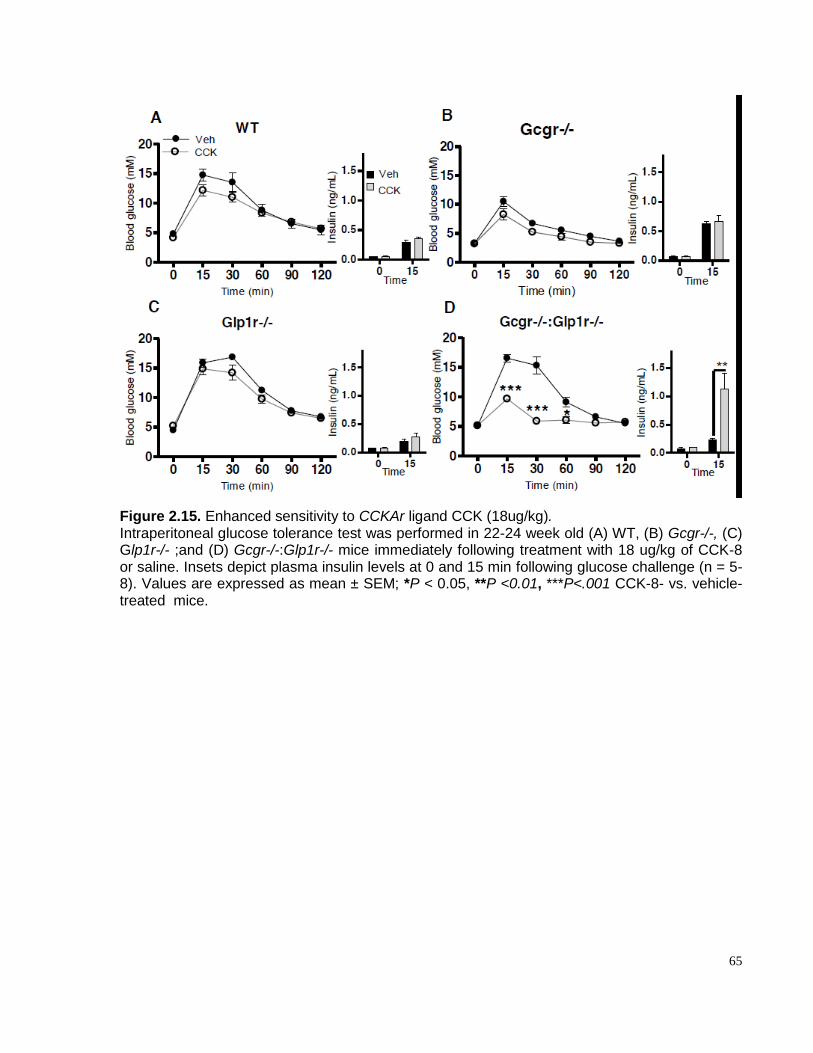
65
Figure 2.15. Enhanced sensitivity to CCKAr ligand CCK (18ug/kg). Intraperitoneal glucose tolerance test was performed in 22-24 week old (A) WT, (B) Gcgr-/-, (C) Glp1r-/- ;and (D) Gcgr-/-:Glp1r-/- mice immediately following treatment with 18 ug/kg of CCK-8 or saline. Insets depict plasma insulin levels at 0 and 15 min following glucose challenge (n = 5-8). Values are expressed as mean ± SEM; *P < 0.05, **P <0.01, ***P<.001 CCK-8- vs. vehicle- treated mice.
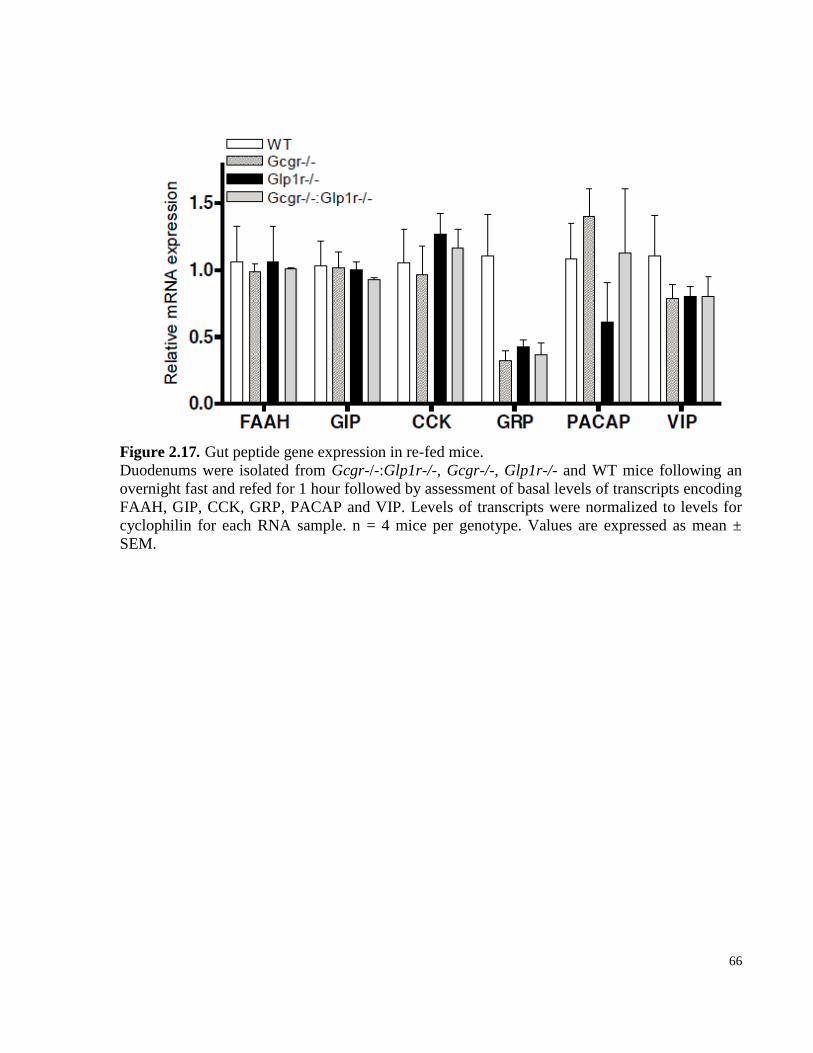
66
Figure 2.17. Gut peptide gene expression in re-fed mice.
Duodenums were isolated from Gcgr-/-:Glp1r-/-, Gcgr-/-, Glp1r-/- and WT mice following an
overnight fast and refed for 1 hour followed by assessment of basal levels of transcripts encoding
FAAH, GIP, CCK, GRP, PACAP and VIP. Levels of transcripts were normalized to levels for
cyclophilin for each RNA sample. n = 4 mice per genotype. Values are expressed as mean ±
SEM.
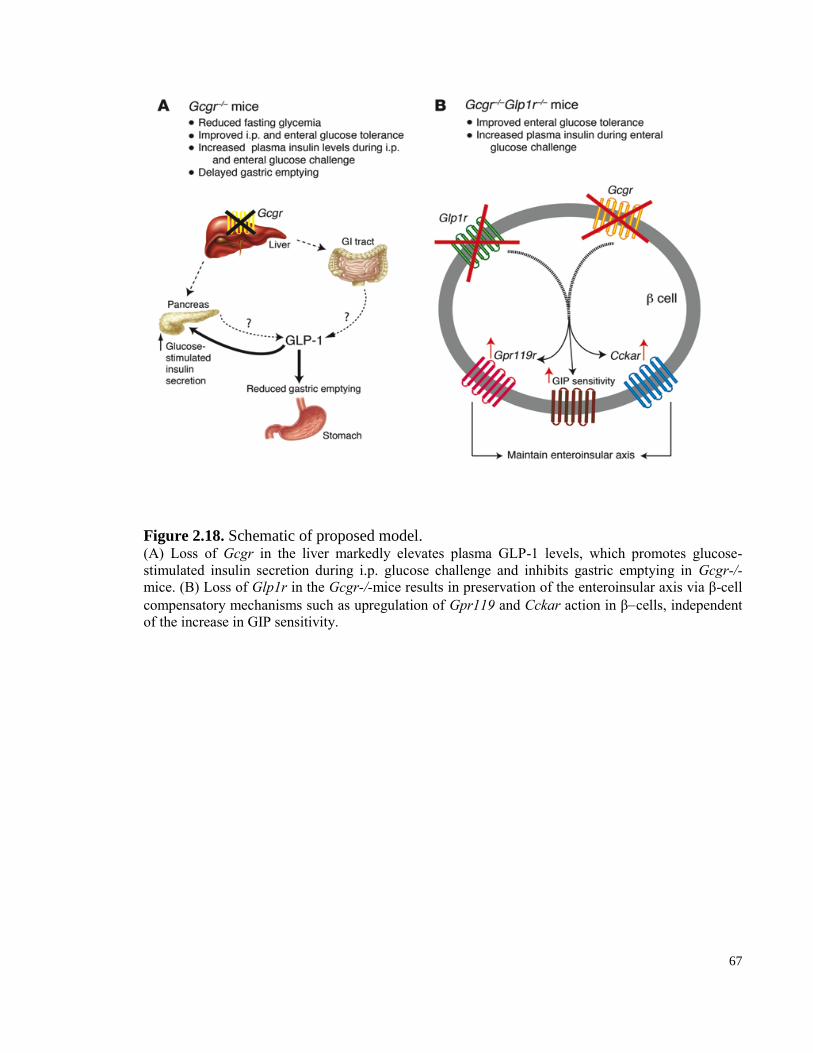
67
Figure 2.18. Schematic of proposed model. (A) Loss of Gcgr in the liver markedly elevates plasma GLP-1 levels, which promotes glucose-
stimulated insulin secretion during i.p. glucose challenge and inhibits gastric emptying in Gcgr-/-
mice. (B) Loss of Glp1r in the Gcgr-/-mice results in preservation of the enteroinsular axis via β-cell
compensatory mechanisms such as upregulation of Gpr119 and Cckar action in βcells, independent
of the increase in GIP sensitivity.
68
2.4.7 Gcgr-/-:Glp1r-/-mice display increased sensitivity to Gpr119 and Cckar agonists.
To assess the functional significance of increased islet receptor expression, we carried out
glucose tolerance tests in the presence or absence of exogenous GRP, CCK, PACAP, and the
GPR119 agonist AR231453 [305] in WT, Gcgr-/-,Glp1r-/-, and Gcgr-/-:Glp1r-/- mice. We did
not detect enhanced sensitivity to exogenous GRP or PACAP (Figure 2.11 and Figure 2.12, A–
D). However, although AR231453 failed to improve i.p. glucose tolerance in WT, Gcgr-/-, or
Glp1r-/-mice, a robust improvement in glucose tolerance and marked stimulation of plasma
insulin levels were observed following AR231453 administration in Gcgr-/-:Glp1r-/- mice
(Figure 2.13, A–D, and Figure 2.14, A–D). Similarly, doses of CCK that failed to improve i.p.
glucose tolerance in WT or single Gcgr-/- or Glp1r–/– mice produced a significant reduction in
glycemic excursion and significantly elevated plasma insulin levels in Gcgr-/-:Glp1r-/- mice,
consistent with increased sensitivity to CCK (Figure 2.15, A–D, and Figure 2.16, A–D).
2.5 Discussion
The central importance of glucagon action for the maintenance of euglycemia, together
with observations that glucagon secretion may be inappropriately increased in many subjects
with T2D, has fostered great interest in reduction of glucagon action for the treatment of T2D.
Indeed, multiple therapeutic modalities, including insulin, amylin analogs, Glp1r agonists, and
dipeptidyl peptidase–4 inhibitors, exert their anti-diabetic actions in part through suppression of
glucagon secretion [5]. The Gcgr-/-mice are healthy mice with reduced fasting and postprandial
glycaemia [307], resistance to diet-induced obesity, and enhanced β-cell function and survival
[135] further support the concept of reducing glucagon receptor signaling for treatment of T2D.
Our studies clearly show that a substantial component of the improved metabolic phenotype of
Gcgr-/- mice, including control of fasting and fed glycaemia, reduced gastric emptying,
improved i.p. glucose tolerance, and enhanced β-cell function, reflects concomitant upregulation
of GLP-1 action in Gcgr-/- mice (Figure 2.18).
Although incretin action classically controls postprandial glucose excursion, considerable
evidence supports a role for GLP-1 in the regulation of fasting glucose. GLP-1 receptor agonists
69
reduce fasting glucose in human subjects, in association with reduced levels of circulating
glucagon [185]. Moreover, the Glp1r antagonist Ex-9-39 increases fasting glucose and glucagon
levels in baboons [312], and genetic disruption of the Glp1r is associated with fasting
hyperglycemia in Glp1r-/- mice, without detectable changes in levels of fasting glucagon [266].
Surprisingly, elimination of GLP-1 action significantly increased fasting glycaemia in Gcgr-/-
:Glp1r-/- mice. These observations further demonstrate that Glp1r dependent pathways may
regulate fasting glucose independent of glucagon action, perhaps through incompletely
understood neural mechanisms or through reductions in basal cAMP levels in the β-cell s [313].
Reduction or loss of Gcgr signaling [274, 307] or resistance to glucagon action [314] lead to
hyperplasia of the exocrine and endocrine pancreas. Selective liver-specific deletion of the gene
encoding the G protein Gsα generates a similar phenotype characterized by markedly increased
levels of glucagon and GLP-1, increased pancreatic mass, and islet hyperplasia [314]. Moreover,
this constellation of pancreatic abnormalities is reversible, as glucagon replacement in glucagon-
deficient PC2-knockout mice normalizes a substantial proportion of these pancreatic phenotypes
[315]. Although Glp1r activation promotes expansion of islet and pancreatic mass [308, 310], α-
cell hyperplasia is not generally observed following administration of Glp1r agonists. Consistent
with these findings, our data demonstrate that the Glp1r does not mediate pancreatic or islet α-
cell proliferation in Gcgr-/- mice. As Gcgr-/- mice are born with normal pancreatic mass and
only modest α-cell hyperplasia [131, 133], the precise mechanisms linking loss of the Gcgr to
marked postnatal expansion of the exocrine and endocrine islet compartments remain unclear.
The finding of reduced gastric emptying in Gcgr-/- mice [135] might be explained by
enhanced action of multiple proglucagon-derived peptides. GLP-1, oxyntomodulin, and, to a
lesser extent, GLP-2 inhibit gastric emptying [316, 317], and GLP-1, and oxyntomodulin exert
their actions on gastric emptying through the GLP-1 receptor. Unexpectedly, however, despite
normalization of gastric emptying in Gcgr-/-:Glp1r-/- mice, oral glucose tolerance remained
substantially improved in Gcgr-/-:Glp1r-/- mice, despite elimination of Glp1r action. Further to
this, the levels of circulating insulin remained significantly increased following oral glucose
challenge despite loss of Glp1r action in Gcgr-/-:Glp1r-/- mice. These findings implicate
sustained enhancement of β-cell function as a mechanism underlying persistent improvement in
oral glucose tolerance despite loss of Glp1r action in Gcgr-/-:Glp1r-/- mice.
70
The demonstration that the Gcgr-/-:Glp1r-/- β-cell maintains enhanced insulin secretion
in response to oral glucose was unexpected given the previous demonstration of selectively
impaired β-cell function in Gcgr-/- mice compared with age- and sex-matched WT C57BL/6
mice [120], and the multiple lines of evidence supporting important roles for both GLP-1 and
glucagon in the control of glucose-stimulated insulin secretion. Glucagon directly stimulates
insulin secretion in the rat pancreas independent of GLP-1 receptor action [318], and transgenic
Gcgr expression in murine β-cell s significantly augment glucose-stimulated insulin secretion
and reduce random glycaemia in RIP-Gcgr transgenic mice [47]. Moreover, the glucagon
antagonist des-His1-[Glu9]-glucagon-amide significantly reduced glucose-stimulated insulin
release in human islets [319]. Similarly, GLP-1 induces β-cell glucose competence, upregulates
insulin biosynthesis and secretion, and markedly enhances glucose sensitivity and glucose-
stimulated insulin secretion even in poorly responsive diabetic β-cells [320]. Hence, given the
results of previous observations reporting impaired β-cell function in Gcgr-/- islets [120], we
initially predicted that a further deterioration in β-cell function would ensue following removal
of the Glp1r signaling system in Gcgr-/- mice.
Surprisingly, however, elimination of Glp1r in Gcgr-/- mice did not lead to deterioration
in glycemic excursion after oral glucose loading in Gcgr-/-:Glp1r-/- mice. The preferential
preservation of improved oral glucose tolerance and enhanced insulin secretion following
glucose administration via the gastrointestinal tract, despite functional elimination of both the
Gcgr and Glp1r, strongly implicates the existence of one or more gut-derived compensatory
factors that augment β-cell function in an “incretin-like” manner in Gcgr-/-:Glp1r-/- mice. As
compensatory upregulation of GIP action has been described in Glp1r-/- mice, we postulated that
upregulation of the GIP-Gipr axis might similarly explain preservation of improved oral glucose
tolerance in mice following loss of glucagon and GLP-1 action. Although circulating levels of
GIP and levels of Gipr mRNA transcripts were not increased in islets from Gcgr-/-:Glp1r-/-
mice, we detected increased insulin secretion and enhanced cAMP accumulation following
treatment of Gcgr-/-:Glp1r-/- islets with GIP, consistent with increased GIP sensitivity.
Furthermore, glucose tolerance was significantly improved, and plasma insulin levels were
markedly increased following administration of GIP in vivo, further supporting enhanced
sensitivity to GIP as a compensatory mechanism augmenting β-cell function in Gcgr-/-:Glp1r-/-
71
mice.
Unexpectedly, however, we continued to observe preferential improvement of oral
glucose tolerance and β-cell function in DIRKO mice treated with ASOs to reduce Gcgr
expression, implying the existence of additional incretin-like mechanisms compensating for the
lack of insulinotropic activity normally subserved by the glucagon, GLP-1, and GIP receptors.
Our data demonstrating increased islet expression and functional activity of Cckar and Gpr119
mRNA transcripts from Gcgr-/-:Glp1r-/- mice, and in islets from DIRKO mice treated with Gcgr
ASOs, reveal a mechanism compensating for the loss of insulinotropic incretin receptors (Figure
11B). The finding of greatly enhanced sensitivity in vivo (improved glucose tolerance and
plasma insulin levels) to exogenous ligands for both the Cckar and Gpr119 receptors is
consistent with an important role for these receptors in maintaining an incretin response to
enteral glucose administration despite loss of GLP-1 and GIP action. It is notable that the
putative ligands for both Cckar, namely CCK, and Gpr119, principally lipid-derived amides such
as oleoylethanolamide and N-oleoyldopamine, would be expected to increase significantly
following oral, but not i.p., glucose administration, consistent with our findings of enhanced oral,
but not i.p., glucose clearance in Gcgr-/-:Glp1r-/- mice. Interestingly, β-cells from DIRKO mice
appeared to compensate for loss of incretin receptor and Gcgr expression by similar induction of
Cckar and Gpr119 expression, extending the findings of islet incretin receptor plasticity to a
second related, yet genetically distinct model.
Studies of islet adaptation classically carried out in the context of β-cell injury and
regeneration, pregnancy, or high-fat feeding have revealed numerous changes in islet gene
expression thought to be linked to the need to expand β-cell mass and/or enhance β-cell
function in response to insulin resistance [321-323]. Consequently, the concept of β-cell
plasticity is reasonably well established under physiological conditions requiring enhanced
functional β-cell mass. There is considerably less information concerning the potential plasticity
of the gut-islet axis in circumstances associated with impairment or disruption of classic incretin
receptor signals normally emanating from the GLP-1 and GIP receptors. Our observations made
using two distinct genetic models, the Gcgr-/-:Glp1r-/- mouse and the DIRKO mouse treated
with Gcgr ASOs, reveal a heretofore unrecognized capacity for β-cell adaptation to loss of
insulinotropic receptor signaling (Figure 11). It was fascinating how upregulation of Cckar and

72
Gpr119 expression was also observed in murine islets from pregnant mice, although the
functional importance of these findings was not ascertained [323]. Our findings may explain
why the metabolic phenotype arising from loss of one or both incretin receptors is comparatively
mild [192, 267, 311] and identify new models for exploring the expanding importance of
incretin-related mechanisms that potentiate β-cell function following oral nutrient ingestion.
73
CHAPTER 3: Disruption of cardiomyocyte glucagon receptor signaling decreases flux through fatty acid oxidation and enhances
survival following ischemic injury
CHAPTER 3
Disruption of cardiomyocyte glucagon receptor signaling decreases flux through fatty acid oxidation and enhances
survival following ischemic injury
Author contributions:
J.R. Ussher provided assistance in designing experiments, HL-1 cell line and cardiac
acylcarnitine profiling experiments (Figures 2.6). Min Suk Kim provided assistance in culturing
primary cardiomyocytes and ischemia reperfusion experiments ex-vivo (Figures 3.5 and 3.8). I
would like to acknowledge Dr. Christopher Newgard and his lab for their expertise in providing
assistance with acylcarnitine profile assessment (Figures 3.2, 3.4 and 3.5).
74
3.1 Research Summary
Glucagon maintains normoglycemia during the fasting state by inducing hepatic glucose
production. Although modulation of glucagon receptor (Gcgr) signaling is being explored for the
treatment of diabetes, the cardiovascular consequences of manipulating glucagon action are
poorly understood. We show that exogenous glucagon administration impairs recovery of
ventricular pressure in ischemic mouse hearts ex vivo, and increases mortality from myocardial
infarction after left anterior descending artery ligation in a p38 mitogen activated protein kinase
(MAPK)-dependent manner. In contrast, whole body reduction of glucagon action in Gcgr+/-
mice, or cardiac-specific reduction of glucagon action in GcgrCM-/-
mice, significantly improved
survival, reduced heart weights and infarct size following myocardial infarction. Metabolic
profiling of hearts from GcgrCM-/-
mice revealed a marked reduction in long chain acylcarnitines
in both aerobic ischemic hearts and following high fat diet feeding, consistent with an essential
role for Gcgr signaling in the control of cardiac fatty acid utilization. These findings may have
implications for strategies designed to augment or inhibit Gcgr signaling for the treatment of
metabolic disorders.
75
3.2 Introduction
Glucagon is a 29 amino acid peptide hormone secreted from islet -cells that plays a
critical role in maintenance of euglycemia, predominantly by increasing hepatic glucose output.
Activation of glucagon receptor (Gcgr) signaling promotes glycogenolysis and enhanced
gluconeogenesis, and regulates pathways controlling hepatic lipid oxidation and lipid secretion
[5, 324]. More recent evidence demonstrates that Gcgr signaling also controls cell survival
pathways in hepatocytes, as genetic interruption of hepatic Gcgr signaling increases the
susceptibility to hepatic injury [325].
The Gcgr is widely expressed in extrahepatic tissues including the central and peripheral
nervous system, pancreatic islets, adipose tissue, kidney, blood vessels, and heart [5, 154]. In the
pancreas, glucagon action potentiates glucose-dependent insulin secretion, whereas activation of
Gcgr signaling in the brain regulates hepatic glucose production, control of appetite, and body
weight [60, 318, 319, 326]. Glucagon actions in adipose tissue and kidney are less well
understood, but have been linked to control of fatty acid and glucose metabolism, respectively.
The central importance of glucagon action for the pathophysiology of hyperglycemia was
suggested by observations that glucagon levels are inappropriately increased in many subjects
with type 2 diabetes (T2D) [117, 327, 328]. Furthermore, studies attenuating glucagon action
using glucagon immunoneutralizing antisera, Gcgr antagonists, antisense Gcgr oligonucleotides
and Gcgr-/- mice, demonstrate amelioration of hyperglycemia in experimental models of
diabetes [118, 121-123, 129, 130]. Collectively, these findings have fostered enthusiasm in
reduction of glucagon action as a potential treatment for T2D.
Paradoxically, complementary efforts are exploring whether partial enhancement of
glucagon action, together with agonism of the glucagon-like peptide-1 receptor (Glp1r), may be
useful for the treatment of diabetes and/or obesity. Oxyntomodulin, a naturally occurring
proglucagon-derived peptide, contains the 29 amino acid sequence of glucagon plus a
carboxyterminal extension. Oxyntomodulin exerts potent glucoregulatory and anorectic actions
in humans and rodents through activation of the GLP-1 and glucagon receptors [329]. More
recent studies have demonstrated that simultaneous activation of the glucagon and GLP-1
76
receptors using synthetic balanced co-agonists produces potent glucoregulatory activity and
greater weight loss than observed with Glp1r agonists alone [282]. Hence, there is ongoing
interest in understanding the metabolic consequences arising from partial selective activation of
Gcgr signaling.
The development of drugs that reduce or activate Gcgr signaling raises important
questions about the cardiovascular actions and safety of such actions. A substantial body of
literature supports the acute transient use of glucagon to reverse the effects of -adrenergic
agonists, or to increase heart rate, blood pressure, and cardiac output in subjects with circulatory
collapse refractory to adrenergic stimulation [143, 284]. In contrast, more sustained
administration of glucagon may increase the severity of ischemic cardiac injury [167, 286]. We
have now examined the consequences of manipulating Gcgr signaling in the ischemic mouse
heart. We demonstrate that exogenous glucagon impairs survival following ligation of the left
anterior descending (LAD) coronary artery, actions requiring p38 MAP kinase. In contrast,
partial reduction of Gcgr expression and activity in Gcgr+/-
mice produces a cardioprotective
response to ischemic injury, a phenotype recapitulated in mice with cardiac-specific inactivation
of the Gcgr (GcgrCM-/-
mice). Furthermore, expression of fatty acid oxidation genes and proteins
was reduced, and levels of total long and medium chain fatty acids were decreased in hearts from
GcgrCM-/-
mice. Our studies demonstrate that cardiac Gcgr signaling plays an essential role in fat
oxidation under normal, ischemic, and insulin resistant conditions, findings with implications for
pharmaceutical efforts to manipulate Gcgr signaling for the treatment of human disease.
77
3.3 Materials and Methods
3.3.1 Animal studies
Gcgr+/- mice were generated by heterozygous-heterozygous breeding in the C57BL/6
background and were maintained as previously described [131]. Inducible αMHCcre
(stock
005657) [330] and FLPe (stock 005703) transgenic mice in the C57BL/6 background were
purchased from Jackson Laboratory. GcgrFlox
mice in the C57BL/6 background were described
previously [49]. GcgrCM-/-
mice were generated by crossing αMHCCre
mice with Gcgr
Flox mice
and were maintained in the C57BL/6 background. In the αMHCCre
mice, Cre gene was expressed
under the αMHC promoter and inducible construct was utilized [331]. All mice were housed 5
per cage under a light/dark cycle of 12 hours in the Toronto Centre for Phenogenomics (TCP)
animal facility, with free access to food and water except where noted. All procedures were
conducted according to protocols and guidelines approved by the TCP Animal Care Committee.
For confirmation of genotypes, genomic DNA prepared from tail snips was analyzed by
polymerase chain reaction (PCR). Tamoxifen (Tam, Sigma Aldrich 20mg/kg) was injected for 5
days (2 consecutive days). Tamoxifen was dissolved in corn oil (Mazola) and was aliquoted and
stored in -20C until injected in mice. The day of injection tamoxifen solution was thawed on a
shaker at 55C for 30 min.
3.3.2 Peptide and drug injections:
30 ng/g/body weight glucagon (Sigma) or saline in 10% gelatin was administered in
C57BL/6 mice 3 injections daily with or without 2 injections daily of 1 mol/body weight
SB290386 (p38 MAPK inhibitor, Sigma) for 7 days.
3.3.3 Coronary artery ligation
Left anterior descending (LAD) artery ligation was used to induce myocardial infarction
in 12-14 week old male mice. Mice were anesthetized using 1% isoflurane, intubated, and
ventilated with room air using positive-pressure respirator (moel 680; Harvard South Natick,
MA). The pericardium was opened following retraction of the lungs to expose the heart, and left
thoracotomy was performed via the fourth intercostal space. The LAD was ligated with a 7-0
78
silk suture. In the shams group the 7-0 silk suture was passed under the coronary artery and then
removed. When the anterior wall of the left ventricle (LV) turned pale it was considered
successful induction of acute myocardial ischemia. Animals were ventilated until awake.
3.3.4 Ischemia reperfusion protocol
Global ischemia in ex-vivo hearts were performed as described previously [233]. Hearts
underwent a 30 minute perfusion phase with Kreb buffer alone, or 1ug/mL of glucagon (20
minutes) was perfused for by 30 minute ischemia, and 50 minute reperfusion during which left
ventricular developed pressure (LVDP) was recorded using Biopac instruments.
3.3.5 Blood pressure and heart rate measurements
Blood pressure and heart rates were measured using a telemetry system (DSI technology)
as described previously [235]. Blood pressure and heart rates were monitored for 1 week after
surgery for 24 hours.
3.3.6 Myocardium metabolic profiling
Mass spectrometry-based metabolic profiling was performed to determine myocardial
levels of acylcarnitines and organic acids. Triglyceride was extracted from frozen myocardial
tissue (~20 mg) with a 2:1 chloroform-methanol solution and quantified with a commercially
available enzymatic assay kit (Wako Pure Chemical Industry) as previously described [332].
3.3.7 Heart histology
Animals were anesthetized using avertin (10ul/g of body weight). 1 mol/l of KCl was
apically injected into the heart to arrest the heart in diastole. Perfusion of saline to flush out
blood from the heart was followed by perifusion of 4% buffered formalin at physiological
pressure to fix the hearts. Hearts were post fixed in formalin, embedded in paraffin, sectioned at
6 μm, and stained with Masson’s Trichrome, or were used for Tunnel staining. Cardiac images
were obtained from mid-ventricular cross-sections, and morphometry was performed with
LEICA QWin V3 software (2003). The infarcted area was calculated as a % of total LV area.
79
TUNEL staining was performed using the ApopTag peroxidase kit for apoptosis (EMD
millipore).
3.3.8 Glucose tolerance and measurement of plasma insulin
12-14 week old male mice were fasted overnight (16–18 hours), and glucose (1.5 mg/g
body weight) was administered orally (through a gavage tube) or via injection into the peritoneal
cavity (intraperitoneal glucose tolerance test). Blood samples were drawn from the tail vein at 0,
15, 30, 60, 90, and 120 minutes post glucose administration, and blood glucose levels were
measured using a Glucometer Elite blood glucose meter (Ascensia; Bayer HealthCare). For
plasma insulin determinations, blood samples (100 μl) were drawn from the tail vein during the 0
and 15 minute time periods following glucose administration in a heparinized tube. Plasma was
separated by centrifugation at 4°C and stored at –80°C until assayed. Plasma was assayed for
insulin using a mouse insulin ELISA kit (Linco).
3.3.9 Western blotting
Hearts were collected from 5 hour fasted mice 30 minutes following ischemia or without
ischemia and were washed in Krebs buffer containing 11mM glucose and frozen. Frozen hearts
were powdered using mortar and pestle and were subjected to homogenization for 30s in buffer
containing 50mM Tris HCL, pH to 8, 1mM EDTA, 10% glycerol, 0.02% Brij-35. The
homogenate was kept on ice for 10 minutes before centrifugation at 10,000 x g for 20 minutes.
Immunoblotting was performed on the resultant supernatant. The protein concentration of
homogenates was determined via BCA assay (Thermo Scientific). Samples (20 ug protein each)
were resolved via 8% sodium dodecyl sulfate polyacrylamide gel electrophoresis (SDS-PAGE)
and transferred onto a 0.45 μm nitrocellulose membrane. 10% fat free milk was used to block for
2 hours, and membranes were probed with either primary antibodies (Cell signaling) in 5% fatty
acid free of BSA. 1x phosphate buffered saline was used to wash the membrane, which was
subsequently probed with goat anti-rabbit (GE Healthcare UK limited NA934V 1/2000 dilution)
secondary antibody in 1% fat-free milk. Immunoblots were visualized with the Kodak imager
Station 4000MM PRO and quantified with Carestream Molecular Imaging software.
80
3.3.10 Heart RNA analyses
Hearts were collected from 5 hour fasted mice 30 minutes following ischemia or without
ischemia and were washed in Krebs buffer containing 11mM glucose and frozen. Frozen hearts
were powdered using mortar and pestle and were subjected to homogenization for 30s in buffer
containing Trizol (Sigma), and RNA was isolated using the Trizol method (Sigma). Following
RNA isolation, first-strand complementary DNA was synthesized from total RNA using the
SuperScript III reverse transcriptase synthesis system (Invitrogen) and random hexamers. Real-
time polymerase chain reaction was performed with the ABI Prism 7900 Sequence Detection
System using TaqMan Gene Expression Assays and TaqMan Universal PCR Master Mix
(Applied Biosystems). Levels of RNA transcripts were normalized to levels of peptidyl-propyl
isomerase A (cyclophilin) RNA.
3.3.11 PPARα Nuclear Translocation Immunoblotting in Primary Atrial Cardiomyocytes
Atrial cardiomyocytes were isolated as described previously [235]. Briefly, 3 to 4 month
old mice were anesthetized using avertin and perfused using a Langendorff system following
opening of the chest cavity. After perfusion for 2 minutes, the heart was digested with 2 mg/ml
collagenase II (Cellutron) for 15 minutes. The atrium was isolated from the ventricle and the rest
of the heart and agitated gently for 10 minutes. Tissues were resuspended and dissociated using
stopping buffer (20% FBS in minimum essential medium (MEM); Sigma Aldrich) by repeated
gentle pipetting followed by protein isolation for Western blot analysis.
3.3.12 Culture of HL-1 Atrial Cardiac Myocytes
HL-1 atrial cardiac myocytes were kindly provided by Dr. William Claycomb (Harvard
medical school), and cultured in supplemented Claycomb Media (Sigma-Aldrich) with 10%
FBS, 1% penicillin/streptomycin, 0.1 mM norepinephrine, and 2 mM L-glutamine. For
experiments, cells were seeded onto 6-well plates (BD Falcon), coated in 0.02% gelatin / 0.5%
fibronectin. Upon reaching confluence, cells were serum starved and supplemented with
Claycomb Media without FBS and norepinephrine prior to infection with AdβGal or AdGcgr at
10x multiplicity of infection. 24 hours following infection, cells were treated with either 1x PBS
or glucagon for 3 hours in supplemented Claycomb Media without FBS and norepinephrine.
81
3.3.13 PPARα Nuclear versus cytoplasmic expression
Confluent HL-1 cells were grown in supplemented Claycomb Media without FBS and
norepinephrine prior to infection with AdβGal or AdGcgr at 10x multiplicity of infection. 24
hours following infection, cells were treated with either 1x PBS or glucagon for 3 hours in
supplemented Claycomb Media without FBS and norepinephrine. Cells were then extracted in
nuclear fractionation buffer to obtain nuclear and cytoplasmic fractions. Protein concentrations
of each fraction were determined via Bradford protein assay, and 20 μg of cytoplasmic and 8 μg
of nuclear fractions were resolved on a 10% SDS gel to determine PPARα nuclear translocation.
β-actin was used as a positive control for cytoplasmic fractions, whereas lamin A/C was used as
a positive control for nuclear fractions.
3.3.14 In vitro HL-1 cellular injury model
HL-1 cells were subjected to cellular injury via treatment with H2O2 as previously
described [333]. In brief, confluent HL-1 cells were grown in supplemented Claycomb Media
without FBS and norepinephrine prior to infection with AdβGal or AdGcgr at 10x multiplicity of
infection. 24 hours following infection, cells were treated with either 1x PBS or 20 nM glucagon
concurrently with 100 μM H2O2 for 24 hours in supplemented Claycomb Media without FBS
and norepinephrine.
3.3.15 Statistical Analysis
Results are presented as mean ± SEM. Statistical significance was determined using 1-
way or 2-way analysis of variance with Bonferroni post hoc tests (as appropriate) using
GraphPad Prism 4.0 (GraphPad Software Inc). Statistical significance was noted when P< 0.05.
82
3.4 Results: Glucagon impairs outcomes after myocardial infarction in a
p38 MAPK-dependent manner.
To assess the impact of enhanced Gcgr signaling in the setting of acute cardiac ischemia,
I injected wild-type mice with glucagon 2 days prior to and 5 days after ligation of the left
anterior descending artery. Exogenous glucagon markedly reduced survival (Fig. 3.2B) without
changing levels of blood glucose or body weight (Fig. 3.1 A-C). Infarct sizes assessed at day 15
were similar in glucagon versus saline treated mice (Fig 3.2B-D). As p38 MAPK links G protein
coupled receptor signaling to cardiomyocyte cell survival pathways [334]. I assessed whether
glucagon activates p38 MAPK pathway in aerobic and ischemic hearts from wild-type mice.
Glucagon increased p38 MAPK phosphorylation in aerobic and ischemic hearts from wild-type
mice (Fig 3.2A). Next we assessed whether the increased mortality following glucagon treatment
is dependent on the p38 MAPK pathway; we treated separate groups of mice with glucagon, with
and without the p38 MAPK inhibitor SB203580, prior to and after LAD ligation and induction of
myocardial infarction. Although SB203580 alone had no effect, it completely eliminated the
glucagon-mediated impairment of survival after myocardial infarction (Fig 3.2B). Consistent
with these findings, cardiomyocyte apoptosis was increased in glucagon-treated mice, and
attenuated by co-administration of SB203580 (Fig. 3.2D). To determine whether the deleterious
effects of glucagon were mediated by the cardiomyocyte Gcgr, I generated mice with
cardiomyocyte-specific inactivation of the Gcgr gene (Fig. 3.3). Survival was reduced, and
infarct size was greater in glucagon-treated αMHCCre
control relative to outcomes in similarly-
treated GcgrCM-/-
mice (Fig 3.3). These findings indicate that glucagon reduces survival after
myocardial infarction in mice through actions requiring a cardiomyocyte Gcgr.
We next explored signaling pathways activated by glucagon in cardiac cell lines. As we
did not detect endogenous Gcgr expression in several immortalized cell lines, we transduced HL-
1 cells with an adenovirus encoding the rat Gcgr (AdGcgr). As Gcgr signaling regulates fatty
acid oxidation in the liver via PPAR-α, we assessed the PPAR-α pathway in the HL-1 cell line
[324]. Transduction of AdGcgr alone in HL-1 cells significantly increased PPAR-α expression
compared to HL-1 cells infected with βgal control virus (Adβgal) (Fig. 3.4A). Furthermore,
glucagon (20 nM for 3 hours) treatment increased PPAR-α target gene expression in AdGcgr
83
infected, but not in Adβgal control virus-infected cells (Fig. 3.5A and 3.4B), and increased the
activity of a PPAR-α luciferase reporter plasmid (Fig. 3.4B). This glucagon-dependent induction
of PPAR-α promoter activity was abrogated by pretreatment with the p38 MAPK inhibitor (10
μM SB203580) but not by the PKA inhibitor, H89 (Fig. 3.5C).
We next examined whether glucagon regulates PPAR-α translocation in cardiomyocytes.
PPAR-α nuclear translocation was enhanced by treatment with 20 nM glucagon for 3 hours in
primary cultures of atrial cardiomyocytes and in AdGcgr infected HL-1 cells, actions requiring
p38 MAPK activity (Fig. 3.5 D&E).
In HL-1 cells glucagon upregulated PPAR-α and downstream targets of PPAR-α
suggesting glucagon can upregulate fatty acid oxidation gene expression. Next we explored
whether glucagon can regulate the protein expression of key enzyme involved in glucose
oxidation; pyruvate dehydrogenase (PDH) [332]. Exogenous treatment with glucagon
upregulated P-PDH expression in aerobic and ischemic hearts from wild type mice (Fig. 3.5F).
Furthermore, a 3-hour treatment with 20 nM glucagon increased PDH phosphorylation in
AdGcgr-transduced HL-1 cells but not in cells infected with AdβGal (Fig 3.5G).
To identify whether glucagon directly regulated cardiomyocyte survival, we induced
apoptosis in HL-1 cardiomyocytes with H2O2. Glucagon increased caspase-3 cleavage in HL-1
cells, actions attenuated by treatment with 1.5mM DCA, an inhibitor of the PPAR-α downstream
target gene, pyruvate dehydrogenase kinase 4 (PDK4), which phosphorylated and inhibited the
activity of PDH (Fig. 3.5H).
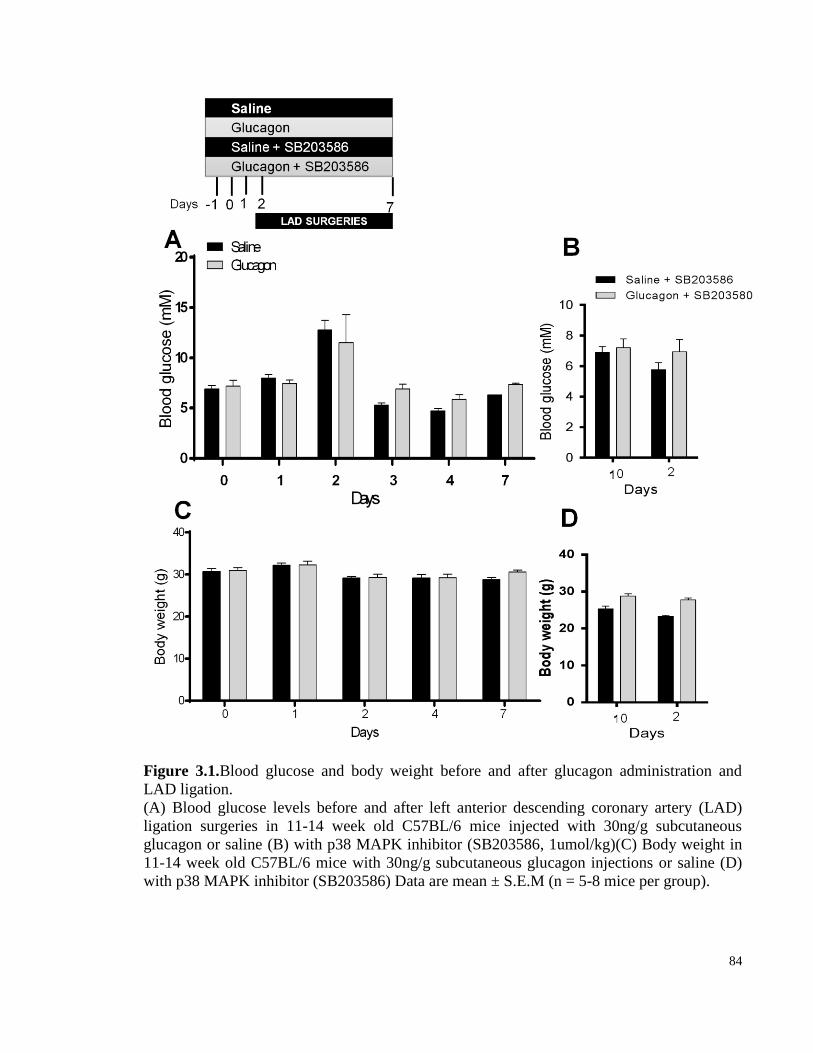
84
Figure 3.1.Blood glucose and body weight before and after glucagon administration and
LAD ligation.
(A) Blood glucose levels before and after left anterior descending coronary artery (LAD)
ligation surgeries in 11-14 week old C57BL/6 mice injected with 30ng/g subcutaneous
glucagon or saline (B) with p38 MAPK inhibitor (SB203586, 1umol/kg)(C) Body weight in
11-14 week old C57BL/6 mice with 30ng/g subcutaneous glucagon injections or saline (D)
with p38 MAPK inhibitor (SB203586) Data are mean ± S.E.M (n = 5-8 mice per group).
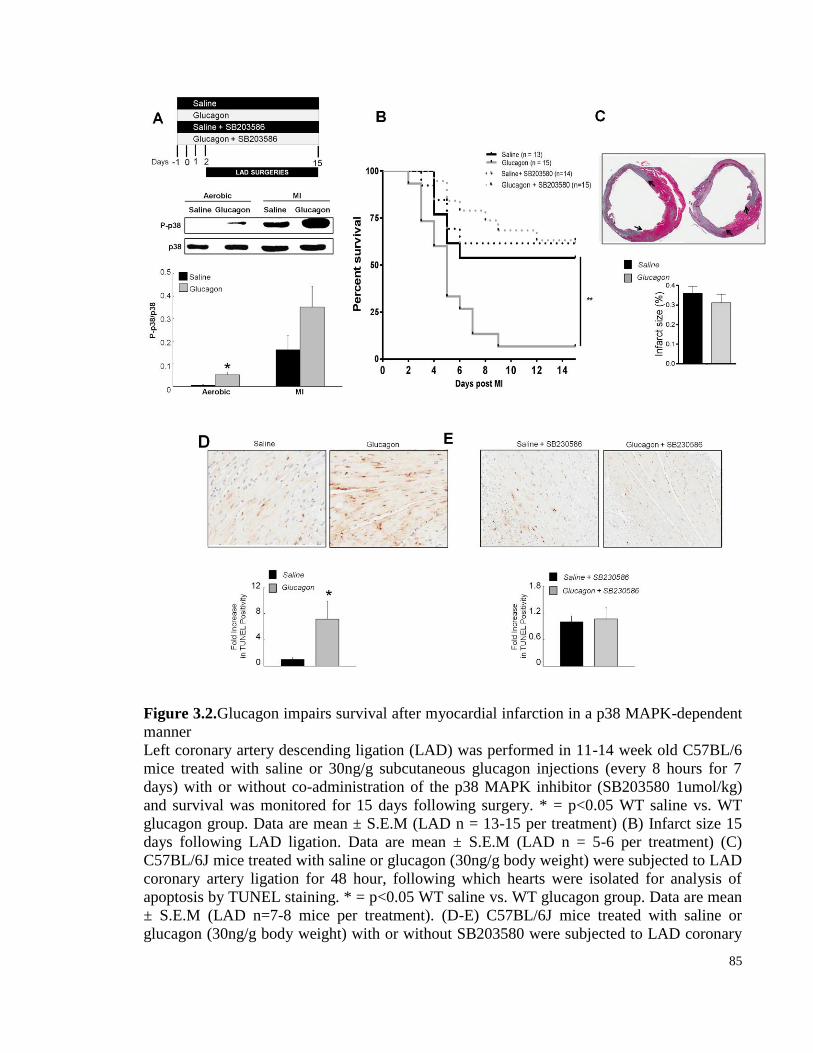
85
Figure 3.2.Glucagon impairs survival after myocardial infarction in a p38 MAPK-dependent
manner
Left coronary artery descending ligation (LAD) was performed in 11-14 week old C57BL/6
mice treated with saline or 30ng/g subcutaneous glucagon injections (every 8 hours for 7
days) with or without co-administration of the p38 MAPK inhibitor (SB203580 1umol/kg)
and survival was monitored for 15 days following surgery. * = p<0.05 WT saline vs. WT
glucagon group. Data are mean ± S.E.M (LAD n = 13-15 per treatment) (B) Infarct size 15
days following LAD ligation. Data are mean ± S.E.M (LAD n = 5-6 per treatment) (C)
C57BL/6J mice treated with saline or glucagon (30ng/g body weight) were subjected to LAD
coronary artery ligation for 48 hour, following which hearts were isolated for analysis of
apoptosis by TUNEL staining. * = p<0.05 WT saline vs. WT glucagon group. Data are mean
± S.E.M (LAD n=7-8 mice per treatment). (D-E) C57BL/6J mice treated with saline or
glucagon (30ng/g body weight) with or without SB203580 were subjected to LAD coronary
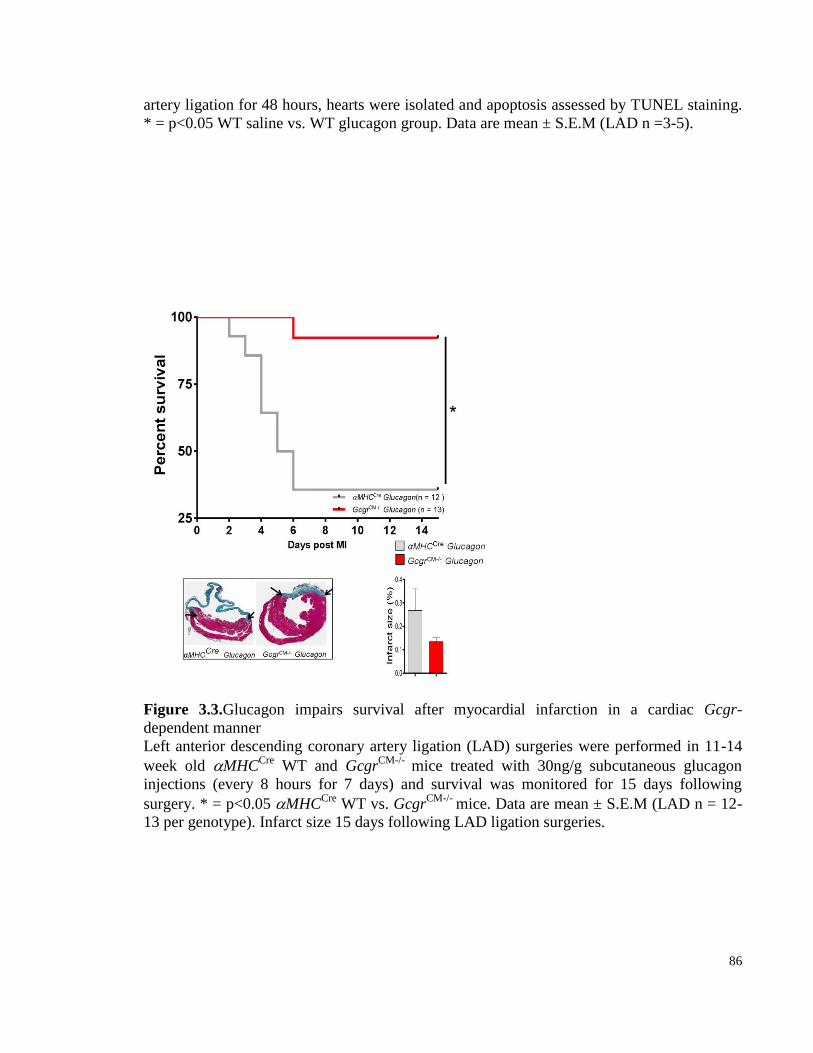
86
artery ligation for 48 hours, hearts were isolated and apoptosis assessed by TUNEL staining.
* = p<0.05 WT saline vs. WT glucagon group. Data are mean ± S.E.M (LAD n =3-5).
Figure 3.3.Glucagon impairs survival after myocardial infarction in a cardiac Gcgr-
dependent manner
Left anterior descending coronary artery ligation (LAD) surgeries were performed in 11-14
week old MHCCre
WT and GcgrCM-/-
mice treated with 30ng/g subcutaneous glucagon
injections (every 8 hours for 7 days) and survival was monitored for 15 days following
surgery. * = p<0.05 MHCCre
WT vs. GcgrCM-/-
mice. Data are mean ± S.E.M (LAD n = 12-
13 per genotype). Infarct size 15 days following LAD ligation surgeries.
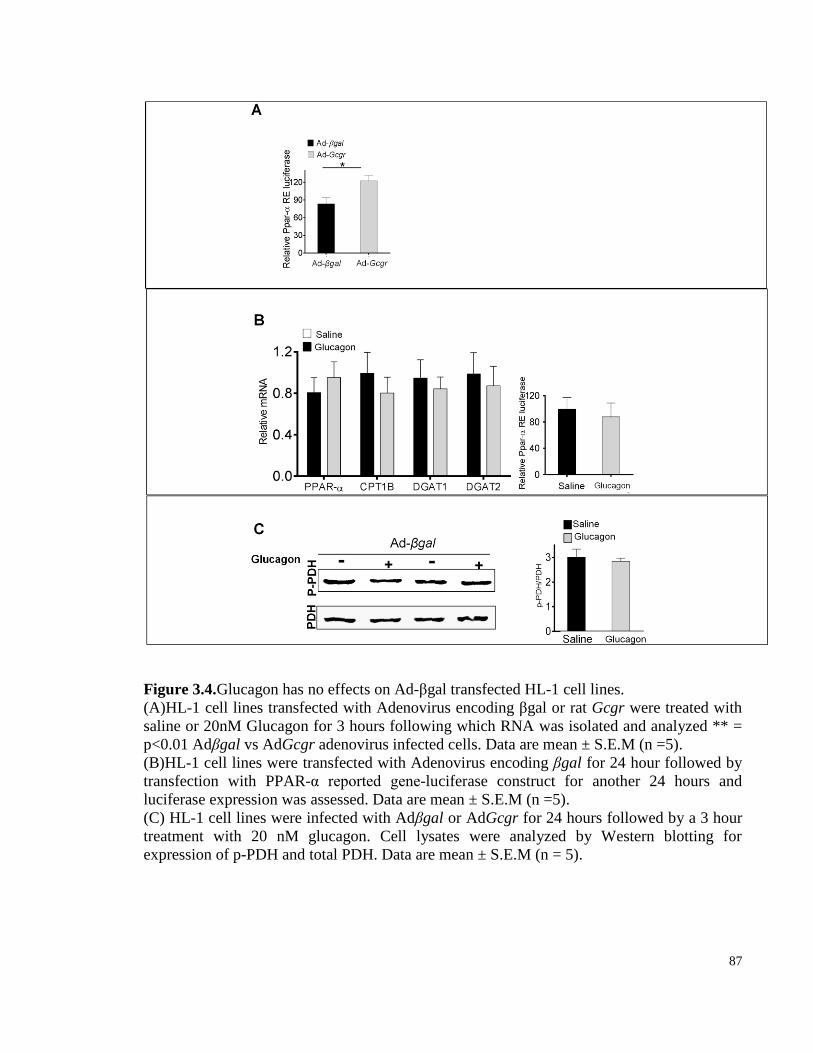
87
Figure 3.4.Glucagon has no effects on Ad-βgal transfected HL-1 cell lines.
(A)HL-1 cell lines transfected with Adenovirus encoding βgal or rat Gcgr were treated with
saline or 20nM Glucagon for 3 hours following which RNA was isolated and analyzed ** =
p<0.01 Adβgal vs AdGcgr adenovirus infected cells. Data are mean ± S.E.M (n =5).
(B)HL-1 cell lines were transfected with Adenovirus encoding βgal for 24 hour followed by
transfection with PPAR-α reported gene-luciferase construct for another 24 hours and
luciferase expression was assessed. Data are mean ± S.E.M (n =5).
(C) HL-1 cell lines were infected with Adβgal or AdGcgr for 24 hours followed by a 3 hour
treatment with 20 nM glucagon. Cell lysates were analyzed by Western blotting for
expression of p-PDH and total PDH. Data are mean ± S.E.M (n = 5).
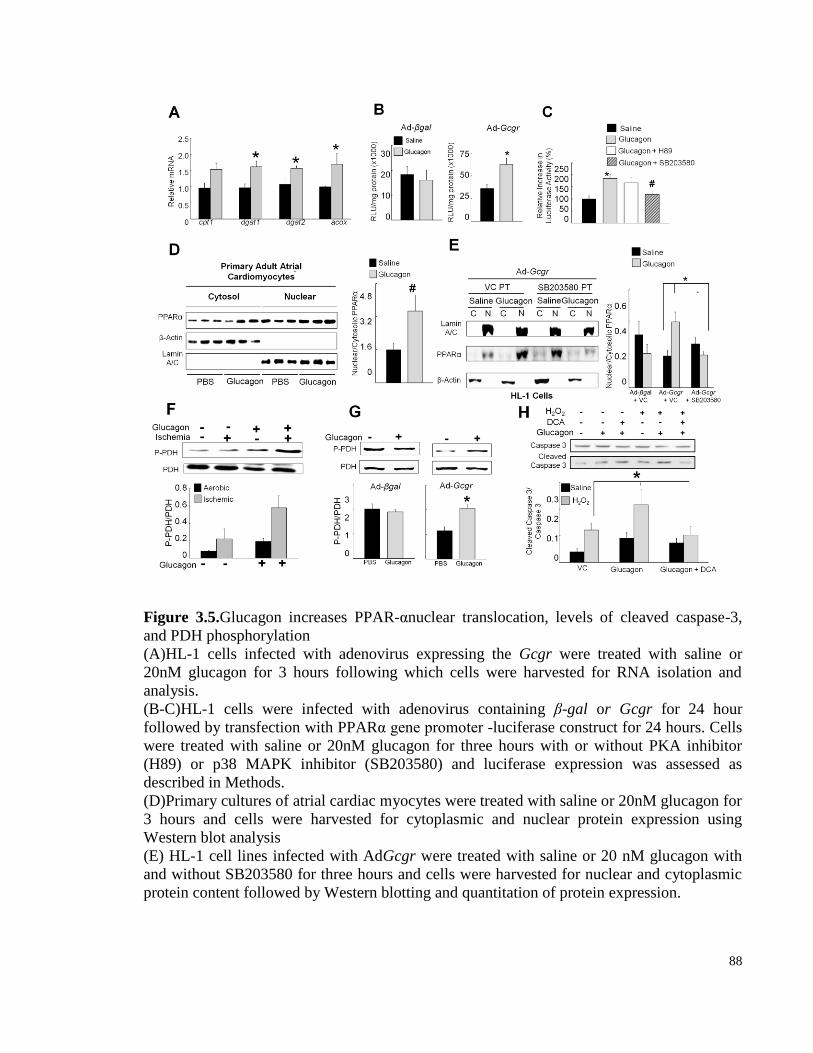
88
Figure 3.5.Glucagon increases PPAR-αnuclear translocation, levels of cleaved caspase-3,
and PDH phosphorylation
(A)HL-1 cells infected with adenovirus expressing the Gcgr were treated with saline or
20nM glucagon for 3 hours following which cells were harvested for RNA isolation and
analysis.
(B-C)HL-1 cells were infected with adenovirus containing β-gal or Gcgr for 24 hour
followed by transfection with PPARα gene promoter -luciferase construct for 24 hours. Cells
were treated with saline or 20nM glucagon for three hours with or without PKA inhibitor
(H89) or p38 MAPK inhibitor (SB203580) and luciferase expression was assessed as
described in Methods.
(D)Primary cultures of atrial cardiac myocytes were treated with saline or 20nM glucagon for
3 hours and cells were harvested for cytoplasmic and nuclear protein expression using
Western blot analysis
(E) HL-1 cell lines infected with AdGcgr were treated with saline or 20 nM glucagon with
and without SB203580 for three hours and cells were harvested for nuclear and cytoplasmic
protein content followed by Western blotting and quantitation of protein expression.
89
(F) 11-13 week old mice were treated with exogenous glucagon every 8-hour for 24 hours.
Mice were fasted for 5 hours and hearts were collected 30 min following LAD ligation
surgeries for protein analysis as described in methods (n = 6 per treatment).
(G) HL-1 cell lines were infected with Adenovirus encoding β-gal or Gcgr for 24 hours
followed by 3 hour treatment with glucagon followed by protein isolation and western
blotting for expression of p-PDH and total PDH.
(H) HL-1 cell lines were infected with AdGcgr for 24 hours followed by 24 hour treatment
with 100 µM H2O2 and 3 hours of exposure to 20nM glucagon. Western blot analysis of
cleaved caspase-3 from cells treated with or without 1.5 mM DCA, an inhibitor of the PPAR-
α target gene, PDK4.
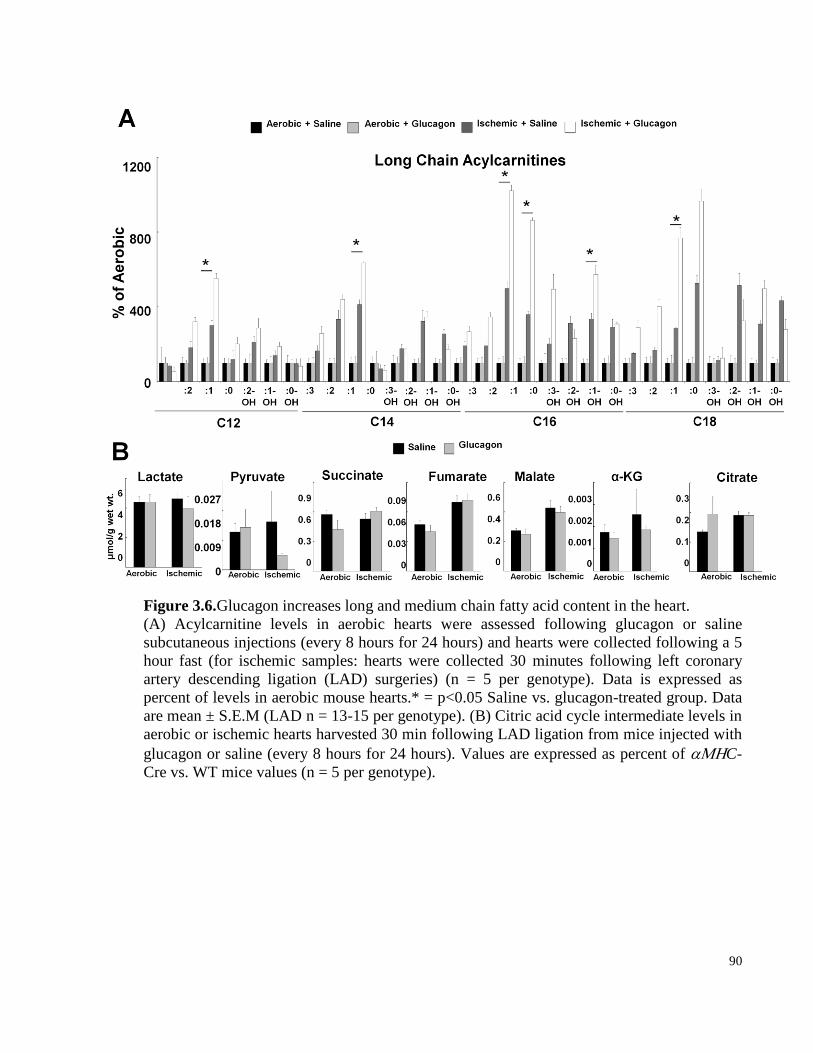
90
Figure 3.6.Glucagon increases long and medium chain fatty acid content in the heart.
(A) Acylcarnitine levels in aerobic hearts were assessed following glucagon or saline
subcutaneous injections (every 8 hours for 24 hours) and hearts were collected following a 5
hour fast (for ischemic samples: hearts were collected 30 minutes following left coronary
artery descending ligation (LAD) surgeries) (n = 5 per genotype). Data is expressed as
percent of levels in aerobic mouse hearts.* = p<0.05 Saline vs. glucagon-treated group. Data
are mean ± S.E.M (LAD n = 13-15 per genotype). (B) Citric acid cycle intermediate levels in
aerobic or ischemic hearts harvested 30 min following LAD ligation from mice injected with
glucagon or saline (every 8 hours for 24 hours). Values are expressed as percent of C-
Cre vs. WT mice values (n = 5 per genotype).
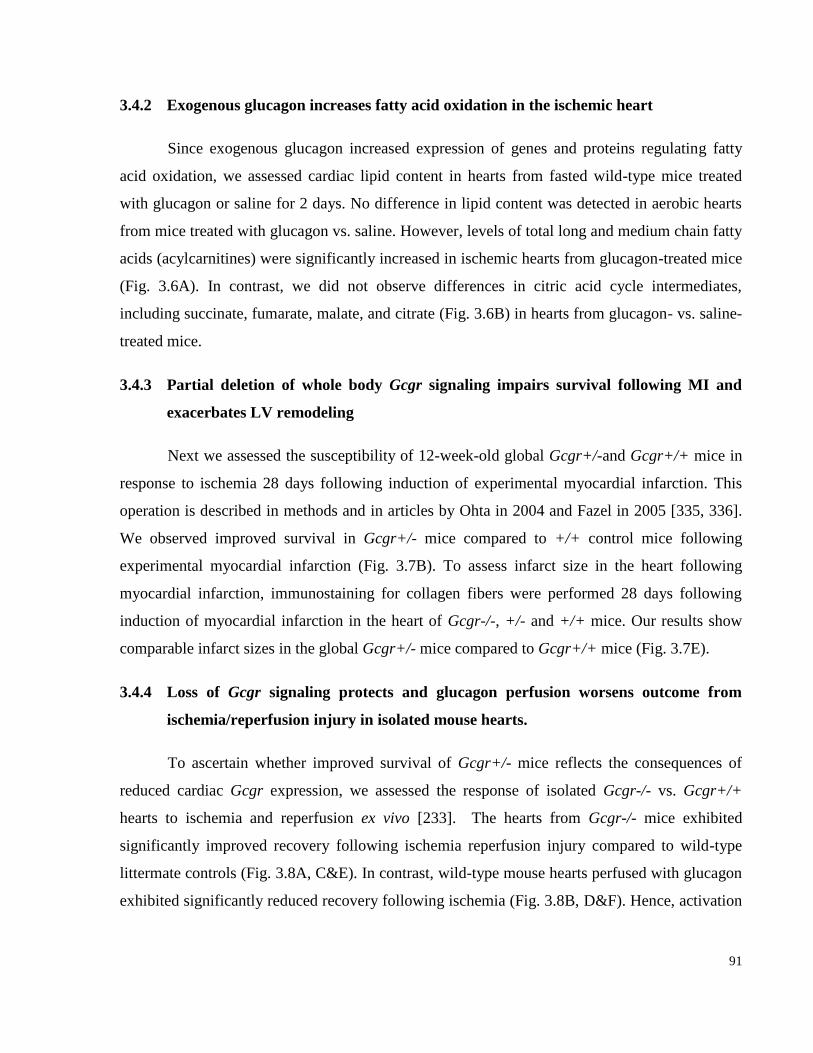
91
3.4.2 Exogenous glucagon increases fatty acid oxidation in the ischemic heart
Since exogenous glucagon increased expression of genes and proteins regulating fatty
acid oxidation, we assessed cardiac lipid content in hearts from fasted wild-type mice treated
with glucagon or saline for 2 days. No difference in lipid content was detected in aerobic hearts
from mice treated with glucagon vs. saline. However, levels of total long and medium chain fatty
acids (acylcarnitines) were significantly increased in ischemic hearts from glucagon-treated mice
(Fig. 3.6A). In contrast, we did not observe differences in citric acid cycle intermediates,
including succinate, fumarate, malate, and citrate (Fig. 3.6B) in hearts from glucagon- vs. saline-
treated mice.
3.4.3 Partial deletion of whole body Gcgr signaling impairs survival following MI and
exacerbates LV remodeling
Next we assessed the susceptibility of 12-week-old global Gcgr+/-and Gcgr+/+ mice in
response to ischemia 28 days following induction of experimental myocardial infarction. This
operation is described in methods and in articles by Ohta in 2004 and Fazel in 2005 [335, 336].
We observed improved survival in Gcgr+/- mice compared to +/+ control mice following
experimental myocardial infarction (Fig. 3.7B). To assess infarct size in the heart following
myocardial infarction, immunostaining for collagen fibers were performed 28 days following
induction of myocardial infarction in the heart of Gcgr-/-, +/- and +/+ mice. Our results show
comparable infarct sizes in the global Gcgr+/- mice compared to Gcgr+/+ mice (Fig. 3.7E).
3.4.4 Loss of Gcgr signaling protects and glucagon perfusion worsens outcome from
ischemia/reperfusion injury in isolated mouse hearts.
To ascertain whether improved survival of Gcgr+/- mice reflects the consequences of
reduced cardiac Gcgr expression, we assessed the response of isolated Gcgr-/- vs. Gcgr+/+
hearts to ischemia and reperfusion ex vivo [233]. The hearts from Gcgr-/- mice exhibited
significantly improved recovery following ischemia reperfusion injury compared to wild-type
littermate controls (Fig. 3.8A, C&E). In contrast, wild-type mouse hearts perfused with glucagon
exhibited significantly reduced recovery following ischemia (Fig. 3.8B, D&F). Hence, activation
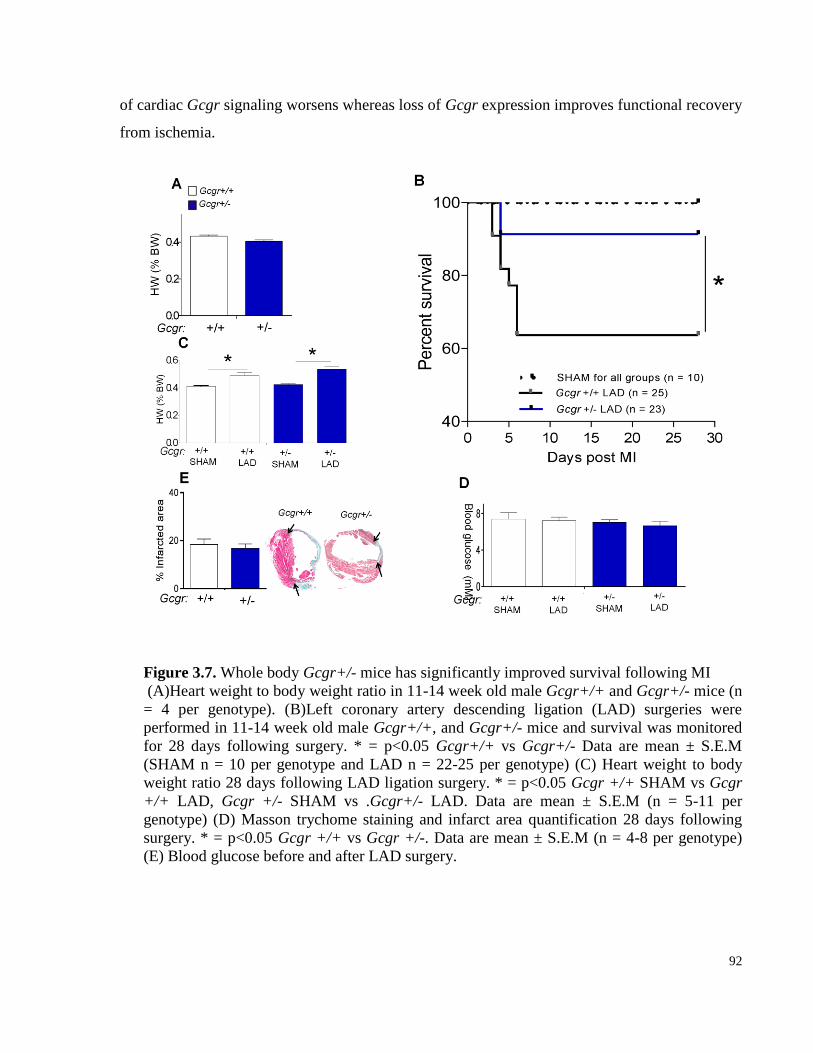
92
of cardiac Gcgr signaling worsens whereas loss of Gcgr expression improves functional recovery
from ischemia.
Figure 3.7. Whole body Gcgr+/- mice has significantly improved survival following MI
(A)Heart weight to body weight ratio in 11-14 week old male Gcgr+/+ and Gcgr+/- mice (n
= 4 per genotype). (B)Left coronary artery descending ligation (LAD) surgeries were
performed in 11-14 week old male Gcgr+/+, and Gcgr+/- mice and survival was monitored
for 28 days following surgery. * = p<0.05 Gcgr+/+ vs Gcgr+/- Data are mean ± S.E.M
(SHAM n = 10 per genotype and LAD n = 22-25 per genotype) (C) Heart weight to body
weight ratio 28 days following LAD ligation surgery. * = p<0.05 Gcgr +/+ SHAM vs Gcgr
+/+ LAD, Gcgr +/- SHAM vs .Gcgr+/- LAD. Data are mean ± S.E.M (n = 5-11 per
genotype) (D) Masson trychome staining and infarct area quantification 28 days following
surgery. * = p<0.05 Gcgr +/+ vs Gcgr +/-. Data are mean ± S.E.M (n = 4-8 per genotype)
(E) Blood glucose before and after LAD surgery.
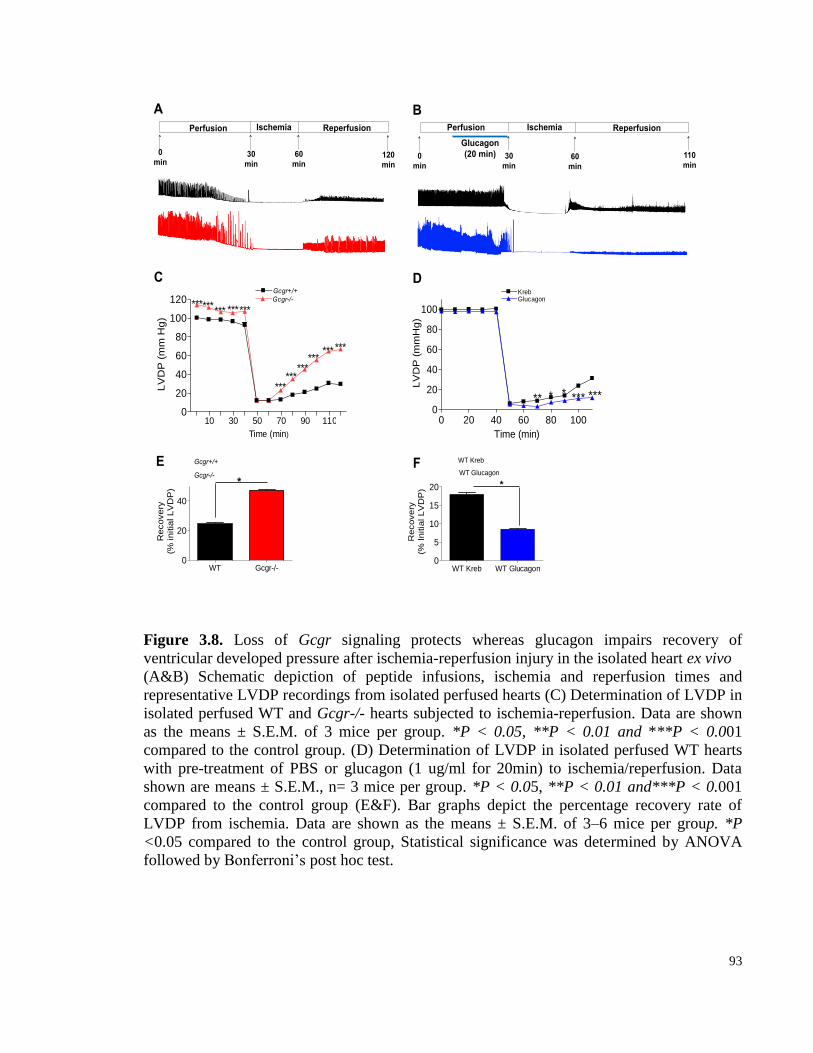
93
Figure 3.8. Loss of Gcgr signaling protects whereas glucagon impairs recovery of
ventricular developed pressure after ischemia-reperfusion injury in the isolated heart ex vivo
(A&B) Schematic depiction of peptide infusions, ischemia and reperfusion times and
representative LVDP recordings from isolated perfused hearts (C) Determination of LVDP in
isolated perfused WT and Gcgr-/- hearts subjected to ischemia-reperfusion. Data are shown
as the means ± S.E.M. of 3 mice per group. *P < 0.05, **P < 0.01 and ***P < 0.001
compared to the control group. (D) Determination of LVDP in isolated perfused WT hearts
with pre-treatment of PBS or glucagon (1 ug/ml for 20min) to ischemia/reperfusion. Data
shown are means ± S.E.M., n= 3 mice per group. *P < 0.05, **P < 0.01 and***P < 0.001
compared to the control group (E&F). Bar graphs depict the percentage recovery rate of
LVDP from ischemia. Data are shown as the means ± S.E.M. of 3–6 mice per group. *P
<0.05 compared to the control group, Statistical significance was determined by ANOVA
followed by Bonferroni’s post hoc test.
WT Kreb WT Glucagon0
5
10
15
20 *
Re
co
ve
ry(%
In
itia
l L
VD
P)
Ischemia
WT Gcgr-/-0
20
40
*
Recovery
(% in
itia
l L
VD
P)
0
min
30
min 60
min
Reperfusion
120
min
Ischemia
0
min 30
min 60
min
Reperfusion
110
min
E F
A B
Gcgr+/+
Gcgr-/-
WT Kreb
WT Glucagon
10 30 50 70 90 1100
20
40
60
80
100
120 Gcgr-/-
Gcgr+/+
******
******
*** ***
***************
Time (min)
LV
DP
(m
m H
g)
Perfusion Perfusion
Glucagon
(20 min)
C D
0 20 40 60 80 1000
20
40
60
80
100
KrebGlucagon
** * * *** ***
Time (min)
LV
DP
(m
mH
g)
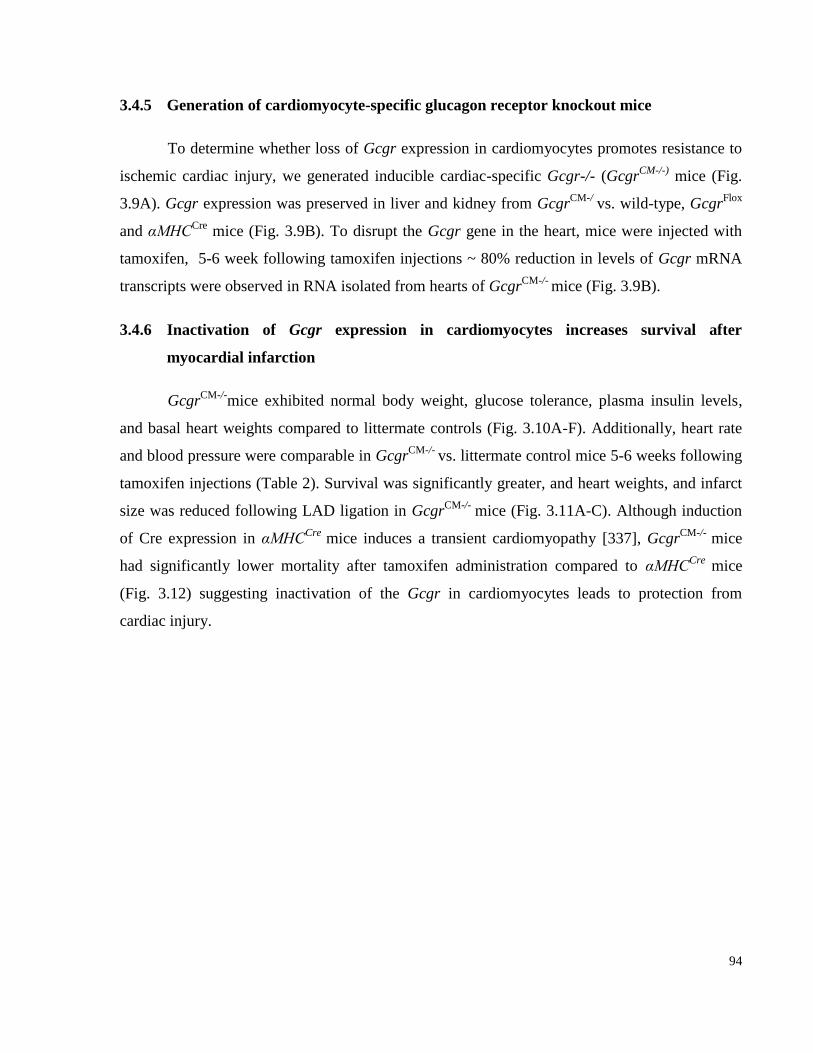
94
3.4.5 Generation of cardiomyocyte-specific glucagon receptor knockout mice
To determine whether loss of Gcgr expression in cardiomyocytes promotes resistance to
ischemic cardiac injury, we generated inducible cardiac-specific Gcgr-/- (GcgrCM-/-)
mice (Fig.
3.9A). Gcgr expression was preserved in liver and kidney from GcgrCM-/
vs. wild-type, GcgrFlox
and αMHCCre
mice (Fig. 3.9B). To disrupt the Gcgr gene in the heart, mice were injected with
tamoxifen, 5-6 week following tamoxifen injections ~ 80% reduction in levels of Gcgr mRNA
transcripts were observed in RNA isolated from hearts of GcgrCM-/-
mice (Fig. 3.9B).
3.4.6 Inactivation of Gcgr expression in cardiomyocytes increases survival after
myocardial infarction
GcgrCM-/-
mice exhibited normal body weight, glucose tolerance, plasma insulin levels,
and basal heart weights compared to littermate controls (Fig. 3.10A-F). Additionally, heart rate
and blood pressure were comparable in GcgrCM-/-
vs. littermate control mice 5-6 weeks following
tamoxifen injections (Table 2). Survival was significantly greater, and heart weights, and infarct
size was reduced following LAD ligation in GcgrCM-/-
mice (Fig. 3.11A-C). Although induction
of Cre expression in αMHCCre
mice induces a transient cardiomyopathy [337], GcgrCM-/-
mice
had significantly lower mortality after tamoxifen administration compared to αMHCCre
mice
(Fig. 3.12) suggesting inactivation of the Gcgr in cardiomyocytes leads to protection from
cardiac injury.
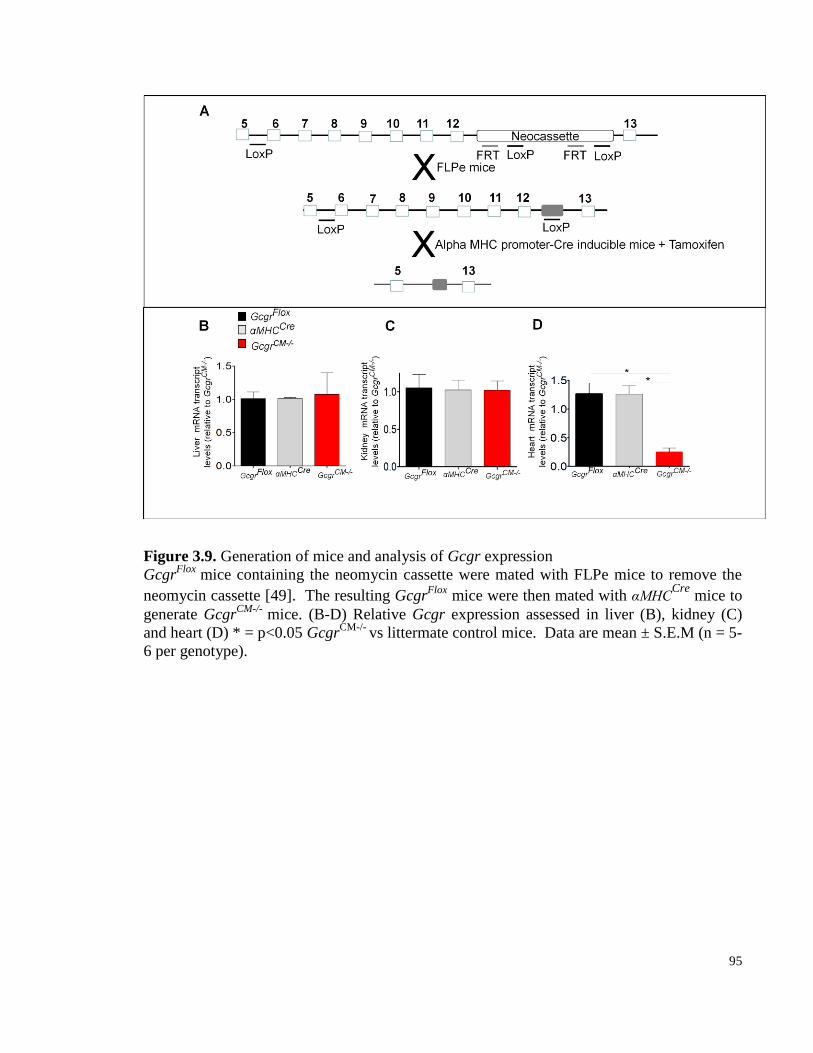
95
Figure 3.9. Generation of mice and analysis of Gcgr expression
GcgrFlox
mice containing the neomycin cassette were mated with FLPe mice to remove the
neomycin cassette [49]. The resulting GcgrFlox
mice were then mated with αMHCCre
mice to
generate GcgrCM-/-
mice. (B-D) Relative Gcgr expression assessed in liver (B), kidney (C)
and heart (D) * = p<0.05 GcgrCM-/-
vs littermate control mice. Data are mean ± S.E.M (n = 5-
6 per genotype).
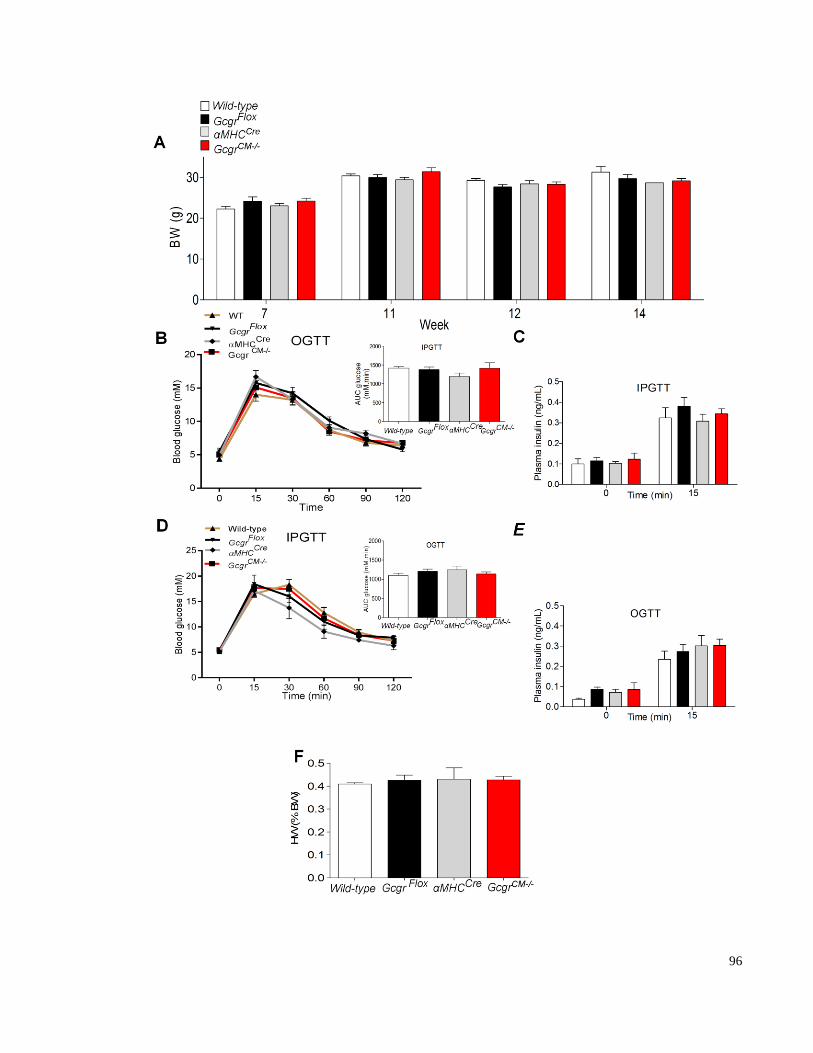
96
97
Figure 3.10. Body weight, glucose tolerance and heart weight in mice with cardiac -specific
inactivation of the Gcgr
(A) Body weight was monitored from 7-14 week before and after tamoxifen injections
GcgrCM-/-
and littermate control mice. (B) Blood glucose levels during an intraperitoneal
glucose tolerance test in 10 to 14 week-old mice (n = 11–22 mice per group). (C) Plasma
insulin levels 0 and 15 minutes following intraperitoneal glucose challenge (n = 4–9 mice per
group). (D) Blood glucose levels during an oral glucose tolerance test in 10- to 14-week-old
mice (n = 11–22 mice per group). (E) Plasma insulin levels 0 and 15 minutes following oral
glucose challenge (n = 4–9 mice per group). (F) Heart weight to body weight ratios in 12-14
week old GcgrCM-/-
and littermate control mice. Values are expressed as mean ± SEM.
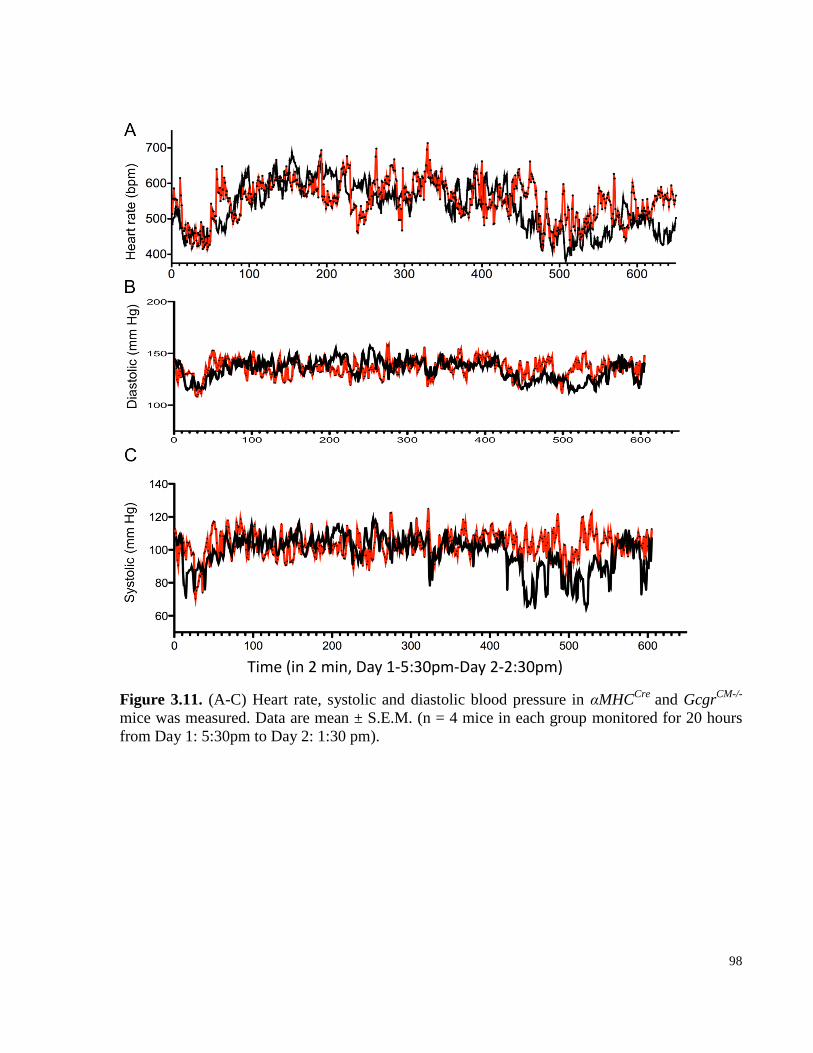
98
Figure 3.11. (A-C) Heart rate, systolic and diastolic blood pressure in αMHCCre
and GcgrCM-/-
mice was measured. Data are mean ± S.E.M. (n = 4 mice in each group monitored for 20 hours
from Day 1: 5:30pm to Day 2: 1:30 pm).
Time (in 2 min, Day 1-5:30pm-Day 2-2:30pm)
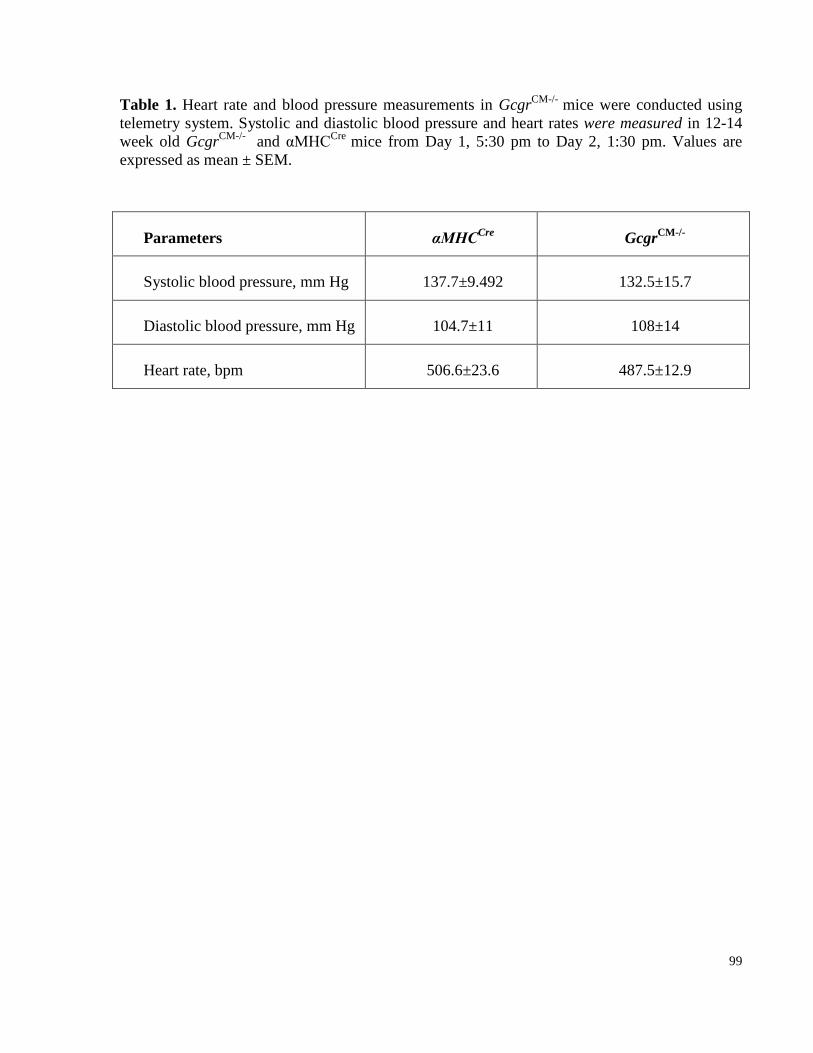
99
Table 1. Heart rate and blood pressure measurements in GcgrCM-/-
mice were conducted using
telemetry system. Systolic and diastolic blood pressure and heart rates were measured in 12-14
week old GcgrCM-/-
and αMHCCre
mice from Day 1, 5:30 pm to Day 2, 1:30 pm. Values are
expressed as mean ± SEM.
Parameters αMHCCre
GcgrCM-/-
Systolic blood pressure, mm Hg 137.7±9.492 132.5±15.7
Diastolic blood pressure, mm Hg 104.7±11 108±14
Heart rate, bpm 506.6±23.6 487.5±12.9
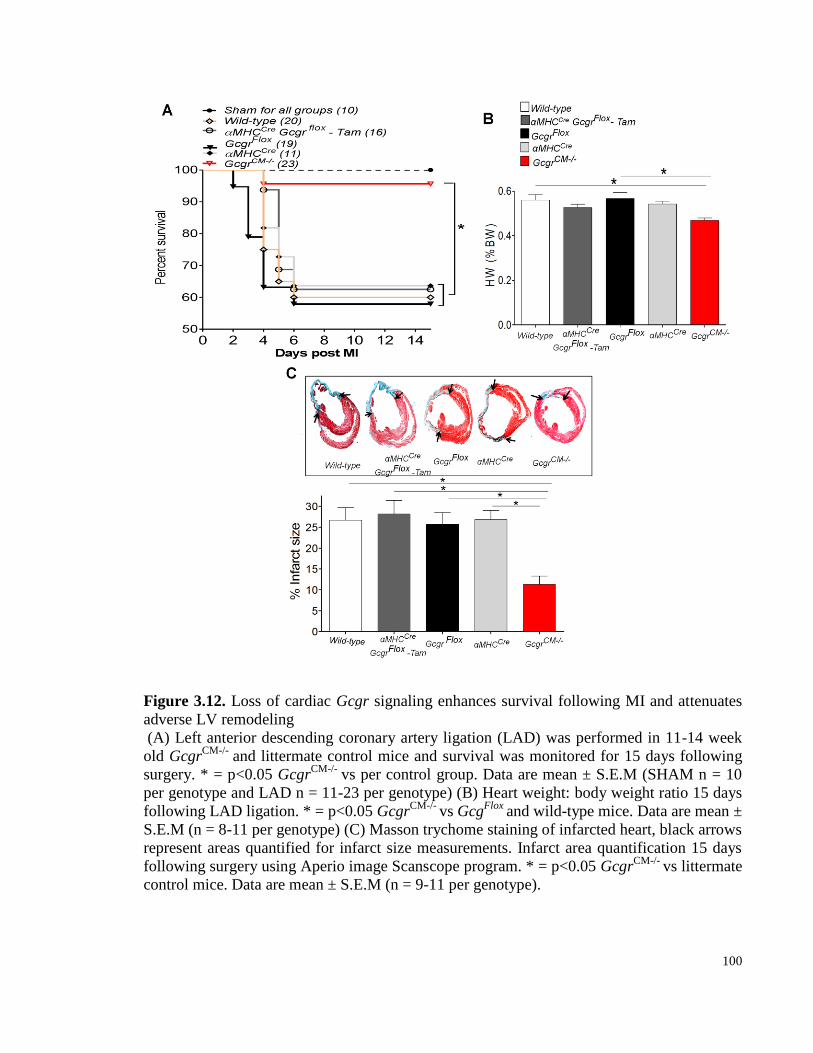
100
Figure 3.12. Loss of cardiac Gcgr signaling enhances survival following MI and attenuates
adverse LV remodeling
(A) Left anterior descending coronary artery ligation (LAD) was performed in 11-14 week
old GcgrCM-/-
and littermate control mice and survival was monitored for 15 days following
surgery. * = p<0.05 GcgrCM-/-
vs per control group. Data are mean ± S.E.M (SHAM n = 10
per genotype and LAD n = 11-23 per genotype) (B) Heart weight: body weight ratio 15 days
following LAD ligation. * = p<0.05 GcgrCM-/-
vs GcgFlox
and wild-type mice. Data are mean ±
S.E.M (n = 8-11 per genotype) (C) Masson trychome staining of infarcted heart, black arrows
represent areas quantified for infarct size measurements. Infarct area quantification 15 days
following surgery using Aperio image Scanscope program. * = p<0.05 GcgrCM-/-
vs littermate
control mice. Data are mean ± S.E.M (n = 9-11 per genotype).
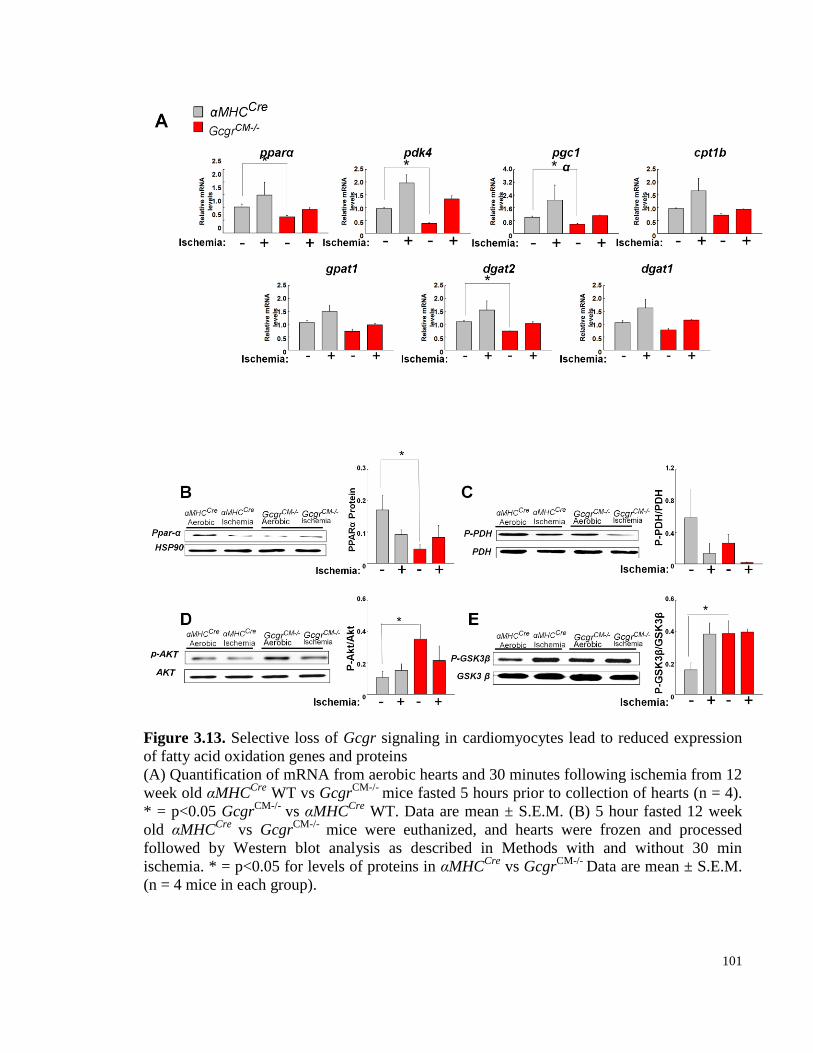
101
Figure 3.13. Selective loss of Gcgr signaling in cardiomyocytes lead to reduced expression
of fatty acid oxidation genes and proteins
(A) Quantification of mRNA from aerobic hearts and 30 minutes following ischemia from 12
week old αMHCCre
WT vs GcgrCM-/-
mice fasted 5 hours prior to collection of hearts (n = 4).
* = p<0.05 GcgrCM-/-
vs αMHCCre
WT. Data are mean ± S.E.M. (B) 5 hour fasted 12 week
old αMHCCre
vs GcgrCM-/-
mice were euthanized, and hearts were frozen and processed
followed by Western blot analysis as described in Methods with and without 30 min
ischemia. * = p<0.05 for levels of proteins in αMHCCre
vs GcgrCM-/-
Data are mean ± S.E.M.
(n = 4 mice in each group).
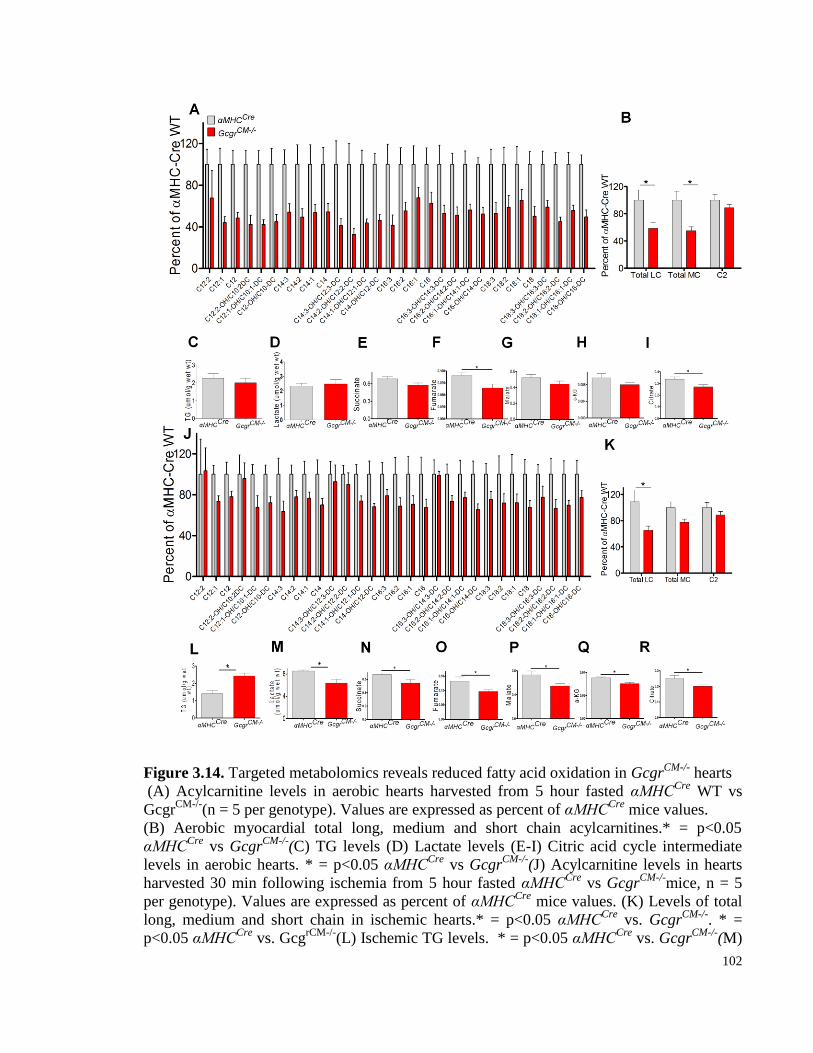
102
Figure 3.14. Targeted metabolomics reveals reduced fatty acid oxidation in GcgrCM-/-
hearts
(A) Acylcarnitine levels in aerobic hearts harvested from 5 hour fasted αMHCCre
WT vs
GcgrCM-/-
(n = 5 per genotype). Values are expressed as percent of αMHCCre
mice values.
(B) Aerobic myocardial total long, medium and short chain acylcarnitines.* = p<0.05
αMHCCre
vs GcgrCM-/-
(C) TG levels (D) Lactate levels (E-I) Citric acid cycle intermediate
levels in aerobic hearts. * = p<0.05 αMHCCre
vs GcgrCM-/-
(J) Acylcarnitine levels in hearts
harvested 30 min following ischemia from 5 hour fasted αMHCCre
vs GcgrCM-/-
mice, n = 5
per genotype). Values are expressed as percent of αMHCCre
mice values. (K) Levels of total
long, medium and short chain in ischemic hearts.* = p<0.05 αMHCCre
vs. GcgrCM-/-
. * =
p<0.05 αMHCCre
vs. GcgrCM-/-
(L) Ischemic TG levels. * = p<0.05 αMHCCre
vs. GcgrCM-/-
(M)
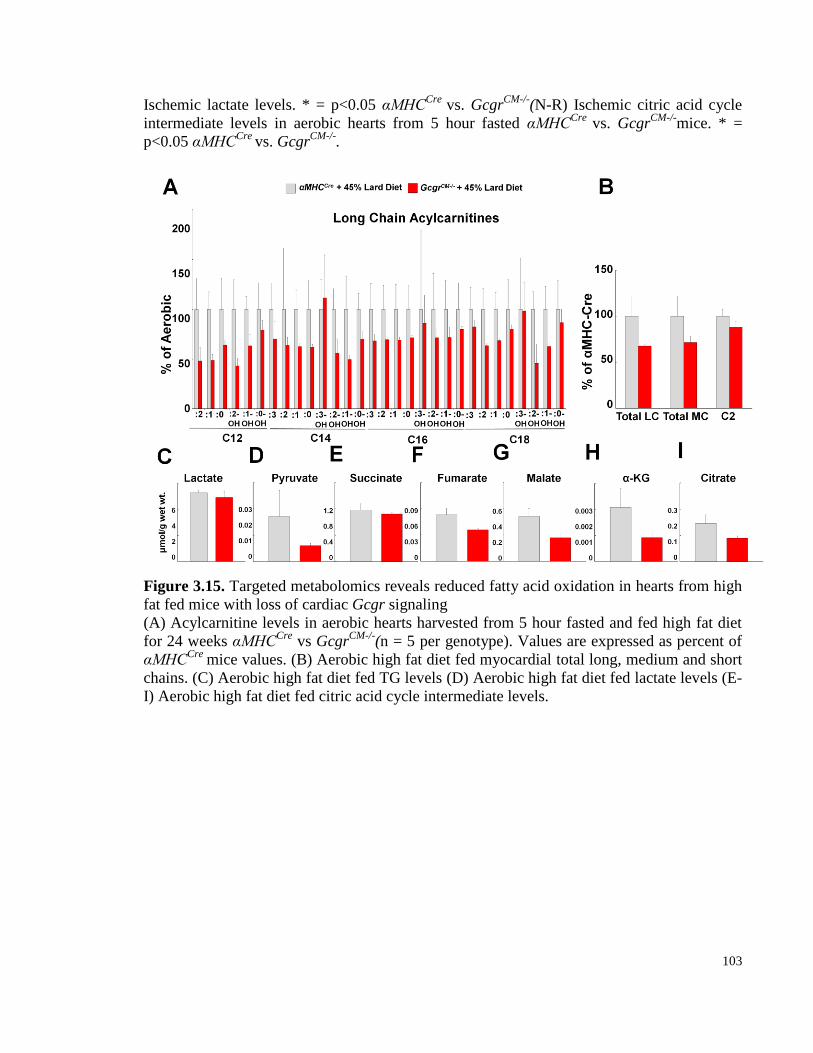
103
Ischemic lactate levels. * = p<0.05 αMHCCre
vs. GcgrCM-/-
(N-R) Ischemic citric acid cycle
intermediate levels in aerobic hearts from 5 hour fasted αMHCCre
vs. GcgrCM-/-
mice. * =
p<0.05 αMHCCre
vs. GcgrCM-/-
.
Figure 3.15. Targeted metabolomics reveals reduced fatty acid oxidation in hearts from high
fat fed mice with loss of cardiac Gcgr signaling
(A) Acylcarnitine levels in aerobic hearts harvested from 5 hour fasted and fed high fat diet
for 24 weeks αMHCCre
vs GcgrCM-/-
(n = 5 per genotype). Values are expressed as percent of
αMHCCre
mice values. (B) Aerobic high fat diet fed myocardial total long, medium and short
chains. (C) Aerobic high fat diet fed TG levels (D) Aerobic high fat diet fed lactate levels (E-
I) Aerobic high fat diet fed citric acid cycle intermediate levels.

104
Figure 3.16.Schematic of proposed model
(A) Exogenous glucagon promotes PPAR- translocation to the nucleus in a p38 MAPK-
dependent manner leading to upregulation of PPAR-α target genes including cpt1b and genes
involved in β oxidation. Subsequently fatty acid oxidation is increased and increased
mortality is increased following myocardial infarction. (B) Cardiac-specific or partial
reduction of Gcgr expression in cardiomyocytes leads to reduced expression of PPAR- and
genes involved in β oxidation leading to reduced fatty acid uptake into cardiomyocytes and
reduced uptake into mitochondria. Hence, flux through fatty acid metabolism is reduced,
leading to increased glucose oxidation and protection from cardiac ischemic injury.
105
3.4.7 Deletion of the cardiomyocyte Gcgr leads to reduced expression of genes and
proteins regulating fatty acid oxidation
As hepatic Gcgr signaling controls fatty acid oxidation in the liver via PPARα, we
analyzed this pathway in GcgrCM-/-
mice [324]. The expression of PPARα and its target genes
was lower in aerobic and ischemic hearts from GcgrCM-/-
mice (Fig. 3.13). We also detected
lower levels of PPARα and PDK4, an inhibitor of PDH, in ischemic GcgrCM-/-
mice hearts (Fig.
3.13B-C). Furthermore, levels of cardioprotective proteins such as P-AKT and P-GSK3β were
increased in aerobic GcgrCM-/-
hearts (Fig. 3.13D-E). Hence, the presence or absence of cardiac
Gcgr signaling alters the expression of genes and proteins important for fatty acid and glucose
oxidation.
3.4.8 Targeted metabolomics illustrates reduced fatty acid oxidation in normal and
insulin-resistant hearts with selective loss of Gcgr signaling
Since lower expression of fatty acid oxidation genes and proteins was detected in
GcgrCM-/-
hearts, we assessed cardiac lipid content. Significantly lower levels of total long and
medium chain fatty acids (acylcarnitines) were present in aerobic hearts from GcgrCM-/-
mice
(Fig. 3.14 A&B). Although triglyceride content was similar, citric acid cycle intermediates
including succinate, fumarate, malate, and citrate trended lower in GcgrCM-/-
hearts (Fig.3.14 C-
I). Similarly, levels of long chain fatty acids were significantly lower and medium chain fatty
acids were reduced after induction of ischemia in GcgrCM-/-
hearts (Fig. 3.14 J-K). Unlike
findings in aerobic hearts, ischemic GcgrCM-/-
hearts had significantly higher triglyceride content
and lower levels of lactate (Fig. 3.14 L-M), whereas levels of citric acid cycle intermediates were
lower in both aerobic and ischemic GcgrCM-/-
hearts (Fig. 3.14 N-R). These findings suggest that
loss of basal cardiac Gcgr signaling leads to reduced fatty acid oxidation, increased triglyceride
pools and higher glucose oxidation resulting in lower levels of lactate.
To investigate whether similar changes in cardiac acylcarnitines arise under conditions of
insulin resistance, GcgrCM-/-
mice were maintained on a high fat diet for 24 weeks. Consistent
with findings in regular chow-fed mice, levels of total long and medium chain acylcarnitine
levels were lower in hearts after prolonged high fat feeding (Fig. 3.15 A&B). Although lactate
levels were similar, citric acid cycle intermediates were lower in GcgrCM-/-
hearts (Fig. 3.15 C-I),
106
suggesting that under conditions of insulin resistance, loss of cardiac Gcgr signaling leads to
reduced fatty acid oxidation.
3.5 Discussion
Adults with type 2 diabetes are two to four times more likely to develop heart disease or a
stroke, findings attributable to associated risk factors such as hypertension, dyslipidemia,
obesity, and abnormalities in coagulation [276-279]. Nevertheless, diabetes itself is widely
viewed as an independent risk factor for the development of cardiovascular disease, although
mechanisms linking hyperglycemia to the pathogenesis of macro vascular disease are complex
and poorly understood [338, 339]. Although deregulated glucagon secretion is fundamental to
the pathophysiology of hyperglycemia, ketoacidosis, and impaired counter-regulation [340], a
role for glucagon in the development of cardiovascular complications has not been extensively
explored.
Acute administration of glucagon increases heart rate and cardiac output, providing the
rationale for use of glucagon as an inotropic or chronotropic agent in subjects with refractory
bradycardia or in the setting of cardiac failure not responsive to classical inotropic therapies
[341, 342]. Nevertheless, these beneficial actions of glucagon are transient, and efforts to use
chronic glucagon administration as a treatment for congestive heart failure were subsequently
abandoned. Our studies show that short-term activation of glucagon receptor signaling in mice
worsens outcomes from experimental myocardial infarction. The deleterious actions of glucagon
required the cardiac Gcgr and were mediated by the p38 MAPK-dependent pathway.
Conversely, partial reduction or cardiac-specific loss of Gcgr signaling improves outcome from
myocardial infarction, and is associated with reduced expression of genes and proteins regulating
fatty acid oxidation in the heart.
Our data linking cardiac Gcgr signaling to fatty acid oxidation is consistent with previous
findings linking Gcgr signaling to PPAR-dependent control of hepatic lipid oxidation [324].
Glucagon enhances PPARα translocation to the nucleus in cardiomyocytes, actions requiring p38
MAPK signalling. Consistent with the functional importance of a glucagon-PPAR pathway in
the heart, our loss of function studies in hearts from GcgrCM-/-
mice reveal significantly reduced

107
cardiac expression of PPARα and downstream targets such ascd36, gpat1, dgat1, and dgat2.
To gain insight into the effects of glucagon on cardiac fuel metabolism we utilized
acylcarnitine profile as a tool to detect abnormalities in fatty acid metabolism. We observed
reduced levels of long and medium chain acylcarnitines strongly suggestive of overall reduced
fatty acid oxidation in GcgrCM-/-
hearts. However, short chain acylcarnitines (C2) levels were
normal in hearts from GcgrCM-/-
mice suggesting selective inhibition of fat oxidation and not
more widespread changes in oxidation of other substrates. It is important to emphasize that while
acylcarnitine profiling is often used as a tool to obtain information on changes in fatty acid
metabolism and substrate utilization, these changes may not always reveal actual overall rates of
fatty acid oxidation [343]. Acylcarnitine levels indicate which step of fatty acid oxidation might
be inhibited for instance; if long chain acylcarnitines are increased and medium chain
acylcarnitines are reduced, this would indicate an inhibition of one of the enzymes involved in
oxidation of medium chain acylcarnitines, and this may not be suggestive of an overall reduction
in fatty acid oxidation [343]. Therefore, assessment of the actual rate of fatty acid oxidation may
further solidify our findings.
Reduction in fat utilization in GcgrCM-/-
hearts leads to increase in Triacylglycerol (TAG)
pools and glucose oxidation, as suggested by reduced phosphorylation of PDH and decreased
lactate levels. Decreased TCA cycle activity in hearts from GcgrCM-/-
mice may indicate that less
energy (ATP) is being made, a hypothesis that can be further solidified by direction
measurement of nucleotide levels in the heart. The heart relies primarily on fatty acid oxidation
under conditions of hyperglycemia and insulin resistance [279, 344-347], and even during states
of low oxidative capacity such as ischemia, fatty acid oxidation predominates as a source of
residual oxidative metabolism [348, 349]. Increased fat oxidation decreases the heart’s ability to
metabolize glucose, and several lines of evidence suggest that utilization of fat over glucose as
substrate for cardiac fuel metabolism decreases cardiac efficiency [350-355]. Utilization of
glucose is more efficient as fatty acid oxidation requires approximately 10% more oxygen to
produce equivalent amounts of ATP than glucose [350]. Additionally, reduced ATP synthesis
may ensue as a result of fatty acid oxidation. ATP synthesis can occur through translocation of
protons from the mitochondrial matrix to the inner membrane space by F1/F0 ATPase; during
fatty acid oxidation expression of uncoupling proteins (UCP 2 and 3) are increased [351, 352].
108
UCPs promote an alternate route for protons from ATP synthesis, thereby uncoupling ATP
synthesis, and leading to reduced cardiac efficiency [351-353]. Moreover, increased fatty acid
utilization can also promote futile cycling of fatty acid intermediates that results in consumption
of ATP for non-contractile functions versus contractile purposes leading to cardiac inefficiency
[354, 355]. Therefore, reduced fat and increased glucose utilization in GcgrCM-/-
hearts may
increase cardiac efficiency, which in turn may contribute to protection from myocardial ischemia
(Figure 3.16).
Previous studies have reported that glucagon can promote fatty acid oxidation in the heart
[356]. Consistent with these findings we observed increased long and medium chain
acylcarnitine levels in glucagon-treated ischemic hearts. These findings complement our loss of
function studies, and are consistent with the notion that glucagon promotes fat oxidation in hearts
and reduce glucose oxidation under ischemic conditions as suggested by the increased inhibition
of PDH by glucagon. Glucagon-mediated increases in fat and reduced glucose oxidation may
contribute to cardiac inefficiency and increased mortality following ischemic cardiac injury
(Figure 3.16).
Glucagon increases heart rate and contractility, and these actions of glucagon are opposite to
the effects of adrenergic β-blockers, which reduce heart rate and slow cardiac contractility,
reducing cardiac energy demand [341, 357-359]. β -blockers reduce myocardial oxygen
consumption and improve myocardial efficiency by shifting myocardial substrate utilization
from increased free fatty acid oxidation to increased glucose oxidation thereby producing
cardioprotection [358, 359]. The consequences of reduced signaling through the adrenergic β-
receptor overlap with the cardiac phenotype observed in GcgrCM-/-
mice. We suspect that GcgrCM-
/- hearts may produce energy more efficiently, which in turn may protect the ischemic heart and
enhance survival after myocardial infarction.
In the diabetic or insulin-resistant hearts it is unclear whether fatty acid oxidation is increased
or decreased as studies have reported inconsistent findings; results are variable depending on the
experimental design or genetic model utilized [279, 332, 360-365]. Impaired fatty acid oxidation
has been suggested to lead to an increase in accumulation of cardiac lipid intermediates including
DAG and ceramide levels. These lipid intermediates have been suggested to inhibit insulin
109
sensitivity and possibly to lead to cardiac lipotoxicity [360, 361, 366]. This is further supported
by genetic models where adipose triglyceride lipase (ATGL) was deleted in mice which resulted
in reduced PPAR-α and PPAR-γ expression in the heart, and blunted fatty acid oxidation, leading
to excessive lipid accumulation, cardiac insufficiency, and lethal cardiomyopathy. Similarly,
another mouse model with overexpression of PPAR-γ in the heart resulted in dilated
cardiomyopathy and deletion of PPAR-α rescued the cardiomyopathy phenotype in the PPAR-γ
overexpressing mice. Surprisingly, deletion of PPAR-α in PPAR-γ overexpressing mice resulted
in upregulation of many PPAR-α targets involved in fatty acid uptake, oxidation and triglyceride
synthesis leading to increased fatty acid oxidation. Despite having increased fatty acid oxidation
these mice have improved cardiac efficiency and reduced cardiac apoptosis [363]. Alternatively,
increasing cardiac fatty acid oxidation has been suggested to be also protective in diabetic or
insulin-resistant hearts, and this is partly due to reduced levels of acylcarnitines, which, when
present at high levels, may disrupt biomembranes and increase the susceptibility to cardiac
apoptosis [364]. Based on these findings, stimulating β-oxidation can benefit the hearts in
diabetes or obesity by reducing the accumulation of intramyocardial lipids and increasing insulin
sensitivity and cardiac efficiency [360, 361, 363, 364, 366, 367].
Although previous studies demonstrate impaired fat oxidation in obese animal models, the
contribution of endogenous TAG turnover rates to these findings is not well defined [360, 361,
363, 364, 366]. In mouse cardiomyocytes, 50 to 70% of total fatty acid oxidation is from
endogenous TAG storage pools [368]. In studies where PPARwas overexpressed in the mouse
heart it resulted in higher TAG turnover and an increased reliance on the endogenous TAG as a
source for fatty acid oxidation was observed [368]. Therefore, by not measuring the TAG
turnover rates these studies are lacking a large portion of fatty acid oxidation measurements,
which may lead to an underestimation of the fatty acid oxidation rates in diabetes and obese
models. Therefore, it is vital to measure TAG turnover rates to make definite conclusions about
the overall fatty acid oxidation rates in diabetes/obesity and in genetic knockout models.
A limitation to enhancing fat oxidation for the treatment of cardiovascular disease is the
possibility of simultaneous reduction of carbohydrate oxidation, which may result in cardiac
inefficiency [279, 332, 367]. Moreover, increased fatty acid oxidation can reduce insulin-
stimulated glucose metabolism based on the Randle cycle [369-372]. Therefore, blocking
110
cardiac fatty acid oxidation as a strategy for the treatment of cardiovascular complications in
diabetes and obesity may not be ideal.
Excessive fat oxidation is also observed in hearts from T2D animal models and in obese
human subjects [279, 332, 365]. Furthermore, in obese or diabetic human subjects with chronic
heart failure reduction of fatty acid oxidation using anti-anginal drugs that inhibit enzymes
involved in fatty acid oxidation or fatty acid transport into mitochondria showed an improved
cardiac function [373, 374]. However, these studies also report overall improved whole body
insulin sensitivity as well. Nonetheless, a number of genetic mouse models also suggest that
enhanced fatty acid oxidation is not always beneficial, as transgenic mice with cardiac over-
expression of PPAR- exhibited excessive fatty acid oxidation and features of diabetic
cardiomyopathy [375]. Furthermore, deletion of CD36, a fatty acid transporter, in PPAR-
transgenic mice led to reduction of fatty acid oxidation and rescued the excessive fatty acid
oxidation and diabetic cardiomyopathy phenotype [376]. Under ischemic conditions
manipulation of PPAR-α expression has also been shown to modulate outcomes from ischemia.
Genetic deletion of of PPAR-α gene in mice resulted in improved cardiac outcomes and
activation of PPAR-α during ischemia led to increase fatty oxidation, which resulted in reduced
cardiac efficiency and post-ischemic functional loss [377, 378]. Therefore, these studies suggest
blocking fatty acid oxidation in cardiac ischemia or diabetes and obesity can be beneficial.
Our results are consistent with the concept that reduced expression of PPAR-α in hearts of
GcgrCM-/-
mice may contribute to improved outcomes following ischemic injury as a result of
reduced fat oxidation and increased glucose oxidation. Conversely, activation of Gcgr signaling
activation results in increased PPAR-α translocation to the nucleus in a p38 MAPK-dependent
manner, resulting in increased expression of PPAR-α target genes in the heart. This in turn leads
to increased fat uptake in cardiomyocytes and mitochondria resulting in increased fatty acid
oxidation and decreased glucose oxidation, as suggested by PDH phosphorylation, which results
in cardiac inefficiency following glucagon treatment in the setting of cardiac ischemia. This is
further supported by our findings that glucagon-mediated increases in apoptosis in hydrogen
peroxide-treated HL-1 cells was dependent on PDH phosphorylation by PDK-4, suggesting that
111
glucagon may also increase apoptosis by blocking glucose oxidation.
Under ischemia when the oxygen supply to the heart is minimal the substrate utilization by
the heart is minimized [379, 380]. Accordingly, fatty acid oxidation and glucose oxidation are
reduced under ischemic conditions. Reduction in fatty acid oxidation in the heart under ischemic
conditions results in lower cardiomyocyte levels of very long chain and long chain
acylcarnitines[379, 380]. Reduced levels of long chain acylcarnitines have been suggested to be
beneficial for cardiomyocyte health as increased levels of cardiomyocyte acylcarnitines
minimize oxygen consumption by cardiomyocytes, inhibit ATPase activity, and they also have
detergent-like properties that can disrupt membranes and increase lysosomal activity of the cells
leading to poor cardiomyocyte health[379, 380]. We propose here another mechanism through
which glucagon may be increasing cardiomyocyte injury - by increasing long chain acylcarnitine
levels in the heart under ischemic conditions. Similarly, in the GcgrCM-/-
mice reduced long chain
acylcarnitine levels can also be beneficial for the survival of the cardiomyocytes under ischemic
conditions.
In summary our studies demonstrate that enhanced glucagon action in the cardiovascular
system may be detrimental, while partial global reduction of Gcgr activity in Gcgr+/- mice or
cardiomyocyte-specific attenuation of Gcgr signaling may be beneficial in the setting of cardiac
ischemic injury. Our findings have implications for ongoing development of therapeutic
strategies designed to augment or inhibit Gcgr signaling [5, 282, 381, 382] for the treatment of
metabolic disorders.

112
CHAPTER 4: General Discussion and Future Direction
CHAPTER 4
General Discussion and Future Directions
113
.
Diabetes consists of inappropriate increases in glucagon secretion and a higher risk of
cardiovascular disease. Reduced glucagon action is known to improve glucose homeostasis
however; the exact mechanism through which reduction of glucagon action leads to improved
glucose homeostasis is unknown. Current US Federal drug administration guidelines recommend
that manufacturers developing novel therapies for type 2 diabetes (T2D) provide evidence that
the therapy will not increase the risk of cardiovascular mortality. A functional Gcgr is expressed
in the heart. However, glucagon’s physiological role in the heart is unknown, and it is not clear if
therapies that target the inhibition or activation of glucagon receptor (Gcgr) signaling will have
detrimental effect in the cardiovascular system.
The initial studies with the Gcgr-/- mice revealed improved glucose homeostasis, delayed
gastric emptying, and improved β-cell function in addition to elevated GLP-1 levels in the Gcgr-
/- mice. However, initial studies did not thoroughly explore the mechanism(s) through which
deletion of the Gcgr led to improved glucose homeostasis, delayed gastric emptying, and
improved β-cell function, and whether elevated GLP-1 played a role in the improved metabolic
phenotype in the Gcgr-/- mice. In this thesis, I have addressed the role of the elevated GLP-1
levels in the improved metabolic phenotype of the Gcgr-/- mice by generation and
characterization of the Gcgr-/-:Glp1r-/- mice in Chapter 2. In this thesis, I have identified for
the first time that β-cells can sense signal from the gut and can compensate for the lack of
classical incretins. I made the observations that the non-classical incretin receptors could
compensate in the absence of classical incretin signaling as deletion of the classical incretin
receptors led to compensation from the non-classical incretins including GPR119 and CCKA
receptors.
The number one cause of death in diabetes is heart disease. Previous studies have
explored the pharmacological role of glucagon in cardiac ischemia. Some studies have reported
beneficial, while others have shown worsening outcomes from cardiac ischemia following
glucagon administration. In Chapter 3, I addressed the physiological role of Gcgr signaling in
cardiac ischemia. I aimed to delineate the physiological role of cardiac-specific Gcgr signaling in
myocardial ischemia by generating cardiac-specific Gcgr knockout mice. I identified for the first
114
time that the physiological Gcgr signaling regulates cardiac fatty acylcarnitine levels and could
influence susceptibility to cardiac ischemia, and this might be dependent on p38 MAPK and
PPARα pathway. Together, these studies demonstrate for the first time the importance of
endogenous Gcgr signaling in cardiac ischemia.
How does the Glp1r contribute to the improved ipGTT, gastric emptying, and
reduced fasting glycaemia in Gcgr-/- mice? Is Glp1r signaling solely responsible for
these phenotypes in the Gcgr-/- mice?
Deletion of the Glp1r in the Gcgr-/- mice led to reversal of improved pit, reduced fasting
glycaemia, and delayed gastric emptying to levels observed in wild-type mice. Pharmacological
activation of the Glp1r using Glp1r agonists or native GLP-1 have universally been shown to
improve glucose tolerance, increase insulin secretion, reduce appetite, and delay gastric
emptying in rodents, pigs, and humans [184, 308, 383]. Consistent with the evidence that GLP-1
plays an important role in improving glucose homeostasis and regulation of fasting glucose
levels; Glp1r-/- mice exhibit impaired glucose tolerance and fasting hyperglycemia [384]. GLP-
1-mediated improvements in glucose tolerance are largely mediated through Glp1r signaling on
β-cells and mainly through cAMP activation. Furthermore, overexpression of Glp1r in a clonal
β-cell line leads to increased resting cAMP levels [385]. One possible mechanism through
which deletion of Glp1r could lead to increases in fasting glycaemia and impaired glucose
tolerance during an intraperitoneal glucose challenge could be due to defects in β-cell plasma
membrane depolarization. This is supported by studies with DIRKO mice islets that show 50%
reduction in the amplitude of insulin secretion as a result of defects in plasma membrane
depolarization in β-cells from DIRKO mice. I observed reduced insulin secretory responses to
tolbutamide and l-arginine in islets from the Gcgr-/- and Gcgr-/-:Glp1r-/- mice; suggesting
defect in membrane depolarization in islets from Gcgr-/- and Gcgr-/-:Glp1r-/- mice [386].
Additionally, GLP-1 mediated regulation of fasting glucose could also be through control of
glucagon and regulation of liver glucose production. Although no Glp1r expression has been
detected in the liver, it is possible that central Glp1r activation shuts down liver glucose
production during fasting [225]. Elevated GLP-1 levels in the Gcgr-/- mice could be inhibiting
gastric emptying via the vagal nerves. Consistent with our findings, previous studies have shown
that denervation/treatment with Ex-9-39 abolished glucose-induced inhibition of gastric
115
emptying [387]. These studies concluded that endogenous GLP-1 released upon food ingestion
inhibits gastric emptying via the vagal nerves. Hence, elevated GLP-1 levels are responsible for
majority of the overall improved metabolic control observed in the Gcgr-/- mice.
Deletion of Glp1r in Gcgr-/- mice did not completely reverse the reduced fasting
glycaemia and improved ipGTT to levels observed in Glp1r-/- mice. Glp1r signaling may be
contributing to most of the improved ipGTT and reduced fasting glycaemia; however, loss of
Gcgr signaling may indirectly or directly affect the improved ipGTT and reduced fasting
glycaemia in addition to the elevated GLP-1 levels. Gcgr signaling in the liver has been shown
to be important for basal liver glucose production and gluconeogenesis [388]. Therefore, loss of
Gcgr signaling in the liver may be reducing the basal glucose production or gluconeogenesis by
the liver. Furthermore, Gcgr-/- mice have been reported to also have high plasma bile acid levels
[49]. Bile acids have been shown to improve glucose tolerance and improve β-cell function.
Another possibility could be that in addition to the elevated GLP-1 levels, elevated bile acids
could also contribute to the improved ipGTT and reduced fasting glycaemia in the Gcgr-/- mice.
Future studies should explore the role of liver Gcgr signaling and bile acid in contribution to the
improved ipGTT and reduced fasting glycaemia in the Gcgr-/- mice. To test if liver Gcgr
signaling is involved in the improved ipGTT and reduced random fed glycaemia in the Gcgr-/-
mice one can restore the expression of Gcgr in the liver of Gcgr-/-:Glp-1r-/- mice through
adenoviral transfer of Gcgr gene under Albumin promoter. If this restores the improved ipGTT
and reduced fasting glycaemia in the Gcgr-/-:Glp1r-/- mice to levels in Glp1r-/- mice then this
would imply involvement of liver Gcgr signaling. To test if bile acids are involved in the
improved ipGTT and reduced fasting glycaemia in the Gcgr-/- mice Gcgr-/-:Glp-1r-/- mice
should be mated with the G protein-coupled bile acid receptor 1 and membrane-type bile acid
receptor (TGR5) knockout mice (TGR5-/-) to make a triple Gcgr-/-:Glp1r-/-:TGR5-/- mice.
TGR5 receptor is present in brown adipose tissue and intestine, where its agonism increases
energy expenditure and lowers blood glucose [389]. If the triple knockout mice have similar or
worse ipGTT and fasting glucose levels compared to Glp1r-/- mice then this will imply
involvement of bile acids in improving ipGTT and fasting glycaemia in the Gcgr-/- mice in
addition to the elevated GLP-1 levels.
116
Do the elevated GLP-1 levels in the Gcgr-/- mice contribute to increased insulin
sensitivity?
In Chapter 2, I show that the Gcgr-/-:Glp1r-/- DKO mice continue to exhibit increased
insulin sensitivity similar to Gcgr-/- mice following an insulin challenge. Similarly, liver-specific
Gcgr-/- mice also exhibit increased insulin sensitivity comparable to the whole body Gcgr-/-
mice [49]. Therefore, the study by Longuet et al and my findings from Chapter 2 suggests that
the impact of glucagon on insulin sensitivity can be largely mediated by hepatic Gcgr signaling
and is independent of Glp1r signaling. In the whole body Gcgr-/- mice, hepatic phospho-cAMP
response element binding protein (P-CREB), a major component of glucagon’s signal
transduction pathway, and the mRNA of phosphoenol pyruvate carboxykinase (PEPCK), a
glucagon-responsive gluconeogenic target enzyme studies have shown to be downregulated
compared to wild-type littermate control mice [390]. Previously studies have shown that
knocking down CREB using antisense oligonucleotide in the liver prevents hepatic insulin
resistance in ZDF rats and ob/ob mice diabetic models. Therefore, it can be possible that deletion
of Gcgr in the liver leads to low expression of CREB, which is driving the increased insulin
sensitivity by reducing hepatic glucose production and storage [391]. Future studies need to
address how loss of liver Gcgr signaling regulates insulin sensitivity and investigate if CREB,
PEPCK, and/or other signaling pathways are involved.
What mechanisms regulate α-cell hyperplasia and the enlarged pancreas in Gcgr-/-
mice if not Glp1r signaling?
. In Chapter 2, I investigated the role of the Glp1r in α-cell hyperplasia and enlarged
pancreas observed in Gcgr-/- mice by assessing insulin staining and weight of the pancreas in the
Gcgr-/-:Glp1r-/- mice . The pancreas in the Gcgr-/-:Glp1r-/- mice continued to be enlarged and
the islet structure remained perturbed as observed in the Gcgr-/- mice [131]. This suggests that
Glp1r is not involved in the α-cell hyperplasia or in the increased pancreas weight seen in the
Gcgr-/- mice. Related studies have shown that liver-specific knockout of the gene encoding for
the Gsα protein which is a G-protein involved downstream of the Gcgr signaling, leads to
enlargement of the pancreas and α-cell hyperplasia as observed in the Gcgr-/-mice [314]. The
enlarged pancreas and α-cell hyperplasia phenotype in the Gsα-/- mice were independent of the
117
Glp1r as the Gsα-/-:Glp1r-/- double knockout mice continued to show an enlarged pancreas
despite deletion of the Glp1r. Overall, the findings indicate that there may be other factors,
independent of Glp1r signaling, playing a role in non β-cell hyperplasia and enlarged pancreas
weight seen in Gcgr-/- mice.
Since islets account for approximately 2% of total pancreatic weight, increase in islet
number and size cannot account for the overall increase in pancreas weight in the Gcgr-/-. It is
not clear whether the increased pancreas weight represents increased cell size and/or cell
numbers and/or water content in the exocrine pancreas. Future studies need to investigate
whether the increased pancreas weight is a result of increased cell size/number or water content
in the exocrine pancreas.
What are the mechanisms by which eliminating the Gcgr and Glp1r lead to
compensation from other incretin receptors?
In Chapter 2, we show that deletion of both Gcgr and Glp1r or knocking down Gcgr
expression using Gcgr antisense oligonucleotides in the DIRKO mice results in upregulation of
GPR119 and CCKA receptor expression in islets. Additionally, sensitivity to GPR119 and
CCKA receptors are also upregulated as demonstrated by increased plasma insulin and lower
glucose excursion following treatment with GPR119 and CCKA receptor agonists or ligands in
the Gcgr-/-:Glp1r-/- DKO mice. Previous studies have shown that in the absence of Glp1r, there
is compensation by GIP through both upregulation of plasma GIP levels and through increased
Gipr expression in islets [392]. Therefore, in activation of the classical incretin receptors Gipr or
Glp1r only caused a mild impairment in glucose tolerance [386]. In this thesis, I speculate that
signals to β-cells are sent from the gut to increase expression of other incretin receptors in the
absence of the classical incretin signaling. Studies have previously shown that specialized cells
from the intestine can detect changes in glucose concentrations and hormone levels in the
circulations and can send signals to peripheral tissues such as the pancreatic β-cells through the
vagus nerve [393]. Therefore, this could be one of the mechanisms through which in our studies
the gut is communicating to β-cell s to upregulate the expression of incretin receptors in the
absence of the classical incretin receptors. The exact molecular mechanisms of how the gut
regulates β-cell function have not been defined clearly and require further investigation [393].
118
Additionally, it is not excluded that the changes in expression of CCKa and GPR119 receptors in
β-cells could be mediated through the brain-β-cell axis. The β-cells from nervous system
specific deletion of GLUT-2 have been shown to have lower insulin secretion and lower β-cell
mass due to lower β-cell proliferation. Furthermore, electrophysiology revealed lower
parasympathetic activity in the CNS specific GLUT-2 knockout mice. This is suggesting brain-β-
cell axis could be regulating the β-cell changes observed in CNS specific GLUT-2 knockout mice
[394]. Therefore, brain-β-cell axis interaction has been reported previously, and this could be
one of the mechanisms through which β-cell s in the Gcgr-/-:Glp1r-/- mice could be mediating
upregulation of CCKa and GPR119 receptors. Direct loss of Gcgr and Glp1r in β-cells could
also be mediating the upregulation of CCKa and GPR119 receptors. Therefore, future studies
need to explore what tissue or cell type is involved in mediating these signals to beta cells.
Although little is known about the control of Glp1r and Gipr gene transcription and
posttranslational modifications, studies suggest glucose, transcription factors, kinase signaling,
and posttranslational modification including N-glycosylation can impact Glp1r and Gipr
expression [395, 396]. PPAR-α has been shown to be involved in metformin-induced increase in
islet cell incretin receptor expression [395]. In the PPARα-/- mice, metformin failed to increase
islet incretin receptor transcripts including CCKar expression [395]. Previously PPARα has
been shown to be involved in Gipr expression [397]. Furthermore, direct treatment of BRIN-
D11 cells or rat islets with PPARα agonist WY14643 for 8-24 hours significantly increased the
expression of Gipr[398]. Therefore, one possible mechanism through which genetic deletion of
one or more of the incretin receptors can lead to compensation from the other incretin receptors
can be through upregulation of PPARα leading to increased expression of other non-classical or
classical incretin receptors. Studies on human islets isolated from T2D subjects revealed
decreased expression of GIPR and GLP1RmRNA transcripts and this was associated with
decreased protein levels of TCF7L2 (T cell factor 7 L 2) [399]. TCF7L2 is a transcription factor
involved in the WNT signaling pathway. Knock down of TCF7L2 in human islets was
associated with reduced levels of incretin receptors [399]. Therefore, another possible
mechanism through which deletion of one or more of the incretin receptors can lead to
compensation from other incretin receptors may be through upregulation of TCF7L2
transcription factor activity or expression. Transcription factors involved in pancreatic
119
development including islet 1 (isl-1) and its co-regulator, LIM-domain–binding coregulators
(Ldb1) have also been shown to regulate Glp1r expression. Pancreas-specific deletion of isl-1 or
Ldb1 led to reduced levels of Glp1r mRNA transcripts and Glp1r promoter binding was detected
using CHIP experiments using antisera against either isl-1 or Ldb1 [400]. Therefore, another
mechanism through which loss of one or more incretin receptors can lead to induction of the
expression of other incretin receptors may be a result of upregulation of isl-1 and/or Ldb1 gene
expression or activity. AMP kinase has also been shown to be involved in the regulation of
glucose-induced incretin receptor expression. Treatment with AMPK inhibitor and double
negative-AMPK expression led to significant increase in incretin receptor expression under low
glucose, and inhibition of AMPK had no effect on incretin receptor expression under
hyperglycemic conditions [401]. Therefore, this could be one of the mechanisms through which
loss of one or more incretin receptors on islet β-cells can lead to compensation from other
incretin receptors can be through reduction of AMPK activity or expression. Future experiments
should investigate expression at the protein and mRNA levels of PPAR-α, TCF7L2, isl-1, Ldb1,
and AMPK in islets from Gcgr-/-:Glp1r-/- DKO and DIRKO mice treated with Gcgr antisense
oligonucleotides or in Ins-1 cells following knock down of Gcgr and Glp1r. Posttranslational
modification of GPCRs can also influence the plasma membrane expression of GPCRs. Most of
the GPCRs including Gipr and Glp1r possess N-terminus Asn-linked (N)-glycosylation [402].
Studies in Chinese hamster ovary cells and Ins-1 cells have shown that N-glycosylation can
enhance cell surface expression and function of Glp1r and Gipr [402]. N-glycosylation
lengthens receptor half-life by reducing degradation in the endoplasmic reticulum. Studies have
also shown that expression of Gipr mutant lacking N-glycosylation can be rescued by co-
expressing wild-type Glp1r [402]. Therefore, genetic deletion of the classical incretin receptors
can lead to compensation from other incretin receptors can be through modification on N-
glycosylation which may increase the half-life of the receptors on cell surface and/or increase
receptor function as well. Future studies should investigate whether N-glycosylation of Glp1r,
Gipr, CCKar, and GPR119 controls cell surface availability and receptor expression.
120
Are the elevated GLP-1 levels in the Gcgr-/- mice responsible for the improved
outcome from ischemia reperfusion?
In Chapter 3, I observed improved outcomes from ischemia reperfusion injury in hearts
from Gcgr-/- mice ex-vivo. Improved outcome from myocardial infarction can be a result of
elevated plasma GLP-1 levels in the Gcgr-/- mice. Glp1r activation in rodents, pigs, and human
studies has been shown to be cardioprotective in ex-vivo and in vivo [232, 233, 238, 258, 259].
However, we have prevented the influence of GLP-1 and other secreted factors in ischemia
reperfusion experiments by assessing outcomes in isolated hearts from Gcgr-/- mice in the
absence of elevated GLP-1 levels. However, it is not excluded that the hearts from Gcgr-/- mice
may have better outcomes as the hearts had chronic exposure to elevated GLP-1 levels during
development. To date none of the studies have assessed the outcome from ischemia ex-vivo or in
vivo following chronic exposure to GLP-1 during development. Nonetheless, in our gain of
function glucagon treated hearts in ex-vivo, glucagon worsened outcomes from myocardial
infarction suggesting direct activation of Gcgr signaling may not be ideal for the outcome from
ischemia reperfusion. Similarly, in the Gcgr+/- mice and cardiac specific Gcgr-/- mice which
lack elevated GLP-1 levels and have similar glucose tolerance to wild-type control, we found
improved outcomes from myocardial infarction suggesting the effects of Gcgr signaling in the
outcome from myocardial infarction are cardiac-specific and may not be influenced by the
elevated GLP-1 levels.
Does loss or enhanced Gcgr signaling control fat and/or glucose oxidation in the
heart?
In Chapter 3, we show that enhancing cardiac Gcgr signaling impairs outcome from
myocardial infarction and suppressing cardiac Gcgr signaling improves outcomes from
myocardial infarction. We speculate the differences in survival can be a result of differences in
fatty acid oxidation as suggested by changes in acylcarnitine profiles; however, our studies
require further investigation as measurement of acylcarnitine levels is not a direct assessment of
fatty acid flux in the heart. Accordingly, differences in acylcarnitine levels may not always
indicate changes in fatty acid flux. For instance if long chain acylcarnitines are increased and
medium chain acylcarnitines are decreased there may not be an overall change in fatty acid flux
121
but this may indicate there is a block in medium chain acylcarnitine generation [343]. Therefore,
direct assessment of fatty acid oxidation rates is required to make solid conclusions about fatty
acid flux rates. There are various methods for measuring fatty acid oxidation, and these include
both direct and indirect methods [403]. The most commonly used method in the heart is to
assess whole flux measurement. Whole flux measurement involves measuring the byproducts of
fatty acid oxidation. One of the byproducts of fatty acid oxidation is CO2, one can perfuse 14
C
radiolabelled fatty acids in the heart in an ex-vivo working heart model followed by measurement
of byproducts which will be radiolabelled using 14
C to quantify the rate of fatty acid oxidation
[403].
In Chapter 3, we also claim that the GcgrCM-/-
mice have increased glucose oxidation as seen
by a trend towards a reduction in PDH phosphorylation, and we also observed glucagon
increased PDH phosphorylation by PDK-4 in HL-1 cells and in hearts in vivo. This suggests that
glucagon can block glucose oxidation, and deletion of Gcgr in the heart can increase glucose
oxidation. However, we did not assess directly the glucose oxidation rates in hearts from
GcgrCM-/-
mice, nor in our gain of function studies did we assess glucose oxidation rates
following glucagon treatment in vivo. Therefore, our future studies need to explore the direct
rate of glucose oxidation in the heart. Glucose oxidation can be measured by perfusing
radiolabelled glucose into the hearts ex-vivo followed by measurement of by-products of glucose
oxidation, which is CO2 [403].
Is Gcgr signaling mediated changes in outcome from myocardial infarction
dependent on the rate of glucose and/or fat oxidation?
Our studies suggest that augmentation of Gcgr signaling leads to an increase and
inhibition of Gcgr signaling results in reduction of cardiac fatty acid oxidation, and this may be a
mechanism through which Gcgr signaling regulates susceptibility to myocardial infarction.
However, it is not clear if the reduced or increased cardiac fatty acid oxidation is directly
involved in protecting GcgrCM-/-
mice hearts from myocardial infarction. To address this, we
have treated GcgrCM-/-
mice with a PPAR-α agonist, fenofibfrate. Fenofibrate has been shown to
increase fatty acid oxidation in the heart following oral administration in mice. [404]. In our
study, we gavaged fenofibrate twice a day, from 24 hours prior to LAD ligations until 7 days
122
following LAD ligations and found treatment with fenofibrate failed to worsen outcomes from
myocardial infarction in the GcgrCM-/-
mice (data not shown). This could be due to fenofibrate’s
effect in the liver. Fenofibrate has been shown to increase fatty acid oxidation in the liver leading
to reduction of plasma lipids, resulting in reduced myocardial fatty acid supply and protection
from myocardial infarction. Studies have shown previously that administration of fenofibrate in
mice leads to protection from myocardial infarction, and this was associated with reduced fat
oxidation in the hear[404-406]. Therefore, administration of fenofibrate in vivo to the whole
animal may not be ideal as it may be increasing fatty acid oxidation in the liver of GcgrCM-/-
mice
and may cause further protection from myocardial infarction. Currently, there are no fatty acid
oxidation agonists that can be targeted only to the heart without impacting fatty acid oxidation
elsewhere. One way of eliminating the liver effect of increasing fatty acid oxidation is to isolate
the hearts in ex-vivo and perfuse fenofibrate into the heart. Our future experiments should
explore working heart models of ischemia reperfusion from GcgrCM-/-
mice ex-vivo with and
without perfusion of fenofibrate. Perfusion of fenofibrate in the GcgrCM-/-
hearts ex vivo should
result in an increase in fatty acid oxidation, allowing us to investigate if we can reverse the
improvements in survival from myocardial infarction. Similarly, in our gain of function studies,
glucagon should be perfused in the working heart model ex-vivo with or without fatty acid
oxidation inhibitors including trimetazidine or ranolazine or glucose oxidation activators using
dicholoroacetate [407]. If glucagon fails to worsen outcome from ischemia reperfusion ex-vivo in
the presence of fatty acid oxidation inhibitors or glucose oxidation activators, then this will
imply glucagon-mediated worsening of outcomes from myocardial infarction is dependent on fat
and/or glucose oxidation.
Does Gcgr signaling regulate susceptibility to myocardial infarction through p38
MAPK and/or PPAR-αpathway?
In Chapter 3, our data suggests that glucagon increases susceptibility to myocardial
infarction in a p38 MAPK-dependent manner and upregulated phosphorylation of p38 MAPK
expression in vivo. However, we did not assess the expression of p38 MAPK in our loss of
function model. Therefore, future studies need to look at expression of p38 MAPK in GcgrCM-/-
hearts before and after experimental myocardial infarction. Furthermore, we show upregulation
of PPAR-α regulated gene expression and increase PPAR-α translocation to the nucleus in HL-1
123
cell lines following glucagon treatment. However, our studies require further investigation; it is
not clear if glucagon’s detrimental effect on myocardial infarction is dependent on PPAR-α
activity in vivo. Future studies should investigate if glucagon treatment worsens outcomes from
myocardial infarction in the whole body or cardiac specific PPAR-α knockout mice. If glucagon
fails to impair outcomes from myocardial infarction in the PPAR-α knockout mice, this would
imply PPAR-α is involved in glucagon-mediated impairment of outcomes from myocardial
infarction. Furthermore, our studies have shown that PPAR-α translocation to the nucleus by
glucagon is dependent on p38 MAPK pathway and is independent of PKA pathway. Future
studies need to explore whether glucagon activates PPAR-α exclusively through p38 MAPK or if
it involves other kinases including PKC, PI3K, ERK, GSK3, or other signaling proteins which
have been shown previously to activate PPAR-α [408-410]. Additionally, future studies also
need to investigate if in addition to PPAR-α, there are other p38 MAPK mediated pathways
activated by glucagon including ATF2 and PGC-1α, which have been previously shown to be
activated by p38 MAPK [411].
Does Gcgr signaling in the heart have direct effects on myocardial infarction or are
the effects indirect?
In Chapter 3, my studies suggest a direct role of Gcgr signaling in the heart in modulating
susceptibility to myocardial infarction. I showed that perfusion of glucagon in hearts ex-vivo
caused protection from ischemia reperfusion. Similarly hearts from the whole body Gcgr-/- mice
show protection during ischemia reperfusion in ex-vivo experiments. Furthermore, treatment with
glucagon in mice led to increased susceptibility to myocardial infarction and these effects of
glucagon were dependent on cardiac Gcgr signaling. Conversely deletion of Gcgr signaling in
the heart led to protection from myocardial infarction. Altogether, both the in vivo and ex vivo
gain of function and loss of function studies suggest the effects of Gcgr signaling on myocardial
infarction are direct. However, future studies need to assess whether treatment with glucagon in
primary cardiomyocyte in culture leads to increased apoptosis and if so, does glucagon utilize
p38 MAPK and PPAR-α pathways to mediate pro-apoptotic pathways in primary
cardiomyocytes similar to the mechanisms we observed in the GcgrCM-/-
mice and HL-1 cell line.
Interestingly, none of the studies in primary cardiomyocyte in culture so far has looked at the
role of Gcgr signaling in primary cardiomyocytes.
124
Are there differences in physiological versus pharmacological activation of Gcgr
signaling in the heart and susceptibility to myocardial infarction?
In Chapter 3, for the first time I have investigated the role of the endogenous Gcgr
signaling in myocardial infarction. In loss of function studies with the GcgrCM-/-
mice, we
observed protection from myocardial infarction suggesting endogenous Gcgr signaling plays a
role in regulation of myocardial infarction. This also suggested that activation of Gcgr signaling
in the heart might not be beneficial for the outcomes from myocardial infarction. We utilized
pharmacological doses of glucagon for ischemia reperfusion and for our in vivo gain of function
studies (1ug/mL perfusion and 30ug/kg respectively). However, in our in vivo studies, we picked
a pharmacological dose that did not cause chronic hyperglycemia and/or reduced food intake
and/or body weight; as changes in these parameters can impact outcomes from myocardial
infarction. My studies in Chapter 3 and the majority of the studies conducted with glucagon
previously have looked at the cardiovascular outcomes following a pharmacological dose of
glucagon. None of the studies have looked at the outcome from myocardial infarction following
chronic activation of Gcgr signaling using physiological glucagon levels. Therefore, future
studies should investigate the role of physiological activation of Gcgr signaling in myocardial
infarction by administration of physiological dose of glucagon in the heart in ex-vivo and/or in
vivo and look at acylcarnitine levels in the heart and susceptibility to myocardial infarction.
Does glucagon protect the heart from myocardial infarction during diabetes or high
fat diet-induced obesity?
In Chapter 3, my studies illustrate that the levels of long and medium chain acylcarnitine
in diet-induced obese GcgrCM-/-
mice are lower than that observed in littermate control mice. This
is suggesting that the GcgrCM-/-
mice hearts have lower fatty acid flux even following diet
induced obesity. This implies under diet induced obesity, deletion of Gcgr signaling in the heart
may have beneficial outcomes from myocardial infarction by reduction in fatty acid flux.
Interestingly, recent studies in mice, rats, and humans have shown that fatty acid oxidation rates
are increased in obesity and insulin resistance. High levels of fatty acid oxidation blocks glucose
oxidation pathways leading to decrease in insulin-stimulated glucose oxidation and resulting in
125
insulin resistance in the heart and worsening of outcomes from myocardial infarction [344, 345,
362, 412-415]. Additionally, in our gain of function studies we observed an increase in
acylcarnitine levels with glucagon treatment following ischemia. This is suggesting that
glucagon may increase fatty acid flux in the heart and reduce glucose oxidation leading to
increase in cardiac insulin resistance and worsening outcome from myocardial infarction.
Therefore, my findings in Chapter 3 prompts future studies to explore the role of
hyperglucagonemia in T2D or obesity induced cardiovascular complications.
Hyperglucagonemia in obesity and T2D can be driving the increase in fatty acid oxidation and
blockage in glucose oxidation in the heart.
Potential therapeutic impact:
Recent data from mice studies suggests that repeated administration of a dual
glucagon/Glp-1 receptor agonist causes more weight loss, reduction in food intake, fat mass, and
induction of energy expenditure and improvement in plasma lipids relative to Glp1r agonism
alone in high fat diet fed mice [281, 282]. Dual agonism of GLP-1 and glucagon receptors does
not cause hyperglycemia despite glucagon action to promote glucose production by the liver in
part due to GLP-1’s anti-hyperglycemic actions, which counteract glucagon-mediated increase in
blood glucose levels. The lipolytic and thermogenic properties of glucagon in addition to the
satiation-inducing properties of GLP-1 make Gcgr-Glp1r co-agonist an ideal therapeutic for the
treatment of diabetes [282]. However, my studies reveal potential limitations to developing
Gcgr agonists for the treatment of T2D. Activation of Gcgr signaling in the heart may not be
ideal for cardiovascular outcomes as glucagon reduces survival following myocardial infarction
possibly through increasing fatty acid oxidation and decreasing glucose oxidation in the heart.
Conversely, partial reduction or cardiac specific inhibition of Gcgr signaling seems to improve
outcomes during myocardial infarction as Gcgr+/- and GcgrCM-/-
mice are protected from
myocardial infarction. Therefore, my studies support development of partial Gcgr antagonists
for the treatment of myocardial infarction. My findings also encourage future investigation
looking at the role of hyperglucagonemia in promoting cardiovascular
abnormalities/complications in T2D, and whether chronic hyperglucagonemia may be driving
the increased fatty acid oxidation in diabetic hearts.

126
Overall Summary:
My thesis reveals an important role of Gcgr signaling in regulating β-cell nutrient
sensing and cardiomyocyte fuel metabolism. My findings suggests careful assessment of
therapies that target modulation of Gcgr signaling for the treatment of diabetes as Gcgr
signaling seems to be important for cardiovascular outcomes in myocardial infarction.
127
REFERENCES
1. White, J.W. and G.F. Saunders, Structure of the human glucagon gene. Nucl Acids Res,
1986. 14: p. 4719-4730.
2. Mojsov, S., et al., Preproglucagon gene expression in pancreas and intestine diversifies
at the level of post-translational processing. J Biol Chem, 1986. 261: p. 11880-11889.
3. Drucker, D.J., S. Mojsov, and J.F. Habener, Cell-specific post-translational processing of
preproglucagon expressed from a metallothionein-glucagon fusion gene. J.Biol.Chem.,
1986. 261: p. 9637-9643.
4. Efrat, S., et al., Glucagon gene regulatory region directs oncoprotein expression to
neurons and pancreatic alpha cells. Neuron, 1988. 1: p. 605-613.
5. Ali, S. and D.J. Drucker, Benefits and limitations of reducing glucagon action for the
treatment of type 2 diabetes. Am J Physiol Endocrinol Metab, 2009. 296(3): p. E415-21.
6. Furuta, M., et al., Severe defect in proglucagon processing in islet A-cells of prohormone
convertase 2 null mice. J Biol Chem, 2001. 276(29): p. 27197-202.
7. Quesada, I., et al., Physiology of the pancreatic alpha-cell and glucagon secretion: role
in glucose homeostasis and diabetes. J Endocrinol, 2008. 199(1): p. 5-19.
8. Miki, T., et al., ATP-sensitive K+ channels in the hypothalamus are essential for the
maintenance of glucose homeostasis. Nat Neurosci, 2001. 4(5): p. 507-12.
9. Heinrichs, S.C., et al., Endogenous corticotropin releasing factor modulates feeding
induced by neuropeptide Y or a tail-pinch stressor. Peptides, 1992. 13: p. 879-884.
10. Hauge-Evans, A.C., et al., Somatostatin secreted by islet delta-cells fulfills multiple roles
as a paracrine regulator of islet function. Diabetes, 2009. 58(2): p. 403-11.
11. Bansal, P. and Q. Wang, Insulin as a physiological modulator of glucagon secretion. Am
J Physiol Endocrinol Metab, 2008. 295(4): p. E751-61.
12. Stagner, J.I. and E. Samols, Retrograde perfusion as a model for testing the relative
effects of glucose versus insulin on the A cell. J.Clin.Invest., 1986. 77: p. 1034-1037.
13. Greenbaum, B.H., Transfusion-associated graft-versus-host disease: historical
perspectives, incidence, and current use of irradiated blood products. J Clin Oncol, 1991.
9(10): p. 1889-902.
14. Weir, G.C., et al., Glucagon secretion from the perfused pancreas of streptozotocin-
treated rats. Diabetes, 1976. 25(4): p. 275-82.
128
15. Maruyama, H., et al., Insulin within islets is a physiologic glucagon release inhibitor.
J.Clin.Invest., 1984. 74: p. 2296-2299.
16. Kawamori, D., et al., Insulin signaling in alpha cells modulates glucagon secretion in
vivo. Cell Metab, 2009. 9(4): p. 350-61.
17. Xu, E., et al., Intra-islet insulin suppresses glucagon release via GABA-GABA(A)
receptor system. Cell Metab, 2006. 3(1): p. 47-58.
18. Zhou, H., et al., Zinc, not insulin, regulates the rat alpha-cell response to hypoglycemia
in vivo. Diabetes, 2007. 56(4): p. 1107-12.
19. MacDonald, P.E., et al., A K ATP channel-dependent pathway within alpha cells
regulates glucagon release from both rodent and human islets of Langerhans. PLoS Biol,
2007. 5(6): p. e143.
20. Singh, V., et al., Somatostatin receptor subtype-2-deficient mice with diet-induced obesity
have hyperglycemia, nonfasting hyperglucagonemia, and decreased hepatic glycogen
deposition. Endocrinology, 2007. 148(8): p. 3887-99.
21. de Heer, J., et al., Glucagon-like peptide-1, but not glucose-dependent insulinotropic
peptide, inhibits glucagon secretion via somatostatin (receptor subtype 2) in the perfused
rat pancreas. Diabetologia, 2008. 51(12): p. 2263-70.
22. Chia, C.W., et al., Exogenous glucose-dependent insulinotropic polypeptide worsens post
prandial hyperglycemia in type 2 diabetes. Diabetes, 2009. 58(6): p. 1342-9.
23. Allister, E.M., et al., UCP2 regulates the glucagon response to fasting and starvation.
Diabetes, 2013. 62(5): p. 1623-33.
24. Hupe-Sodmann, K., et al., Characterisation of the processing by human neutral
endopeptidase 24.11 of GLP-1(7-36) amide and comparison of the substrate specificity of
the enzyme for other glucagon-like peptides. Regul Pept, 1995. 58: p. 149-156.
25. Trebbien, R., et al., Neutral endopeptidase 24.11 is important for the degradation of both
endogenous and exogenous glucagon in anesthetized pigs. Am J Physiol Endocrinol
Metab, 2004. 287(3): p. E431-8.
26. Holst, O. and H. Brade, Structural studies of the core region of the lipopolysaccharide
from Salmonella minnesota strain R7 (rough mutant chemotype Rd1). Carbohydr Res,
1991. 219: p. 247-51.
27. Carone, F.A., D.R. Peterson, and G. Flouret, Renal tubular processing of small peptide
hormones. J Lab Clin Med, 1982. 100(1): p. 1-14.
28. Bastl, C., et al., Renal extraction of glucagon in rats with normal and reduced renal
function. Am J Physiol, 1977. 233(1): p. F67-71.
129
29. Pospisilik, J.A., et al., Metabolism of glucagon by dipeptidyl peptidase IV (CD26). Regul
Pept, 2001. 96(3): p. 133-41.
30. Blache, P., et al., Glucagon (19-29), a Ca2+ inhibitory peptide is processed from
glucagon in the rat liver plasma membrane by a thioendoprotease. J.Biol.Chem., 1990.
265: p. 21514-21519.
31. Dalle, S., et al., Miniglucagon (Glucagon 19-29), a Potent and Efficient Inhibitor of
Secretagogue-induced Insulin Release through a Ca2+ Pathway. J Biol Chem, 1999.
274(16): p. 10869-10876.
32. Blache, P., et al., Endopeptidase from rat liver membranes, which generates
miniglucagon from glucagon. J.Biol.Chem., 1993. 268: p. 21748-21753.
33. Jelinek, L.J., et al., Expression cloning and signaling properties of the rat glucagon
receptor. Science, 1993. 259(5101): p. 1614-6.
34. Jiang, G. and B.B. Zhang, Glucagon and regulation of glucose metabolism. Am J Physiol
Endocrinol Metab, 2003. 284(4): p. E671-8.
35. Liu, Y., et al., A fasting inducible switch modulates gluconeogenesis via
activator/coactivator exchange. Nature, 2008.
36. Gustavson, S.M., et al., Effects of hyperglycemia, glucagon, and epinephrine on renal
glucose release in the conscious dog. Metabolism, 2004. 53(7): p. 933-41.
37. Mulvehill, J.B., et al., Glucagon-sensitive adenylate cyclase in human renal medulla. J
Clin Endocrinol Metab, 1976. 42(2): p. 380-4.
38. Yano, Y., et al., Aquaporin 2 Expression Increased by Glucagon in Normal Rat Inner
Medullary Collecting Ducts. Am J Physiol Renal Physiol, 2008.
39. Bankir, L., et al., Extracellular cAMP inhibits proximal reabsorption: are plasma
membrane cAMP receptors involved? Am J Physiol Renal Physiol, 2002. 282(3): p.
F376-92.
40. Li, X.C., T.D. Liao, and J.L. Zhuo, Long-term hyperglucagonaemia induces early
metabolic and renal phenotypes of Type 2 diabetes in mice. Clin Sci (Lond), 2008.
114(9): p. 591-601.
41. Patel, G.K., et al., Glucagon effects on the human small intestine. Dig Dis Sci, 1979.
24(7): p. 501-8.
42. Taylor, I., et al., Glucagon and the colon. Gut, 1975. 16(12): p. 973-8.
43. Jonderko, G., K. Jonderko, and T. Golab, Effect of glucagon on gastric emptying and on
postprandial gastrin and insulin release in man. Mater Med Pol, 1989. 21(2): p. 92-6.
130
44. Kieffer, T.J., et al., Distribution of glucagon receptors on hormone-specific endocrine
cells of rat pancreatic islets. Endocrinology, 1996. 137: p. 5119-5125.
45. Moens, K., et al., Expression and functional activity of glucagon, glucagon-like peptide 1
and glucose-dependent insulinotropic peptide receptors in rat pancreatic islet cells.
Diabetes, 1996. 45: p. 257-261.
46. Moens, K., et al., Dual glucagon recognition by pancreatic beta-cells via glucagon and
glucagon-like peptide 1 receptors. Diabetes, 1998. 47(1): p. 66-72.
47. Gelling, R.W., et al., Pancreatic beta-cell overexpression of the glucagon receptor gene
results in enhanced beta-cell function and mass. Am J Physiol Endocrinol Metab, 2009.
297(3): p. E695-707.
48. Ma, X., et al., Glucagon stimulates exocytosis in mouse and rat pancreatic alpha-cells by
binding to glucagon receptors. Mol Endocrinol, 2005. 19(1): p. 198-212.
49. Longuet, C., et al., Liver-Specific Disruption of the Murine Glucagon Receptor Produces
alpha-Cell Hyperplasia: Evidence for a Circulating alpha-Cell Growth Factor. Diabetes,
2013. 62(4): p. 1196-1205.
50. Drucker, D.J. and S. Asa, Glucagon gene expression in vertebrate brain. J Biol Chem,
1988. 263: p. 13475-13478.
51. Jin, S.-L.C., et al., Distribution of glucagonlike peptide 1 (GLP-1), glucagon, and
glicentin in the rat brain: An immunocytochemical study. J Comp Neurol, 1988. 271: p.
519-532.
52. Cockram, C.S., et al., Binding and action of glucagon in cultured mouse astrocytes. Glia,
1995. 13(2): p. 141-6.
53. Hoosein, N.M. and R.S. Gurd, Identification of glucagon receptors in rat brain. Proc Natl
Acad Sci U S A, 1984. 81(14): p. 4368-72.
54. Amir, S., Central glucagon-induced hyperglycemia is mediated by combined activation
of the adrenal medulla and sympathetic nerve endings. Physiol Behav 1986. 37: p. 563-
566.
55. Marubashi, S., et al., Hyperglycemic effect of glucagon administered
intracerebroventricularly in the rat. Acta Endocinologica, 1985. 108: p. 6-10.
56. Inokuchi, A., Y. Oomura, and H. Nishimura, Effect of intracerebroventricularly infused
glucagon on feeding behavior. Physiol Behav, 1984. 33(3): p. 397-400.
57. Weatherford, S.C. and S. Ritter, Lesion of vagal afferent terminals impairs glucagon-
induced suppression of food intake. Physiol Behav, 1988. 43(5): p. 645-50.
131
58. Geary, N., J. Le Sauter, and U. Noh, Glucagon acts in the liver to control spontaneous
meal size in rats. Am J Physiol, 1993. 264(1 Pt 2): p. R116-22.
59. Arafat, A.M., et al., Glucagon suppression of ghrelin secretion is exerted at
hypothalamus-pituitary level. J Clin Endocrinol Metab, 2006. 91(9): p. 3528-33.
60. Mighiu, P.I., et al., Hypothalamic glucagon signaling inhibits hepatic glucose
production. Nat Med, 2013.
61. De Jong, D.A., A.I. Maas, and E. v d Voort, Non-invasive intracranial pressure
monitoring. A technique for reproducible fontanelle pressure measurements. Z
Kinderchir, 1984. 39(4): p. 274-6.
62. Langhans, W., et al., Hepatic handling of pancreatic glucagon and glucose during meals
in rats. Am J Physiol, 1984. 247(5 Pt 2): p. R827-32.
63. Unger, R.H. and L. Orci, Physiology and pathophysiology of glucagon. Physiol Rev,
1976. 56(4): p. 778-826.
64. Langhans, W., et al., Stimulation of feeding in rats by intraperitoneal injection of
antibodies to glucagon. Science, 1982. 218(4575): p. 894-6.
65. Schulman, J.L., et al., Effect of glucagon on food intake and body weight in man. J Appl
Physiol, 1957. 11(3): p. 419-21.
66. Penick SB, H.L.J., Depression of food intake induced in healthy subjects by glucagon. N
Eng J Med, 1961. 264: p. 893-897.
67. Salter, J.M., et al., Metabolic effects of glucagon in human subjects. Metabolism, 1960. 9:
p. 753-68.
68. Holloway, S.A. and J.A. Stevenson, Effect of Glucagon on Food Intake and Weight Gain
in the Young Rat. Can J Physiol Pharmacol, 1964. 42: p. 867-9.
69. Geary, N. and G.P. Smith, Pancreatic glucagon and postprandial satiety in the rat.
Physiol Behav, 1982. 28(2): p. 313-22.
70. Martin, J.R., D. Novin, and D.A. Vanderweele, Loss of glucagon suppression of feeding
after vagotomy in rats. Am J Physiol, 1978. 234(3): p. E314-18.
71. Geary, N. and G.P. Smith, Selective hepatic vagotomy blocks pancreatic glucagon's
satiety effect. Physiol Behav, 1983. 31(3): p. 391-4.
72. J. H. Penaloza-Rojas, M.R., Anorexia produced by Direct-current Blockade of the Vagus
Nerve. Nature, 1963. 200(4902): p. 176-176.
73. Conlon, J.M., et al., Glucagon-like polypeptides in canine brain. Diabetes, 1979. 28: p.
700-702.
132
74. Loren, I., et al., Gut-type glucagon immunoreactivity in nerves of the rat brain.
Histochem., 1979. 61: p. 335-341.
75. Krimphove, M. and K. Opitz, [The calorigenic effect of glucagon]. Arch Int
Pharmacodyn Ther, 1975. 216(2): p. 328-50.
76. Davidson I. W. F., S.J.M., Best C. H., The Effect of Glucagon on the Metabolic Rate of
Rats. Am J Clin Nutr, 1960. 8(5): p. 540-546.
77. Calles-Escandon, J., Insulin dissociates hepatic glucose cycling and glucagon-induced
thermogenesis in man. Metabolism, 1994. 43(8): p. 1000-5.
78. Doi, K., T. Ohno, and A. Kuroshima, Role of endocrine pancreas in temperature
acclimation. Life Sci, 1982. 30(26): p. 2253-9.
79. Yahata, T., Y. Habara, and A. Kuroshima, Effects of glucagon and noradrenaline on the
blood flow through brown adipose tissue in temperature-acclimated rats. Jpn J Physiol,
1983. 33(3): p. 367-76.
80. Billington, C.J., et al., Glucagon stimulation of brown adipose tissue growth and
thermogenesis. Am J Physiol, 1987. 252(1 Pt 2): p. R160-5.
81. Billington, C.J., et al., Effects of intracerebroventricular injection of neuropeptide Y on
energy metabolism. Am J Physiol, 1991. 260(2 Pt 2): p. R321-7.
82. Heim, T. and D. Hull, The effect of propranalol on the calorigenic response in brown
adipose tissue of new-born rabbits to catecholamines, glucagon, corticotrophin and cold
exposure. J Physiol, 1966. 187(2): p. 271-83.
83. Hagen, J.H., Effect of glucagon on the metabolism of adipose tissue. J Biol Chem, 1961.
236: p. 1023-7.
84. Richter, W.O., H. Robl, and P. Schwandt, Human glucagon and vasoactive intestinal
polypeptide (VIP) stimulate free fatty acid release from human adipose tissue in vitro.
Peptides, 1989. 10(2): p. 333-5.
85. Vaughan, M., Effect of hormones on glucose metabolism in adipose tissue. J Biol Chem,
1961. 236: p. 2196-9.
86. Lefebvre, P., A. Luyckx, and Z.M. Bacq, Effects of denervation on the metabolism and
the response to glucagon of white adipose tissue of rats. Horm Metab Res, 1973. 5(4): p.
245-50.
87. Habegger, K.M., et al., Fibroblast Growth Factor 21 Mediates Specific Glucagon
Actions. Diabetes, 2013. 62(5): p. 1453-63.
133
88. J.M. de Castro, S.K.P., W. Delugas, Insulin and glucagon as determinants of body weight
set point and microregulation in rats. Journal of Comparative and Physiological
Psychology, 1978. 15: p. 19-40.
89. Chan, E.K., et al., Suppression of weight gain by glucagon in obese Zucker rats. Exp Mol
Pathol, 1984. 40(3): p. 320-7.
90. Paloyan, E. and P.V. Harper, Jr., Glucagon as a regulating factor of plasma lipids.
Metabolism, 1961. 10: p. 315-23.
91. Amatuzio, D.S., F. Grande, and S. Wada, Effect of glucagon on the serum lipids in
essential hyperlipemia and in hypercholesterolemia. Metabolism, 1962. 11: p. 1240-9.
92. De Oya M, P.W., Swenson DE, Grande F, Role of glucagon on fatty liver production in
birds. Am J Physiol Endocrinol Metab, 1971. 221(1): p. 25-30.
93. Eaton, R.P., Hypolipemic action of glucagon in experimental endogenous lipemia in the
rat. J Lipid Res, 1973. 14(3): p. 312-8.
94. Guettet, C., et al., Effects of chronic glucagon administration on cholesterol and bile acid
metabolism. Biochim Biophys Acta, 1988. 963(2): p. 215-23.
95. Thomas, C., et al., TGR5-mediated bile acid sensing controls glucose homeostasis. Cell
Metab, 2009. 10(3): p. 167-77.
96. Rudling, M. and B. Angelin, Stimulation of rat hepatic low density lipoprotein receptors
by glucagon. Evidence of a novel regulatory mechanism in vivo. J Clin Invest, 1993.
91(6): p. 2796-805.
97. Guettet, C., et al., Effect of chronic glucagon administration on the metabolism of
triacylglycerol-rich lipoproteins in rats fed a high sucrose diet. J Nutr, 1991. 121(1): p.
24-30.
98. Perea, A., et al., Physiological effect of glucagon in human isolated adipocytes. Horm
Metab Res, 1995. 27(8): p. 372-5.
99. Arafat, A.M., et al., Glucagon increases circulating fibroblast growth factor 21
independently of endogenous insulin levels: a novel mechanism of glucagon-stimulated
lipolysis? Diabetologia, 2013. 56(3): p. 588-97.
100. Nair, K.S., et al., Effect of beta-hydroxybutyrate on whole-body leucine kinetics and
fractional mixed skeletal muscle protein synthesis in humans. J Clin Invest, 1988. 82(1):
p. 198-205.
101. Gerich, J.E., et al., Abnormal pancreatic glucagon secretion and postprandial
hyperglycemia in diabetes mellitus. Jama, 1975. 234(2): p. 159-5.
134
102. Pegorier, J.P., et al., Induction of ketogenesis and fatty acid oxidation by glucagon and
cyclic AMP in cultured hepatocytes from rabbit fetuses. Evidence for a decreased
sensitivity of carnitine palmitoyltransferase I to malonyl-CoA inhibition after glucagon or
cyclic AMP treatment. Biochem J, 1989. 264(1): p. 93-100.
103. Charbonneau, A., et al., Evidence of hepatic glucagon resistance associated with hepatic
steatosis: reversal effect of training. Int J Sports Med, 2005. 26(6): p. 432-41.
104. Charbonneau, A., J.M. Lavoie, and C.G. Unson, High-Fat Diet-Induced Hepatic
Steatosis Reduces Glucagon Receptor Content in Rat Hepatocytes: potential interaction
with acute exercise. J Physiol, 2007. 579: p. 255-67.
105. Charbonneau, A., et al., Alterations in hepatic glucagon receptor density and in Gsalpha
and Gialpha2 protein content with diet-induced hepatic steatosis: effects of acute
exercise. Am J Physiol Endocrinol Metab, 2005. 289(1): p. E8-14.
106. Savage, A., L. Zeng, and M.D. Houslay, A role for protein kinase C-mediated
phosphorylation in eliciting glucagon desensitization in rat hepatocytes. Biochem.J.,
1995. 307: p. 281-285.
107. Christine Longuet, E.M.S., Adriano Maida, Laurie L. Baggio, Marlena Maziarz, Maureen
J. Charron, Daniel J. Drucker, The Glucagon Receptor Is Required for the Adaptive
Metabolic Response to Fasting. . Cell Metabolism, 2009. 8(5): p. 359-371.
108. Hylemon, P.B., et al., Hormonal regulation of cholesterol 7 alpha-hydroxylase mRNA
levels and transcriptional activity in primary rat hepatocyte cultures. J Biol Chem, 1992.
267(24): p. 16866-71.
109. Song, K.H. and J.Y. Chiang, Glucagon and cAMP inhibit cholesterol 7alpha-hydroxylase
(CYP7A1) gene expression in human hepatocytes: discordant regulation of bile acid
synthesis and gluconeogenesis. Hepatology, 2006. 43(1): p. 117-25.
110. Muller, W.A., G.R. Faloona, and R.H. Unger, Hyperglucagonemia in diabetic
ketoacidosis. Its prevalence and significance. Am J Med, 1973. 54(1): p. 52-7.
111. Lee, J., et al., Effect of ghrelin receptor antagonist on meal patterns in cholecystokinin
type 1 receptor null mice. Physiol Behav, 2011. 103(2): p. 181-7.
112. Baron, A.D., et al., Role of hyperglucagonemia in maintenance of increased rates of
hepatic glucose output in type II diabetics. Diabetes, 1987. 36(3): p. 274-83.
113. Basu, A., et al., Effects of type 2 diabetes on the regulation of hepatic glucose
metabolism. J Investig Med, 2004. 52(6): p. 366-74.
114. Gastaldelli, A., et al., Influence of obesity and type 2 diabetes on gluconeogenesis and
glucose output in humans: a quantitative study. Diabetes, 2000. 49(8): p. 1367-73.
135
115. Lins, P.E., et al., Minimal increases in glucagon levels enhance glucose production in
man with partial hypoinsulinemia. Diabetes, 1983. 32(7): p. 633-6.
116. Henkel, E., et al., Impact of glucagon response on postprandial hyperglycemia in men
with impaired glucose tolerance and type 2 diabetes mellitus. Metabolism, 2005. 54(9):
p. 1168-73.
117. Shah, P., et al., Lack of suppression of glucagon contributes to postprandial
hyperglycemia in subjects with type 2 diabetes mellitus. J Clin Endocrinol Metab, 2000.
85(11): p. 4053-9.
118. Brand, C.L., et al., Immunoneutralization of endogenous glucagon with monoclonal
glucagon antibody normalizes hyperglycaemia in moderately streptozotocin-diabetic
rats. Diabetologia, 1994. 37: p. 985-993.
119. Brand, C.L., et al., Evidence for a major role for glucagon in regulation of plasma
glucose in conscious, nondiabetic, and alloxan-induced diabetic rabbits. Diabetes, 1996.
45(8): p. 1076-83.
120. Sorensen, H., et al., Immunoneutralization of endogenous glucagon reduces hepatic
glucose output and improves long-term glycemic control in diabetic ob/ob mice.
Diabetes, 2006. 55(10): p. 2843-8.
121. Dallas-Yang, Q., et al., Hepatic glucagon receptor binding and glucose-lowering in vivo
by peptidyl and non-peptidyl glucagon receptor antagonists. Eur J Pharmacol, 2004.
501(1-3): p. 225-34.
122. Johnson, D.G., et al., Hyperglycemia of diabetic rats decreased by a glucagon receptor
antagonist. Science, 1982. 215(4536): p. 1115-6.
123. Unson, C.G., E.M. Gurzenda, and R.B. Merrifield, Biological activities of des-
His1[Glu9]glucagon amide, a glucagon antagonist. Peptides, 1989. 10(6): p. 1171-7.
124. Kim, R.M., et al., Discovery of potent, orally active benzimidazole glucagon receptor
antagonists. Bioorg Med Chem Lett, 2008. 18(13): p. 3701-5.
125. Lau, J., et al., New beta-alanine derivatives are orally available glucagon receptor
antagonists. J Med Chem, 2007. 50(1): p. 113-28.
126. Liang, R., et al., Design and synthesis of conformationally constrained tri-substituted
ureas as potent antagonists of the human glucagon receptor. Bioorg Med Chem Lett,
2007. 17(3): p. 587-92.
127. Madsen, P., et al., Optimization of alkylidene hydrazide based human glucagon receptor
antagonists. Discovery of the highly potent and orally available 3-cyano-4-
hydroxybenzoic acid [1-(2,3,5,6-tetramethylbenzyl)-1H-indol-4-ylmethylene]hydrazide. J
Med Chem, 2002. 45(26): p. 5755-75.
136
128. Petersen, K.F. and J.T. Sullivan, Effects of a novel glucagon receptor antagonist (Bay 27-
9955) on glucagon-stimulated glucose production in humans. Diabetologia, 2001. 44(11):
p. 2018-24.
129. Liang, Y., et al., Reduction in Glucagon Receptor Expression by an Antisense
Oligonucleotide Ameliorates Diabetic Syndrome in db/db Mice. Diabetes, 2004. 53(2): p.
410-417.
130. Sloop, K.W., et al., Hepatic and glucagon-like peptide-1-mediated reversal of diabetes by
glucagon receptor antisense oligonucleotide inhibitors. J Clin Invest, 2004. 113(11): p.
1571-81.
131. Gelling, R.W., et al., Lower blood glucose, hyperglucagonemia, and pancreatic {alpha}
cell hyperplasia in glucagon receptor knockout mice. Proc Natl Acad Sci U S A, 2003.
100: p. 1438-43.
132. Parker, K.L., et al., Steroidogenic factor 1: an essential mediator of endocrine
development. Recent Prog Horm Res, 2002. 57: p. 19-36.
133. Vuguin, P.M., et al., Ablation of the glucagon receptor gene increases fetal lethality and
produces alterations in islet development and maturation. Endocrinology, 2006. 147(9):
p. 3995-4006.
134. Ouhilal, S., et al., Hypoglycemia, hyperglucagonemia, and fetoplacental defects in
glucagon receptor knockout mice: a role for glucagon action in pregnancy maintenance.
Am J Physiol Endocrinol Metab, 2012. 302(5): p. E522-31.
135. Conarello, S.L., et al., Glucagon receptor knockout mice are resistant to diet-induced
obesity and streptozotocin-mediated beta cell loss and hyperglycaemia. Diabetologia,
2007. 50(1): p. 142-50.
136. Umino, Y., et al., Hypoglycemia leads to age-related loss of vision. Proc Natl Acad Sci U
S A, 2006. 103(51): p. 19541-5.
137. Berglund, E.D., et al., Hepatic glucagon action is essential for exercise-induced reversal
of mouse fatty liver. Diabetes, 2011. 60(11): p. 2720-9.
138. Brown, H.D., S.K. Chattopadhyay, and W.S. Matthews, Glucagon stimulation of adenyl
cyclase activity of cardiac muscle. Naturwissenschaften, 1968. 55(4): p. 181-2.
139. Entman, M.L., The role of cyclic AMP in the modulation of cardiac contractility. Adv
Cyclic Nucleotide Res, 1974. 4(0): p. 163-93.
140. Epstein, S.E., G.S. Levey, and C.L. Skelton, Adenyl cyclase and cyclic AMP.
Biochemical links in the regulation of myocardial contractility. Circulation, 1971. 43(3):
p. 437-50.
141. Lucchesi, B.R., Cardiac actions of glucagon. Circ Res, 1968. 22(6): p. 777-87.
137
142. Puri, P.S. and R.J. Bing, Effects of glucagon on myocardial contractility and
hemodynamics in acute experimental myocardial infarction. Basis for its possible use in
cardiogenic shock. Am Heart J, 1969. 78(5): p. 660-8.
143. Glick, G., et al., Glucagon. Its enhancement of cardiac performance in the cat and dog
and persistence of its inotropic action despite beta-receptor blockade with propranolol.
Circ Res, 1968. 22(6): p. 789-99.
144. White, C.M., A review of potential cardiovascular uses of intravenous glucagon
administration. J Clin Pharmacol, 1999. 39(5): p. 442-7.
145. Winifred G. Nayler, I.M., Denise Chipperfield, Valerie Carson, and P. Daile, The effect of
glucagon on calcium exchangeability, coronary blood flow, myocardial function and high
energy phosphate stores. J Pharmacol Exp Ther 1970. 171: p. 265-275.
146. Juan-Fita, M.J., M.L. Vargas, and J. Hernandez, The phosphodiesterase 3 inhibitor
cilostamide enhances inotropic responses to glucagon but not to dobutamine in rat
ventricular myocardium. Eur J Pharmacol, 2005. 512(2-3): p. 207-13.
147. Rochais, F., et al., A specific pattern of phosphodiesterases controls the cAMP signals
generated by different Gs-coupled receptors in adult rat ventricular myocytes. Circ Res,
2006. 98(8): p. 1081-8.
148. Gonzalez-Munoz, C., et al., Glucagon increases contractility in ventricle but not in
atrium of the rat heart. Eur J Pharmacol, 2008. 587(1-3): p. 243-7.
149. Wildenthal, K., et al., Responsiveness to glucagon in fetal hearts. Species variability and
apparent disparities between changes in beating, adenylate cyclase activation, and cyclic
AMP concentration. J Clin Invest, 1976. 57(3): p. 551-8.
150. Wildenthal, K., Maturation of responsiveness to cardioactive drugs. Differential effects
of acetylcholine, norepinephrine, theophylline, tyramine, glucagon, and dibutyryl cyclic
AMP on atrial rate in hearts of fetal mice. J Clin Invest, 1973. 52(9): p. 2250-8.
151. Strauer, B.E., [Inotropic action of glucagon on the isolated human ventricular
myocardium]. Klin Wochenschr, 1971. 49(8): p. 468-72.
152. Prasad, K., Electrophysiologic effects of glucagon on human cardiac muscle. Clin
Pharmacol Ther, 1975. 18(1): p. 22-30.
153. Mukharji, A., et al., Oxyntomodulin increases intrinsic heart rate through the
glucagon receptor. Physiological Reports, 2013. in press.
154. Okamura, T., M. Miyazaki, and N. Toda, Responses of isolated dog blood vessels to
glucagon. Eur J Pharmacol, 1986. 125(3): p. 395-401.
138
155. Nils G. Kock, B.R., Paul Hahnloser, Sten Tibblin, Worthington G. Schenk Jr., The Effect
of Glucagon on Hepatic Blood FlowAn Experimental Study in the Dog. . Arch JAMA
Surg., 1970. 100(2): p. 147-149.
156. Katz, R.L., L. Hinds, and C.J. Mills, Ability of glucagon to produce cardiac stimulation
without arrhythmias in halothane-anaesthetized animals. Br J Anaesth, 1969. 41(7): p.
574-8.
157. Nayler, W.G., et al., The effect of glucagon on calcium exchangeability, coronary blood
flow, myocardial function and high energy phosphate stores. J Pharmacol Exp Ther,
1970. 171(2): p. 265-75.
158. Kumar, A.E., et al., Coronary flow and end-diastolic pressure during prolonged
cardiopulmonary bypass. J Thorac Cardiovasc Surg, 1971. 62(1): p. 12-5.
159. Li, X.C., T.D. Liao, and J.L. Zhuo, Long-term hyperglucagonemia induces early
metabolic and renal phenotypes of type 2 diabetes in mice. Clin Sci (Lond), 2007.
160. Kumano, K. and P.A. Khairallah, Adenylate cyclase activity during development and
reversal of cardiac hypertrophy. J Mol Cell Cardiol, 1985. 17(6): p. 537-48.
161. Strazzullo, P., et al., Altered renal sodium handling and hypertension in men carrying the
glucagon receptor gene (Gly40Ser) variant. J Mol Med, 2001. 79(10): p. 574-80.
162. Laniado, S., et al., Temporal relation of the first heart sound to closure of the mitral
valve. Circulation, 1973. 47(5): p. 1006-14.
163. Eddy, J.D., E.T. O'Brien, and S.P. Singh, Glucagon and haemodynamics of acute
myocardial infarction. Br Med J, 1969. 4(5684): p. 663-5.
164. Murtagh, J.G., et al., Haemodynamic effects of glucagon. Br Heart J, 1970. 32(3): p. 307-
15.
165. Madan, B.R., R.S. Gupta, and B.K. Jain, Pulmonary vascular and cardiac effects of
glucagon before and after adrenergic beta-receptor blockade. Indian J Physiol
Pharmacol, 1971. 15(4): p. 173-7.
166. Regan, T.J., et al., Ventricular arrhythmias and K+ transfer during myocardial ischemia
and intervention with procaine amide, insulin, or glucose solution. J Clin Invest, 1967.
46(10): p. 1657-68.
167. GW Goodwin, H.T., Metabolic recovery of isolated working rat heart after brief global
ischemia. American Journal of Physiology - Heart and Circulatory Physiology. American
physiol soc., 1994. 267: p. H462-H470.
168. Axelsen, L.N., et al., Glucagon and a glucagon-GLP-1 dual-agonist increases cardiac
performance with different metabolic effects in insulin-resistant hearts. Br J Pharmacol,
2012. 165(8): p. 2736-48.
139
169. Harney, J.A. and R.L. Rodgers, Insulin-like stimulation of cardiac fuel metabolism by
physiological levels of glucagon: involvement of PI3K but not cAMP. Am J Physiol
Endocrinol Metab, 2008. 295(1): p. E155-61.
170. Manchester, J.H., et al., Effects of glucagon on myocardial oxygen consumption and
coronary blood flow in man and in dog. Circulation, 1970. 41(4): p. 579-88.
171. Kumar, R., et al., Experimental myocardial infarction. X. Efficacy of glucagon in acute
and healing phase in intact conscious dogs: effects on hemodynamics and myocardial
oxygen consumption. Circulation, 1972. 45(1): p. 55-64.
172. Sauvadet, A., F. Pecker, and C. Pavoine, Inhibition of the sarcolemmal Ca2+ pump in
embryonic chick heart cells by mini-glucagon. Cell Calcium, 1995. 18(1): p. 76-85.
173. Sauvadet, A., et al., Synergistic actions of glucagon and miniglucagon on Ca2+
mobilization in cardiac cells. Circ Res, 1996. 78(1): p. 102-9.
174. Sauvadet, A., et al., Arachidonic acid drives mini-glucagon action in cardiac cells. J Biol
Chem, 1997. 272(19): p. 12437-45.
175. Marchetti, P., et al., A local glucagon-like peptide 1 (GLP-1) system in human pancreatic
islets. Diabetologia, 2012. 55(12): p. 3262-72.
176. Ellingsgaard, H., et al., Interleukin-6 enhances insulin secretion by increasing glucagon-
like peptide-1 secretion from L cells and alpha cells. Nat Med, 2011. 17(11): p. 1481-9.
177. Diakogiannaki, E., F.M. Gribble, and F. Reimann, Nutrient detection by incretin hormone
secreting cells. Physiol Behav, 2012. 106(3): p. 387-93.
178. Reimann, F., G. Tolhurst, and F.M. Gribble, G-protein-coupled receptors in intestinal
chemosensation. Cell metabolism, 2012. 15(4): p. 421-31.
179. Suzuki, K., et al., Transcriptional factor regulatory factor X 6 (Rfx6) increases gastric
inhibitory polypeptide (GIP) expression in enteroendocrine K-cells and is involved in
GIP hypersecretion in high-fat diet-induced obesity. The Journal of biological chemistry,
2013. 288(3): p. 1929-38.
180. Buhren, B.A., et al., Glucose-dependent insulinotropic polypeptide (GIP) and its receptor
(GIPR): cellular localization, lesion-affected expression, and impaired regenerative
axonal growth. J Neurosci Res, 2009. 87(8): p. 1858-70.
181. Fujita, Y., et al., Glucose-dependent insulinotropic polypeptide is expressed in pancreatic
islet alpha-cells and promotes insulin secretion. Gastroenterology, 2010. 138(5): p. 1966-
75.
182. Fukami, A., et al., Ectopic Expression of GIP in Pancreatic beta-Cells Maintains
Enhanced Insulin Secretion in Mice With Complete Absence of Proglucagon-Derived
Peptides. Diabetes, 2013. 62(2): p. 510-8.
140
183. Parker, H.E., et al., Nutrient-dependent secretion of glucose-dependent insulinotropic
polypeptide from primary murine K cells. Diabetologia, 2009. 52(2): p. 289-98.
184. Baggio, L.L. and D.J. Drucker, Biology of incretins: GLP-1 and GIP. Gastroenterology,
2007. 132(6): p. 2131-57.
185. Drucker, D.J. and M.A. Nauck, The incretin system: glucagon-like peptide-1 receptor
agonists and dipeptidyl peptidase-4 inhibitors in type 2 diabetes. Lancet, 2006.
368(9548): p. 1696-705.
186. Garber, A.J., Incretin effects on beta-cell function, replication, and mass: the human
perspective. Diabetes Care, 2011. 34 Suppl 2: p. S258-63.
187. Quoyer, J., et al., GLP-1 mediates antiapoptotic effect by phosphorylating Bad through a
beta-arrestin 1-mediated ERK1/2 activation in pancreatic beta-cells. J Biol Chem, 2010.
285(3): p. 1989-2002.
188. Liu, Z. and J.F. Habener, Glucagon-like peptide-1 activation of TCF7L2-dependent Wnt
signaling enhances pancreatic beta cell proliferation. J Biol Chem, 2008. 283(13): p.
8723-35.
189. da Silva Xavier, G., et al., Abnormal glucose tolerance and insulin secretion in pancreas-
specific Tcf7l2-null mice. Diabetologia, 2012. 55(10): p. 2667-76.
190. Cornu, M., et al., Glucagon-like peptide-1 increases beta-cell glucose competence and
proliferation by translational induction of insulin-like growth factor-1 receptor
expression. J Biol Chem, 2010. 285(14): p. 10538-45.
191. Cornu, M., et al., Glucagon-like peptide-1 protects beta-cells against apoptosis by
increasing the activity of an IGF-2/IGF-1 receptor autocrine loop. Diabetes, 2009. 58(8):
p. 1816-25.
192. Miyawaki, K., et al., Glucose intolerance caused by a defect in the entero-insular axis: A
study in gastric inhibitory polypeptide receptor knockout mice. Proc Natl Acad Sci U S
A, 1999. 96(26): p. 14843-7.
193. Trumper, A., K. Trumper, and D. Horsch, Mechanisms of mitogenic and anti-apoptotic
signaling by glucose-dependent insulinotropic polypeptide in beta(INS-1)-cells. J
Endocrinol, 2002. 174(2): p. 233-46.
194. Trumper, A., et al., Glucose-Dependent Insulinotropic Polypeptide Is a Growth Factor
for beta (INS-1) Cells by Pleiotropic Signaling. Mol Endocrinol, 2001. 15(9): p. 1559-70.
195. Ehses, J.A., et al., Glucose-dependent insulinotropic polypeptide promotes beta-(INS-1)
cell survival via cyclic adenosine monophosphate-mediated caspase-3 inhibition and
regulation of p38 mitogen-activated protein kinase. Endocrinology, 2003. 144(10): p.
4433-45.
141
196. Kim, S.J., et al., GIP stimulation of pancreatic beta-cell survival is dependent upon
phosphatidylinositol 3-kinase (PI3-K)/ protein kinase B (PKB) signaling, inactivation of
the forkhead transcription factor Foxo1 and downregulation of bax expression. J Biol
Chem, 2005. 280(23): p. 22297-22307.
197. Widenmaier, S.B., et al., A GIP receptor agonist exhibits beta-cell anti-apoptotic actions
in rat models of diabetes resulting in improved beta-cell function and glycemic control.
PLoS One, 2010. 5(3): p. e9590.
198. Maida, A., et al., Differential Importance of GIP Versus GLP-1 Receptor Signaling for
Beta Cell Survival in Mice. Gastroenterology, 2009. 137(6): p. 2146-57.
199. Widenmaier, S.B., et al., Noncanonical activation of Akt/protein kinase B in {beta}-cells
by the incretin hormone glucose-dependent insulinotropic polypeptide. J Biol Chem,
2009. 284(16): p. 10764-73.
200. Gupta, N.A., et al., Glucagon-like peptide-1 receptor is present on human hepatocytes
and has a direct role in decreasing hepatic steatosis in vitro by modulating elements of
the insulin signaling pathway. Hepatology, 2010. 51(5): p. 1584-92.
201. Hojberg, P.V., et al., Four weeks of near-normalisation of blood glucose improves the
insulin response to glucagon-like peptide-1 and glucose-dependent insulinotropic
polypeptide in patients with type 2 diabetes. Diabetologia, 2009. 52(2): p. 199-207.
202. Wice, B.M., et al., Xenin-25 amplifies GIP-mediated insulin secretion in humans with
normal and impaired glucose tolerance but not type 2 diabetes. Diabetes, 2012. 61(7): p.
1793-800.
203. Campbell, J.E. and D.D. J., Pharmacology physiology and mechanisms of incretin
hormone action. Cell Metabolism, 2013. 17(4): p. 819-37.
204. Vendrell, J., et al., Study of the potential association of adipose tissue GLP-1 receptor
with obesity and insulin resistance. Endocrinology, 2011. 152(11): p. 4072-9.
205. Bertin, E., et al., Action of glucagon and glucagon-like peptide-1-(7-36) amide on
lipolysis in human subcutaneous adipose tissue and skeletal muscle in vivo. J Clin
Endocrinol Metab, 2001. 86(3): p. 1229-34.
206. Nogueiras, R., et al., Direct control of peripheral lipid deposition by CNS GLP-1
receptor signaling is mediated by the sympathetic nervous system and blunted in diet-
induced obesity. J Neurosci, 2009. 29(18): p. 5916-25.
207. Lockie, S.H., et al., Direct control of brown adipose tissue thermogenesis by central
nervous system glucagon-like Peptide-1 receptor signaling. Diabetes, 2012. 61(11): p.
2753-62.
208. Lamont, B.J. and D.J. Drucker, Differential anti-diabetic efficacy of incretin agonists vs.
DPP-4 inhibition in high fat fed mice. Diabetes, 2008. 57(1): p. 190-98.
142
209. Miyawaki, K., et al., Inhibition of gastric inhibitory polypeptide signaling prevents
obesity. Nat Med, 2002. 8(7): p. 738-42.
210. Ahlqvist, E., et al., A link between GIP and osteopontin in adipose tissue and insulin
resistance. Diabetes, 2013. 62(6): p. 2088-94.
211. Althage, M.C., et al., Targeted ablation of glucose-dependent insulinotropic polypeptide-
producing cells in transgenic mice reduces obesity and insulin resistance induced by a
high fat diet. J Biol Chem, 2008. 283(26): p. 18365-76.
212. Wice, B.M., et al., Xenin-25 potentiates glucose-dependent insulinotropic polypeptide
action via a novel cholinergic relay mechanism. J Biol Chem, 2010. 285(26): p. 19842-
53.
213. Ugleholdt, R., et al., Transgenic rescue of adipocyte glucose-dependent insulinotropic
polypeptide receptor expression restores high fat diet-induced body weight gain. The
Journal of biological chemistry, 2011. 286(52): p. 44632-45.
214. Asmar, M. and J.J. Holst, Glucagon-like peptide 1 and glucose-dependent insulinotropic
polypeptide: new advances. Current opinion in endocrinology, diabetes, and obesity,
2010. 17(1): p. 57-62.
215. Gogebakan, O., et al., Glucose-dependent insulinotropic polypeptide reduces fat-specific
expression and activity of 11beta-hydroxysteroid dehydrogenase type 1 and inhibits
release of free fatty acids. Diabetes, 2012. 61(2): p. 292-300.
216. Lyssenko, V., et al., Pleiotropic Effects of GIP on Islet Function Involves Osteopontin.
Diabetes, 2011. 60(9): p. 2424-33.
217. Ding, X., et al., Exendin-4, a glucagon-like protein-1 (GLP-1) receptor agonist, reverses
hepatic steatosis in ob/ob mice. Hepatology, 2006. 43(1): p. 173-81.
218. Mells, J.E. and F.A. Anania, The role of gastrointestinal hormones in hepatic lipid
metabolism. Semin Liver Dis, 2013. 33(4): p. 343-57.
219. Ayala, J.E., et al., The glucagon-like peptide-1 receptor regulates endogenous glucose
production and muscle glucose uptake independent of its incretin action. Endocrinology,
2009. 150(3): p. 1155-64.
220. Panjwani, N., et al., GLP-1 Receptor Activation Indirectly Reduces Hepatic Lipid
Accumulation But Does Not Attenuate Development of Atherosclerosis in Diabetic Male
ApoE-/- Mice. Endocrinology, 2013. 154(1): p. 127-39.
221. Flock, G., et al., Incretin receptors for glucagon-like peptide 1 and glucose-dependent
insulinotropic polypeptide are essential for the sustained metabolic actions of vildagliptin
in mice. Diabetes, 2007. 56(12): p. 3006-13.
143
222. Svegliati-Baroni, G., et al., Glucagon-like peptide-1 receptor activation stimulates
hepatic lipid oxidation and restores hepatic signalling alteration induced by a high-fat
diet in nonalcoholic steatohepatitis. Liver international : official journal of the
International Association for the Study of the Liver, 2011. 31(9): p. 1285-97.
223. Korner, M., et al., GLP-1 receptor expression in human tumors and human normal
tissues: potential for in vivo targeting. J Nucl Med, 2007. 48(5): p. 736-43.
224. Burmeister, M.A., et al., Acute activation of central GLP-1 receptors enhances hepatic
insulin action and insulin secretion in high-fat-fed, insulin resistant mice. Am J Physiol
Endocrinol Metab, 2012. 302(3): p. E334-43.
225. Sandoval, D.A., et al., Arcuate glucagon-like peptide 1 receptors regulate glucose
homeostasis but not food intake. Diabetes, 2008. 57(8): p. 2046-54.
226. Wishart, J.M., et al., Relation between gastric emptying of glucose and plasma
concentrations of glucagon-like peptide-1. Peptides, 1998. 19(6): p. 1049-53.
227. Nauck, M.A., et al., Glucagon-like peptide 1 inhibition of gastric emptying outweighs its
insulinotropic effects in healthy humans. Am J Physiol, 1997. 273(5 Pt 1): p. E981-8.
228. Little, T.J., et al., Effects of intravenous glucagon-like peptide-1 on gastric emptying and
intragastric distribution in healthy subjects: relationships with postprandial glycemic
and insulinemic responses. J Clin Endocrinol Metab, 2006. 91(5): p. 1916-23.
229. Hansen, A.B., et al., Effect of truncated glucagon-like peptide 1 on cAMP in rat gastric
glands and HGT-1 human gastric cancer cells. FEBS Lett, 1988. 236(1): p. 119-22.
230. Enc, F.Y., et al., Inhibition of gastric emptying by acarbose is correlated with GLP-1
response and accompanied by CCK release. Am J Physiol Gastrointest Liver Physiol,
2001. 281(3): p. G752-63.
231. Vila Petroff, M.G., et al., Glucagon-like peptide-1 increases cAMP but fails to augment
contraction in adult rat cardiac myocytes. Circ Res, 2001. 89(5): p. 445-52.
232. Zhao, T., et al., Direct effects of glucagon-like peptide-1 on myocardial contractility and
glucose uptake in normal and postischemic isolated rat hearts. J Pharmacol Exp Ther,
2006. 317(3): p. 1106-13.
233. Ban, K., et al., Cardioprotective and vasodilatory actions of glucagon-like peptide 1
receptor are mediated through both glucagon-like peptide 1 receptor-dependent and -
independent pathways. Circulation, 2008. 117(18): p. 2340-50.
234. Nikolaidis, L.A., et al., Effects of glucagon-like peptide-1 in patients with acute
myocardial infarction and left ventricular dysfunction after successful reperfusion.
Circulation, 2004. 109(8): p. 962-5.
144
235. Kim, M., et al., GLP-1 receptor activation and Epac2 link atrial natriuretic peptide
secretion to control of blood pressure. Nature Medicine, 2013. 19(5): p. 567-75.
236. Pyke, C. and L.B. Knudsen, The Glucagon-Like Peptide-1 Receptor--or Not?
Endocrinology, 2013. 154(1): p. 4-8.
237. Baggio, L.L., et al., A recombinant human glucagon-like peptide (GLP)-1-albumin
protein (albugon) mimics peptidergic activation of GLP-1 receptor-dependent pathways
coupled with satiety, gastrointestinal motility, and glucose homeostasis. Diabetes, 2004.
53(9): p. 2492-500.
238. Noyan-Ashraf, M.H., et al., GLP-1R agonist liraglutide activates cytoprotective
pathways and improves outcomes after experimental myocardial infarction in mice.
Diabetes, 2009. 58(4): p. 975-83.
239. Xiao, Y.F., et al., Glucagon-like peptide-1 enhances cardiac L-type Ca2+ currents via
activation of the cAMP-dependent protein kinase A pathway. Cardiovascular diabetology,
2011. 10: p. 6.
240. Ravassa, S., et al., Antiapoptotic effects of GLP-1 in murine HL-1 cardiomyocytes.
American journal of physiology. Heart and circulatory physiology, 2011. 300(4): p.
H1361-72.
241. Wang, S.X., et al., [Effect of glucagon-like peptide-1 on hypoxia-reoxygenation induced
injury in neonatal rat cardiomyocytes]. Zhonghua xin xue guan bing za zhi, 2010. 38(1):
p. 72-5.
242. Nikolaidis, L.A., et al., Recombinant glucagon-like peptide-1 increases myocardial
glucose uptake and improves left ventricular performance in conscious dogs with pacing-
induced dilated cardiomyopathy. Circulation, 2004. 110(8): p. 955-61.
243. Gardiner, S.M., et al., Mesenteric vasoconstriction and hindquarters vasodilatation
accompany the pressor actions of exendin-4 in conscious rats. J Pharmacol Exp Ther,
2006. 316(2): p. 852-9.
244. Barragan, J.M., R.E. Rodriguez, and E. Blazquez, Changes in arterial blood pressure and
heart rate induced by glucagon-like peptide-1-(7-36 amide) in rats. Am J Physiol, 1994.
266: p. E459-E466.
245. Barragan, J.M., et al., Interactions of exendin-(9-39) with the effects of glucagon-like
peptide-1-(7-36) amide and of exendin-4 on arterial blood pressure and heart rate in
rats. Regulatory Peptides, 1996. 67: p. 63-68.
246. Barragan, J.M., et al., Neural contribution to the effect of glucagon-like peptide-1-(7-36)
amide on arterial blood pressure in rats. Am J Physiol, 1999. 277(5 Pt 1): p. E784-E791.
247. Isbil-Buyukcoskun, N. and G. Gulec, Effects of centrally injected GLP-1 in various
experimental models of gastric mucosal damage. Peptides, 2004. 25(7): p. 1179-83.
145
248. Hirata, K., et al., Exendin-4 has an anti-hypertensive effect in salt-sensitive mice model.
Biochem Biophys Res Commun, 2009. 380(1): p. 44-9.
249. Laugero, K.D., et al., Exenatide Improves Hypertension in a Rat Model of the Metabolic
Syndrome. Metab Syndr Relat Disord, 2009. 7(4): p. 327-34.
250. Erdogdu, O., et al., Exendin-4 stimulates proliferation of human coronary artery
endothelial cells through eNOS-, PKA- and PI3K/Akt-dependent pathways and requires
GLP-1 receptor. Mol Cell Endocrinol, 2010. 325(1-2): p. 26-35.
251. Bharucha, A.E., et al., Effects of glucagon-like peptide-1, yohimbine, and nitrergic
modulation on sympathetic and parasympathetic activity in humans. American journal of
physiology. Regulatory, integrative and comparative physiology, 2008. 295(3): p. R874-
80.
252. Edwards, C.M., et al., Subcutaneous glucagon-like peptide-1 (7-36) amide is
insulinotropic and can cause hypoglycaemia in fasted healthy subjects. Clin Sci (Lond),
1998. 95(6): p. 719-24.
253. Gill, A., et al., Effect of exenatide on heart rate and blood pressure in subjects with type 2
diabetes mellitus: a double-blind, placebo-controlled, randomized pilot study.
Cardiovascular diabetology, 2010. 9: p. 6.
254. Pratley, R.E., et al., Liraglutide versus sitagliptin for patients with type 2 diabetes who
did not have adequate glycaemic control with metformin: a 26-week, randomised,
parallel-group, open-label trial. Lancet, 2010. 375(9724): p. 1447-56.
255. Pratley, R., et al., One year of liraglutide treatment offers sustained and more effective
glycaemic control and weight reduction compared with sitagliptin, both in combination
with metformin, in patients with type 2 diabetes: a randomised, parallel-group, open-
label trial. International journal of clinical practice, 2011. 65(4): p. 397-407.
256. Yang, W., et al., Liraglutide provides similar glycaemic control as glimepiride (both in
combination with metformin) and reduces body weight and systolic blood pressure in
Asian population with type 2 diabetes from China, South Korea and India: a 16-week,
randomized, double-blind, active control trial(*). Diabetes Obes Metab, 2011. 13(1): p.
81-8.
257. Gallwitz, B., et al., Adding liraglutide to oral antidiabetic drug therapy: onset of
treatment effects over time. International journal of clinical practice, 2010. 64(2): p. 267-
76.
258. Bose, A.K., et al., Glucagon-like peptide-1 (GLP-1) can directly protect the heart against
ischemia/reperfusion injury. Diabetes, 2005. 54(1): p. 146-151.
259. Sonne, D.P., T. Engstrom, and M. Treiman, Protective effects of GLP-1 analogues
exendin-4 and GLP-1(9-36) amide against ischemia-reperfusion injury in rat heart.
Regul Pept, 2008. 146((1-3)): p. 243-249.
146
260. Timmers, L., et al., Exenatide reduces infarct size and improves cardiac function in a
porcine model of ischemia and reperfusion injury. J Am Coll Cardiol, 2009. 53(6): p.
501-10.
261. Kavianipour, M., et al., Glucagon-like peptide-1 (7-36) amide prevents the accumulation
of pyruvate and lactate in the ischemic and non-ischemic porcine myocardium. Peptides,
2003. 24(4): p. 569-78.
262. Kristensen, J., et al., Lack of cardioprotection from subcutaneously and preischemic
administered liraglutide in a closed chest porcine ischemia reperfusion model. BMC
cardiovascular disorders, 2009. 9: p. 31.
263. Bao, W., et al., Albiglutide, a long lasting glucagon-like peptide-1 analog, protects the
rat heart against ischemia/reperfusion injury: evidence for improving cardiac metabolic
efficiency. PLoS One, 2011. 6(8): p. e23570.
264. Read, P.A., F.Z. Khan, and D.P. Dutka, Cardioprotection against ischaemia induced by
dobutamine stress using glucagon-like peptide-1 in patients with coronary artery disease.
Heart, 2012. 98(5): p. 408-13.
265. Lonborg, J., et al., Exenatide reduces reperfusion injury in patients with ST-segment
elevation myocardial infarction. European heart journal, 2012.
266. Scrocchi, L.A., et al., Glucose intolerance but normal satiety in mice with a null mutation
in the glucagon-like peptide receptor gene. Nature Med, 1996. 2: p. 1254-1258.
267. Hansotia, T., et al., Extrapancreatic incretin receptors modulate glucose homeostasis,
body weight, and energy expenditure. J Clin Invest, 2007. 117(1): p. 143-152.
268. Irwin, N. and P.R. Flatt, Evidence for beneficial effects of compromised gastric inhibitory
polypeptide action in obesity-related diabetes and possible therapeutic implications.
Diabetologia, 2009. 52(9): p. 1724-31.
269. Kulkarni, R.N., GIP: no longer the neglected incretin twin? Sci Transl Med, 2010. 2(49):
p. 49ps47.
270. Saxena, R., et al., Genetic variation in GIPR influences the glucose and insulin responses
to an oral glucose challenge. Nat Genet, 2010. 42(2): p. 142-8.
271. Speliotes, E.K., et al., Association analyses of 249,796 individuals reveal 18 new loci
associated with body mass index. Nat Genet, 2010. 42(11): p. 937-48.
272. Hansotia, T., et al., Double incretin receptor knockout (DIRKO) mice reveal an essential
role for the enteroinsular axis in transducing the glucoregulatory actions of DPP-IV
inhibitors. Diabetes, 2004. 53(5): p. 1326-35.
147
273. Unger, R.H. and A.D. Cherrington, Glucagonocentric restructuring of diabetes: a
pathophysiologic and therapeutic makeover. The Journal of clinical investigation, 2012.
122(1): p. 4-12.
274. Parker, J.C., et al., Glycemic control in mice with targeted disruption of the glucagon
receptor gene. Biochem Biophys Res Commun, 2002. 290(2): p. 839-43.
275. Sorenson RL, R.E., Dissociation of Glucose Stimulation of Somatostatin and Insulin
Release from Glucose Inhibition of Glucagon Release in the Isolated Perfused Rat
Pancreas Diabetes Care, 1983. 32(6): p. 561-567.
276. Laakso, M., Hyperglycemia and cardiovascular disease in type 2 diabetes. Diabetes,
1999. 48(5): p. 937-42.
277. Grundy, S.M., et al., Assessment of cardiovascular risk by use of multiple-risk-factor
assessment equations: a statement for healthcare professionals from the American Heart
Association and the American College of Cardiology. Circulation, 1999. 100(13): p.
1481-92.
278. Hu, F.B., et al., Elevated risk of cardiovascular disease prior to clinical diagnosis of type
2 diabetes. Diabetes Care, 2002. 25(7): p. 1129-34.
279. Buchanan, J., et al., Reduced cardiac efficiency and altered substrate metabolism
precedes the onset of hyperglycemia and contractile dysfunction in two mouse models of
insulin resistance and obesity. Endocrinology, 2005. 146(12): p. 5341-9.
280. Sorensen, H., et al., Glucagon Receptor Knockout Mice Display Increased Insulin
Sensitivity and Impaired {beta}-Cell Function. Diabetes, 2006. 55(12): p. 3463-9.
281. Pocai, A., et al., Glucagon-like peptide 1/glucagon receptor dual agonism reverses
obesity in mice. Diabetes, 2009. 58(10): p. 2258-66.
282. Day, J.W., et al., A new glucagon and GLP-1 co-agonist eliminates obesity in rodents.
Nat Chem Biol, 2009. 5(10): p. 749-57.
283. White, S.A., et al., A comparison of cross sectional surface area densities between adult
and juvenile porcine islets of Langerhans. Horm Metab Res, 1999. 31(9): p. 519-24.
284. Rodgers, R.L., K.M. MacLeod, and J.H. McNeill, Responses of rat and guinea pig hearts
to glucagon. Lack of evidence for a dissociation between changes in myocardial cyclic
3'5'-adenosine monophosphate and contractility. Circ Res, 1981. 49(1): p. 216-25.
285. Murad, F. and M. Vaughan, Effect of glucagon on rat heart adenyl cyclase. Biochem
Pharmacol, 1969. 18(5): p. 1053-9.
286. Maroko, P.R., et al., Factors influencing infarct size following experimental coronary
artery occlusions. Circulation, 1971. 43(1): p. 67-82.
148
287. Cryer, P.E., Hypoglycaemia: the limiting factor in the glycaemic management of Type I
and Type II diabetes. Diabetologia, 2002. 45(7): p. 937-48.
288. Jaspan, J.B. and A.H. Rubinstein, Circulating glucagon: Plasma profiles and metabolism
in health and disease. Diabetes, 1977. 26: p. 887-902.
289. Unger, R.H., et al., Studies of pancreatic alpha cell function in normal and diabetic
subjects. J Clin Invest, 1970. 49(4): p. 837-48.
290. Sherwin, R.S., et al., Hyperglucagonemia and blood glucose regulation in normal, obese
and diabetic subjects. N Engl J Med, 1976. 294(9): p. 455-61.
291. Unger, R.H., Glucagon physiology and pathophysiology in the light of new advances.
Diabetologia, 1985. 28: p. 574-578.
292. Campos, R.V., Y.C. Lee, and D.J. Drucker, Divergent tissue-specific and developmental
expression of receptors for glucagon and glucagon-like peptide-1 in the mouse.
Endocrinology, 1994. 134: p. 2156-2164.
293. Marks, J., et al., Detection of glucagon receptor mRNA in the rat proximal tubule:
potential role for glucagon in the control of renal glucose transport. Clin Sci (Lond),
2003. 104(3): p. 253-8.
294. Dunphy, J.L., R.G. Taylor, and P.J. Fuller, Tissue distribution of rat glucagon receptor
and GLP-1 receptor gene expression. Mol Cell Endocrinol, 1998. 141(1-2): p. 179-86.
295. Hansen, L.H., N. Abrahamsen, and E. Nishimura, Glucagon receptor mRNA distribution
in rat tissues. Peptides, 1995. 16: p. 1163-1166.
296. Svoboda, M., et al., Relative quantitative analysis of glucagon receptor mRNA in rat
tissues. Mol Cell Endocrinol, 1994. 105(2): p. 131-7.
297. Shah, P., et al., Impact of lack of suppression of glucagon on glucose tolerance in
humans. Am J Physiol, 1999. 277(2 Pt 1): p. E283-90.
298. Consoli, A., Role of liver in pathophysiology of NIDDM. Diabetes Care, 1992. 15(3): p.
430-41.
299. Muller, W.A., et al., Abnormal alpha-cell function in diabetes. Response to carbohydrate
and protein ingestion. N Engl J Med, 1970. 283(3): p. 109-15.
300. Dinneen, S., et al., Failure of glucagon suppression contributes to postprandial
hyperglycaemia in IDDM. Diabetologia, 1995. 38(3): p. 337-43.
301. Unson, C.G., et al., Antibodies against specific extracellular epitopes of the glucagon
receptor block glucagon binding. Proc Natl Acad Sci U S A, 1996. 93(1): p. 310-5.
149
302. Qureshi, S.A., et al., A novel glucagon receptor antagonist inhibits glucagon-mediated
biological effects. Diabetes, 2004. 53(12): p. 3267-73.
303. Winzell, M.S., et al., Glucagon receptor antagonism improves islet function in mice with
insulin resistance induced by a high-fat diet. Diabetologia, 2007. 50(7): p. 1453-62.
304. Pederson, R.A., et al., Enhanced glucose-dependent insulinotropic polypeptide secretion
and insulinotropic action in glucagon-like peptide 1 receptor -/- mice. Diabetes, 1998.
47(7): p. 1046-52.
305. Flock, G., et al., GPR119 Regulates Murine Glucose Homeostasis Through Incretin
Receptor-Dependent and Independent Mechanisms. Endocrinology, 2011. 152(2): p. 374-
83.
306. Maida, A., et al., The glucagon-like peptide-1 receptor agonist oxyntomodulin enhances
{beta}-cell function but does not inhibit gastric emptying in mice. Endocrinology, 2008.
149(11): p. 5670-8.
307. Gelling, R.W., et al., Lower blood glucose, hyperglucagonemia, and pancreatic alpha
cell hyperplasia in glucagon receptor knockout mice. Proc Natl Acad Sci U S A, 2003.
100(3): p. 1438-43.
308. Baggio, L.L., et al., The long-acting albumin-exendin-4 GLP-1R agonist CJC-1134
engages central and peripheral mechanisms regulating glucose homeostasis.
Gastroenterology, 2008. 134(4): p. 1137-47.
309. Brubaker, P. and D. Drucker, Minireview: Glucagon-Like Peptides Regulate Cell
Proliferation and Apoptosis in the Pancreas, Gut, and Central Nervous System.
Endocrinology, 2004. 145(6): p. 2653–2659.
310. Koehler, J.A., et al., GLP-1 receptor activation modulates pancreatitis-associated gene
expression but does not modify the susceptibility to experimental pancreatitis in mice.
Diabetes, 2009. 58(9): p. 2148-61.
311. Creutzfeld, W.O., et al., Glucagonostatic actions and reduction of fasting hyperglycemia
by exogenous glucagon-like peptide I(7-36) amide in type I diabetic patients. Diabetes
Care, 1996. 19: p. 580-586.
312. D'alessio, D.A., et al., Elimination of the action of glucagon-like peptide 1 causes an
impairment of glucose tolerance after nutrient ingestion by healthy baboons. J Clin
Invest, 1996. 97: p. 133-138.
313. Knauf, C., et al., Brain glucagon-like peptide 1 signaling controls the onset of high-fat
diet-induced insulin resistance and reduces energy expenditure. Endocrinology, 2008.
149(10): p. 4768-77.
150
314. Chen, M., et al., Increased glucose tolerance and reduced adiposity in the absence of
fasting hypoglycemia in mice with liver-specific G(s)alpha deficiency. J Clin Invest,
2005. 115(11): p. 3217-27.
315. Webb, G.C., et al., Glucagon replacement via micro-osmotic pump corrects
hypoglycemia and alpha-cell hyperplasia in prohormone convertase 2 knockout mice.
Diabetes, 2002. 51(2): p. 398-405.
316. Wettergren, A., et al., Truncated GLP-1 (proglucagon 78-107-amide) inhibits gastric and
pancreatic functions in man. Dig Dis Sci, 1993. 38: p. 665-673.
317. Schjoldager, B.T., et al., GLP-1 (glucagon-like peptide 1) and truncated GLP-1,
fragments of human proglucagon, inhibit gastric acid secretion in humans. Dig Dis Sci,
1989. 34(5): p. 703-8.
318. Kawai, K., et al., Evidence that glucagon stimulates insulin secretion through its own
receptor in rats. Diabetologia, 1995. 38(3): p. 274-6.
319. Huypens, P., et al., Glucagon receptors on human islet cells contribute to glucose
competence of insulin release. Diabetologia, 2000. 43(8): p. 1012-9.
320. Drucker, D.J., The biology of incretin hormones. Cell Metab, 2006. 3(3): p. 153-65.
321. Rieck, S., et al., The transcriptional response of the islet to pregnancy in mice. Mol
Endocrinol, 2009. 23(10): p. 1702-12.
322. Kim, H., et al., Serotonin regulates pancreatic beta cell mass during pregnancy. Nat
Med, 2010. 16(7): p. 804-8.
323. Layden, B.T., et al., Regulation of pancreatic islet gene expression in mouse islets by
pregnancy. J Endocrinol, 2010. 207(3): p. 265-79.
324. Longuet, C., et al., The Glucagon Receptor Is Required for the Adaptive Metabolic
Response to Fasting. Cell Metabolism, 2008. 8(5): p. 359-371.
325. Sinclair, E.M., et al., Glucagon receptor signaling is essential for control of murine
hepatocyte survival. Gastroenterology, 2008. 135(6): p. 2096-2106.
326. Grossman, S.P., The role of glucose, insulin and glucagon in the regulation of food intake
and body weight. Neurosci Biobehav Rev, 1986. 10(3): p. 295-315.
327. Dobbs, R., et al., Glucagon: role in the hyperglycemia of diabetes mellitus. Science,
1975. 187(4176): p. 544-7.
328. Salehi, A., E. Vieira, and E. Gylfe, Paradoxical stimulation of glucagon secretion by high
glucose concentrations. Diabetes, 2006. 55(8): p. 2318-23.
151
329. Dakin, C.L., et al., Peripheral oxyntomodulin reduces food intake and body weight gain
in rats. Endocrinology, 2004. 145(6): p. 2687-95.
330. Lexow, J., et al., Cardiac fibrosis in mice expressing an inducible myocardial-specific
Cre driver. Dis Model Mech, 2013. 6(6): p. 1470-6.
331. Sohal, D.S., et al., Temporally regulated and tissue-specific gene manipulations in the
adult and embryonic heart using a tamoxifen-inducible Cre protein. Circ Res, 2001.
89(1): p. 20-5.
332. Ussher, J.R., et al., Insulin-stimulated cardiac glucose oxidation is increased in high-fat
diet-induced obese mice lacking malonyl CoA decarboxylase. Diabetes, 2009. 58(8): p.
1766-75.
333. Ban, K., et al., GLP-1(9-36) protects cardiomyocytes and endothelial cells from
ischemia-reperfusion injury via cytoprotective pathways independent of the GLP-1
receptor. Endocrinology, 2010. 151(4): p. 1520-1531.
334. Clark, J.E., N. Sarafraz, and M.S. Marber, Potential of p38-MAPK inhibitors in the
treatment of ischaemic heart disease. Pharmacol Ther, 2007. 116(2): p. 192-206.
335. Ohta, K., et al., Elafin-overexpressing mice have improved cardiac function after
myocardial infarction. Am J Physiol Heart Circ Physiol, 2004. 287(1): p. H286-92.
336. S Fazel, et al., Cell transplantation preserves cardiac function after infarction by infarct
stabilization: Augmentation by stem cell factor. The Journal of Thoracic and
Cardiovascular Surgery, 2005. 130(5): p. p1310.e1–1310.e10.
337. Koitabashi, N., et al., Avoidance of transient cardiomyopathy in cardiomyocyte-targeted
tamoxifen-induced MerCreMer gene deletion models. Circ Res, 2009. 105(1): p. 12-5.
338. Pistrosch, F., A. Natali, and M. Hanefeld, Is hyperglycemia a cardiovascular risk factor?
Diabetes Care, 2011. 34 Suppl 2: p. S128-31.
339. Mannucci, E., et al., Is glucose control important for prevention of cardiovascular
disease in diabetes? Diabetes Care, 2013. 36 Suppl 2: p. S259-63.
340. Lee, C.L., et al., Glycosylation failure extends to glycoproteins in gestational diabetes
mellitus: evidence from reduced alpha2-6 sialylation and impaired immunomodulatory
activities of pregnancy-related glycodelin-A. Diabetes, 2011. 60(3): p. 909-17.
341. Farah, A.E., Glucagon and the circulation. Pharmacological Reviews, 1983. 35: p. 181-
217.
342. Peterson, C.D., J.S. Leeder, and S. Sterner, Glucagon therapy for beta-blocker overdose.
Drug Intell Clin Pharm, 1984. 18(5): p. 394-8.
152
343. Thyfault, J.P., et al., Contraction of insulin-resistant muscle normalizes insulin action in
association with increased mitochondrial activity and fatty acid catabolism. Am J
Physiol Cell Physiol, 2007. 292(2): p. C729-39.
344. Mazumder, P.K., et al., Impaired cardiac efficiency and increased fatty acid oxidation in
insulin-resistant ob/ob mouse hearts. Diabetes, 2004. 53(9): p. 2366-74.
345. Carroll, C.C., et al., Human soleus and vastus lateralis muscle protein metabolism with
an amino acid infusion. Am J Physiol Endocrinol Metab, 2005. 288(3): p. E479-85.
346. Lopaschuk, G.D. and J.C. Russell, Myocardial function and energy substrate metabolism
in the insulin-resistant JCR:LA corpulent rat. J Appl Physiol (1985), 1991. 71(4): p.
1302-8.
347. Boudina, S., et al., Reduced mitochondrial oxidative capacity and increased
mitochondrial uncoupling impair myocardial energetics in obesity. Circulation, 2005.
112(17): p. 2686-95.
348. Folmes, C.D., et al., High rates of residual fatty acid oxidation during mild ischemia
decrease cardiac work and efficiency. J Mol Cell Cardiol, 2009. 47(1): p. 142-8.
349. Kudo, N., et al., High rates of fatty acid oxidation during reperfusion of ischemic hearts
are associated with a decrease in malonyl-CoA levels due to an increase in 5'-AMP-
activated protein kinase inhibition of acetyl-CoA carboxylase. J Biol Chem, 1995.
270(29): p. 17513-20.
350. Jaswal, J., J. Ussher, and G. Lopaschuk, Myocardial fatty acid utilization as a
determinant of cardiac efficiency and function. Clinical Lipidology, 2009. 4(3): p. 379-
389.
351. Murray, A.J., et al., Increased mitochondrial uncoupling proteins, respiratory uncoupling
and decreased efficiency in the chronically infarcted rat heart. J Mol Cell Cardiol, 2008.
44(4): p. 694-700.
352. Murray, A.J., et al., Uncoupling proteins in human heart. Lancet, 2004. 364(9447): p.
1786-8.
353. Boehm, E.A., et al., Increased uncoupling proteins and decreased efficiency in palmitate-
perfused hyperthyroid rat heart. Am J Physiol Heart Circ Physiol, 2001. 280(3): p. H977-
83.
354. Hunt, M.C. and S.E. Alexson, The role Acyl-CoA thioesterases play in mediating
intracellular lipid metabolism. Prog Lipid Res, 2002. 41(2): p. 99-130.
355. Himms-Hagen, J. and M.E. Harper, Physiological role of UCP3 may be export of fatty
acids from mitochondria when fatty acid oxidation predominates: an hypothesis. Exp
Biol Med (Maywood), 2001. 226(2): p. 78-84.
153
356. Lopaschuk, G.D., et al., Acetyl-CoA carboxylase involvement in the rapid maturation of
fatty acid oxidation in the newborn rabbit heart. J Biol Chem, 1994. 269(41): p. 25871-8.
357. Love, J.N., et al., A potential role for glucagon in the treatment of drug-induced
symptomatic bradycardia. Chest, 1998. 114(1): p. 323-6.
358. Podbregar, M. and G. Voga, Effect of selective and nonselective beta-blockers on resting
energy production rate and total body substrate utilization in chronic heart failure. J
Card Fail, 2002. 8(6): p. 369-78.
359. Wallhaus, T.R., et al., Myocardial free fatty acid and glucose use after carvedilol
treatment in patients with congestive heart failure. Circulation, 2001. 103(20): p. 2441-6.
360. Sharma, S., et al., Intramyocardial lipid accumulation in the failing human heart
resembles the lipotoxic rat heart. FASEB J, 2004. 18: p. 1692-1700.
361. Young, M.E., et al., Impaired long-chain fatty acid oxidation and contractile dysfunction
in the obese Zucker rat heart. Diabetes, 2002. 51(8): p. 2587-95.
362. Peterson, L.R., et al., Effect of obesity and insulin resistance on myocardial substrate
metabolism and efficiency in young women. Circulation, 2004. 109(18): p. 2191-6.
363. Haemmerle, G., et al., ATGL-mediated fat catabolism regulates cardiac mitochondrial
function via PPAR-alpha and PGC-1. Nat Med, 2011. 17(9): p. 1076-85.
364. Son, N.H., et al., PPARgamma-induced cardiolipotoxicity in mice is ameliorated by
PPARalpha deficiency despite increases in fatty acid oxidation. J Clin Invest, 2010.
120(10): p. 3443-54.
365. Peterson, L.R., et al., Impact of gender on the myocardial metabolic response to obesity.
JACC Cardiovasc Imaging, 2008. 1(4): p. 424-33.
366. Young, M., et al., Reactivation of Peroxisome Proliferator-activated Receptor α Is
Associated with Contractile Dysfunction in Hypertrophied Rat Heart. J. Biol. Chem.,
2001. 276: p. 44390-44395.
367. Lopaschuk, G.D., et al., Myocardial fatty acid metabolism in health and disease. Physiol
Rev, 2010. 90(1): p. 207-58.
368. Banke, N.H., et al., Preferential oxidation of triacylglyceride-derived fatty acids in heart
is augmented by the nuclear receptor PPARalpha. Circ Res, 2010. 107(2): p. 233-41.
369. Randle, P.J., Metabolic fuel selection: general integration at the whole-body level. Proc
Nutr Soc, 1995. 54(1): p. 317-27.
370. Randle, P.J., Regulatory interactions between lipids and carbohydrates: the glucose fatty
acid cycle after 35 years. Diabetes Metab Rev, 1998. 14(4): p. 263-83.
154
371. Randle, P.J., E.A. Newsholme, and P.B. Garland, Regulation of glucose uptake by
muscle. 8. Effects of fatty acids, ketone bodies and pyruvate, and of alloxan-diabetes and
starvation, on the uptake and metabolic fate of glucose in rat heart and diaphragm
muscles. Biochem J, 1964. 93(3): p. 652-65.
372. Randle, P.J., et al., The glucose fatty-acid cycle. Its role in insulin sensitivity and the
metabolic disturbances of diabetes mellitus. Lancet, 1963. 1(7285): p. 785-9.
373. Tuunanen, H., et al., Trimetazidine, a metabolic modulator, has cardiac and extracardiac
benefits in idiopathic dilated cardiomyopathy. Circulation, 2008. 118(12): p. 1250-8.
374. Lee, T.C., et al., Risk factors for cardiovascular disease in homeless adults. Circulation,
2005. 111(20): p. 2629-35.
375. Park, S.Y., et al., Unraveling the temporal pattern of diet-induced insulin resistance in
individual organs and cardiac dysfunction in C57BL/6 mice. Diabetes, 2005. 54(12): p.
3530-40.
376. Yang, Z., et al., Identification of a novel polymorphism in the 3'UTR of the L-arginine
transporter gene SLC7A1: contribution to hypertension and endothelial dysfunction.
Circulation, 2007. 115(10): p. 1269-74.
377. Dewald, O., et al., Downregulation of peroxisome proliferator-activated receptor-alpha
gene expression in a mouse model of ischemic cardiomyopathy is dependent on reactive
oxygen species and prevents lipotoxicity. Circulation, 2005. 112(3): p. 407-15.
378. Hafstad, A.D., et al., Cardiac peroxisome proliferator-activated receptor-alpha
activation causes increased fatty acid oxidation, reducing efficiency and post-ischaemic
functional loss. Cardiovasc Res, 2009. 83(3): p. 519-26.
379. Whitmer, J.T., et al., Control of fatty acid metabolism in ischemic and hypoxic hearts. J
Biol Chem, 1978. 253(12): p. 4305-9.
380. Idell-Wenger, J.A., L.W. Grotyohann, and J.R. Neely, Coenzyme A and carnitine
distribution in normal and ischemic hearts. J Biol Chem, 1978. 253(12): p. 4310-8.
381. Unger, R.H. and Y.T. Zhou, Lipotoxicity of beta-cells in obesity and in other causes of
fatty acid spillover. Diabetes, 2001. 50 Suppl 1: p. S118-21.
382. Mu, J., et al., Chronic treatment with a glucagon receptor antagonist lowers glucose and
moderately raises circulating glucagon and glucagon-like peptide 1 without severe alpha
cell hypertrophy in diet-induced obese mice. Diabetologia, 2011. 54(9): p. 2381-91.
383. MacDonald, P.E., A.M. Salapatek, and M.B. Wheeler, Glucagon-like peptide-1 receptor
activation antagonizes voltage-dependent repolarizing K(+) currents in beta-cells: a
possible glucose-dependent insulinotropic mechanism. Diabetes, 2002. 51 Suppl 3: p.
S443-7.
155
384. Li, Y., et al., Glucagon-like peptide-1 receptor signaling modulates beta cell apoptosis. J
Biol Chem, 2003. 278: p. 471-478.
385. Montrose-Rafizadeh, C., et al., High potency antagonists of the pancreatic glucagon-like
peptide-1 receptor. J.Biol.Chem., 1997. 272: p. 21201-21207.
386. Preitner, F., et al., Gluco-incretins control insulin secretion at multiple levels as revealed
in mice lacking GLP-1 and GIP receptors. J Clin Invest, 2004. 113(4): p. 635-45.
387. I˙meryüz, N., et al., Glucagon-like peptide-1 inhibits gastric emptying via vagal afferent-
mediated central mechanisms. American Journal of Physiology - Gastrointestinal and
Liver Physiology., 1997. 273(4): p. G920-G927.
388. Berglund, E.D., et al., Hepatic energy state is regulated by glucagon receptor signaling
in mice. J Clin Invest, 2009. 119(8): p. 2412-22.
389. Li, T., et al., The G protein-coupled bile acid receptor, TGR5, stimulates gallbladder
filling. Mol Endocrinol, 2011. 25(6): p. 1066-71.
390. Lee, Y., et al., Metabolic manifestations of insulin deficiency do not occur without
glucagon action. Proc Natl Acad Sci U S A, 2012. 109(37): p. 14972-6.
391. Erion, D.M., et al., Prevention of hepatic steatosis and hepatic insulin resistance by
knockdown of cAMP response element-binding protein. Cell Metab, 2009. 10(6): p. 499-
506.
392. Pederson, R.A., et al., Improved glucose tolerance in Zucker fatty rats by oral
administration of the dipeptidyl peptidase IV inhibitor isoleucine thiazolidide. Diabetes,
1998. 47(8): p. 1253-8.
393. Burcelin, R., The gut-brain axis: a major glucoregulatory player. Diabetes Metab, 2010.
36 Suppl 3: p. S54-8.
394. Tarussio, D., et al., Nervous glucose sensing regulates postnatal beta cell proliferation
and glucose homeostasis. J Clin Invest, 2014. 124(1): p. 413-24.
395. Maida, A., et al., Metformin regulates the incretin receptor axis via a pathway dependent
on peroxisome proliferator-activated receptor-alpha in mice. Diabetologia, 2011. 54(2):
p. 339-49.
396. Schelshorn, D., et al., Lateral allosterism in the glucagon receptor family: glucagon-like
peptide 1 induces G-protein-coupled receptor heteromer formation. Mol Pharmacol,
2012. 81(3): p. 309-18.
397. Lalloyer, F., et al., Peroxisome proliferator-activated receptor alpha improves pancreatic
adaptation to insulin resistance in obese mice and reduces lipotoxicity in human islets.
Diabetes, 2006. 55(6): p. 1605-13.
156
398. Lynn, F.C., et al., A novel pathway for regulation of glucose-dependent insulinotropic
polypeptide (GIP) receptor expression in beta cells. Faseb J, 2003. 17(1): p. 91-3.
399. Shu, L., et al., Decreased TCF7L2 protein levels in type 2 diabetes mellitus correlate
with downregulation of GIP- and GLP-1 receptors and impaired beta-cell function. Hum
Mol Genet, 2009. 18(13): p. 2388-99.
400. Hunter, C.S., et al., Islet alpha-, beta-, and delta-cell development is controlled by the
Ldb1 coregulator, acting primarily with the islet-1 transcription factor. Diabetes, 2013.
62(3): p. 875-86.
401. Tajima, A., et al., Combination of TS-021 with metformin improves hyperglycemia and
synergistically increases pancreatic beta-cell mass in a mouse model of type 2 diabetes.
Life Sci, 2011. 89(17-18): p. 662-70.
402. Whitaker, G.M., et al., Regulation of GIP and GLP1 receptor cell surface expression by
N-glycosylation and receptor heteromerization. PLoS One, 2012. 7(3): p. e32675.
403. Bennett, D. and L. Alphey, Yeast Two-Hybrid Screens to Identify Drosophila PP1-
Binding Proteins. Inside: Protein Phosphatase Protocols. Methods in Molecular Biology,
2007. 365: p. 155-179.
404. Aasum, E., et al., Fenofibrate modulates cardiac and hepatic metabolism and increases
ischemic tolerance in diet-induced obese mice. J Mol Cell Cardiol, 2008. 44(1): p. 201-9.
405. Henninger, C., et al., Effects of fenofibrate treatment on fatty acid oxidation in liver
mitochondria of obese Zucker rats. Biochem Pharmacol, 1987. 36(19): p. 3231-6.
406. Oosterveer, M.H., et al., Fenofibrate simultaneously induces hepatic fatty acid oxidation,
synthesis, and elongation in mice. J Biol Chem, 2009. 284(49): p. 34036-44.
407. Folmes, C.D., A.S. Clanachan, and G.D. Lopaschuk, Fatty acid oxidation inhibitors in
the management of chronic complications of atherosclerosis. Curr Atheroscler Rep,
2005. 7(1): p. 63-70.
408. Escher, P. and W. Wahli, Peroxisome proliferator-activated receptors: insight into
multiple cellular functions. Mutat Res, 2000. 448(2): p. 121-38.
409. Gelman, L., J.C. Fruchart, and J. Auwerx, An update on the mechanisms of action of the
peroxisome proliferator-activated receptors (PPARs) and their roles in inflammation and
cancer. Cell Mol Life Sci, 1999. 55(6-7): p. 932-43.
410. Kersten, S., B. Desvergne, and W. Wahli, Roles of PPARs in health and disease. Nature,
2000. 405(6785): p. 421-4.
411. Collins, S., beta-Adrenoceptor Signaling Networks in Adipocytes for Recruiting Stored
Fat and Energy Expenditure. Front Endocrinol (Lausanne), 2011. 2: p. 102.
157
412. Herrero, P., et al., Increased myocardial fatty acid metabolism in patients with type 1
diabetes mellitus. J Am Coll Cardiol, 2006. 47(3): p. 598-604.
413. Wang, H., G. Kouri, and C.B. Wollheim, ER stress and SREBP-1 activation are
implicated in beta-cell glucolipotoxicity. J Cell Sci, 2005. 118(Pt 17): p. 3905-15.
414. Carley, A.N. and D.L. Severson, Fatty acid metabolism is enhanced in type 2 diabetic
hearts. Biochim Biophys Acta, 2005. 1734(2): p. 112-26.
415. Aasum, E., et al., Age-dependent changes in metabolism, contractile function, and
ischemic sensitivity in hearts from db/db mice. Diabetes, 2003. 52(2): p. 434-41.


![micRun - Productivity Inc · 3/4* 19.05 1132.19056 MR 11- 32 DIN 6499 ISO 1/ 5488 MR Metric Collets MR Inch Collets 4. MR REGO-FIX.COM 800-999-7346 Type Part No. D [mm] L [mm] BT](https://static.fdocument.org/doc/165x107/614375096b2ee0265c020ed5/micrun-productivity-inc-34-1905-113219056-mr-11-32-din-6499-iso-1-5488-mr.jpg)