
Role of TGF-β1-independent changes in protein neosynthesis ... · Role of TGF-β1-independent...
25
Published in : Free Radical Biology & Medicine(2008) Status: Postprint (Author’s version) Role of TGF-β1-independent changes in protein neosynthesis, p38α MAPK , and cdc42 in hydrogen peroxide-induced senescence-like morphogenesis Aline Chretien a , Jean-Francois Dierick b , Edouard Delaive a , Martin Røssel Larsen c , Marc Dieu a , Martine Raes a , Christophe F. Deroanne d , Peter Roepstorff c , Olivier Toussaint a a Research Unit on Cellular Biology, University of Namur, B-5000 Namur, Belgium b Institute of Molecular Biology and Medicine, University of Brussels, Gosselies, Belgium c Protein Research Group, Department of Biochemistry and Molecular Biology, University of Southern Denmark, Odense M, Denmark d Laboratory of Connective Tissues Biology, CBIG/GIGA Research Center, University of Liège, Sart Tilman, Belgium Abstract The role of TGF-β1 in hydrogen peroxide-induced senescence-like morphogenesis has been described. The aim of this work was to investigate whether TGF-β1-independent changes in protein synthesis are involved in this morphogenesis and to study possible mechanisms occurring earlier than TGF-β1 overexpression. Among the multiple TGF-β1-independent changes in protein neosynthesis, followed or not by posttranslational modifications, identified by proteomic analysis herein, those of ezrin, L-caldesmon, and HSP27 were particularly studied. Rho-GTPase cdc42 was shown to be responsible for p38 MAPK activation, in turn triggering phosphorylation of L-caldesmon and HSP27. Cdc42 was also shown to be mainly responsible for the increase in TGF-β1 mRNA level observed at 24 h after treatment with H 2 O 2 and onward. This study further clarified the mechanisms of senescence-like morphogenesis in addition to the previously demonstrated role of TGF-β1 signaling pathways. Keywords : H 2 O 2 ; Neosynthesis ; Proteomics ; siRNA ; Senescence ; cdc42 ; p38 MAPK ; Free radicals Abbreviations : 2DGE, two-dimensional gel electrophoresis ; CaD, caldesmon ; CXM, cycloheximide ; EGF, epidermal growth factor ; FBS, fetal bovine serum ; GAP, GTPase activating protein ; GAPDH, glyceraldehyde- 3-phosphate dehydrogenase ; HDF, human diploid fibroblast ; HSP, heat shock protein ; IgG, immunoglobulin G; MAPK, mitogen-activated protein kinase ; MEM, minimum essential medium ; NP-40, Nonidet P-40 ; pak1, p21-activated kinase ; PBD, pak1-binding domain ; ppm, mass parts per million ; SD, standard deviation ; SA β- gal activity, senescence-associated β-galactosidase activity ; siRNA, small interfering RNA ; t-BHP, tert- butylhydroperoxide ; TGF-β1, transforming growth factor-β1. In 1961 Hayflick and Moorehead proposed that serial sub-cultivations of WI-38 human diploid fibroblasts (HDFs) under the usual laboratory conditions available more than 45 years ago (namely under 20% O 2 ) exhaust the proliferative potential of these cells [1]. This in vitro phenomenon has been historically termed replicative senescence [2,3]. It was shown later that cultivating human diploid fibroblasts under more physiological O 2 partial pressure (2-5% O 2 ) prolongs their in vitro life span (for a review see [2]). Legitimately this led to the question whether the molecular mechanisms of senescence are really the same when cells are cultivated under usual laboratory conditions (20% O 2 ) or under physiological O 2 pressure, even if both are characterized by critical telomere shortening [2]. According to the authors' paradigm, there are two definitions of senescence. The narrowest definition of senescence is "genuine" replicative senescence restricted to irreversible growth arrest triggered by critical telomere shortening, which counts cell generations, in the absence of non-physiological (oxidative) stress (definition 1) [4]. Other authors enlarged this definition to a functional definition encompassing irreversible arrest of proliferative cell types induced by oxidative stress/DNA damage and/or overexpression of proto-oncogenes (definition 2) [2,5]. Considering definition 1 of senescence, cells cultivated under 20% O 2 that irreversibly stop dividing, even after 50 population doublings, are in a stress-induced phenotype that resembles genuine replicative senescence. The
Transcript of Role of TGF-β1-independent changes in protein neosynthesis ... · Role of TGF-β1-independent...

Published in : Free Radical Biology & Medicine(2008) Status: Postprint (Author’s version)
Role of TGF-β1-independent changes in protein neosynthesis, p38αMAPK, and cdc42 in hydrogen peroxide-induced senescence-like morphogenesis
Aline Chretiena, Jean-Francois Dierickb, Edouard Delaivea, Martin Røssel Larsenc, Marc Dieua, Martine Raesa, Christophe F. Deroanned, Peter Roepstorffc, Olivier Toussainta
a Research Unit on Cellular Biology, University of Namur, B-5000 Namur, Belgium b Institute of Molecular Biology and Medicine, University of Brussels, Gosselies, Belgium c Protein Research Group, Department of Biochemistry and Molecular Biology, University of Southern Denmark, Odense M, Denmark d Laboratory of Connective Tissues Biology, CBIG/GIGA Research Center, University of Liège, Sart Tilman, Belgium
Abstract
The role of TGF-β1 in hydrogen peroxide-induced senescence-like morphogenesis has been described. The aim of this work was to investigate whether TGF-β1-independent changes in protein synthesis are involved in this morphogenesis and to study possible mechanisms occurring earlier than TGF-β1 overexpression. Among the multiple TGF-β1-independent changes in protein neosynthesis, followed or not by posttranslational modifications, identified by proteomic analysis herein, those of ezrin, L-caldesmon, and HSP27 were particularly studied. Rho-GTPase cdc42 was shown to be responsible for p38MAPK activation, in turn triggering phosphorylation of L-caldesmon and HSP27. Cdc42 was also shown to be mainly responsible for the increase in TGF-β1 mRNA level observed at 24 h after treatment with H2O2 and onward. This study further clarified the mechanisms of senescence-like morphogenesis in addition to the previously demonstrated role of TGF-β1 signaling pathways.
Keywords : H2O2 ; Neosynthesis ; Proteomics ; siRNA ; Senescence ; cdc42 ; p38MAPK ; Free radicals
Abbreviations : 2DGE, two-dimensional gel electrophoresis ; CaD, caldesmon ; CXM, cycloheximide ; EGF, epidermal growth factor ; FBS, fetal bovine serum ; GAP, GTPase activating protein ; GAPDH, glyceraldehyde-3-phosphate dehydrogenase ; HDF, human diploid fibroblast ; HSP, heat shock protein ; IgG, immunoglobulin G; MAPK, mitogen-activated protein kinase ; MEM, minimum essential medium ; NP-40, Nonidet P-40 ; pak1, p21-activated kinase ; PBD, pak1-binding domain ; ppm, mass parts per million ; SD, standard deviation ; SA β-gal activity, senescence-associated β-galactosidase activity ; siRNA, small interfering RNA ; t-BHP, tert-butylhydroperoxide ; TGF-β1, transforming growth factor-β1.
In 1961 Hayflick and Moorehead proposed that serial sub-cultivations of WI-38 human diploid fibroblasts (HDFs) under the usual laboratory conditions available more than 45 years ago (namely under 20% O2) exhaust the proliferative potential of these cells [1]. This in vitro phenomenon has been historically termed replicative senescence [2,3]. It was shown later that cultivating human diploid fibroblasts under more physiological O2 partial pressure (2-5% O2) prolongs their in vitro life span (for a review see [2]). Legitimately this led to the question whether the molecular mechanisms of senescence are really the same when cells are cultivated under usual laboratory conditions (20% O2) or under physiological O2 pressure, even if both are characterized by critical telomere shortening [2]. According to the authors' paradigm, there are two definitions of senescence. The narrowest definition of senescence is "genuine" replicative senescence restricted to irreversible growth arrest triggered by critical telomere shortening, which counts cell generations, in the absence of non-physiological (oxidative) stress (definition 1) [4]. Other authors enlarged this definition to a functional definition encompassing irreversible arrest of proliferative cell types induced by oxidative stress/DNA damage and/or overexpression of proto-oncogenes (definition 2) [2,5].
Considering definition 1 of senescence, cells cultivated under 20% O2 that irreversibly stop dividing, even after 50 population doublings, are in a stress-induced phenotype that resembles genuine replicative senescence. The

Published in : Free Radical Biology & Medicine(2008) Status: Postprint (Author’s version)
same holds true for cells that have been exposed chronically to a higher pressure of O2 or to acute sublethal stress, and that was also called "stress-induced senescence-like phenotype" [6]. The word "stasis" was originally used to describe growth arrest of cancer cells induced by antineoplastic molecules. It was proposed to extend the word stasis to the senescence-like phenotype that is induced in normal cells after exposure to DNA-damaging agents [7]. However, the mechanisms of growth arrest might be extremely different between cancer cells, whose cycle is by definition deregulated for many possible reasons, and normal cells exposed to stressful agents. According to definition 2 of senescence, the stress-induced senescence-like phenotype of normal cells should be called "stress-induced senescence." The phrase "stress-induced premature senescence" was also used because, according to definition 2, this type of senescence could be triggered at population doublings much earlier than the maximum number of population doublings. This work will be based on definition 1 of senescence and we shall use the phrase "stress-induced senescence-like phenotype."
Our cells are exposed to oxidative stress every day [8], Oxidative stress damages biomacromolecules like DNA, proteins, and lipids, which participates in aging [9]. A stress-induced senescence-like phenotype is induced between days 2 and 3 after an acute treatment of HDFs with a sublethal concentration of oxidative agents like tert-butylhydroperoxide (t-BHP) [10] or H2O2 [11-13]. Features of senescence obtained after passaging under 20% O2 are observed, such as enlarged shape, senescence-associated β-galactosidase activity (SA β-gal), inhibition of cell cycle, and increased mRNA abundance of senescence-associated genes like fibronectin, osteonectin, or apolipoprotein J [10,13,14], Experiments performed with various types of stress (H2O2, UVB, t-BHP, or ethanol) under sublethal conditions revealed that transforming growth factor-β1 (TGF-β1) mRNA and protein abundance are increased in HDFs in stress-induced senescence-like phenotype. Neutralization of TGF-β1 or TGF-β1 receptor II attenuates, but does not suppress, the appearance of several biomarkers of senescence after sublethal exposures to UVB or H2O2 [13,15,16]. Increased abundance of TGF-β1 mRNA was not observed in HDFs expressing the catalytic subunit of telomerase, due to possible interplay between telomerase and the TGF-β1-related pathways [17,18]. In addition, neutralization of TGF-β1 does not affect the growth arrest observed in H2O2-induced senescence-like phenotype [6]. In other words, TGF-β1 -independent mechanisms exist, which participate in the appearance of a stress-induced senescence-like phenotype.
The aim of this work was to search for TGF-β1-independent features in the H2O2-induced senescence-like phenotype. Cellular proteins are effectors able to directly modify cell functions. Generally speaking, changes in protein neosynthesis are more likely to be linked to alterations in regulation of corresponding genes than changes in protein abundance. The strategy was to perform a proteomics study based on separation of proteins metabolically labeled with radioactive methionine between 46 and 70 h after treatment of IMR-90 HDFs with a sublethal concentration of H2O2 in the presence of neutralizing antibodies against TGF-β1 or not. The results of the analysis were compared to results obtained in a parallel study in which IMR-90 HDFs were stimulated with TGF-β1 or not.
Several interesting protein candidates were identified that can play a role in the appearance of a stress-induced senescence-like phenotype. We focused on proteins that can regulate senescent morphogenesis like cdc42/rac1 GTPase-activating protein, heat shock protein 27 (HSP27), and L-caldesmon, in relationship with phosphorylation of p38MAPK. Functional studies with siRNA revealed the roles of some of these proteins in the appearance of a stress-induced senescence-like phenotype.
MATERIALS AND METHODS
Cell culture, stress, and stimulation
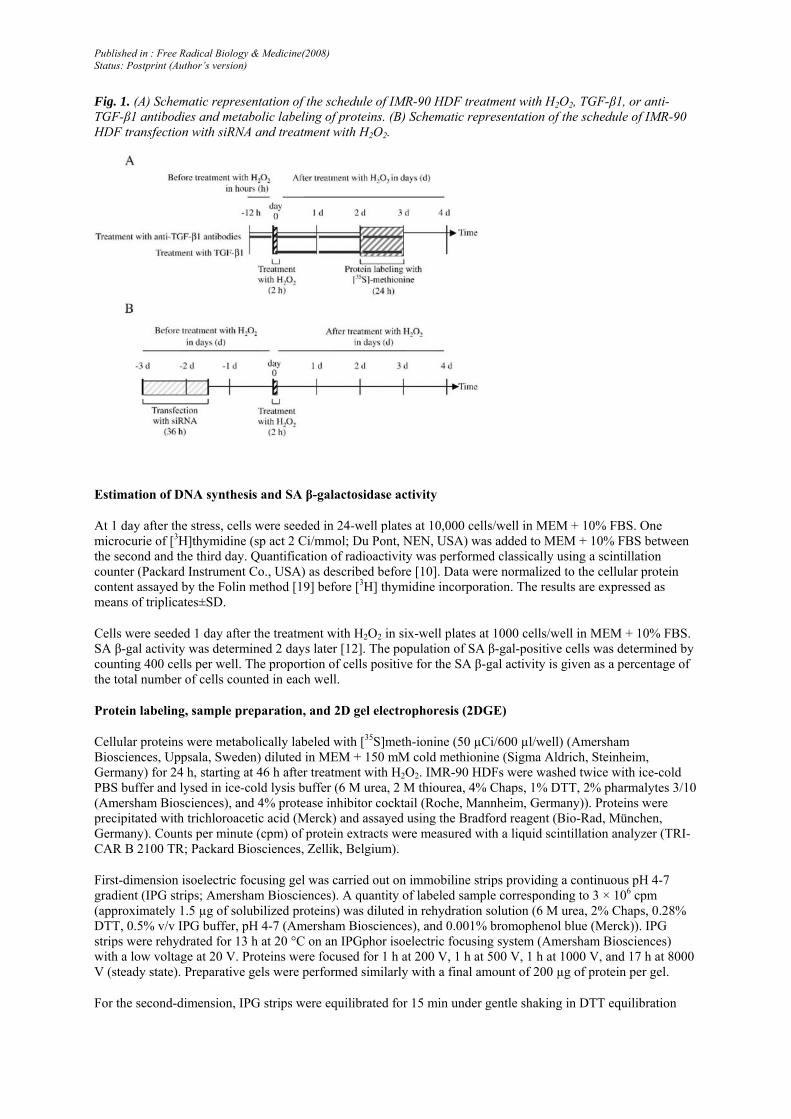
IMR-90 fetal lung HDFs were grown in minimal essential medium (MEM) (Gibco, Paisley, Scotland, UK) supplemented with 10% fetal bovine serum (FBS) (Gibco). IMR-90 HDFs at 50% of in vitro proliferative life span were seeded at a density of 24 × 103 cells/cm2. The cells were treated with different experimental conditions (Fig. 1A). The beginning of the treatment with H2O2 was defined as day 0. Under condition 1, 1 day after seeding, cells were treated for 1 or 2 h with 150 µM H2O2 (Merck, Darmstadt, Germany) diluted in MEM + 10% FBS. After the treatment with H2O2, the cells were rinsed twice with PBS, pH 7.4 (10 mM phosphate, 0.9% NaCl). A 2-h treatment represented sublethal conditions as shown earlier [13]. Under condition 2, the cells were incubated with TGF-β1 (10 ng/ml) (R&D Systems, Oxon, UK) diluted in MEM+10% FBS with new TGF-β1 every day for 3 days. Under conditions 3 and 4, IMR-90 HDFs were incubated or not with anti-TGF-β1 antibodies (R&D Systems) diluted (3 µg/ml) in MEM + 10% FBS with new MEM, FBS, and antibodies provided every day for 3 days. Under condition 5, incubation with anti-TGF-β1 antibodies started at 12 h before treatment with H2O2 and went on during treatment. New MEM, FBS, and anti-TGF-β1 antibodies were provided every day for 3 days after treatment with H2O2.
Published in : Free Radical Biology & Medicine(2008) Status: Postprint (Author’s version)
Fig. 1. (A) Schematic representation of the schedule of IMR-90 HDF treatment with H2O2, TGF-β1, or anti-TGF-β1 antibodies and metabolic labeling of proteins. (B) Schematic representation of the schedule of IMR-90 HDF transfection with siRNA and treatment with H2O2.
Estimation of DNA synthesis and SA β-galactosidase activity
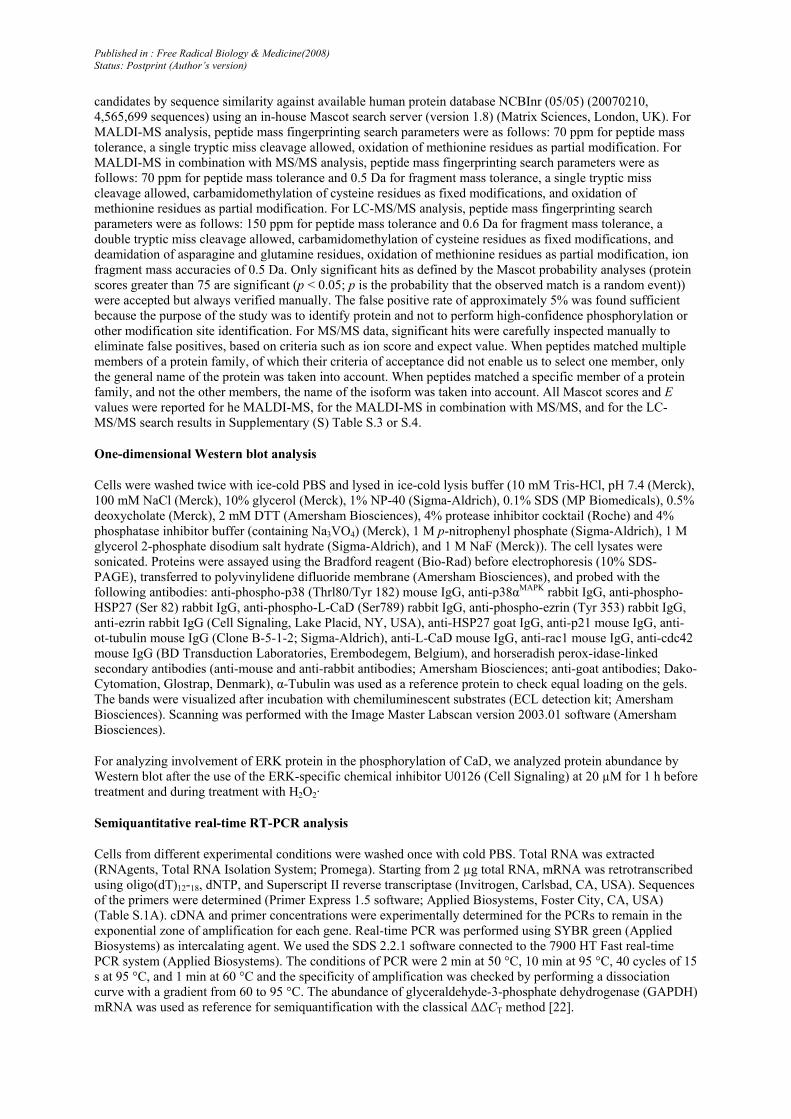
At 1 day after the stress, cells were seeded in 24-well plates at 10,000 cells/well in MEM + 10% FBS. One microcurie of [3H]thymidine (sp act 2 Ci/mmol; Du Pont, NEN, USA) was added to MEM + 10% FBS between the second and the third day. Quantification of radioactivity was performed classically using a scintillation counter (Packard Instrument Co., USA) as described before [10]. Data were normalized to the cellular protein content assayed by the Folin method [19] before [3H] thymidine incorporation. The results are expressed as means of triplicates±SD.
Cells were seeded 1 day after the treatment with H2O2 in six-well plates at 1000 cells/well in MEM + 10% FBS. SA β-gal activity was determined 2 days later [12]. The population of SA β-gal-positive cells was determined by counting 400 cells per well. The proportion of cells positive for the SA β-gal activity is given as a percentage of the total number of cells counted in each well.
Protein labeling, sample preparation, and 2D gel electrophoresis (2DGE)
Cellular proteins were metabolically labeled with [35S]meth-ionine (50 µCi/600 µl/well) (Amersham Biosciences, Uppsala, Sweden) diluted in MEM + 150 mM cold methionine (Sigma Aldrich, Steinheim, Germany) for 24 h, starting at 46 h after treatment with H2O2. IMR-90 HDFs were washed twice with ice-cold PBS buffer and lysed in ice-cold lysis buffer (6 M urea, 2 M thiourea, 4% Chaps, 1% DTT, 2% pharmalytes 3/10 (Amersham Biosciences), and 4% protease inhibitor cocktail (Roche, Mannheim, Germany)). Proteins were precipitated with trichloroacetic acid (Merck) and assayed using the Bradford reagent (Bio-Rad, München, Germany). Counts per minute (cpm) of protein extracts were measured with a liquid scintillation analyzer (TRI-CAR B 2100 TR; Packard Biosciences, Zellik, Belgium).
First-dimension isoelectric focusing gel was carried out on immobiline strips providing a continuous pH 4-7 gradient (IPG strips; Amersham Biosciences). A quantity of labeled sample corresponding to 3 × 10⁶ cpm (approximately 1.5 µg of solubilized proteins) was diluted in rehydration solution (6 M urea, 2% Chaps, 0.28% DTT, 0.5% v/v IPG buffer, pH 4-7 (Amersham Biosciences), and 0.001% bromophenol blue (Merck)). IPG strips were rehydrated for 13 h at 20 °C on an IPGphor isoelectric focusing system (Amersham Biosciences) with a low voltage at 20 V. Proteins were focused for 1 h at 200 V, 1 h at 500 V, 1 h at 1000 V, and 17 h at 8000 V (steady state). Preparative gels were performed similarly with a final amount of 200 µg of protein per gel.
For the second-dimension, IPG strips were equilibrated for 15 min under gentle shaking in DTT equilibration

Published in : Free Radical Biology & Medicine(2008) Status: Postprint (Author’s version)
buffer (0.045 M Tris-HCl, pH 8.8 (Merck), 6 M urea (Amersham Biosciences), 30% glycerol (Merck), 2% SDS (MP Biomedicals, Eschwege, Germany), 1% DTT (Amersham Biosciences), 0.001% bromophenol blue (Merck)), followed by 15 min under gentle shaking in iodoacetamide equilibration buffer (0.045 M Tris-HCl, pH 8.8 (Merck), 6 M urea (Amersham Biosciences), 30% glycerol (Merck), 2% SDS (MP Biomedicals), 2.5% iodoacetamide (Amersham Biosciences), 0.001% bromophenol blue (Merck)). Precast SDS-PAGE gels (12.5%; 255 × 196 × 1 mm) (Ettan DALT II Gel 12.5 and Ettan DALT Buffer Kit; Amersham Biosciences) were used. First, 5 W/gel was applied, followed by a constant power at 84 W/gel until bromophenol blue reached the bottom of gel. Gels were incubated for 1 h in fixing solution (25% isopropanol (Merck), 10% acetic acid (Merck), 2% glycerol (Merck)) and for 30 min in Amplify Fluorographic Reagent (Amersham Biosciences) under mild shaking. The gels were dried at 80 °C for 2 h and exposed to Hyperfilm MP (Amersham Biosciences) at -80 °C for 4 days.
Image acquisition was carried out by scanning the films (Image Master Labscan V 2003.01 software; Amersham Biosciences). Quantitative analysis was performed from 15 analytical 2DGE images (three gels per condition): spot detection and spot matching were performed, and spot volume was normalized with the total optical density of all the spots, followed by differential analysis. A cutoff value was set at a twofold increase or decrease. The differences in spot intensities were analyzed by Student t test. We checked the results of this analysis visually using the images acquired from the gels.
Protein identification
Preparative 2DGE were performed according to the same protocol as for the analytical gels except 200 µg of nonlabeling proteins was mixed with samples labeled with radioactive methionine. A total of 10 preparative 2DGE gels were prepared and 26 spots of interest could be excised from every dried gel.
The gel plugs were rehydrated with water (Milli-Q system; Millipore, Bedford, MA, USA) and washed twice with water (5 min) and twice with 100% acetonitrile (5 min) with shaking at 14,000 rounds per minute. The gel plugs were dried by vacuum centrifugation. Trypsin (10 ng/µl) (Promega, Madison, WI, USA) dissolved in 50 mM NH4HCO3, pH 7.8, was added. In-gel digestion was performed as described [20]. The digestion went on for 14-16 h at 37 °C. The supernatants were kept at -20 °C.
Custom-made chromatographic microcolumns were used for desalting and concentration of the thawed peptide mixture before mass spectrometry (MS) analysis. These columns were constricted GELoader tips (Eppendorf, Hamburg, Germany) containing 0.2 µl of POROS RP R2 material (20 µm bead size; PerSeptive Biosystems, Framingham, MA, USA). The columns were equilibrated with 10μl 1% trifluoroacetic acid (TFA). For each spot, an aliquot of the digestion supernatant was loaded onto the column. Gentle air pressure from a 10-ml syringe pushed the liquid through the columns. The column was washed with 10 µl 1% TFA. Peptides were eluted directly onto the MALDI target with 0.8 µl of matrix solution (10 µg/µl of α-cyano-4-hydroxycinnamic acid (Sigma, St. Louis, MO, USA) in 70% acetonitrile and 0.1% TFA). Manual data acquisition was performed using an Applied Biosystems 4700 Proteomics Analyzer with TOF/TOF optics (Applied Biosystems, Darmstadt, Germany), in positive reflector mode as described [21]. In the manual setup, an MS spectrum was first recorded and analyzed manually by a first round of peptide mass search. Peaks were selected for MS/MS analysis based on the obtained results. MS/MS spectra were included in the analysis and the total scores reported.
For the liquid chromatography-tandem mass spectrometry (LC-MS/MS), the peptide separation was achieved by using an LC-Packings Ultimate 3000 nanoflow system (LC Packings, Amsterdam, The Netherlands). Peptides were loaded with a high flow rate of 3 µl/min onto a custom-made 1-cm precolumn (75 µm i.d. fused silica with kasil-frits retaining the Reprosil CI8, 3.5-µm reversed-phase particles (Dr. Maisch GmbH, Germany)). Nanoflow reversed-phase HPLC was then performed with a flow of 0.1 µl/min through a custom-made 8-cm analytical column (50 µm i.d., packed with Reprosil C18, 3.5-µm reversed-phase particles (Dr. Maisch GmbH)). Peptides were eluted directly into the ESI source of a Q-TOF Micro tandem mass spectrometer (Waters/Micromass, Manchester, UK) using a stepped linear gradient. The steps were 0-10% B in 5 min, 10-50% B in 30 min, and 50-100% B in 5 min. Solvent A was 0.5% acetic acid (Merck) and B was 80% acetonitrile in 0.5% acetic acid (Merck). Mass- and charge-dependent collision energies were used for peptide fragmentation.
All spectra were converted into ASCII format. The MALDI-MS, MS/MS, and LC-MS/MS peptide mass maps were analyzed by using the MoverZ software (www.proteometrics.com). All spectra underwent an internal two-point calibration using autodigested trypsin peak masses, m/z 842.51 and 2211.10 Da, and the search was performed with a signal-to-noise ratio of 15. Protein identification was performed by searching the MALDI-MS spectra alone and/or in combination with MS/MS spectra from the same spot. Data were used to search protein
Published in : Free Radical Biology & Medicine(2008) Status: Postprint (Author’s version)
candidates by sequence similarity against available human protein database NCBInr (05/05) (20070210, 4,565,699 sequences) using an in-house Mascot search server (version 1.8) (Matrix Sciences, London, UK). For MALDI-MS analysis, peptide mass fingerprinting search parameters were as follows: 70 ppm for peptide mass tolerance, a single tryptic miss cleavage allowed, oxidation of methionine residues as partial modification. For MALDI-MS in combination with MS/MS analysis, peptide mass fingerprinting search parameters were as follows: 70 ppm for peptide mass tolerance and 0.5 Da for fragment mass tolerance, a single tryptic miss cleavage allowed, carbamidomethylation of cysteine residues as fixed modifications, and oxidation of methionine residues as partial modification. For LC-MS/MS analysis, peptide mass fingerprinting search parameters were as follows: 150 ppm for peptide mass tolerance and 0.6 Da for fragment mass tolerance, a double tryptic miss cleavage allowed, carbamidomethylation of cysteine residues as fixed modifications, and deamidation of asparagine and glutamine residues, oxidation of methionine residues as partial modification, ion fragment mass accuracies of 0.5 Da. Only significant hits as defined by the Mascot probability analyses (protein scores greater than 75 are significant (p < 0.05; p is the probability that the observed match is a random event)) were accepted but always verified manually. The false positive rate of approximately 5% was found sufficient because the purpose of the study was to identify protein and not to perform high-confidence phosphorylation or other modification site identification. For MS/MS data, significant hits were carefully inspected manually to eliminate false positives, based on criteria such as ion score and expect value. When peptides matched multiple members of a protein family, of which their criteria of acceptance did not enable us to select one member, only the general name of the protein was taken into account. When peptides matched a specific member of a protein family, and not the other members, the name of the isoform was taken into account. All Mascot scores and E values were reported for he MALDI-MS, for the MALDI-MS in combination with MS/MS, and for the LC-MS/MS search results in Supplementary (S) Table S.3 or S.4.
One-dimensional Western blot analysis
Cells were washed twice with ice-cold PBS and lysed in ice-cold lysis buffer (10 mM Tris-HCl, pH 7.4 (Merck), 100 mM NaCl (Merck), 10% glycerol (Merck), 1% NP-40 (Sigma-Aldrich), 0.1% SDS (MP Biomedicals), 0.5% deoxycholate (Merck), 2 mM DTT (Amersham Biosciences), 4% protease inhibitor cocktail (Roche) and 4% phosphatase inhibitor buffer (containing Na3VO4) (Merck), 1 M p-nitrophenyl phosphate (Sigma-Aldrich), 1 M glycerol 2-phosphate disodium salt hydrate (Sigma-Aldrich), and 1 M NaF (Merck)). The cell lysates were sonicated. Proteins were assayed using the Bradford reagent (Bio-Rad) before electrophoresis (10% SDS-PAGE), transferred to polyvinylidene difluoride membrane (Amersham Biosciences), and probed with the following antibodies: anti-phospho-p38 (Thrl80/Tyr 182) mouse IgG, anti-p38αMAPK rabbit IgG, anti-phospho-HSP27 (Ser 82) rabbit IgG, anti-phospho-L-CaD (Ser789) rabbit IgG, anti-phospho-ezrin (Tyr 353) rabbit IgG, anti-ezrin rabbit IgG (Cell Signaling, Lake Placid, NY, USA), anti-HSP27 goat IgG, anti-p21 mouse IgG, anti-ot-tubulin mouse IgG (Clone B-5-1-2; Sigma-Aldrich), anti-L-CaD mouse IgG, anti-rac1 mouse IgG, anti-cdc42 mouse IgG (BD Transduction Laboratories, Erembodegem, Belgium), and horseradish perox-idase-linked secondary antibodies (anti-mouse and anti-rabbit antibodies; Amersham Biosciences; anti-goat antibodies; Dako-Cytomation, Glostrap, Denmark), α-Tubulin was used as a reference protein to check equal loading on the gels. The bands were visualized after incubation with chemiluminescent substrates (ECL detection kit; Amersham Biosciences). Scanning was performed with the Image Master Labscan version 2003.01 software (Amersham Biosciences).
For analyzing involvement of ERK protein in the phosphorylation of CaD, we analyzed protein abundance by Western blot after the use of the ERK-specific chemical inhibitor U0126 (Cell Signaling) at 20 µM for 1 h before treatment and during treatment with H2O2·
Semiquantitative real-time RT-PCR analysis
Cells from different experimental conditions were washed once with cold PBS. Total RNA was extracted (RNAgents, Total RNA Isolation System; Promega). Starting from 2 µg total RNA, mRNA was retrotranscribed using oligo(dT)12-18, dNTP, and Superscript II reverse transcriptase (Invitrogen, Carlsbad, CA, USA). Sequences of the primers were determined (Primer Express 1.5 software; Applied Biosystems, Foster City, CA, USA) (Table S.1A). cDNA and primer concentrations were experimentally determined for the PCRs to remain in the exponential zone of amplification for each gene. Real-time PCR was performed using SYBR green (Applied Biosystems) as intercalating agent. We used the SDS 2.2.1 software connected to the 7900 HT Fast real-time PCR system (Applied Biosystems). The conditions of PCR were 2 min at 50 °C, 10 min at 95 °C, 40 cycles of 15 s at 95 °C, and 1 min at 60 °C and the specificity of amplification was checked by performing a dissociation curve with a gradient from 60 to 95 °C. The abundance of glyceraldehyde-3-phosphate dehydrogenase (GAPDH) mRNA was used as reference for semiquantification with the classical ΔΔCT method [22].

Published in : Free Radical Biology & Medicine(2008) Status: Postprint (Author’s version)
Cell viability
Cell viability was evaluated by 3-(4,5-dimethylthiazol-2-yl)-2,5-diphenyltetrazolium bromide (MTT) reduction assay (Sigma-Aldrich) [23]. For testing the cytotoxicity of cycloheximide (CXM), IMR-90 HDFs were seeded at a density of 24 × 103 cells/cm . At 24 h after seeding, IMR-90 HDFs were incubated for 24 h with CXM diluted in MEM + 10% FBS at 2,10, or 20 µg/ml. The MTT solution was added for 3 h at 37 °C. Then, the MTT solution was discarded. Lysis buffer (20% SDS (MP Biomedicals), 33.3% N,N-dimethylfoimamide (Merck), pH 4.7) was added and extraction was performed for 3 h under gentle shaking at 37 °C in the dark. The OD of the lysates was recorded at 570 nm (plate reader Ultramark Microplate Imaging System; Bio-Rad).
GTPase assays
The EZ-Detect rac1 or cdc42 Activation Kit was used (Pierce, Rockford, IL, USA). Cells were washed twice with ice-cold PBS and lysed in ice-cold lysis buffer (25 mM Tris-HCl, pH 7.5, 150 mM NaCl, 5 mM MgCl2, 1% NP-40, 1 mM DTT, and 5% glycerol with 4% protease inhibitor cocktail (Roche)) after 1 h of treatment with H2O2 and at 1, 2, and 3 days after the beginning of treatment with H2O2. Lysates were centrifuged for 8 min at 16,000 ×g. Aliquots of supernatants were used for protein concentration assays using the Bradford reagent (Bio-Rad). The remainder of the supernatants was immediately frozen in liquid nitrogen and stored at -80 °C.
For pull-down assays, 500 µg of proteins was incubated for 1 h at 4 °C under gentle shaking with 20 µg of the GST-PBD (pakl (p21-activated protein kinase 1) binding domain) fusion protein and with SwellGel immobilized-glutathione disks. Active rac1 and cdc42 bind specifically to the PBD of pakl [24,25]. The beads were washed three times in lysis buffer and boiled in 50 µl SDS sample buffer (125 mM Tris-HCl, pH 6.8, 2% glycerol, 4% SDS, and 0.05% bromophenol blue). Western blots were performed as described before. Specific antibodies to rac1 and cdc42 were used to detect their GTP form and total form.
Lysate control treatments were performed to ensure the pulldown procedure was working properly. Cell lysates were incubated with GTPγS (0.1 mM) or GDP (1 mM) in presence of EDTA, pH 8.0 (10 mM) (Merck), as the respective positive or negative control for the pull-down assays. Reaction was terminated by placing the sample on ice and adding MgCl2 (60 mM) (Merck).
As positive controls for rac1 or cdc42 activation, IMR-90 HDFs were incubated for 1 h respectively with 10 ng/ml EGF (R&D Systems) or with 100 ng/ml (0.1 µM) bradykinin (Sigma-Aldrich) before protein extraction. As negative control for rac1 activation, IMR-90 HDFs were incubated with the specific rac1 inhibitor NSC23766 (200 µM; Calbiochem, Darmstadt, Germany) for 1 h before incubation for 1 h with 10 ng/ml EGF (R&D Systems).
siRNA transfection
For invalidation of rac1 or cdc42, 21-nucleotide-long siRNAs were used (Table S.1B) [26]. The siRNA were chemically synthesized, desalted, deprotected, purified using PAGE, and annealed at 100 µM (Eurogentec, Seraing, Belgium). For invalidation of p38αMAPK, the siGENOME SMARTpool siRNA reagent M-003512-05 targeting p38αMAPK from Dharmacon (Erembodegem, Belgium) was used. Nontargeting oligoribonucleotides (OR-0030-neg; Eurogentec) were used as negative control. IMR-90 HDFs were seeded at half-confluency (20 × 10 cells/cm ). One day later, the cells were transfected for 36 h (at day -3 before treatment with H2O2) with siRNA at 50 nM in MEM using Dharmafect transfection reagent (Fig. IB). Cells were plated at day-1 before treatment with H2O2. Forprelabeling of siRNA rac1, the Silencer siRNA Labeling Kit-FAM was used according to the manufacturer's protocol (Ambion, Austin, TX, USA).
RESULTS
Induction of senescence-like phenotype with H2O2
IMR-90 HDFs were treated with five different experimental conditions (Fig. 1A). Cells were treated for 1 or 2 h with 150 µM H2O2 (condition 1). The beginning of the treatment with H2O2 was defined as day 0. A 2-h treatment represented sublethal conditions as shown earlier [13]. Cells were incubated with TGF-β1 for 72 h (condition 2). Cells were incubated or not with anti-TGF-β1 antibodies (conditions 3 and 4). Cells were incubated with anti-TGF-β1 antibodies starting at 12 h before treatment with H2O2 and continuing throughout the experiment (condition 5). New TGF-β1 or anti-TGF-β1 antibodies were provided every day for 3 days after day 0.
Published in : Free Radical Biology & Medicine(2008) Status: Postprint (Author’s version)
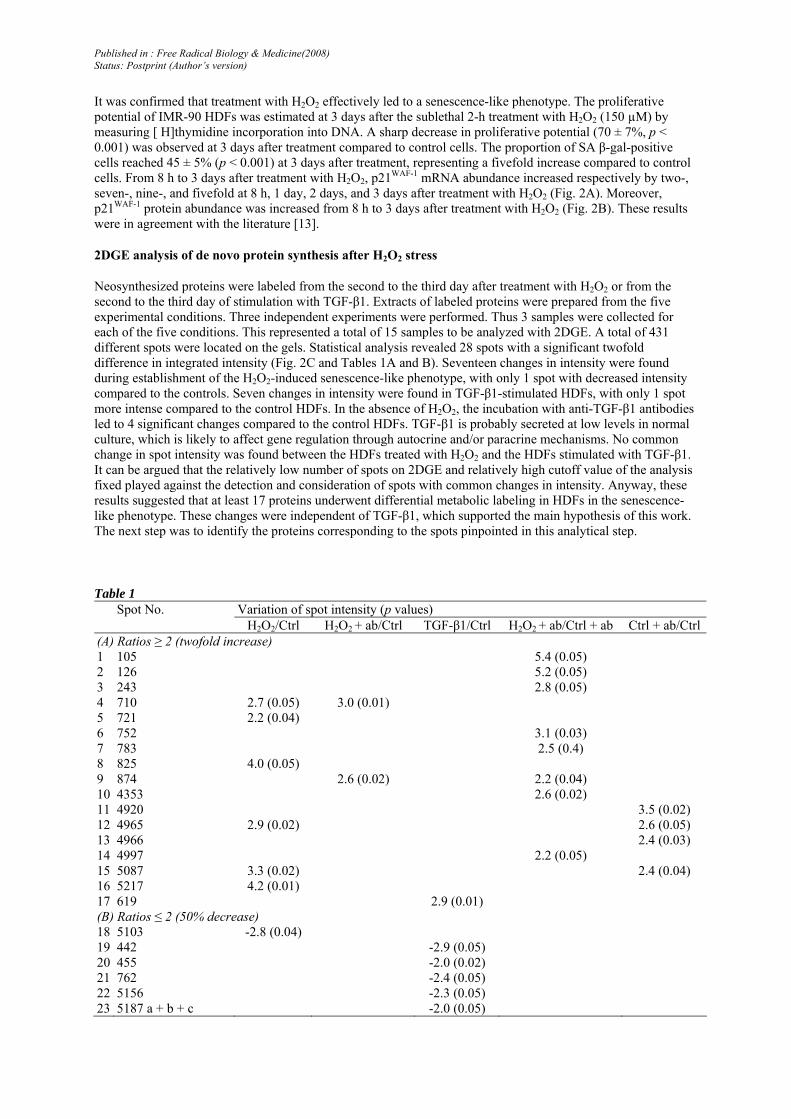
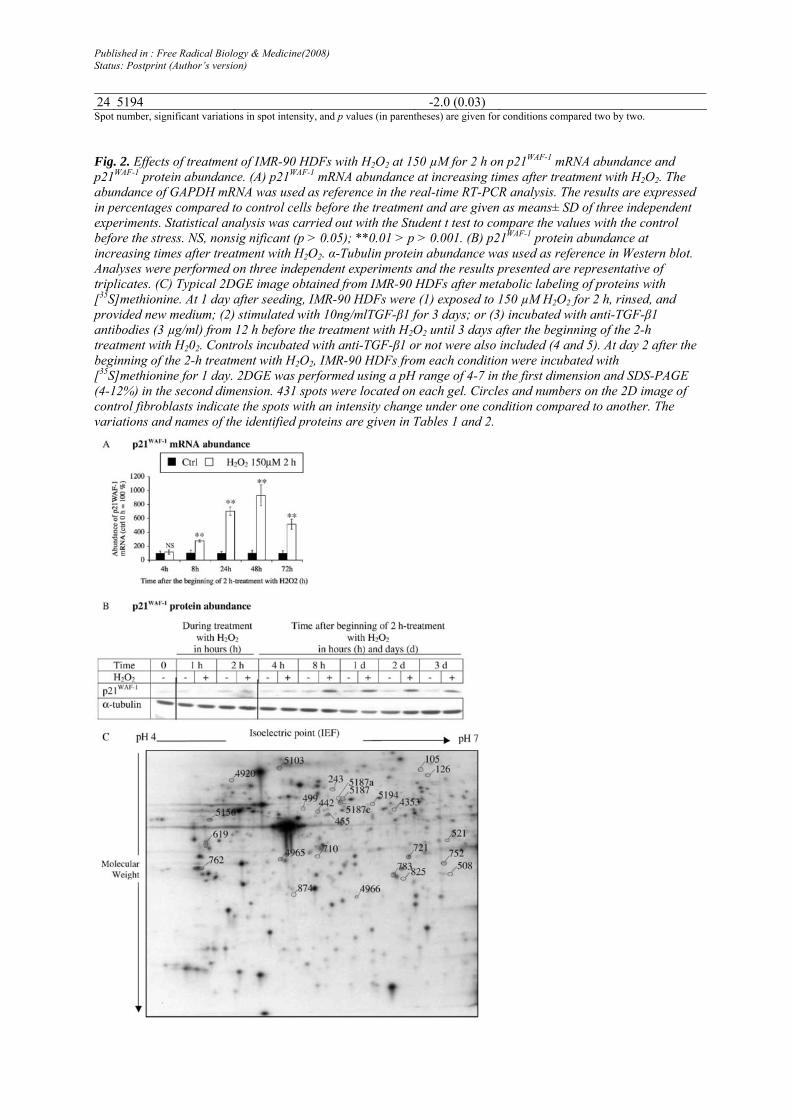
It was confirmed that treatment with H2O2 effectively led to a senescence-like phenotype. The proliferative potential of IMR-90 HDFs was estimated at 3 days after the sublethal 2-h treatment with H2O2 (150 µM) by measuring [ H]thymidine incorporation into DNA. A sharp decrease in proliferative potential (70 ± 7%, p < 0.001) was observed at 3 days after treatment compared to control cells. The proportion of SA β-gal-positive cells reached 45 ± 5% (p < 0.001) at 3 days after treatment, representing a fivefold increase compared to control cells. From 8 h to 3 days after treatment with H2O2, p21WAF-1 mRNA abundance increased respectively by two-, seven-, nine-, and fivefold at 8 h, 1 day, 2 days, and 3 days after treatment with H2O2 (Fig. 2A). Moreover, p21WAF-1 protein abundance was increased from 8 h to 3 days after treatment with H2O2 (Fig. 2B). These results were in agreement with the literature [13].
2DGE analysis of de novo protein synthesis after H2O2 stress
Neosynthesized proteins were labeled from the second to the third day after treatment with H2O2 or from the second to the third day of stimulation with TGF-β1. Extracts of labeled proteins were prepared from the five experimental conditions. Three independent experiments were performed. Thus 3 samples were collected for each of the five conditions. This represented a total of 15 samples to be analyzed with 2DGE. A total of 431 different spots were located on the gels. Statistical analysis revealed 28 spots with a significant twofold difference in integrated intensity (Fig. 2C and Tables 1A and B). Seventeen changes in intensity were found during establishment of the H2O2-induced senescence-like phenotype, with only 1 spot with decreased intensity compared to the controls. Seven changes in intensity were found in TGF-β1-stimulated HDFs, with only 1 spot more intense compared to the control HDFs. In the absence of H2O2, the incubation with anti-TGF-β1 antibodies led to 4 significant changes compared to the control HDFs. TGF-β1 is probably secreted at low levels in normal culture, which is likely to affect gene regulation through autocrine and/or paracrine mechanisms. No common change in spot intensity was found between the HDFs treated with H2O2 and the HDFs stimulated with TGF-β1. It can be argued that the relatively low number of spots on 2DGE and relatively high cutoff value of the analysis fixed played against the detection and consideration of spots with common changes in intensity. Anyway, these results suggested that at least 17 proteins underwent differential metabolic labeling in HDFs in the senescence-like phenotype. These changes were independent of TGF-β1, which supported the main hypothesis of this work. The next step was to identify the proteins corresponding to the spots pinpointed in this analytical step.
Table 1 Spot No. Variation of spot intensity (p values) H2O2/Ctrl H2O2 + ab/Ctrl TGF-β1/Ctrl H2O2 + ab/Ctrl + ab Ctrl + ab/Ctrl(A) Ratios ≥ 2 (twofold increase) 1 105 5.4 (0.05) 2 126 5.2 (0.05) 3 243 2.8 (0.05) 4 710 2.7 (0.05) 3.0 (0.01) 5 721 2.2 (0.04) 6 752 3.1 (0.03) 7 783 2.5 (0.4) 8 825 4.0 (0.05) 9 874 2.6 (0.02) 2.2 (0.04) 10 4353 2.6 (0.02) 11 4920 3.5 (0.02) 12 4965 2.9 (0.02) 2.6 (0.05) 13 4966 2.4 (0.03) 14 4997 2.2 (0.05) 15 5087 3.3 (0.02) 2.4 (0.04) 16 5217 4.2 (0.01) 17 619 2.9 (0.01) (B) Ratios ≤ 2 (50% decrease) 18 5103 -2.8 (0.04) 19 442 -2.9 (0.05) 20 455 -2.0 (0.02) 21 762 -2.4 (0.05) 22 5156 -2.3 (0.05) 23 5187 a + b + c -2.0 (0.05)
Published in : Free Radical Biology & Medicine(2008) Status: Postprint (Author’s version)
24 5194 -2.0 (0.03) Spot number, significant variations in spot intensity, and p values (in parentheses) are given for conditions compared two by two.
Fig. 2. Effects of treatment of IMR-90 HDFs with H2O2 at 150 µM for 2 h on p21WAF-1 mRNA abundance and p21WAF-1 protein abundance. (A) p21WAF-1 mRNA abundance at increasing times after treatment with H2O2. The abundance of GAPDH mRNA was used as reference in the real-time RT-PCR analysis. The results are expressed in percentages compared to control cells before the treatment and are given as means± SD of three independent experiments. Statistical analysis was carried out with the Student t test to compare the values with the control before the stress. NS, nonsig nificant (p > 0.05); **0.01 > p > 0.001. (B) p21WAF-1 protein abundance at increasing times after treatment with H2O2. α-Tubulin protein abundance was used as reference in Western blot. Analyses were performed on three independent experiments and the results presented are representative of triplicates. (C) Typical 2DGE image obtained from IMR-90 HDFs after metabolic labeling of proteins with [35S]methionine. At 1 day after seeding, IMR-90 HDFs were (1) exposed to 150 µM H2O2 for 2 h, rinsed, and provided new medium; (2) stimulated with 10ng/mlTGF-β1 for 3 days; or (3) incubated with anti-TGF-β1 antibodies (3 µg/ml) from 12 h before the treatment with H2O2 until 3 days after the beginning of the 2-h treatment with H202. Controls incubated with anti-TGF-β1 or not were also included (4 and 5). At day 2 after the beginning of the 2-h treatment with H2O2, IMR-90 HDFs from each condition were incubated with [35S]methionine for 1 day. 2DGE was performed using a pH range of 4-7 in the first dimension and SDS-PAGE (4-12%) in the second dimension. 431 spots were located on each gel. Circles and numbers on the 2D image of control fibroblasts indicate the spots with an intensity change under one condition compared to another. The variations and names of the identified proteins are given in Tables 1 and 2.
Published in : Free Radical Biology & Medicine(2008) Status: Postprint (Author’s version)
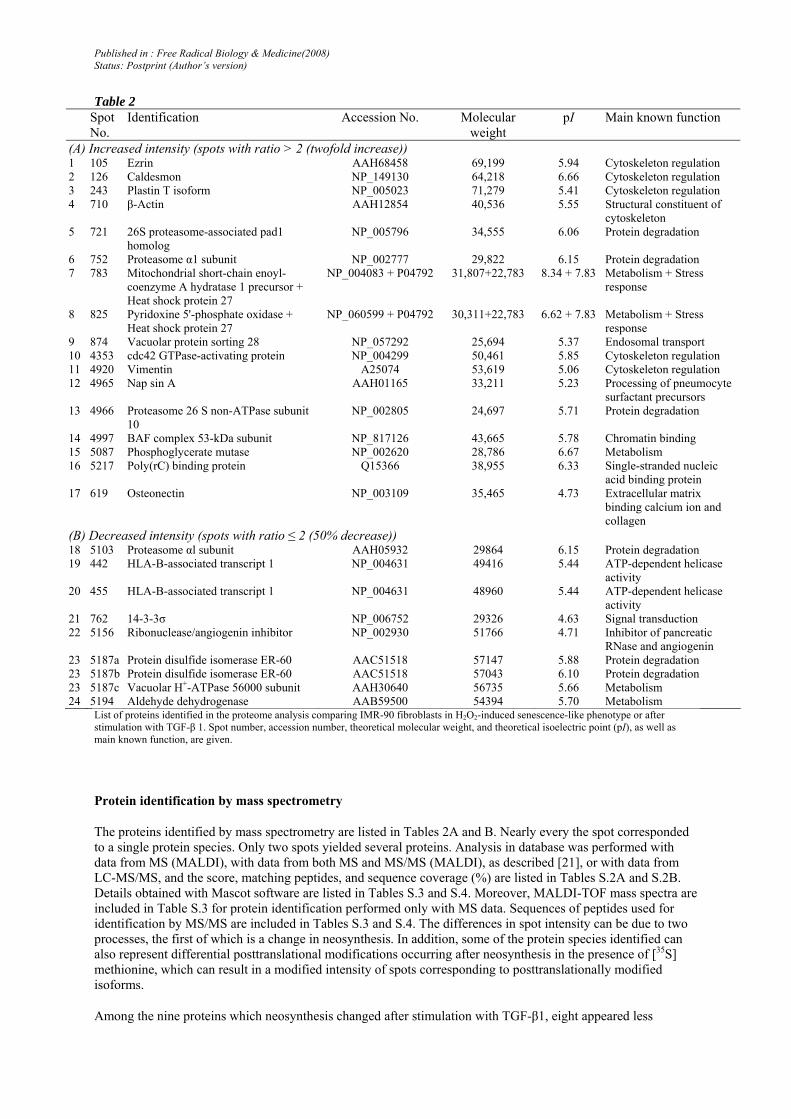
Table 2 Spot
No. Identification Accession No. Molecular
weight pI Main known function
(A) Increased intensity (spots with ratio > 2 (twofold increase)) 1 105 Ezrin AAH68458 69,199 5.94 Cytoskeleton regulation 2 126 Caldesmon NP_149130 64,218 6.66 Cytoskeleton regulation 3 243 Plastin T isoform NP_005023 71,279 5.41 Cytoskeleton regulation 4 710 β-Actin AAH12854 40,536 5.55 Structural constituent of
cytoskeleton 5 721 26S proteasome-associated pad1
homolog NP_005796 34,555 6.06 Protein degradation
6 752 Proteasome α1 subunit NP_002777 29,822 6.15 Protein degradation 7 783 Mitochondrial short-chain enoyl-
coenzyme A hydratase 1 precursor + Heat shock protein 27
NP_004083 + P04792 31,807+22,783 8.34 + 7.83 Metabolism + Stress response
8 825 Pyridoxine 5'-phosphate oxidase + Heat shock protein 27
NP_060599 + P04792 30,311+22,783 6.62 + 7.83 Metabolism + Stress response
9 874 Vacuolar protein sorting 28 NP_057292 25,694 5.37 Endosomal transport 10 4353 cdc42 GTPase-activating protein NP_004299 50,461 5.85 Cytoskeleton regulation 11 4920 Vimentin A25074 53,619 5.06 Cytoskeleton regulation 12 4965 Nap sin A AAH01165 33,211 5.23 Processing of pneumocyte
surfactant precursors 13 4966 Proteasome 26 S non-ATPase subunit
10 NP_002805 24,697 5.71 Protein degradation
14 4997 BAF complex 53-kDa subunit NP_817126 43,665 5.78 Chromatin binding 15 5087 Phosphoglycerate mutase NP_002620 28,786 6.67 Metabolism 16 5217 Poly(rC) binding protein Q15366 38,955 6.33 Single-stranded nucleic
acid binding protein 17 619 Osteonectin NP_003109 35,465 4.73 Extracellular matrix
binding calcium ion and collagen
(B) Decreased intensity (spots with ratio ≤ 2 (50% decrease)) 18 5103 Proteasome αl subunit AAH05932 29864 6.15 Protein degradation 19 442 HLA-B-associated transcript 1 NP_004631 49416 5.44 ATP-dependent helicase
activity 20 455 HLA-B-associated transcript 1 NP_004631 48960 5.44 ATP-dependent helicase
activity 21 762 14-3-3σ NP_006752 29326 4.63 Signal transduction 22 5156 Ribonuclease/angiogenin inhibitor NP_002930 51766 4.71 Inhibitor of pancreatic
RNase and angiogenin 23 5187a Protein disulfide isomerase ER-60 AAC51518 57147 5.88 Protein degradation 23 5187b Protein disulfide isomerase ER-60 AAC51518 57043 6.10 Protein degradation 23 5187c Vacuolar H+-ATPase 56000 subunit AAH30640 56735 5.66 Metabolism 24 5194 Aldehyde dehydrogenase AAB59500 54394 5.70 Metabolism
List of proteins identified in the proteome analysis comparing IMR-90 fibroblasts in H2O2-induced senescence-like phenotype or after stimulation with TGF-β 1. Spot number, accession number, theoretical molecular weight, and theoretical isoelectric point (pI), as well as main known function, are given.
Protein identification by mass spectrometry
The proteins identified by mass spectrometry are listed in Tables 2A and B. Nearly every the spot corresponded to a single protein species. Only two spots yielded several proteins. Analysis in database was performed with data from MS (MALDI), with data from both MS and MS/MS (MALDI), as described [21], or with data from LC-MS/MS, and the score, matching peptides, and sequence coverage (%) are listed in Tables S.2A and S.2B. Details obtained with Mascot software are listed in Tables S.3 and S.4. Moreover, MALDI-TOF mass spectra are included in Table S.3 for protein identification performed only with MS data. Sequences of peptides used for identification by MS/MS are included in Tables S.3 and S.4. The differences in spot intensity can be due to two processes, the first of which is a change in neosynthesis. In addition, some of the protein species identified can also represent differential posttranslational modifications occurring after neosynthesis in the presence of [35S] methionine, which can result in a modified intensity of spots corresponding to posttranslationally modified isoforms.
Among the nine proteins which neosynthesis changed after stimulation with TGF-β1, eight appeared less
Published in : Free Radical Biology & Medicine(2008) Status: Postprint (Author’s version)
metabolically labeled. Only osteonectin was more metabolically labeled (spot 619). The proteins identified as undergoing a decrease in metabolic labeling after stimulation with TGF-β1 are briefly described in the supplementary material available online.
The main goal of this study was to search for TGF-β1-independent effectors playing a role in the establishment/maintenance of the H2O2-induced senescence-like phenotype. The proteins identified in this category included a series of cyto-skeleton-, heat shock-, and metabolism-related proteins, as well as proteasome subunits and proteins involved in protein degradation and in signal transduction induced by stress and transcription (Table 2). Let us focus on β-actin, ezrin, caldesmon (CaD), cdc42-GAP, T-plastin, and HSP27, given their possible involvement in morphogenesis. The literature evidence that these proteins play a role in morphogenesis is described in the supplementary material. β-Actin (spot 710) was increased by 2.7-fold and corresponded to an isoform of actin lighter than the native form. The latter corresponded to a much larger spot on the 2DGE (Fig. 2C). A 5.4-fold increase in spot intensity corresponding to ezrin (spot 105) was found in the H2O2-induced senescence-like phenotype. The intensity of the spot corresponding to CaD (spot 126) was increased by 5.2-fold in the senescence-like phenotype. Spot 243 (2.8-fold increase in spot intensity in the senescence-like phenotype) corresponded to the T isoform of plastin. The intensity of the spot corresponding to cdc42-GTPase-activating protien (cdc42-GAP) underwent a 2.6-fold increase under the condition "H2O2 + anti-TGF-β1 antibodies" compared to the condition "control + anti-TGF-β1 antibodies" (spot 4353). HSP27 was identified in two different mixes of proteins (spots 783 and 825). The other proteins for which the corresponding spot was more intense in the senescence-like phenotype independent of TGF-β1 are briefly described in the supplementary material available online.
Study of proteins of interest involved in morphogenesis
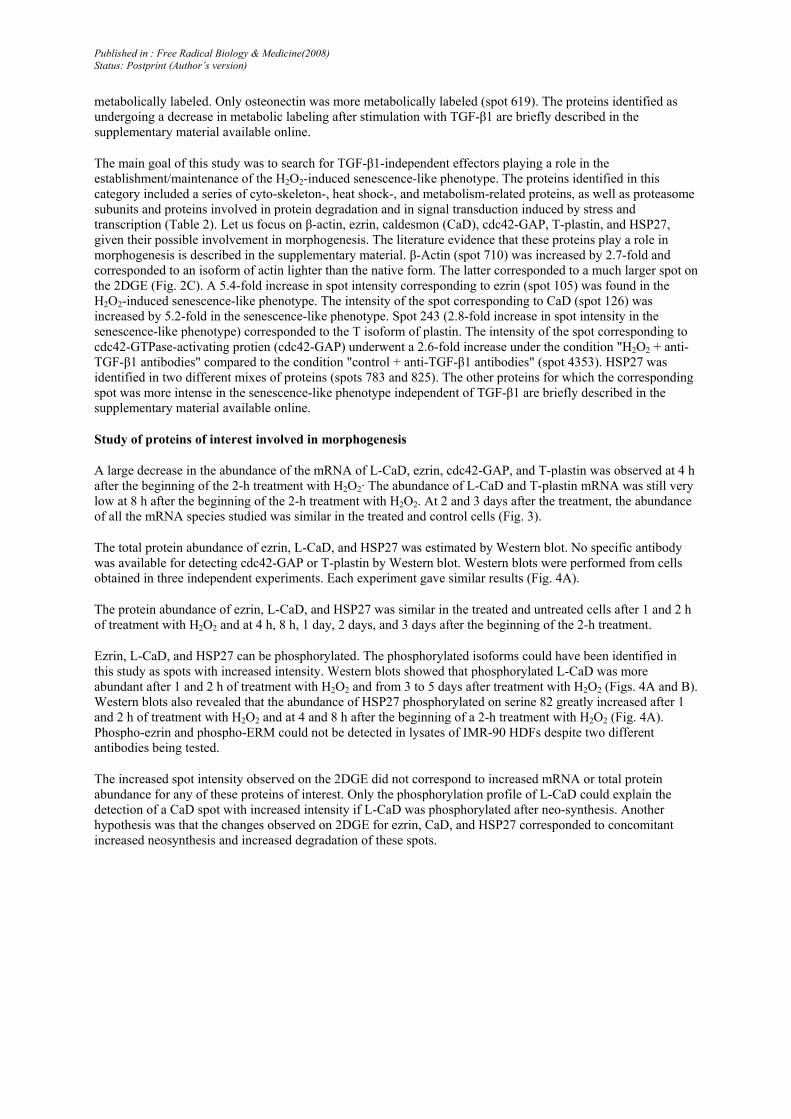
A large decrease in the abundance of the mRNA of L-CaD, ezrin, cdc42-GAP, and T-plastin was observed at 4 h after the beginning of the 2-h treatment with H2O2· The abundance of L-CaD and T-plastin mRNA was still very low at 8 h after the beginning of the 2-h treatment with H2O2. At 2 and 3 days after the treatment, the abundance of all the mRNA species studied was similar in the treated and control cells (Fig. 3).
The total protein abundance of ezrin, L-CaD, and HSP27 was estimated by Western blot. No specific antibody was available for detecting cdc42-GAP or T-plastin by Western blot. Western blots were performed from cells obtained in three independent experiments. Each experiment gave similar results (Fig. 4A).
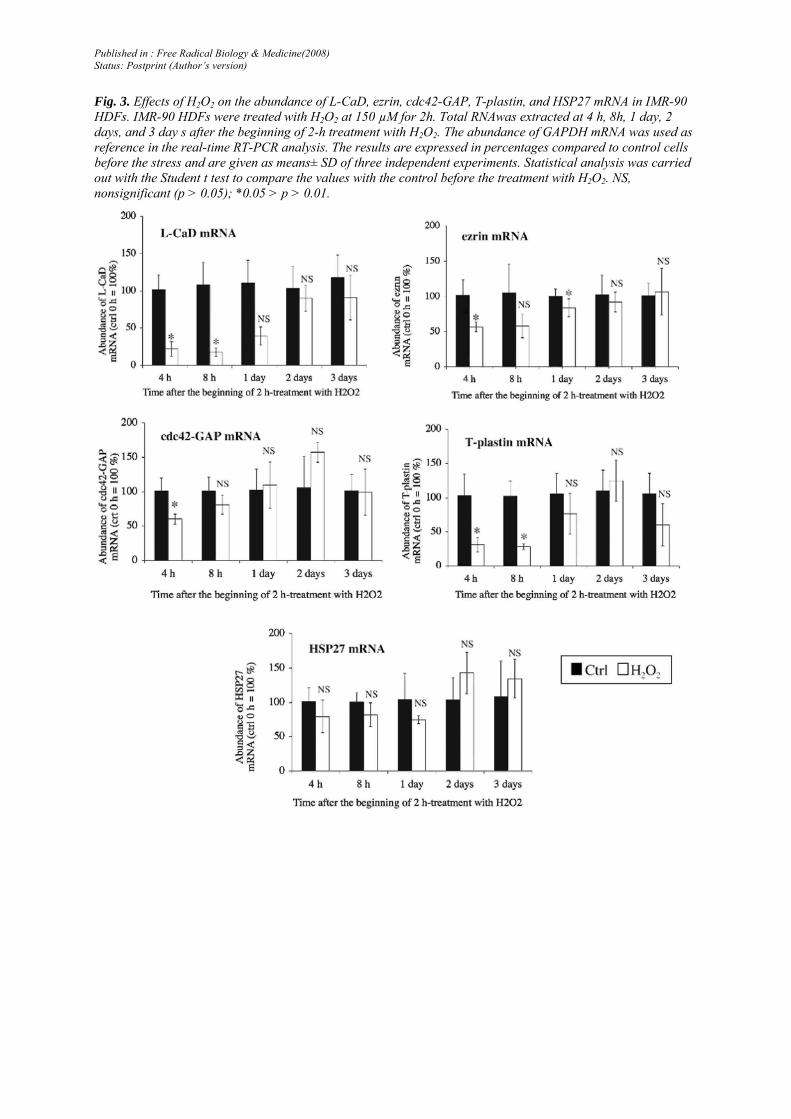
The protein abundance of ezrin, L-CaD, and HSP27 was similar in the treated and untreated cells after 1 and 2 h of treatment with H2O2 and at 4 h, 8 h, 1 day, 2 days, and 3 days after the beginning of the 2-h treatment.
Ezrin, L-CaD, and HSP27 can be phosphorylated. The phosphorylated isoforms could have been identified in this study as spots with increased intensity. Western blots showed that phosphorylated L-CaD was more abundant after 1 and 2 h of treatment with H2O2 and from 3 to 5 days after treatment with H2O2 (Figs. 4A and B). Western blots also revealed that the abundance of HSP27 phosphorylated on serine 82 greatly increased after 1 and 2 h of treatment with H2O2 and at 4 and 8 h after the beginning of a 2-h treatment with H2O2 (Fig. 4A). Phospho-ezrin and phospho-ERM could not be detected in lysates of IMR-90 HDFs despite two different antibodies being tested.
The increased spot intensity observed on the 2DGE did not correspond to increased mRNA or total protein abundance for any of these proteins of interest. Only the phosphorylation profile of L-CaD could explain the detection of a CaD spot with increased intensity if L-CaD was phosphorylated after neo-synthesis. Another hypothesis was that the changes observed on 2DGE for ezrin, CaD, and HSP27 corresponded to concomitant increased neosynthesis and increased degradation of these spots.
Published in : Free Radical Biology & Medicine(2008) Status: Postprint (Author’s version)
Fig. 3. Effects of H2O2 on the abundance of L-CaD, ezrin, cdc42-GAP, T-plastin, and HSP27 mRNA in IMR-90 HDFs. IMR-90 HDFs were treated with H2O2 at 150 µM for 2h. Total RNAwas extracted at 4 h, 8h, 1 day, 2 days, and 3 day s after the beginning of 2-h treatment with H2O2. The abundance of GAPDH mRNA was used as reference in the real-time RT-PCR analysis. The results are expressed in percentages compared to control cells before the stress and are given as means± SD of three independent experiments. Statistical analysis was carried out with the Student t test to compare the values with the control before the treatment with H2O2. NS, nonsignificant (p > 0.05); *0.05 > p > 0.01.
Published in : Free Radical Biology & Medicine(2008) Status: Postprint (Author’s version)
Fig. 4. (A) Protein abundance of ezrin, phospho-L-CaD, total L-CaD, phospho-HSP27, and total HSP27 in IMR-90 HDFs before any treatment with H2O2 (0 h), after a 1 - or 2-h treatment with H2O2, and at 4 h, 8 h, and 1 to 3 days after the beginning of a 2-h treatment with H2O2. α-Tubulin protein abundance was used as reference in the Western blot. Analyses were performed in three independent experiments and images are representative results of triplicates. (B) Protein abundance of phospho-L-CaD, total L-CaD, and p21WAF-1 in IMR-90 HDFs at 4 to 8 days after the beginning of a 2-h treatment with H2O2. p21WAF-1and α-tubulin protein abundances were used respectively as positive control for the treatment with H2O2 and as reference in the Western blot. Analyses were performed in three independent experiments and images are representative results of triplicates.
Neosynthesis of ezrin, L-CaD, and HSP27 after treatment of IMR-90 HDFs with H2O2
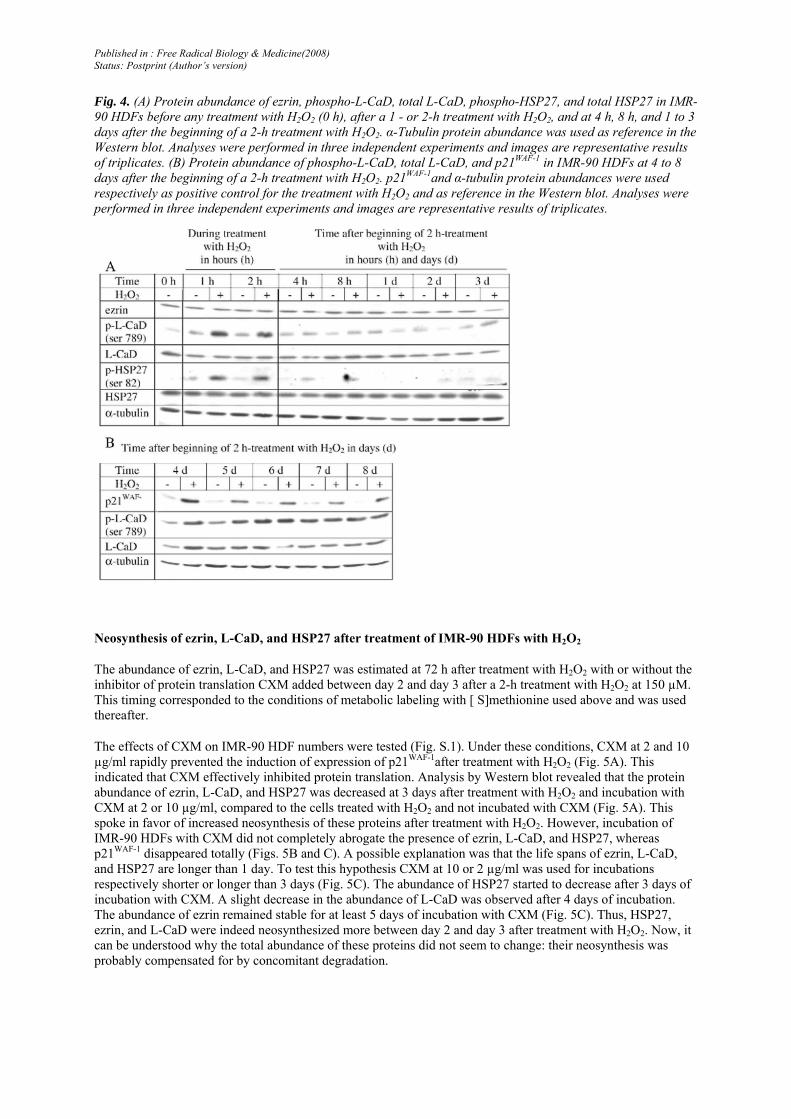
The abundance of ezrin, L-CaD, and HSP27 was estimated at 72 h after treatment with H2O2 with or without the inhibitor of protein translation CXM added between day 2 and day 3 after a 2-h treatment with H2O2 at 150 µM. This timing corresponded to the conditions of metabolic labeling with [ S]methionine used above and was used thereafter.
The effects of CXM on IMR-90 HDF numbers were tested (Fig. S.1). Under these conditions, CXM at 2 and 10 µg/ml rapidly prevented the induction of expression of p21WAF-1after treatment with H2O2 (Fig. 5A). This indicated that CXM effectively inhibited protein translation. Analysis by Western blot revealed that the protein abundance of ezrin, L-CaD, and HSP27 was decreased at 3 days after treatment with H2O2 and incubation with CXM at 2 or 10 µg/ml, compared to the cells treated with H2O2 and not incubated with CXM (Fig. 5A). This spoke in favor of increased neosynthesis of these proteins after treatment with H2O2. However, incubation of IMR-90 HDFs with CXM did not completely abrogate the presence of ezrin, L-CaD, and HSP27, whereas p21WAF-1 disappeared totally (Figs. 5B and C). A possible explanation was that the life spans of ezrin, L-CaD, and HSP27 are longer than 1 day. To test this hypothesis CXM at 10 or 2 µg/ml was used for incubations respectively shorter or longer than 3 days (Fig. 5C). The abundance of HSP27 started to decrease after 3 days of incubation with CXM. A slight decrease in the abundance of L-CaD was observed after 4 days of incubation. The abundance of ezrin remained stable for at least 5 days of incubation with CXM (Fig. 5C). Thus, HSP27, ezrin, and L-CaD were indeed neosynthesized more between day 2 and day 3 after treatment with H2O2. Now, it can be understood why the total abundance of these proteins did not seem to change: their neosynthesis was probably compensated for by concomitant degradation.
Published in : Free Radical Biology & Medicine(2008) Status: Postprint (Author’s version)
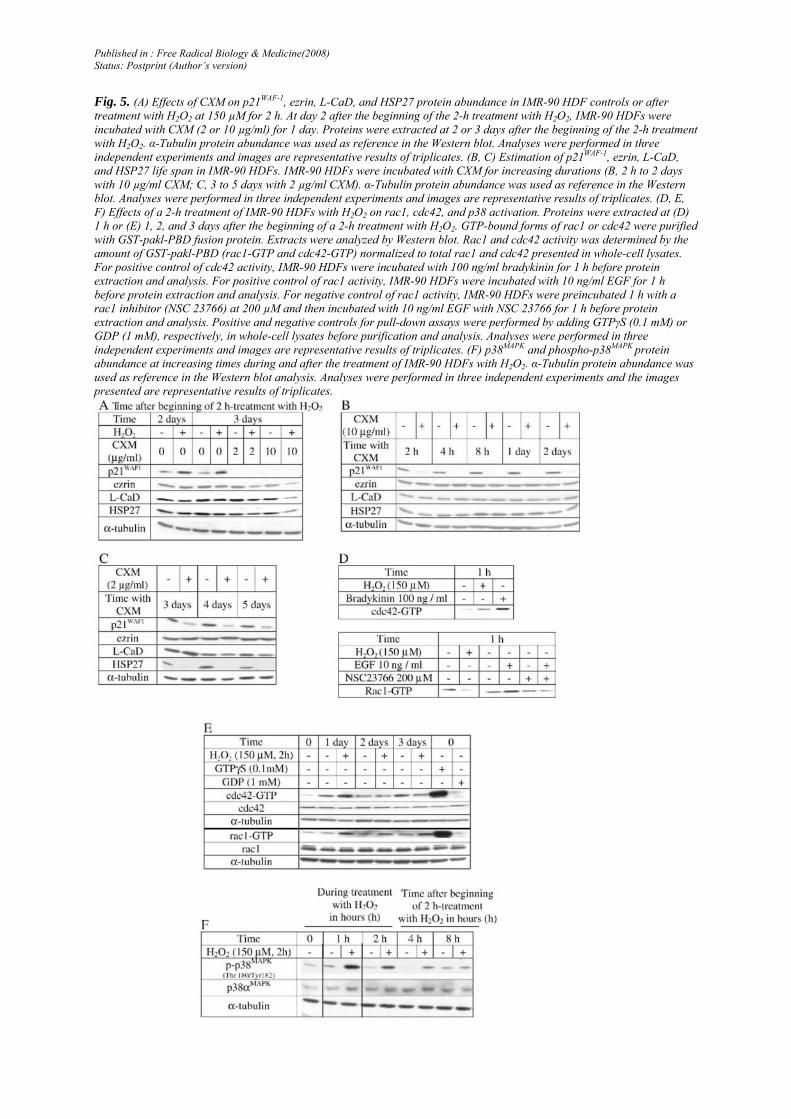
Fig. 5. (A) Effects of CXM on p21WAF-1, ezrin, L-CaD, and HSP27 protein abundance in IMR-90 HDF controls or after treatment with H2O2 at 150 µM for 2 h. At day 2 after the beginning of the 2-h treatment with H2O2, IMR-90 HDFs were incubated with CXM (2 or 10 µg/ml) for 1 day. Proteins were extracted at 2 or 3 days after the beginning of the 2-h treatment with H2O2. α-Tubulin protein abundance was used as reference in the Western blot. Analyses were performed in three independent experiments and images are representative results of triplicates. (B, C) Estimation of p21WAF-1, ezrin, L-CaD, and HSP27 life span in IMR-90 HDFs. IMR-90 HDFs were incubated with CXM for increasing durations (B, 2 h to 2 days with 10 µg/ml CXM; C, 3 to 5 days with 2 µg/ml CXM). α-Tubulin protein abundance was used as reference in the Western blot. Analyses were performed in three independent experiments and images are representative results of triplicates. (D, E, F) Effects of a 2-h treatment of IMR-90 HDFs with H2O2 on rac1, cdc42, and p38 activation. Proteins were extracted at (D) 1 h or (E) 1, 2, and 3 days after the beginning of a 2-h treatment with H2O2. GTP-bound forms of rac1 or cdc42 were purified with GST-pakl-PBD fusion protein. Extracts were analyzed by Western blot. Rac1 and cdc42 activity was determined by the amount of GST-pakl-PBD (rac1-GTP and cdc42-GTP) normalized to total rac1 and cdc42 presented in whole-cell lysates. For positive control of cdc42 activity, IMR-90 HDFs were incubated with 100 ng/ml bradykinin for 1 h before protein extraction and analysis. For positive control of rac1 activity, IMR-90 HDFs were incubated with 10 ng/ml EGF for 1 h before protein extraction and analysis. For negative control of rac1 activity, IMR-90 HDFs were preincubated 1 h with a rac1 inhibitor (NSC 23766) at 200 µM and then incubated with 10 ng/ml EGF with NSC 23766 for 1 h before protein extraction and analysis. Positive and negative controls for pull-down assays were performed by adding GTPγS (0.1 mM) or GDP (1 mM), respectively, in whole-cell lysates before purification and analysis. Analyses were performed in three independent experiments and images are representative results of triplicates. (F) p38MAPK and phospho-p38MAPK protein abundance at increasing times during and after the treatment of IMR-90 HDFs with H2O2. α-Tubulin protein abundance was used as reference in the Western blot analysis. Analyses were performed in three independent experiments and the images presented are representative results of triplicates.
Published in : Free Radical Biology & Medicine(2008) Status: Postprint (Author’s version)
Effect of treatment with H2O2 on activation of rac1/cdc42 in IMR-90 HDFs
Increased intensity of a spot corresponding to cdc42-GAP was found on the 2DGE. This protein can inhibit rac1 and/or cdc42 Rho proteins. Thus, we performed a GTPase assay for rac1 and cdc42 at different times after 2 h of treatment with H2O2, in three independent experiments. Each experiment gave very similar results. We treated IMR-90 HDFs with 0.1 µM bradykinin and 10 ng/ml EGF as positive controls for activating respectively cdc42 or rac1. We used the chemical inhibitor of rac1, NSC23766, at 200 µM, as a negative control for rac1 activity. The total abundance of cdc42 and rac1 did not change until 3 days after treatment with H2O2. Cdc42-GTP was more abundant after 1 h of treatment with H2O2, whereas rac1-GTP abundance was decreased (Fig. 5D). Cdc42-GTP was more abundant at 1 day after the treatment with H2O2 and rac1-GTP increased at 1, 2, and 3 days after 2 h of treatment with H2O2 compared to untreated cells (Fig. 5E). Thus the activation of cdc42 and rac1 was not synchronized after treatment with H2O2 except at day 1 after treatment. Thus, it seems unlikely that increased neosynthesis of cdc42-GAP alone can explain these results. Activation of cdc42 after 1 h treatment with H2O2 and at 1 day after cell treatment (stress, stimulation) had never been reported before. The same holds true for activation of rac1 from 1 to 3 days after treatment. This made it likely that these proteins can play a role in senescence-like morphogenesis after treatment with H2O2.
In addition, p38MAPK is know to be involved in rho protein-induced signaling [27,28]. Phosphorylation of p38MAPK was observed after 1 and 2 h of treatment with H2O2 and until 4 h after the beginning of the 2-h treatment with H2O2 (Fig. 5F). Taken together, these results suggest that cdc42, rac1, and p38MAPK could play a role in senescence-like morphogenesis. To test this hypothesis, cdc42, rac1, and p38αMAPK expression was invalidated using siRNA. The experimental settings for invalidation with siRNA are described in Fig. 1B and optimization of the experimental conditions is described in the supplementary material available online (Figs. S.2 and S.3).
Effect of cdc42, rac1, or p38αMAPK invalidation on the proliferation rate of IMR-90 HDFs after treatment with H2O2
The proliferative rate of IMR-90 HDFs was analyzed between the second and the third day after treatment with H2O2 because the arrest of DNA synthesis at this time is a known marker of the stress-induced senescence-like phenotype. Despite the cells transfected with siRNA for rac1, cdc42, or p38αMAPK being markedly less proliferative even in the absence of treatment with H2O2, the ratio between the cells exposed to H2O2 and those not exposed was much lower, respectively 0.007 ± 0.004, 0.030 ± 0.002, and 0.100 ± 0.09 in cells transfected with cdc42, rac1, and p38αMAPK, compared to the ratio between cells exposed to H2O2 and those not exposed and transfected with negative siRNA (0.200 ± 0.05) (Table 3).
Table 3: Effects of rac1, cdc42, and p38αMAPK invalidation with siRNA on the proliferative potential of IMR-90 HDFs treated with H2O2 or not siRNA Ratio H2O2/control cells p value Negative 0.200 ± 0.05 Rac1 0.007 ± 0.004 1.5 × 10⁻⁴
Cdc42 0.030 ± 0.002 1.6 × 10⁻⁴
p38α MAPK 0.100 ± 0.09 9.9 × 10⁻⁶
Published in : Free Radical Biology & Medicine(2008) Status: Postprint (Author’s version)
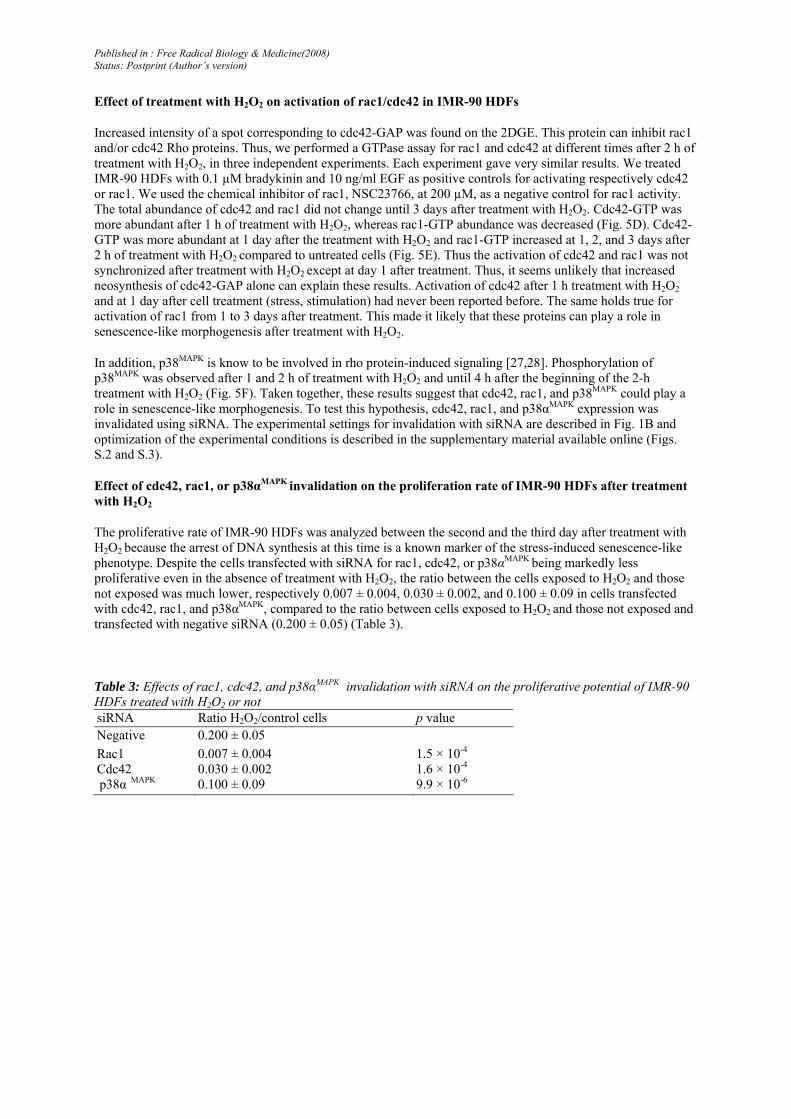
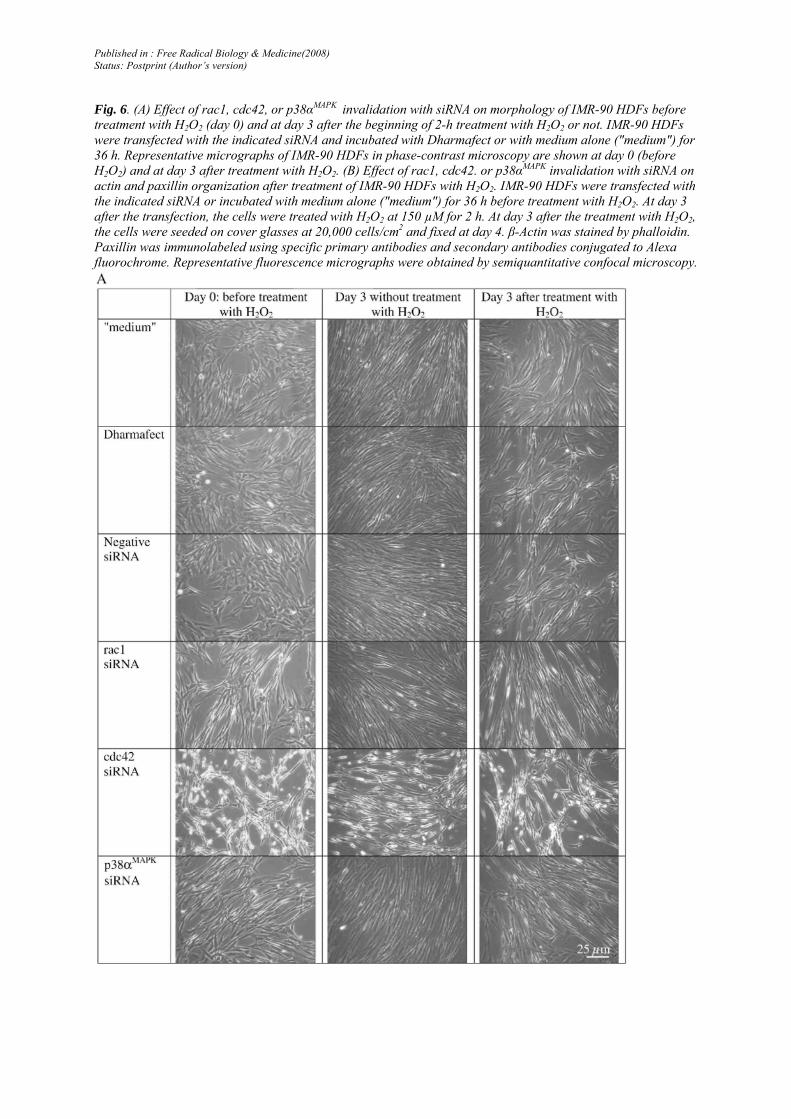
Fig. 6. (A) Effect of rac1, cdc42, or p38αMAPK invalidation with siRNA on morphology of IMR-90 HDFs before treatment with H2O2 (day 0) and at day 3 after the beginning of 2-h treatment with H2O2 or not. IMR-90 HDFs were transfected with the indicated siRNA and incubated with Dharmafect or with medium alone ("medium") for 36 h. Representative micrographs of IMR-90 HDFs in phase-contrast microscopy are shown at day 0 (before H2O2) and at day 3 after treatment with H2O2. (B) Effect of rac1, cdc42. or p38αMAPK invalidation with siRNA on actin and paxillin organization after treatment of IMR-90 HDFs with H2O2. IMR-90 HDFs were transfected with the indicated siRNA or incubated with medium alone ("medium") for 36 h before treatment with H2O2. At day 3 after the transfection, the cells were treated with H2O2 at 150 µM for 2 h. At day 3 after the treatment with H2O2, the cells were seeded on cover glasses at 20,000 cells/cm2 and fixed at day 4. β-Actin was stained by phalloidin. Paxillin was immunolabeled using specific primary antibodies and secondary antibodies conjugated to Alexa fluorochrome. Representative fluorescence micrographs were obtained by semiquantitative confocal microscopy.
Published in : Free Radical Biology & Medicine(2008) Status: Postprint (Author’s version)
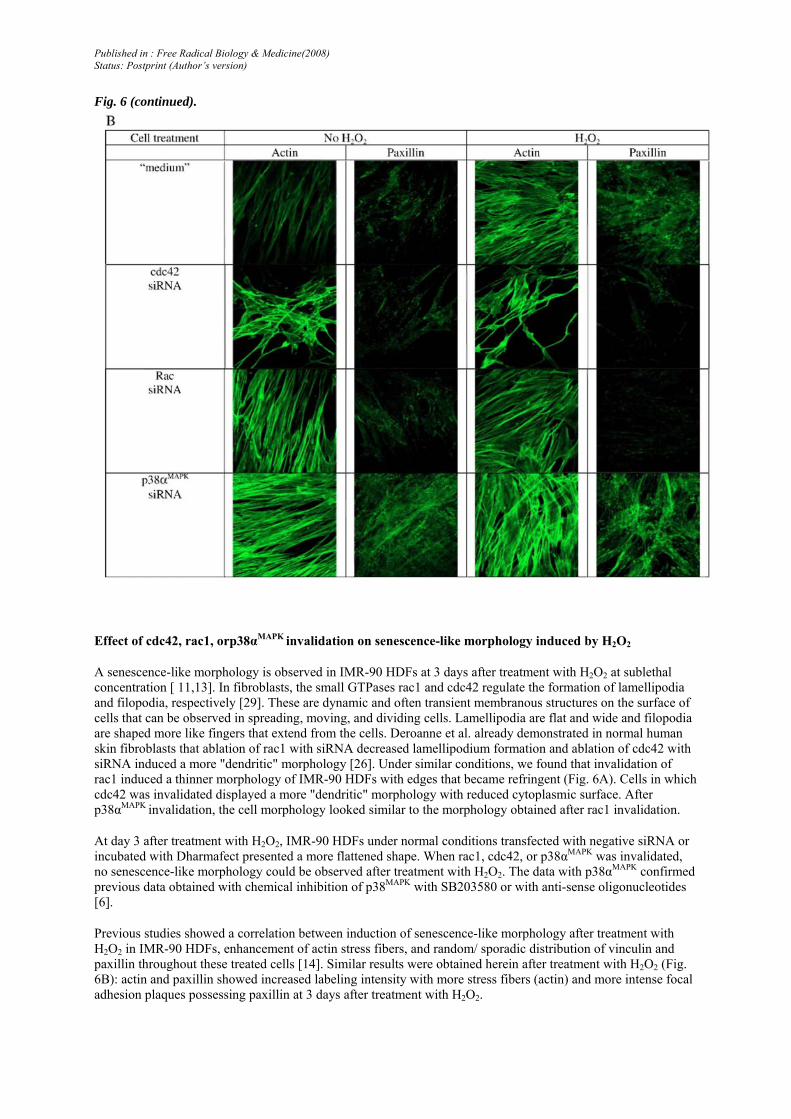
Fig. 6 (continued).
Effect of cdc42, rac1, orp38αMAPK invalidation on senescence-like morphology induced by H2O2
A senescence-like morphology is observed in IMR-90 HDFs at 3 days after treatment with H2O2 at sublethal concentration [ 11,13]. In fibroblasts, the small GTPases rac1 and cdc42 regulate the formation of lamellipodia and filopodia, respectively [29]. These are dynamic and often transient membranous structures on the surface of cells that can be observed in spreading, moving, and dividing cells. Lamellipodia are flat and wide and filopodia are shaped more like fingers that extend from the cells. Deroanne et al. already demonstrated in normal human skin fibroblasts that ablation of rac1 with siRNA decreased lamellipodium formation and ablation of cdc42 with siRNA induced a more "dendritic" morphology [26]. Under similar conditions, we found that invalidation of rac1 induced a thinner morphology of IMR-90 HDFs with edges that became refringent (Fig. 6A). Cells in which cdc42 was invalidated displayed a more "dendritic" morphology with reduced cytoplasmic surface. After p38αMAPK invalidation, the cell morphology looked similar to the morphology obtained after rac1 invalidation.
At day 3 after treatment with H2O2, IMR-90 HDFs under normal conditions transfected with negative siRNA or incubated with Dharmafect presented a more flattened shape. When rac1, cdc42, or p38αMAPK was invalidated, no senescence-like morphology could be observed after treatment with H2O2. The data with p38αMAPK confirmed previous data obtained with chemical inhibition of p38MAPK with SB203580 or with anti-sense oligonucleotides [6].
Previous studies showed a correlation between induction of senescence-like morphology after treatment with H2O2 in IMR-90 HDFs, enhancement of actin stress fibers, and random/ sporadic distribution of vinculin and paxillin throughout these treated cells [14]. Similar results were obtained herein after treatment with H2O2 (Fig. 6B): actin and paxillin showed increased labeling intensity with more stress fibers (actin) and more intense focal adhesion plaques possessing paxillin at 3 days after treatment with H2O2.
Published in : Free Radical Biology & Medicine(2008) Status: Postprint (Author’s version)
The cells transfected with cdc42 siRNA displayed strong actin labeling on the edges of filopodia. At 3 days after treatment with H2O2, the cells with invalidated rac1, cdc42, or p38αMAPK displayed similar actin patterns compared to their untreated counterparts.
As for the paxillin pattern, the cells with invalidated cdc42 or rac1 displayed less intense paxillin foci after treatment with H2O2. When p38αMAPK was invalidated, the cells displayed more intense paxillin even in absence of H2O2. This intensity was again reinforced after treatment with H2O2.
Cells transfected with the indicated siRNA and incubated with Dharmafect or medium alone were treated with H2O2 at 150 µM for 2 h, and incorporation of [3H] thymidine (1 µCi/ml) into the DNA was allowed between the second and the third day after the beginning of the 2-h treatment with H2O2. Each condition with siRNA and H2O2 was compared with the control condition (no H2O2) with siRNA. The results are given as means ± SD from three independent experiments. Statistical analysis was carried out with the Student t test. Differences in proliferative potential between both conditions and p values are given.
Effect of rac1, cdc42, or p38αMAPK on phospho-HSP27 and phospho-L- CaD
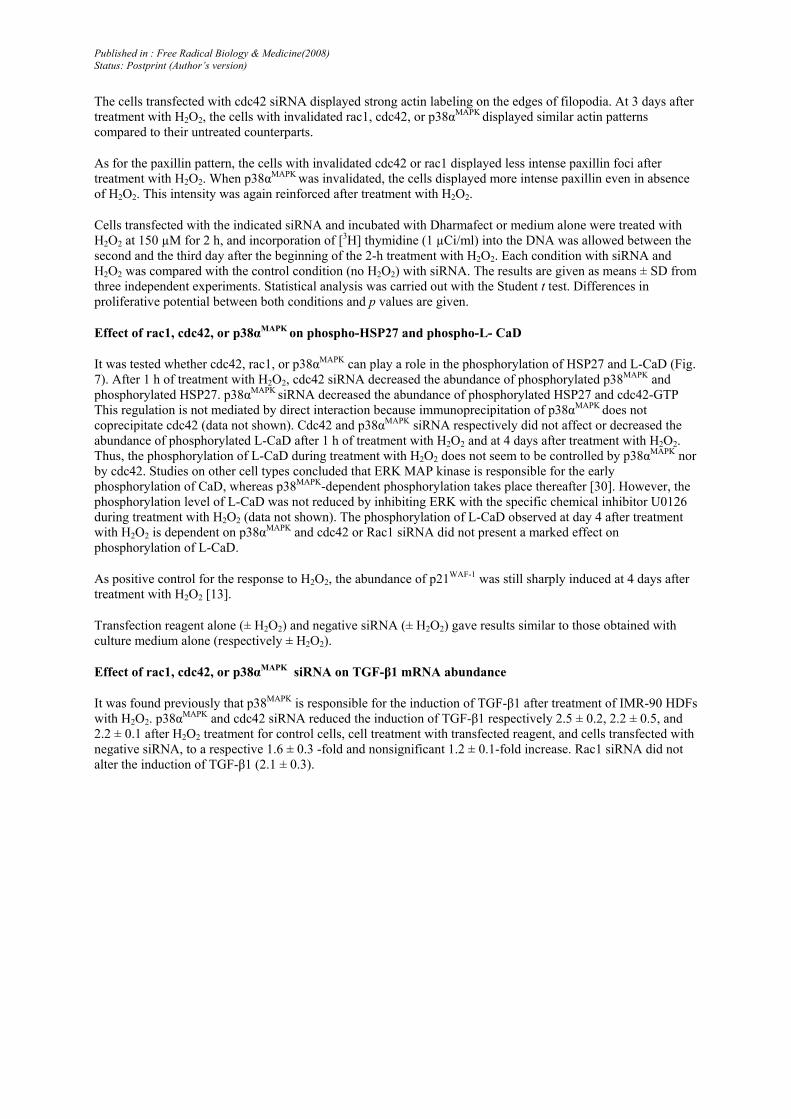
It was tested whether cdc42, rac1, or p38αMAPK can play a role in the phosphorylation of HSP27 and L-CaD (Fig. 7). After 1 h of treatment with H2O2, cdc42 siRNA decreased the abundance of phosphorylated p38MAPK and phosphorylated HSP27. p38αMAPK siRNA decreased the abundance of phosphorylated HSP27 and cdc42-GTP This regulation is not mediated by direct interaction because immunoprecipitation of p38αMAPK does not coprecipitate cdc42 (data not shown). Cdc42 and p38αMAPK siRNA respectively did not affect or decreased the abundance of phosphorylated L-CaD after 1 h of treatment with H2O2 and at 4 days after treatment with H2O2. Thus, the phosphorylation of L-CaD during treatment with H2O2 does not seem to be controlled by p38αMAPK nor by cdc42. Studies on other cell types concluded that ERK MAP kinase is responsible for the early phosphorylation of CaD, whereas p38MAPK-dependent phosphorylation takes place thereafter [30]. However, the phosphorylation level of L-CaD was not reduced by inhibiting ERK with the specific chemical inhibitor U0126 during treatment with H2O2 (data not shown). The phosphorylation of L-CaD observed at day 4 after treatment with H2O2 is dependent on p38αMAPK and cdc42 or Rac1 siRNA did not present a marked effect on phosphorylation of L-CaD.
As positive control for the response to H2O2, the abundance of p21WAF-1 was still sharply induced at 4 days after treatment with H2O2 [13].
Transfection reagent alone (± H2O2) and negative siRNA (± H2O2) gave results similar to those obtained with culture medium alone (respectively ± H2O2).
Effect of rac1, cdc42, or p38αMAPK siRNA on TGF-β1 mRNA abundance
It was found previously that p38MAPK is responsible for the induction of TGF-β1 after treatment of IMR-90 HDFs with H2O2. p38αMAPK and cdc42 siRNA reduced the induction of TGF-β1 respectively 2.5 ± 0.2, 2.2 ± 0.5, and 2.2 ± 0.1 after H2O2 treatment for control cells, cell treatment with transfected reagent, and cells transfected with negative siRNA, to a respective 1.6 ± 0.3 -fold and nonsignificant 1.2 ± 0.1-fold increase. Rac1 siRNA did not alter the induction of TGF-β1 (2.1 ± 0.3).
Published in : Free Radical Biology & Medicine(2008) Status: Postprint (Author’s version)
Fig. 7. Effect of rac1, cdc42, or p38αMAPK invalidation with siRNA on protein abundance of p38MAPK, phospho-p38MAPK , phospho-L-CaD, and phospho-HSP27 after treatment with H2O2. IMR-90 HDFs were transfected with the indicated siRNAs and incubated with Dharmafect or with medium alone. Proteins were extracted (A) after a 1-h treatment with H2O2 or (B) at day 4 after the beginning of a 2-h treatment with H2O2. p21WAF-1 protein abundance was estimated at day 4 as positive control for the treatment with H2O2. α-Tubulin protein abundance was used as a reference in the Western blot. Analyses were performed in three independent experiments and the results presented are representative of triplicates.
DISCUSSION
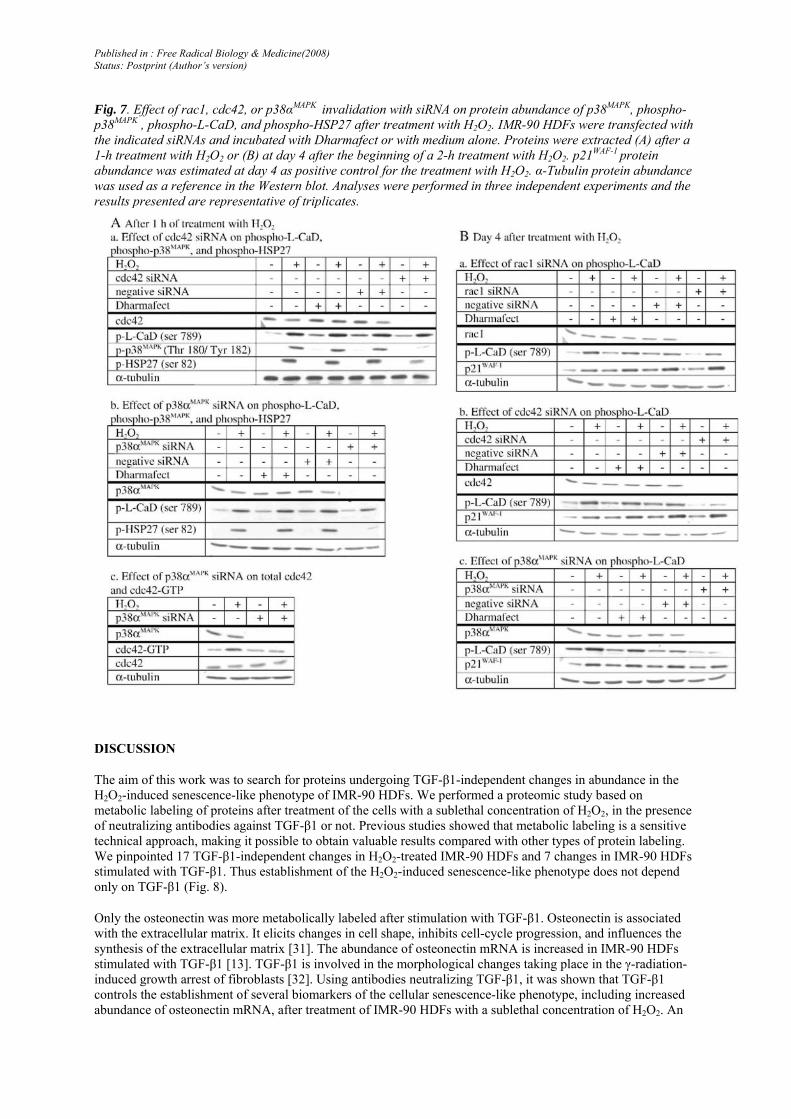
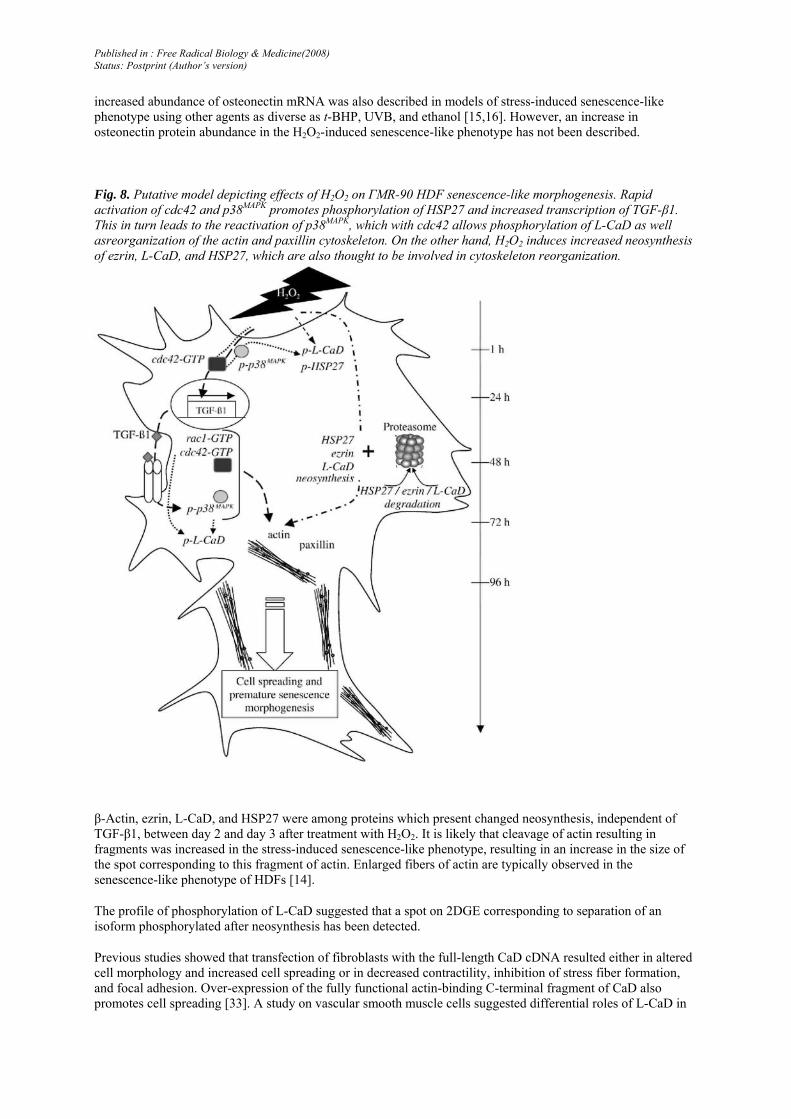
The aim of this work was to search for proteins undergoing TGF-β1-independent changes in abundance in the H2O2-induced senescence-like phenotype of IMR-90 HDFs. We performed a proteomic study based on metabolic labeling of proteins after treatment of the cells with a sublethal concentration of H2O2, in the presence of neutralizing antibodies against TGF-β1 or not. Previous studies showed that metabolic labeling is a sensitive technical approach, making it possible to obtain valuable results compared with other types of protein labeling. We pinpointed 17 TGF-β1-independent changes in H2O2-treated IMR-90 HDFs and 7 changes in IMR-90 HDFs stimulated with TGF-β1. Thus establishment of the H2O2-induced senescence-like phenotype does not depend only on TGF-β1 (Fig. 8).
Only the osteonectin was more metabolically labeled after stimulation with TGF-β1. Osteonectin is associated with the extracellular matrix. It elicits changes in cell shape, inhibits cell-cycle progression, and influences the synthesis of the extracellular matrix [31]. The abundance of osteonectin mRNA is increased in IMR-90 HDFs stimulated with TGF-β1 [13]. TGF-β1 is involved in the morphological changes taking place in the γ-radiation-induced growth arrest of fibroblasts [32]. Using antibodies neutralizing TGF-β1, it was shown that TGF-β1 controls the establishment of several biomarkers of the cellular senescence-like phenotype, including increased abundance of osteonectin mRNA, after treatment of IMR-90 HDFs with a sublethal concentration of H2O2. An
Published in : Free Radical Biology & Medicine(2008) Status: Postprint (Author’s version)
increased abundance of osteonectin mRNA was also described in models of stress-induced senescence-like phenotype using other agents as diverse as t-BHP, UVB, and ethanol [15,16]. However, an increase in osteonectin protein abundance in the H2O2-induced senescence-like phenotype has not been described.
Fig. 8. Putative model depicting effects of H2O2 on ΓMR-90 HDF senescence-like morphogenesis. Rapid activation of cdc42 and p38MAPK promotes phosphorylation of HSP27 and increased transcription of TGF-β1. This in turn leads to the reactivation of p38MAPK, which with cdc42 allows phosphorylation of L-CaD as well asreorganization of the actin and paxillin cytoskeleton. On the other hand, H2O2 induces increased neosynthesis of ezrin, L-CaD, and HSP27, which are also thought to be involved in cytoskeleton reorganization.
β-Actin, ezrin, L-CaD, and HSP27 were among proteins which present changed neosynthesis, independent of TGF-β1, between day 2 and day 3 after treatment with H2O2. It is likely that cleavage of actin resulting in fragments was increased in the stress-induced senescence-like phenotype, resulting in an increase in the size of the spot corresponding to this fragment of actin. Enlarged fibers of actin are typically observed in the senescence-like phenotype of HDFs [14].
The profile of phosphorylation of L-CaD suggested that a spot on 2DGE corresponding to separation of an isoform phosphorylated after neosynthesis has been detected.
Previous studies showed that transfection of fibroblasts with the full-length CaD cDNA resulted either in altered cell morphology and increased cell spreading or in decreased contractility, inhibition of stress fiber formation, and focal adhesion. Over-expression of the fully functional actin-binding C-terminal fragment of CaD also promotes cell spreading [33]. A study on vascular smooth muscle cells suggested differential roles of L-CaD in
Published in : Free Radical Biology & Medicine(2008) Status: Postprint (Author’s version)
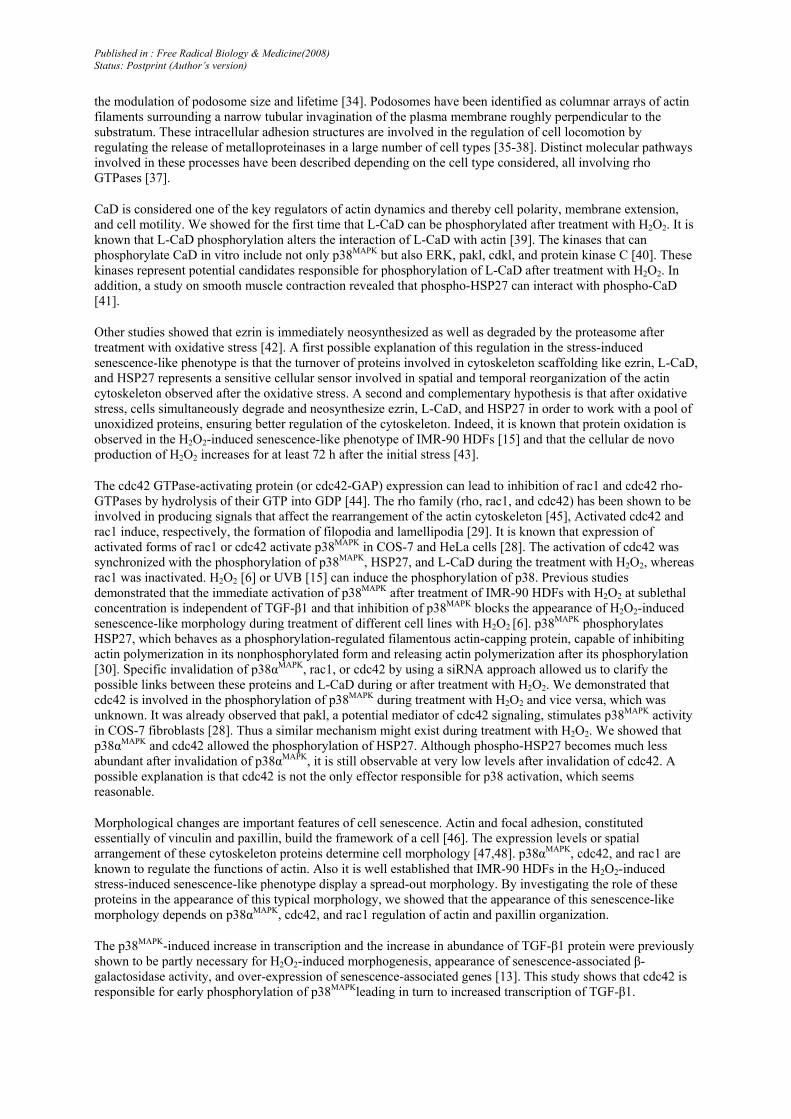
the modulation of podosome size and lifetime [34]. Podosomes have been identified as columnar arrays of actin filaments surrounding a narrow tubular invagination of the plasma membrane roughly perpendicular to the substratum. These intracellular adhesion structures are involved in the regulation of cell locomotion by regulating the release of metalloproteinases in a large number of cell types [35-38]. Distinct molecular pathways involved in these processes have been described depending on the cell type considered, all involving rho GTPases [37].
CaD is considered one of the key regulators of actin dynamics and thereby cell polarity, membrane extension, and cell motility. We showed for the first time that L-CaD can be phosphorylated after treatment with H2O2. It is known that L-CaD phosphorylation alters the interaction of L-CaD with actin [39]. The kinases that can phosphorylate CaD in vitro include not only p38MAPK but also ERK, pakl, cdkl, and protein kinase C [40]. These kinases represent potential candidates responsible for phosphorylation of L-CaD after treatment with H2O2. In addition, a study on smooth muscle contraction revealed that phospho-HSP27 can interact with phospho-CaD [41].
Other studies showed that ezrin is immediately neosynthesized as well as degraded by the proteasome after treatment with oxidative stress [42]. A first possible explanation of this regulation in the stress-induced senescence-like phenotype is that the turnover of proteins involved in cytoskeleton scaffolding like ezrin, L-CaD, and HSP27 represents a sensitive cellular sensor involved in spatial and temporal reorganization of the actin cytoskeleton observed after the oxidative stress. A second and complementary hypothesis is that after oxidative stress, cells simultaneously degrade and neosynthesize ezrin, L-CaD, and HSP27 in order to work with a pool of unoxidized proteins, ensuring better regulation of the cytoskeleton. Indeed, it is known that protein oxidation is observed in the H2O2-induced senescence-like phenotype of IMR-90 HDFs [15] and that the cellular de novo production of H2O2 increases for at least 72 h after the initial stress [43].
The cdc42 GTPase-activating protein (or cdc42-GAP) expression can lead to inhibition of rac1 and cdc42 rho-GTPases by hydrolysis of their GTP into GDP [44]. The rho family (rho, rac1, and cdc42) has been shown to be involved in producing signals that affect the rearrangement of the actin cytoskeleton [45], Activated cdc42 and rac1 induce, respectively, the formation of filopodia and lamellipodia [29]. It is known that expression of activated forms of rac1 or cdc42 activate p38MAPK in COS-7 and HeLa cells [28]. The activation of cdc42 was synchronized with the phosphorylation of p38MAPK, HSP27, and L-CaD during the treatment with H2O2, whereas rac1 was inactivated. H2O2 [6] or UVB [15] can induce the phosphorylation of p38. Previous studies demonstrated that the immediate activation of p38MAPK after treatment of IMR-90 HDFs with H2O2 at sublethal concentration is independent of TGF-β1 and that inhibition of p38MAPK blocks the appearance of H2O2-induced senescence-like morphology during treatment of different cell lines with H2O2 [6]. p38MAPK phosphorylates HSP27, which behaves as a phosphorylation-regulated filamentous actin-capping protein, capable of inhibiting actin polymerization in its nonphosphorylated form and releasing actin polymerization after its phosphorylation [30]. Specific invalidation of p38αMAPK, rac1, or cdc42 by using a siRNA approach allowed us to clarify the possible links between these proteins and L-CaD during or after treatment with H2O2. We demonstrated that cdc42 is involved in the phosphorylation of p38MAPK during treatment with H2O2 and vice versa, which was unknown. It was already observed that pakl, a potential mediator of cdc42 signaling, stimulates p38MAPK activity in COS-7 fibroblasts [28]. Thus a similar mechanism might exist during treatment with H2O2. We showed that p38αMAPK and cdc42 allowed the phosphorylation of HSP27. Although phospho-HSP27 becomes much less abundant after invalidation of p38αMAPK, it is still observable at very low levels after invalidation of cdc42. A possible explanation is that cdc42 is not the only effector responsible for p38 activation, which seems reasonable.
Morphological changes are important features of cell senescence. Actin and focal adhesion, constituted essentially of vinculin and paxillin, build the framework of a cell [46]. The expression levels or spatial arrangement of these cytoskeleton proteins determine cell morphology [47,48]. p38αMAPK, cdc42, and rac1 are known to regulate the functions of actin. Also it is well established that IMR-90 HDFs in the H2O2-induced stress-induced senescence-like phenotype display a spread-out morphology. By investigating the role of these proteins in the appearance of this typical morphology, we showed that the appearance of this senescence-like morphology depends on p38αMAPK, cdc42, and rac1 regulation of actin and paxillin organization.
The p38MAPK-induced increase in transcription and the increase in abundance of TGF-β1 protein were previously shown to be partly necessary for H2O2-induced morphogenesis, appearance of senescence-associated β-galactosidase activity, and over-expression of senescence-associated genes [13]. This study shows that cdc42 is responsible for early phosphorylation of p38MAPKleading in turn to increased transcription of TGF-β1.

Published in : Free Radical Biology & Medicine(2008) Status: Postprint (Author’s version)
Thus, cdc42 participates in the TGF-β1-dependent changes observed in the senescence-like phenotype. However, TGF-β1-independent events are also shown herein to participate in senescence-like morphogenesis. Thus both TGF-β1-dependent and -independent events participate in the senescence-like phenotype of HDFs induced by a sublethal concentration of H2O2.
It was proposed that it could be possible to find culture conditions for each cell type that minimize stress (culture shock) and that leave telomere shortening as the only barrier to immortalization [4,49]. Narrowing the discussion to human diploid fibroblasts in vitro at physiological O2 concentrations, 80 population doublings can be reached. If we consider two telomerase-negative fibroblasts that appear during in vivo embryogenesis, it would mean that at least 280 fibroblasts (> 1024 fibroblasts) should be produced before the first replicatively senescent fibroblasts are seen (if 80 population doublings are necessary for the cells to become "truly" replicatively senescent, with critically short telomere). In addition, removal of any type of culture shock should increase this figure further to values slightly higher than 80. Considering the volume of a single fibroblast, 1024 fibroblasts represent a volume of several cubic kilometers of fibroblasts. Even if the volume of a human could represent as much as 1 m3 of fibroblastic tissue subject to turnover, this would represent billions of possible turnovers, which is virtually impossible to reach within the present maximal human life span of 125 years. Of course asymmetric division processes should be considered, which would decrease these figures to some extent.
In vitro models of cells in stress-induced senescence-like phenotype have been generated. Historically authors, including ourselves, made the error of believing at first sight that cells in the stress-induced senescence-like phenotype were very similar to cells obtained after passaging at 20% O2. Between 2 and 3 days after exposure of fibroblasts to oxidative stress, including H2O2 and t-BHP, one could indeed detect overexpression of "senescence-associated" genes like p21WAF-1, fibronectin, osteonectin, SM22, apolipoprotein J, Mn-SOD, and α1(I)-procollagen. One could detect SA β-gal; the common deletion in mitochondrial DNA [10]; a decrease in c-fos mRNA level [50]; a decrease in AP-1 DNA-binding activity [6]; an overexpression of TGF-β1 [16], cyclin D1 [51], HSP27, pyruvate kinase [52], and cyclo-oxygenase-2 [53]; hypophosphorylated Rb [14]; increased de novo production of H2O2 [43]; DNA-binding activity of p53 (S. Zdanov and O. Toussaint, unpublished data); cdc42 and rac1 activation ([54] and this study); overexpression of caveolin-1 ([54] and A. Chretien et al., unpublished observation); etc. Afterward, one started to realize, by comparing the proteomes [52,55] and the transcriptomes [16], that, beyond common mechanisms, cells obtained after passaging at 20% O2 and exposure to sub-lethal oxidative stress also displayed differences in regard to gene expression. The long-term stress-specific changes have been termed "molecular scars" [56,57].
It was calculated that under 40% hyperoxia or after four treatments with t-BHP with a treatment at every two population doublings, compensatory cycling after stress was not sufficient to explain the observed telomere shortening, which was in favor of the existence of telomere shortening due to oxidative damage [58-60]. After a single exposure to H2O2 or five exposures to f-BHP within the same population doubling, telomere shortening due to oxidative DNA damage reached only 322±55 bp (H2O2) and 381 ± 139 bp (t-BHP) [58]. On one hand, this confirmed that stress-induced senescence-like phenotype can be observed even if the TRF shortening does not reach a minimal critical size of around 5 kb. On the other hand, this also suggested the possibility that limited telomere shortening could accumulate slowly within the life span of individuals, after local exposure(s) to sub-lethal oxidative stress.
Tissues are stochastically exposed to stressful agents during life. A good argument in favor of the stochastic evolution of tissues with aging is that the variability of the maximum number of population doublings that normal fibroblasts can make increases with the age of the donor, as clearly seen from published data [61]. Also fibroblasts taken from some human centenarians can make as many population doublings as fibroblasts from young donors, whereas fibroblasts from another centenarian will make only a few population doublings [62,63]. Such stochasticity is due in part to lifetime exposures to stress. Stochastic exposure to stress can be endogenous (local inflammation, microinflammation generating abnormal reactive oxygen species concentrations [64], etc.) or exogenous (exposure of skin fibroblasts to UV irradiation, for instance [65]), including therapeutic agents (for instance, psoralen ± UVA therapy [66]). Also it is likely that cells in a senescence-like phenotype could play a role in the age-related changes of tissues in a usual environment. One example is that human diploid fibroblasts in 20% O2-induced or H2O2-induced senescence-like phenotype can modify the physiology of preneoplastic keratinocytes [67], favoring their transformation, which is of paramount importance because cells in such stress-induced phenotype could accumulate during the life span, possibly explaining in part why the rate of cancer increases with aging [68].
The words "inadequate culture conditions" [49] were used to describe any stress-related senescence-like phenotype. However, stressful situations exist in vivo that might lead to such phenotype, especially in situations
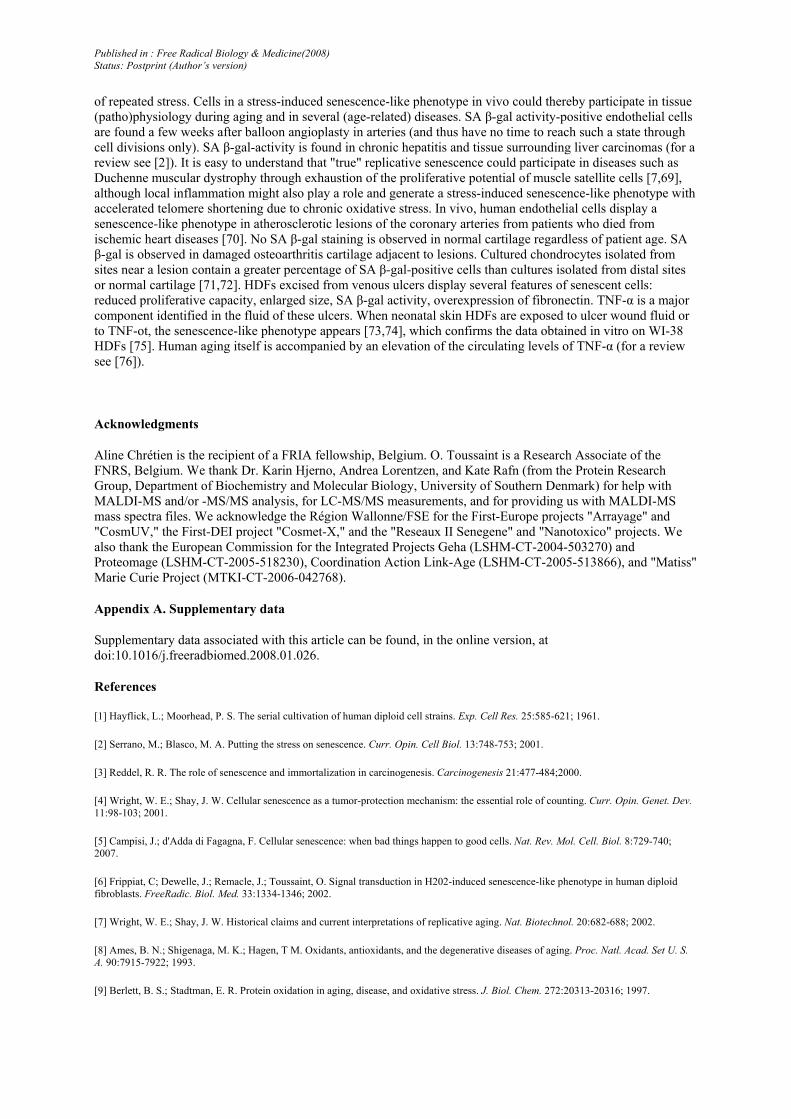
Published in : Free Radical Biology & Medicine(2008) Status: Postprint (Author’s version)
of repeated stress. Cells in a stress-induced senescence-like phenotype in vivo could thereby participate in tissue (patho)physiology during aging and in several (age-related) diseases. SA β-gal activity-positive endothelial cells are found a few weeks after balloon angioplasty in arteries (and thus have no time to reach such a state through cell divisions only). SA β-gal-activity is found in chronic hepatitis and tissue surrounding liver carcinomas (for a review see [2]). It is easy to understand that "true" replicative senescence could participate in diseases such as Duchenne muscular dystrophy through exhaustion of the proliferative potential of muscle satellite cells [7,69], although local inflammation might also play a role and generate a stress-induced senescence-like phenotype with accelerated telomere shortening due to chronic oxidative stress. In vivo, human endothelial cells display a senescence-like phenotype in atherosclerotic lesions of the coronary arteries from patients who died from ischemic heart diseases [70]. No SA β-gal staining is observed in normal cartilage regardless of patient age. SA β-gal is observed in damaged osteoarthritis cartilage adjacent to lesions. Cultured chondrocytes isolated from sites near a lesion contain a greater percentage of SA β-gal-positive cells than cultures isolated from distal sites or normal cartilage [71,72]. HDFs excised from venous ulcers display several features of senescent cells: reduced proliferative capacity, enlarged size, SA β-gal activity, overexpression of fibronectin. TNF-α is a major component identified in the fluid of these ulcers. When neonatal skin HDFs are exposed to ulcer wound fluid or to TNF-ot, the senescence-like phenotype appears [73,74], which confirms the data obtained in vitro on WI-38 HDFs [75]. Human aging itself is accompanied by an elevation of the circulating levels of TNF-α (for a review see [76]).
Acknowledgments
Aline Chrétien is the recipient of a FRIA fellowship, Belgium. O. Toussaint is a Research Associate of the FNRS, Belgium. We thank Dr. Karin Hjerno, Andrea Lorentzen, and Kate Rafn (from the Protein Research Group, Department of Biochemistry and Molecular Biology, University of Southern Denmark) for help with MALDI-MS and/or -MS/MS analysis, for LC-MS/MS measurements, and for providing us with MALDI-MS mass spectra files. We acknowledge the Région Wallonne/FSE for the First-Europe projects "Arrayage" and "CosmUV," the First-DEI project "Cosmet-X," and the "Reseaux II Senegene" and "Nanotoxico" projects. We also thank the European Commission for the Integrated Projects Geha (LSHM-CT-2004-503270) and Proteomage (LSHM-CT-2005-518230), Coordination Action Link-Age (LSHM-CT-2005-513866), and "Matiss" Marie Curie Project (MTKI-CT-2006-042768).
Appendix A. Supplementary data
Supplementary data associated with this article can be found, in the online version, at doi:10.1016/j.freeradbiomed.2008.01.026.
References
[1] Hayflick, L.; Moorhead, P. S. The serial cultivation of human diploid cell strains. Exp. Cell Res. 25:585-621; 1961.
[2] Serrano, M.; Blasco, M. A. Putting the stress on senescence. Curr. Opin. Cell Biol. 13:748-753; 2001.
[3] Reddel, R. R. The role of senescence and immortalization in carcinogenesis. Carcinogenesis 21:477-484;2000.
[4] Wright, W. E.; Shay, J. W. Cellular senescence as a tumor-protection mechanism: the essential role of counting. Curr. Opin. Genet. Dev. 11:98-103; 2001.
[5] Campisi, J.; d'Adda di Fagagna, F. Cellular senescence: when bad things happen to good cells. Nat. Rev. Mol. Cell. Biol. 8:729-740; 2007.
[6] Frippiat, C; Dewelle, J.; Remacle, J.; Toussaint, O. Signal transduction in H202-induced senescence-like phenotype in human diploid fibroblasts. FreeRadic. Biol. Med. 33:1334-1346; 2002.
[7] Wright, W. E.; Shay, J. W. Historical claims and current interpretations of replicative aging. Nat. Biotechnol. 20:682-688; 2002.
[8] Ames, B. N.; Shigenaga, M. K.; Hagen, T M. Oxidants, antioxidants, and the degenerative diseases of aging. Proc. Natl. Acad. Set U. S. A. 90:7915-7922; 1993.
[9] Berlett, B. S.; Stadtman, E. R. Protein oxidation in aging, disease, and oxidative stress. J. Biol. Chem. 272:20313-20316; 1997.
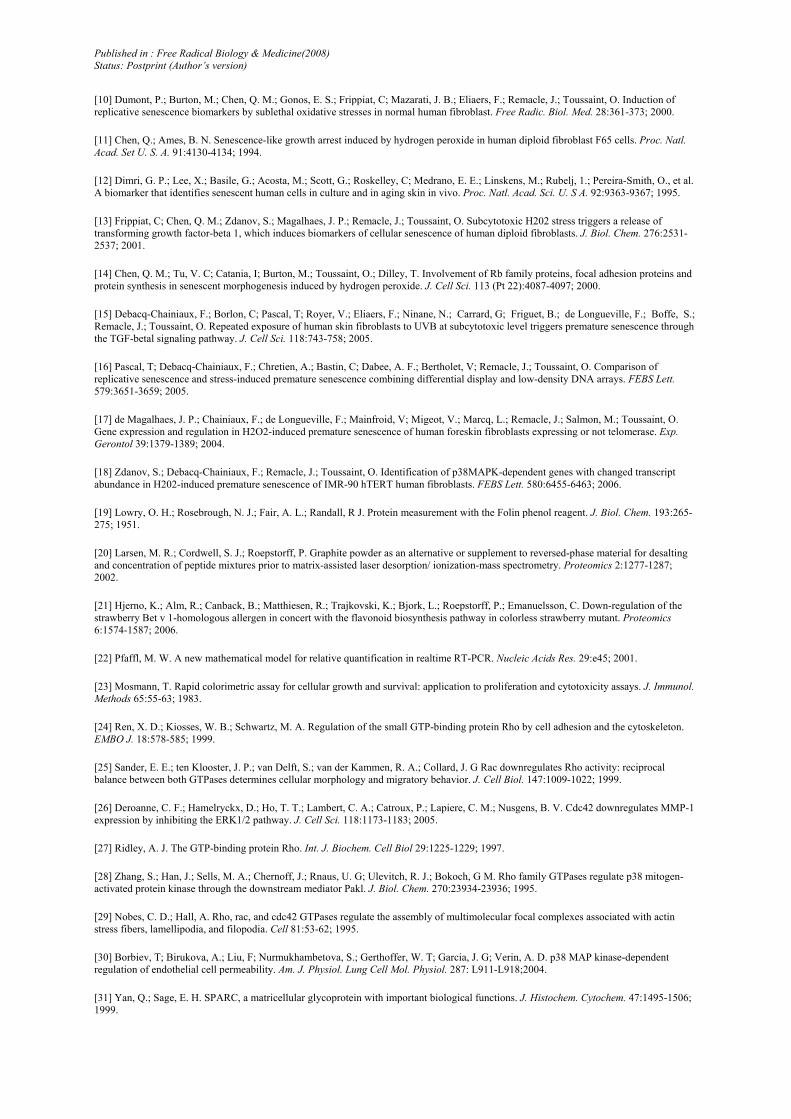
Published in : Free Radical Biology & Medicine(2008) Status: Postprint (Author’s version)
[10] Dumont, P.; Burton, M.; Chen, Q. M.; Gonos, E. S.; Frippiat, C; Mazarati, J. B.; Eliaers, F.; Remacle, J.; Toussaint, O. Induction of replicative senescence biomarkers by sublethal oxidative stresses in normal human fibroblast. Free Radic. Biol. Med. 28:361-373; 2000.
[11] Chen, Q.; Ames, B. N. Senescence-like growth arrest induced by hydrogen peroxide in human diploid fibroblast F65 cells. Proc. Natl. Acad. Set U. S. A. 91:4130-4134; 1994.
[12] Dimri, G. P.; Lee, X.; Basile, G.; Acosta, M.; Scott, G.; Roskelley, C; Medrano, E. E.; Linskens, M.; Rubelj, 1.; Pereira-Smith, O., et al. A biomarker that identifies senescent human cells in culture and in aging skin in vivo. Proc. Natl. Acad. Sci. U. S A. 92:9363-9367; 1995.
[13] Frippiat, C; Chen, Q. M.; Zdanov, S.; Magalhaes, J. P.; Remacle, J.; Toussaint, O. Subcytotoxic H202 stress triggers a release of transforming growth factor-beta 1, which induces biomarkers of cellular senescence of human diploid fibroblasts. J. Biol. Chem. 276:2531-2537; 2001.
[14] Chen, Q. M.; Tu, V. C; Catania, I; Burton, M.; Toussaint, O.; Dilley, T. Involvement of Rb family proteins, focal adhesion proteins and protein synthesis in senescent morphogenesis induced by hydrogen peroxide. J. Cell Sci. 113 (Pt 22):4087-4097; 2000.
[15] Debacq-Chainiaux, F.; Borlon, C; Pascal, T; Royer, V.; Eliaers, F.; Ninane, N.; Carrard, G; Friguet, B.; de Longueville, F.; Boffe, S.; Remacle, J.; Toussaint, O. Repeated exposure of human skin fibroblasts to UVB at subcytotoxic level triggers premature senescence through the TGF-betal signaling pathway. J. Cell Sci. 118:743-758; 2005.
[16] Pascal, T; Debacq-Chainiaux, F.; Chretien, A.; Bastin, C; Dabee, A. F.; Bertholet, V; Remacle, J.; Toussaint, O. Comparison of replicative senescence and stress-induced premature senescence combining differential display and low-density DNA arrays. FEBS Lett. 579:3651-3659; 2005.
[17] de Magalhaes, J. P.; Chainiaux, F.; de Longueville, F.; Mainfroid, V; Migeot, V.; Marcq, L.; Remacle, J.; Salmon, M.; Toussaint, O. Gene expression and regulation in H2O2-induced premature senescence of human foreskin fibroblasts expressing or not telomerase. Exp. Gerontol 39:1379-1389; 2004.
[18] Zdanov, S.; Debacq-Chainiaux, F.; Remacle, J.; Toussaint, O. Identification of p38MAPK-dependent genes with changed transcript abundance in H202-induced premature senescence of IMR-90 hTERT human fibroblasts. FEBS Lett. 580:6455-6463; 2006.
[19] Lowry, O. H.; Rosebrough, N. J.; Fair, A. L.; Randall, R J. Protein measurement with the Folin phenol reagent. J. Biol. Chem. 193:265-275; 1951.
[20] Larsen, M. R.; Cordwell, S. J.; Roepstorff, P. Graphite powder as an alternative or supplement to reversed-phase material for desalting and concentration of peptide mixtures prior to matrix-assisted laser desorption/ ionization-mass spectrometry. Proteomics 2:1277-1287; 2002.
[21] Hjerno, K.; Alm, R.; Canback, B.; Matthiesen, R.; Trajkovski, K.; Bjork, L.; Roepstorff, P.; Emanuelsson, C. Down-regulation of the strawberry Bet v 1-homologous allergen in concert with the flavonoid biosynthesis pathway in colorless strawberry mutant. Proteomics 6:1574-1587; 2006.
[22] Pfaffl, M. W. A new mathematical model for relative quantification in realtime RT-PCR. Nucleic Acids Res. 29:e45; 2001.
[23] Mosmann, T. Rapid colorimetric assay for cellular growth and survival: application to proliferation and cytotoxicity assays. J. Immunol. Methods 65:55-63; 1983.
[24] Ren, X. D.; Kiosses, W. B.; Schwartz, M. A. Regulation of the small GTP-binding protein Rho by cell adhesion and the cytoskeleton. EMBO J. 18:578-585; 1999.
[25] Sander, E. E.; ten Klooster, J. P.; van Delft, S.; van der Kammen, R. A.; Collard, J. G Rac downregulates Rho activity: reciprocal balance between both GTPases determines cellular morphology and migratory behavior. J. Cell Biol. 147:1009-1022; 1999.
[26] Deroanne, C. F.; Hamelryckx, D.; Ho, T. T.; Lambert, C. A.; Catroux, P.; Lapiere, C. M.; Nusgens, B. V. Cdc42 downregulates MMP-1 expression by inhibiting the ERK1/2 pathway. J. Cell Sci. 118:1173-1183; 2005.
[27] Ridley, A. J. The GTP-binding protein Rho. Int. J. Biochem. Cell Biol 29:1225-1229; 1997.
[28] Zhang, S.; Han, J.; Sells, M. A.; Chernoff, J.; Rnaus, U. G; Ulevitch, R. J.; Bokoch, G M. Rho family GTPases regulate p38 mitogen-activated protein kinase through the downstream mediator Pakl. J. Biol. Chem. 270:23934-23936; 1995.
[29] Nobes, C. D.; Hall, A. Rho, rac, and cdc42 GTPases regulate the assembly of multimolecular focal complexes associated with actin stress fibers, lamellipodia, and filopodia. Cell 81:53-62; 1995.
[30] Borbiev, T; Birukova, A.; Liu, F; Nurmukhambetova, S.; Gerthoffer, W. T; Garcia, J. G; Verin, A. D. p38 MAP kinase-dependent regulation of endothelial cell permeability. Am. J. Physiol. Lung Cell Mol. Physiol. 287: L911-L918;2004.
[31] Yan, Q.; Sage, E. H. SPARC, a matricellular glycoprotein with important biological functions. J. Histochem. Cytochem. 47:1495-1506; 1999.
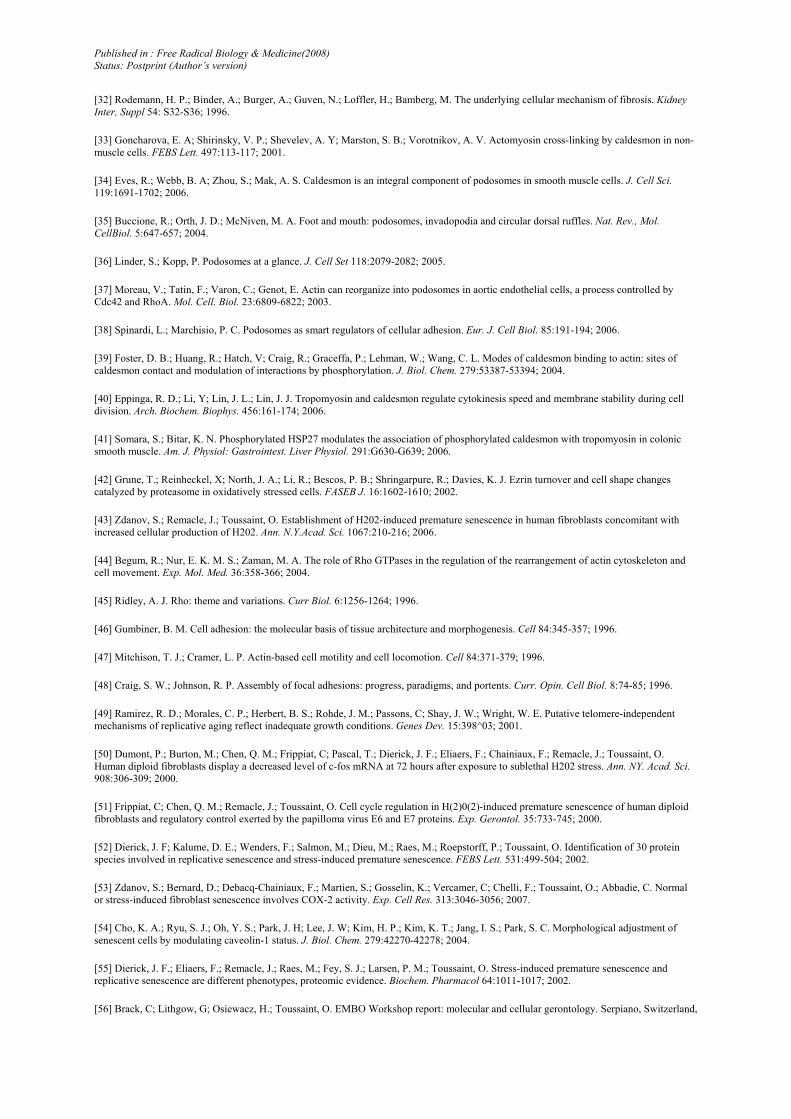
Published in : Free Radical Biology & Medicine(2008) Status: Postprint (Author’s version)
[32] Rodemann, H. P.; Binder, A.; Burger, A.; Guven, N.; Loffler, H.; Bamberg, M. The underlying cellular mechanism of fibrosis. Kidney Inter, Suppl 54: S32-S36; 1996.
[33] Goncharova, E. A; Shirinsky, V. P.; Shevelev, A. Y; Marston, S. B.; Vorotnikov, A. V. Actomyosin cross-linking by caldesmon in non-muscle cells. FEBS Lett. 497:113-117; 2001.
[34] Eves, R.; Webb, B. A; Zhou, S.; Mak, A. S. Caldesmon is an integral component of podosomes in smooth muscle cells. J. Cell Sci. 119:1691-1702; 2006.
[35] Buccione, R.; Orth, J. D.; McNiven, M. A. Foot and mouth: podosomes, invadopodia and circular dorsal ruffles. Nat. Rev., Mol. CellBiol. 5:647-657; 2004.
[36] Linder, S.; Kopp, P. Podosomes at a glance. J. Cell Set 118:2079-2082; 2005.
[37] Moreau, V.; Tatin, F.; Varon, C.; Genot, E. Actin can reorganize into podosomes in aortic endothelial cells, a process controlled by Cdc42 and RhoA. Mol. Cell. Biol. 23:6809-6822; 2003.
[38] Spinardi, L.; Marchisio, P. C. Podosomes as smart regulators of cellular adhesion. Eur. J. Cell Biol. 85:191-194; 2006.
[39] Foster, D. B.; Huang, R.; Hatch, V; Craig, R.; Graceffa, P.; Lehman, W.; Wang, C. L. Modes of caldesmon binding to actin: sites of caldesmon contact and modulation of interactions by phosphorylation. J. Biol. Chem. 279:53387-53394; 2004.
[40] Eppinga, R. D.; Li, Y; Lin, J. L.; Lin, J. J. Tropomyosin and caldesmon regulate cytokinesis speed and membrane stability during cell division. Arch. Biochem. Biophys. 456:161-174; 2006.
[41] Somara, S.; Bitar, K. N. Phosphorylated HSP27 modulates the association of phosphorylated caldesmon with tropomyosin in colonic smooth muscle. Am. J. Physiol: Gastrointest. Liver Physiol. 291:G630-G639; 2006.
[42] Grune, T.; Reinheckel, X; North, J. A.; Li, R.; Bescos, P. B.; Shringarpure, R.; Davies, K. J. Ezrin turnover and cell shape changes catalyzed by proteasome in oxidatively stressed cells. FASEB J. 16:1602-1610; 2002.
[43] Zdanov, S.; Remacle, J.; Toussaint, O. Establishment of H202-induced premature senescence in human fibroblasts concomitant with increased cellular production of H202. Ann. N.Y.Acad. Sci. 1067:210-216; 2006.
[44] Begum, R.; Nur, E. K. M. S.; Zaman, M. A. The role of Rho GTPases in the regulation of the rearrangement of actin cytoskeleton and cell movement. Exp. Mol. Med. 36:358-366; 2004.
[45] Ridley, A. J. Rho: theme and variations. Curr Biol. 6:1256-1264; 1996.
[46] Gumbiner, B. M. Cell adhesion: the molecular basis of tissue architecture and morphogenesis. Cell 84:345-357; 1996.
[47] Mitchison, T. J.; Cramer, L. P. Actin-based cell motility and cell locomotion. Cell 84:371-379; 1996.
[48] Craig, S. W.; Johnson, R. P. Assembly of focal adhesions: progress, paradigms, and portents. Curr. Opin. Cell Biol. 8:74-85; 1996.
[49] Ramirez, R. D.; Morales, C. P.; Herbert, B. S.; Rohde, J. M.; Passons, C; Shay, J. W.; Wright, W. E. Putative telomere-independent mechanisms of replicative aging reflect inadequate growth conditions. Genes Dev. 15:398^03; 2001.
[50] Dumont, P.; Burton, M.; Chen, Q. M.; Frippiat, C; Pascal, T.; Dierick, J. F.; Eliaers, F.; Chainiaux, F.; Remacle, J.; Toussaint, O. Human diploid fibroblasts display a decreased level of c-fos mRNA at 72 hours after exposure to sublethal H202 stress. Ann. NY. Acad. Sci. 908:306-309; 2000.
[51] Frippiat, C; Chen, Q. M.; Remacle, J.; Toussaint, O. Cell cycle regulation in H(2)0(2)-induced premature senescence of human diploid fibroblasts and regulatory control exerted by the papilloma virus E6 and E7 proteins. Exp. Gerontol. 35:733-745; 2000.
[52] Dierick, J. F; Kalume, D. E.; Wenders, F.; Salmon, M.; Dieu, M.; Raes, M.; Roepstorff, P.; Toussaint, O. Identification of 30 protein species involved in replicative senescence and stress-induced premature senescence. FEBS Lett. 531:499-504; 2002.
[53] Zdanov, S.; Bernard, D.; Debacq-Chainiaux, F.; Martien, S.; Gosselin, K.; Vercamer, C; Chelli, F.; Toussaint, O.; Abbadie, C. Normal or stress-induced fibroblast senescence involves COX-2 activity. Exp. Cell Res. 313:3046-3056; 2007.
[54] Cho, K. A.; Ryu, S. J.; Oh, Y. S.; Park, J. H; Lee, J. W; Kim, H. P.; Kim, K. T.; Jang, I. S.; Park, S. C. Morphological adjustment of senescent cells by modulating caveolin-1 status. J. Biol. Chem. 279:42270-42278; 2004.
[55] Dierick, J. F.; Eliaers, F.; Remacle, J.; Raes, M.; Fey, S. J.; Larsen, P. M.; Toussaint, O. Stress-induced premature senescence and replicative senescence are different phenotypes, proteomic evidence. Biochem. Pharmacol 64:1011-1017; 2002.
[56] Brack, C; Lithgow, G; Osiewacz, H.; Toussaint, O. EMBO Workshop report: molecular and cellular gerontology. Serpiano, Switzerland,
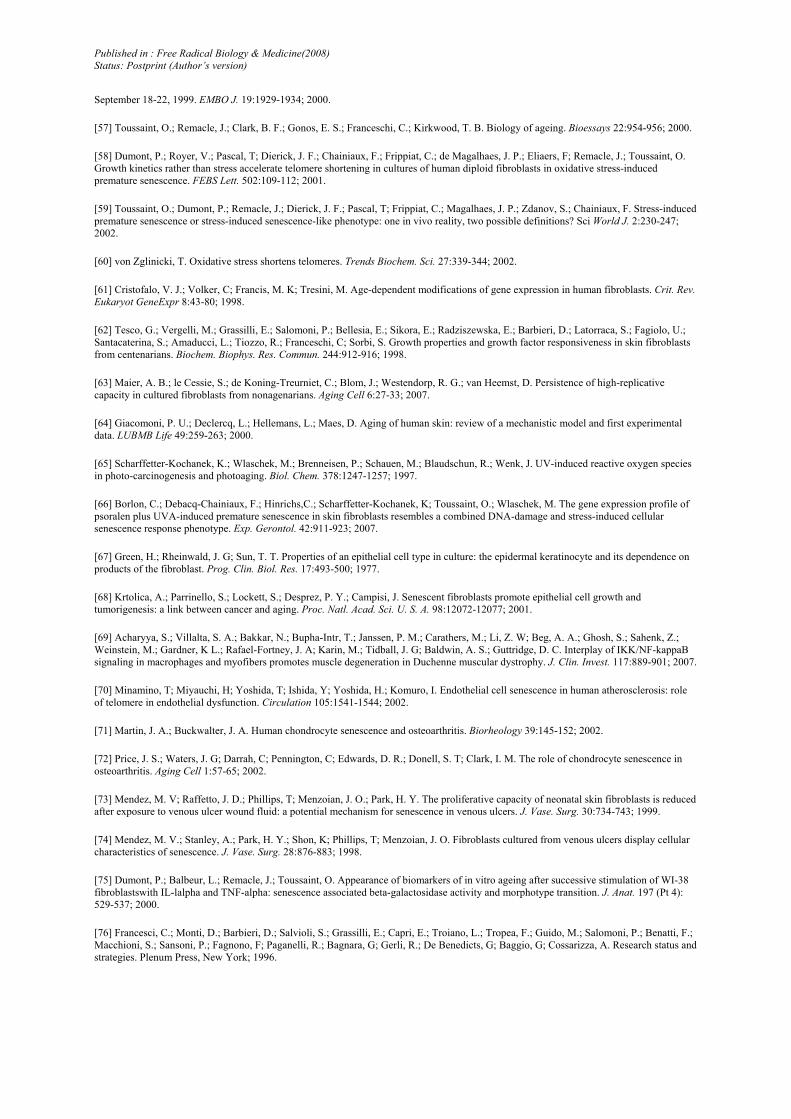
Published in : Free Radical Biology & Medicine(2008) Status: Postprint (Author’s version)
September 18-22, 1999. EMBO J. 19:1929-1934; 2000.
[57] Toussaint, O.; Remacle, J.; Clark, B. F.; Gonos, E. S.; Franceschi, C.; Kirkwood, T. B. Biology of ageing. Bioessays 22:954-956; 2000.
[58] Dumont, P.; Royer, V.; Pascal, T; Dierick, J. F.; Chainiaux, F.; Frippiat, C.; de Magalhaes, J. P.; Eliaers, F; Remacle, J.; Toussaint, O. Growth kinetics rather than stress accelerate telomere shortening in cultures of human diploid fibroblasts in oxidative stress-induced premature senescence. FEBS Lett. 502:109-112; 2001.
[59] Toussaint, O.; Dumont, P.; Remacle, J.; Dierick, J. F.; Pascal, T; Frippiat, C.; Magalhaes, J. P.; Zdanov, S.; Chainiaux, F. Stress-induced premature senescence or stress-induced senescence-like phenotype: one in vivo reality, two possible definitions? Sci World J. 2:230-247; 2002.
[60] von Zglinicki, T. Oxidative stress shortens telomeres. Trends Biochem. Sci. 27:339-344; 2002.
[61] Cristofalo, V. J.; Volker, C; Francis, M. K; Tresini, M. Age-dependent modifications of gene expression in human fibroblasts. Crit. Rev. Eukaryot GeneExpr 8:43-80; 1998.
[62] Tesco, G.; Vergelli, M.; Grassilli, E.; Salomoni, P.; Bellesia, E.; Sikora, E.; Radziszewska, E.; Barbieri, D.; Latorraca, S.; Fagiolo, U.; Santacaterina, S.; Amaducci, L.; Tiozzo, R.; Franceschi, C; Sorbi, S. Growth properties and growth factor responsiveness in skin fibroblasts from centenarians. Biochem. Biophys. Res. Commun. 244:912-916; 1998.
[63] Maier, A. B.; le Cessie, S.; de Koning-Treurniet, C.; Blom, J.; Westendorp, R. G.; van Heemst, D. Persistence of high-replicative capacity in cultured fibroblasts from nonagenarians. Aging Cell 6:27-33; 2007.
[64] Giacomoni, P. U.; Declercq, L.; Hellemans, L.; Maes, D. Aging of human skin: review of a mechanistic model and first experimental data. LUBMB Life 49:259-263; 2000.
[65] Scharffetter-Kochanek, K.; Wlaschek, M.; Brenneisen, P.; Schauen, M.; Blaudschun, R.; Wenk, J. UV-induced reactive oxygen species in photo-carcinogenesis and photoaging. Biol. Chem. 378:1247-1257; 1997.
[66] Borlon, C.; Debacq-Chainiaux, F.; Hinrichs,C.; Scharffetter-Kochanek, K; Toussaint, O.; Wlaschek, M. The gene expression profile of psoralen plus UVA-induced premature senescence in skin fibroblasts resembles a combined DNA-damage and stress-induced cellular senescence response phenotype. Exp. Gerontol. 42:911-923; 2007.
[67] Green, H.; Rheinwald, J. G; Sun, T. T. Properties of an epithelial cell type in culture: the epidermal keratinocyte and its dependence on products of the fibroblast. Prog. Clin. Biol. Res. 17:493-500; 1977.
[68] Krtolica, A.; Parrinello, S.; Lockett, S.; Desprez, P. Y.; Campisi, J. Senescent fibroblasts promote epithelial cell growth and tumorigenesis: a link between cancer and aging. Proc. Natl. Acad. Sci. U. S. A. 98:12072-12077; 2001.
[69] Acharyya, S.; Villalta, S. A.; Bakkar, N.; Bupha-Intr, T.; Janssen, P. M.; Carathers, M.; Li, Z. W; Beg, A. A.; Ghosh, S.; Sahenk, Z.; Weinstein, M.; Gardner, K L.; Rafael-Fortney, J. A; Karin, M.; Tidball, J. G; Baldwin, A. S.; Guttridge, D. C. Interplay of IKK/NF-kappaB signaling in macrophages and myofibers promotes muscle degeneration in Duchenne muscular dystrophy. J. Clin. Invest. 117:889-901; 2007.
[70] Minamino, T; Miyauchi, H; Yoshida, T; Ishida, Y; Yoshida, H.; Komuro, I. Endothelial cell senescence in human atherosclerosis: role of telomere in endothelial dysfunction. Circulation 105:1541-1544; 2002.
[71] Martin, J. A.; Buckwalter, J. A. Human chondrocyte senescence and osteoarthritis. Biorheology 39:145-152; 2002.
[72] Price, J. S.; Waters, J. G; Darrah, C; Pennington, C; Edwards, D. R.; Donell, S. T; Clark, I. M. The role of chondrocyte senescence in osteoarthritis. Aging Cell 1:57-65; 2002.
[73] Mendez, M. V; Raffetto, J. D.; Phillips, T; Menzoian, J. O.; Park, H. Y. The proliferative capacity of neonatal skin fibroblasts is reduced after exposure to venous ulcer wound fluid: a potential mechanism for senescence in venous ulcers. J. Vase. Surg. 30:734-743; 1999.
[74] Mendez, M. V.; Stanley, A.; Park, H. Y.; Shon, K; Phillips, T; Menzoian, J. O. Fibroblasts cultured from venous ulcers display cellular characteristics of senescence. J. Vase. Surg. 28:876-883; 1998.
[75] Dumont, P.; Balbeur, L.; Remacle, J.; Toussaint, O. Appearance of biomarkers of in vitro ageing after successive stimulation of WI-38 fibroblastswith IL-lalpha and TNF-alpha: senescence associated beta-galactosidase activity and morphotype transition. J. Anat. 197 (Pt 4): 529-537; 2000.
[76] Francesci, C.; Monti, D.; Barbieri, D.; Salvioli, S.; Grassilli, E.; Capri, E.; Troiano, L.; Tropea, F.; Guido, M.; Salomoni, P.; Benatti, F.; Macchioni, S.; Sansoni, P.; Fagnono, F; Paganelli, R.; Bagnara, G; Gerli, R.; De Benedicts, G; Baggio, G; Cossarizza, A. Research status and strategies. Plenum Press, New York; 1996.