ROLE OF PEROXISOME PROLIFERATOR ACTIVATED … filei role of peroxisome proliferator activated...
38
i ROLE OF PEROXISOME PROLIFERATOR ACTIVATED RECEPTOR-γ ( PPARγ) LIGANDS ON THE FOAM CELL FORMATION DERIVED FROM MNV-1 INFECTED MACROPHAGES by KHIRUN BINTI MUSA Thesis submitted in fulfillment of the requirements for the degree of Master of Science August 2017
Transcript of ROLE OF PEROXISOME PROLIFERATOR ACTIVATED … filei role of peroxisome proliferator activated...
i
ROLE OF PEROXISOME PROLIFERATOR ACTIVATED RECEPTOR-γ ( PPARγ) LIGANDS ON THE FOAM CELL FORMATION DERIVED
FROM MNV-1 INFECTED MACROPHAGES
by
KHIRUN BINTI MUSA
Thesis submitted in fulfillment of the requirements
for the degree of
Master of Science
August 2017
ii
ACKNOWLEDGEMENT
First and foremost, I would like to express my thanks and gratefulness to Allah
S.W.T that has awarded me new opportunity, strength, and good health on
completing my research project and thesis. I also would like to express my gratitude
to my supervisors, Dr. Rafeezul bin Mohamed, Dr. Muhammad Amir bin Yunus and
Dr. Ida Shazrina binti Ismail for their patience and guidance for helping me to
accomplish this study. Without their encouragement, support and advice, this
dissertation would not be completed. I would also like to thanks my laboratory
members: Azali Azlan, Nur Sakinah, Laina Zarisa, Mowaffaq Adam Ahmed, Syamil,
Siti Fadhilah, Nalini and Nithya for their support and company throughout this
project that keep me cheerful and motivated.
Also a special thanks to USM staff for their help throughout my studies. I also would
like thanks to MyBrain15 (Ministry of Higher Education, Malaysia) for the funding
of MyMaster scholarship scheme.
Last but not least, I would like to express my sincere gratitude to my beloved parents
and family for their unconditional love, support and understanding. Their
encouragement and continuous support is the main pillar that keeps me motivated
throughout this study.
iii
TABLE OF CONTENTS
ACKNOWLEDGEMENT .......................................................................................... i
TABLE OF CONTENTS ......................................................................................... iii
LIST OF TABLES ................................................................................................. viii
LIST OF FIGURES .................................................................................................. ix
LIST OF SYMBOLS AND ABBREVIATIONS .................................................... xii
ABSTRAK ................................................................................................................ xv
ABSTRACT ............................................................................................................ xvii
CHAPTER 1: LITERATURE REVIEW ................................................................. 1
1.1 Atherosclerosis ....................................................................................................... 1
1.2 Lipoprotein ............................................................................................................. 2
1.2.1 Lipoprotein physiology ................................................................................ 3
1.2.2 Chylomicrons (CM) ..................................................................................... 5
1.2.3 Very Low Density Lipoproteins (VLDL) .................................................... 5
1.2.4 Low Density Lipoproteins (LDL) ................................................................ 6
1.2.5 High Density Lipoproteins (HDL) ............................................................... 7
1.2.6 Oxidised Low Density Lipoprotein (oxLDL) .............................................. 8
1.3 Atherosclerosis development (atherogenesis) ........................................................ 9
1.3.1 Structure of arterial wall .............................................................................. 9
1.3.2 Fatty streaks formation .............................................................................. 10
1.3.3 Formation of the fibrous cap (early fibroatheroma or complex lesions) .. 13
1.3.4 Thrombosis ................................................................................................ 13
1.4 Role of infectious agents in atherosclerosis ......................................................... 14
1.5 Norovirus ............................................................................................................. 15
1.5.1 Murine norovirus (MNV) .......................................................................... 16
iv
1.5.2 The association of MNV infection with atherogenesis .............................. 18
1.6 Peroxisome Proliferator Activated Receptor (PPAR) .......................................... 19
1.6.1 Peroxisome Proliferator Activated Receptor (PPAR) structure ................. 19
1.6.2 Peroxisome Proliferator Activated Receptorγ (PPARγ) ........................... 20
1.6.3 PPARγ genomic organization .................................................................... 21
1.6.4 PPARγ activation ....................................................................................... 23
1.6.5 PPAR γ ligand ............................................................................................ 24
1.6.6 PPARγ and atherosclerosis ........................................................................ 25
1.7 Rationale of the study........................................................................................... 29
1.8 Project aims and objectives .................................................................................. 29
CHAPTER 2: METHODOLOGY .......................................................................... 30
2.1 Chemicals and suppliers ....................................................................................... 30
2.2 Cell lines .............................................................................................................. 32
2.2.1 Complete growth medium .......................................................................... 32
2.2.2 Culture condition ....................................................................................... 33
2.2.3 Culturing RAW264.7 cell line ................................................................... 33
2.2.4 Culturing BV2 cell line .............................................................................. 33
2.2.5 Culturing BSRT7 cell line ........................................................................ 33
2.3 Production of recombinant MNV1 ..................................................................... 34
2.3.1 Plasmid linearization and purification using silica column ....................... 34
2.3.2 Agarose gel electrophoresis ....................................................................... 34
2.3.3 In-vitro transcription .................................................................................. 35
2.3.4 RNA capping using ScriptCap™ m7 G Capping System .......................... 35
2.3.5 Transfection of enzymaticallycapped transcribedRNA into BSRT7 cells
.................................................................................................................... 36
2.3.6 Determination of the viral titre (TCID50) ................................................. 36
v
2.3.7 Protein analysis .......................................................................................... 36
2.3.7(a) Protein quantification ................................................................... 36
2.3.7(b) Sodium dodecyl sulfate polyacrylamide gel electrophoresis (SDS
PAGE) ........................................................................................ 37
2.3.7(c) Western blot analysis ................................................................... 37
2.3.7(d) Immunodetection of NS7 proteins ............................................... 38
2.4 Single step viral growth curve.............................................................................. 38
2.4.1 Infection of RAW264.7 cell line with MNV1 for viral growth curves .... 38
2.4.2 Isolation of total RNA using GenElute™ Mammalian Total RNA Miniprep
Kit .............................................................................................................. 39
2.4.2(a) Measurement of RNA purity and concentration .......................... 40
2.4.3 cDNA synthesis (for conventional PCR assay) ......................................... 40
2.4.3(a) Verification of cDNA synthesis ................................................... 40
2.4.4 PCR analysis to verify MNV1 infection in RAW264.7 cell. ................... 41
2.4.5 Western blot analysis to detect NS7 protein of MNV1 in infected
RAW264.7 ................................................................................................. 42
2.4.6 Determination of the viral titre (TCID50) ................................................. 42
2.5 Effect of MNV1 infection, oxLDL and PPAR ligands treatment towards
RAW264.7 cells ................................................................................................... 42
2.5.1 LDL isolation ............................................................................................. 43
2.5.2 MNV1 infection in RAW264.7 cells ........................................................ 43
2.5.3 RAW 264.7 cells treatment with oxLDL, MNV1, and PPARγ ligand ..... 44
2.6 Oil red O staining ................................................................................................. 44
2.7 Cholesterol ester (CE) measurement .................................................................... 44
2.8 Statistical analysis ................................................................................................ 45
vi
CHAPTER 3: RESULTS ......................................................................................... 46
3.1 Production of infectious MNV1 particles using RNAbased reverse genetics
system. .................................................................................................................. 46
3.1.1 Plasmid linearisation .................................................................................. 46
3.1.2 In-vitro transcription .................................................................................. 48
3.1.3 Enzymatically capping of purified RNA transcripts .................................. 49
3.1.4 Delivery of enzymatically capped RNA transcripts into BSRT7 cells..... 50
3.1.4(a) Tissue culture infective dose (TCID50) ....................................... 51
3.1.4(b)Western blot analysis .................................................................... 51
3.2 Single Step Growth Curve of MNV1 ................................................................. 52
3.2.1 Virus titers from single step growth curve assay ....................................... 52
3.2.2 Detection of viral RNA using reverse transcribe polymerase chain reaction
.................................................................................................................... 53
3.2.3 MNV1 NS7 protein detection analysis from single step growth curve
assay ........................................................................................................... 55
3.3 Association of PPARγ with foam cells formation in MNV1 infected
macrophage cells .................................................................................................. 56
3.3.1 Verification of MNV1 infection ............................................................... 58
3.3.1(a) PCR amplification of targeted MNV1 subgenomic region ........ 58
3.3.1(b) Titration of MNV1 infectious particles ...................................... 60
3.3.2 Microscopic visualisation of foam cells formation by Oil red O staining . 61
3.3.3 Cholesterol Ester (CE) Measurement ........................................................ 66
3.3.3(a) Cholesterol ester (CE) content increased over the time in all
treated RAW264.7 cells .............................................................. 67
3.3.3(b) oxLDL increased CE content in the treated RAW264.7 cells in
the presence of MNV1, ciglitazone and 15dPGJ2 ................... 68
3.3.3(c) MNV1 infection not elicit CE content in oxLDLtreated
vii
RAW264.7 cells ............................................................................ 69
3.3.3(d) 15dPGJ2 increased CE content in oxLDL treated RAW264.7
cells ............................................................................................. 70
3.3.3(e) Ciglitazone reduced CE content in oxLDL and MNV1 treated
RAW264.7 cells. ........................................................................ 71
CHAPTER 4: DISCUSSION .................................................................................. 72
CHAPTER 5: CONCLUSION, LIMITATION AND FUTURE STUDIES ....... 82
5.1 Conclusion ........................................................................................................... 82
5.2 Limitation of the study ......................................................................................... 83
5.3 Future studies ....................................................................................................... 83
REFERENCES
APPENDICES
viii
LIST OF TABLES
Table 2.1
Table 2.2
Table 2.3
Table 2.4
Table 3.1
Materials used in this study
Polyacrylamide Gel Electrophoresis
Primer used to detect MNV1 infection using conventional PCR.
Amplex Red reagent/HRP/cholesterol oxidase/cholesterol esterase working solution
Treatments and their objectives
Page
30
37
41
45
57
ix
LIST OF FIGURES
Figure 1.1
Figure 1.2
Figure 1.3
Figure 1.4
Figure 1.5
Figure 1.6
Figure 1.7
Figure 1.8
Figure 1.9
Figure 1.10
Figure 3.1
Figure 3.2
Figure 3.3
Figure 3. 4
Figure 3.5
Lipoprotein metabolism
Schematic diagram of the lowdensitylipoprotein (LDL)
Recruitment of monocytes and formation of foam cells
Stages in the development of atherosclerotic lesions
Illustration of MNV genome organisation
Schematic representation of the PPAR structure
Promoter organization of the human PPARγ gene
PPARγ transcriptional activation
Mechanisms that act to protect cells from toxic effects of free
cholesterol.
PPAR signaling pathways influence macrophage gene
expression and foamcell formation
Illustration of MNV genome and plasmid for the recovery of
infectious virus
Analysis of linearised plasmids.
Analysis of purified MNV1 RNA transcripts integrity
Analysis of MNV1 RNA trancripts integrity after capping
reaction
Virus titer (TCID50) of MNV1 recovery using RNAbased
reverse genetics method
Page
4
7
12
14
18
20
23
24
27
28
47
48
49
50
51
x
Figure 3.6
Figure 3.7
Figure 3.8
Figure 3.9
Figure 3.10
Figure 3.11
Figure 3.12
Figure 3.13
Figure 3.14
Figure 3.15
Figure 3.16
Western blot analysis of NS7 viral protein inthe lysate of 48
hours posttransfectionin BSRT7 cells (WT, F/S and ∆NS7)
Virus titer (TCID50) analysis of RAW264.7 cells infected
MNV1 at 6, 12, 24 and 48 hours post infection
Detection of genomic MNV1amplicon in uninfected and
MNV1 infected RAW264.7 cell at 6, 12, 24 and 48 hours
Detection of subgenomic MNV1 amplicon in uninfected and
MNV1infected RAW264.7 cell at 6, 12, 24 and 48 hours
Western blot analysis of MNV1 NS7 protein expression in
uninfected and MNV1infected RAW264.7 cells at 6, 12, 24
and 48 hours post infections
Verification of MNV1infection in all culture conditions at
respective time points (6, 12, 24 hours) by PCR
Virus titre analysis for all samples at 6, 12 and 24 hours post
infection by TCID50
Microscopic visualisation of foam cell formation in RAW,
RAW+ciglitazone, RAW+15dPGJ2 at 6, 12 and 24 hours
Microscopic visualization of foam cell formation in
RAW+MNV, RAW+MNV+ciglitazone and
RAW+MNV+15dPGJ2 at 6, 12 and 24 hours
Microscopic visualization of foam cell formation in
RAW+oxLDL, RAW+oxLDL+ciglitazone,
RAW+oxLDL+15dPGJ2 at 6, 12 and 24 hours
Microscopic visualization of foam cell formation in
RAW+oxLDL+MNV, RAW+oxLDL+MNV+ciglitazone and
RAW+oxLDL+MNV+15dPGJ2 at 6, 12 and 24 hours
52
53
54
55
56
59
61
62
63
64
65

xi
Figure 3.17
Figure 3.18
Figure 3.19
Figure 3.20
Figure 3.21
Figure 3.22
Standard curve representative for CE measurement calculation
CE measurement of RAW264.7 cells treated with MNV1,
oxLDL and PPARγ ligand (ciglitazone and 15dPGJ2)
Measurement of CE content in treated RAW264.7 cells after
24 hours.
Measurement of CE content in treated RAW264.7 cells after
24 hours.
Measurement of CE content in treated RAW264.7 cells after
24 hours.
Measurement of CE content in treated RAW264.7 cells after
24 hours.
66
67
68
69
70
71
xii
LIST OF SYMBOLS AND ABBREVIATIONS
ABCA1
ABCG1
AF
apoA
apoB
apoC
apoE
BAT
CD36
CETP
CM
CMV
CVD
DBD
DNA
LDL
EC
FA
ATPBinding Cassette transporter A1
ATPBinding Cassette transporter A1
Activation Function
Apolipoprotein A
Apolipoprotein B
Apolipoprotein C
Apolipoprotein E
Brown Adipose Tissue
Cluster of differentiation 36
Cholesteryl Ester Transfer Protein
Chylomicron
Cytomegalovirus
Cardiovascular Diseases
DNA Binding Domain
Deoxyribonucleic Acid
Low Density Lipoprotein
Endothelial Cell
Fatty Acid
xiii
FC
FFA
HDL
HCV
HIV
ICAM1
IDL
LBD
LCAT
LDLR
LPL
MCP1
MCSF
MMP
MNV
OxLDL
ORF
PLTP
PPAR
Free Cholesterol
Free Fatty Acid
High Density Lipoprotein
Hepatitis C Virus
Human Immunodeficiency Virus
Intracellular Adhesion Molecule
Intermediate Density Lipoprotein
Ligand Binding Domain
Lechithincholesterol Transferase
Low Density Lipoprotein (LDL) Receptor
Lipoprotein Lipase
Monocyte Chemoattractant Protein1
Macrophage ColonyStimulating Factor
Matrix Metalloproteinase
Murine Norovirus
Oxidised Low Density Lipoprotein
Open Reading Frame
Phospholipid Transfer Protein
Peroxisome Proliferator Activated Receptor
xiv
PPRE
PUFA
RNA
RXR
SMC
SRBI
SRA1
TZD
VCAM1
VF1
VLDL
VP1
VP2
15dPGJ2
Peroxisome Proliferator Response Element
Polyunsaturaed Fatty Acid
Ribonucleic Acid
Retinoid X Receptor
Smooth Muscle Cell
Scavenger Receptor BI
Scavenger Receptor A1
Thiazolidinedione
Vascular Adhesion Molecule1
Virulence Factor 1
Very Low Density Lipoprotein
Viral Protein 1
Viral protein 2
15 deoxy Δprostaglandin J2
xv
PERANAN LIGAND RESEPTOR PEROKSISOM PROLIFERATOR-γ YANG
DIAKTIFKAN (PPAR-γ) TERHADAP PEMBENTUKAN SEL BUSA
DARIPADA MAKROFAJ YANG DIJANGKITI MNV-1
ABSTRAK
Aterosklerosis adalah penyakit kronik yang berpunca daripada pengumpulan
sel busa daripada makrofaj di dalam lapisan intima pada arteri. Kajian yang telah
dilakukan menunjukkan MNV4 dapat mempercepatkan pembentukan aterosklerosis
pada tikus. Memandangkan PPARγ kebanyakannya diekspresi di dalam makrofaj,
manakala MNV1 dapat menjangkiti makrofaj, kami membuat hipotesis bahawa
PPARγ ligand (ciglitazone and 5dPGJ2) boleh mengawalselia pembentukan
aterosklerosis dengan mengawal pembentukan sel busa daripada makrofaj yang
dijangkiti MNV1. Kajian ini akan mendedahkan pengawalaturan PPARγ ligand
pada pembentukan sel busa daripada sel makrofaj tikus (RAW264.7) yang dijangkiti
MNV1. Di dalam kajian ini, MNV1 rekombinan dihasilkan melalui kaedah sistem
genetik songsang dan hasilnya digunakan untuk merawat RAW264.7 bersama
oxLDL dan PPARγ ligand. Selepas itu, selsel yang dijangkiti disahkan
menggunakan tindakbalas rantai polimerase (PCR). Pembentukan sel busa dinilai
dengan menggunakan pewarnaan minyak merah yang dianalisis menggunakan
visualisasi mikroskopik dan kandungan kolesterol ester dalam RAW264.7 yang
dirawat ditentukan dengan menggunakan kit pengukuran kolesterol ester Amplex
Red. Aplikasi sistem genetik songsang berasaskan RNA berjaya menghasilkan
MNV1 yang berjangkit dengan hasil sebanyak 4.18 Log10TCID50/ml apabila
diukur melalui titrasi menggunakan sel BV2. Keputusan kajian menunjukkan sampel
xvi
RAW+oxLDL+MNV+15dPGJ2 merekodkan titer virus yang tertinggi diikuti
dengan RAW+MNV+15dPGJ2 pada 6, 12 and 24 jam. Manakala titer virus yang
terendah direkodkan oleh sampel RAW+MNV+ciglitazone dan RAW+oxLDL+
MNV+ciglitazone. Pemerhatian mikroskopik pewarnaan minyak merah telah
menunjukkan bahawa oxLDL boleh merangsang pembentukan sel busa dari masa ke
masa dalam sel RAW264.7. Penambahan PPARγ ligand juga meningkatkan
pengumpulan titisan lipid. Analisis menggunakan kaedah twoway ANOVA
menunjukkan kesemua rawatan, jangka masa dan rawatan berbanding jangka masa
mempunyai interaksi yang signifikan untuk semua rawatan. Perbandingan pada 24
jam telah dipilih dan rawatan oxLDL pada sel RAW264.7 didapati meningkatkan
kandungan kolesterol ester secara signifikan. Bagaimanapun penglibatan MNV1
tidak menunjukkan kenaikan kandungan kolesterol ester dalam semua sampel yang
dirawat dengan oxLDL. Rawatan ciglitazone menunjukkan pengurangan kandungan
kolesterol ester untuk semua rawatan kecuali sampel RAW+oxLDL+ciglitazone
manakala 15dPGJ2 tidak menunjukkan kesan yang ketara dalam pengurangan tahap
kolesterol ester dalam semua rawatan. Kesimpulannya, berdasarkan kaedah
pemulihan RNA virus yang digunakan dalam kajian ini berjaya menghasilkan MNV
1 yang ditentukan genetiknya dan mampu berjangkit. oxLDL boleh merangsang sel
busa dengan mendepositkan titisan lemak di dalam sitosol dan meningkatkan
kandungan kolesterol ester. Jangkitan MNV1 tidak menyebabkan pembentukan sel
busa. Selain itu, 15dPGJ2 dapat menggalakkan pembentukan sel busa. Akhir sekali,
MNV1 dan ciglitazone bekerja secara sinergi untuk merencatkan pembentukan sel
busa.
xvii
ROLE OF PEROXISOME PROLIFERATOR ACTIVATED RECEPTOR-γ
(PPARγ) LIGANDS ON THE FOAM CELL FORMATION DERIVED FROM
MNV-1 INFECTED MACROPHAGES
ABSTRACT
Atherosclerosis is a chronic inflammatory disease initiated by the
accumulation of macrophagederived foam cells in the intima layer of artery. Murine
norovirus4 (MNV4) has been shown to accelerate atherogenesis and increased
macrophages content in atherosclerotic lesion in mice. Since PPARγ is predominatly
expressed in macrophages whereby MNV1 has a tropism for macrophages, we
hypothesise that PPARγ ligands (ciglitazone and 15dPGJ2) may regulate
atherogenesis by controlling the formation of MNV1infected macrophages derived
foam cells. In the current study, recombinant MNV1 was produced using RNA
based reverse genetics system and was used to treat the RAW264.7 cells with
oxLDL, ciglitazone and 15dPGJ2. Subsequently, infected cells were assayed for
viral infection confirmation using polymerase chain reaction (PCR). Foam cells
formation were assessed by microscopic visualisation of lipid droplets using Oil Red
O (ORO) staining and measurement of Cholesterol Ester (CE) content in the treated
RAW264.7 by using Amplex Red Cholesterol Ester measurement kit. The
application of RNA based reverse genetic system had successfully generated
infectious MNV1 at yields of 4.18 Log10TCID50/ml dishes as measured by titration
in BV2 cells. The result also showed that RAW+oxLDL+MNV+15dPGJ2 sample
produced the highest viral titres followed by RAW+MNV+15dPGJ2. Meanwhile,
the lowest virus titres recorded by RAW+MNV+ciglitazone and
xviii
RAW+oxLDL+MNV+ciglitazone. Microscopic visualisation of lipid droplets
showed that oxLDL increased the accumulation of lipid droplets over the time in
RAW264.7 cells. Addition of MNV1, ciglitazone and 15dPGJ2 in oxLDLtreated
RAW264.7 cells also increased deposition of lipid droplets in the cytosol of treated
cells. Twoway ANOVA has shown that the test for all treatment, time point and
treatment versus time point had significant interaction. At 24 hours, we have found
that oxLDL treatment in RAW264.7 cells in the presence of MNV1, ciglitazone and
15dPGJ2 significantly increased CE contents. MNV1 infection did not elicit CE
content in oxLDLtreated RAW264.7 cells. In addition, 15dPGJ2 but not ciglitazone
increased CE content in oxLDLtreated RAW264.7 cells. MNV1 and ciglitazone
had synergistic effect in reducing CE content in oxLDLtreated RAW264.7 cells. In
conclusion, RNA based virus recovery method used in the current study successfully
produced genetically define infectious MNV1. OxLDL stimulated foam cells
formation by depositing lipid droplets in the cytosol areas and increased CE contents.
MNV1 infection may not trigger foam cells formation. On the other hand, 15dPGJ2
may promote foam cells formation. Finally, MNV1 and ciglitazone work in synergy
in inhibiting foam cells formation.
1
CHAPTER 1: LITERATURE REVIEW
1.1 Atherosclerosis
Atherosclerosis is defined as hardening and narrowing of the arteries due to
accumulation of lipid laden foam cells and it can be considered as a lipidmediated
disease (CollotTeixeira et al., 2007; Rader and Daugherty, 2008; Samson, Mundkur
and Kakkar, 2012; Chung and Vafai, 2013; Annema, Eckardstein and Kovanen,
2015). Aggregation of cholesterolloaded macrophages in the arterial wall can cause
chronic inflammatory disease that derives from an imbalance in lipid metabolism and
a maladaptive immune response (Reiss et al., 2004; Moore, Sheedy and Fisher,
2013). Atherosclerotic plaques tend to formed at the branch points of arteries which
leads to disturbed or insufficient laminar flow to maintain the normal state of
endothelium (Insull, 2009; Moore, Sheedy and Fisher, 2013).
Atherosclerosis can lead to various cardiovascular diseases (CVD) such as
myocardial infarction, stroke, coronary revascularization, angina pectoris, ischemic
electrocardiographic changes, peripheral artery surgery, intermittent claudication
(pain at rest), gangrene and loss of function (Moreno, 2003; Nagy et al., 2012;
Frostegård, 2013; Pawlak, Mysliwiec and Pawlak, 2013; de Gaetano et al., 2015).
According to World Health Organisation (WHO), CVD is a major cause of global
mortality and estimated number of CVD cases will rise to 23.6 million by 2030
(Samson, Mundkur and Kakkar, 2012). Furthermore, CEO of the National Heart
Institute (IJN) has reported that there is a 5% increase in the number of cases IJN
treats every year, with 10,000 cases of cardiology and hypertension and 4,000 cases
of heart surgery. Previous study also has show that coronary artery disease (CAD) is
one of the major cause of mortality and morbidity in Malaysia (Seong et al., 2016).
2
Arterial wall can increasing its external diameter to assist the plaque development
without narrowing of the lumen in response to plaque growth thus explaining why
atherosclerosis is asymptomatic until the last stage where the artery is totally clot and
blocked (thrombosis) (Stocker and Keaney, 2004; Tedgui et al., 2006). Oxidised low
density lipoprotein (oxLDL) and recruitment of leukocytes play a pivotal role in
initiation of atherosclerosis development (Libby, Ridker and Maseri, 2002; Milioti et
al., 2008; Samson, Mundkur and Kakkar, 2012; Pawlak, Mysliwiec and Pawlak,
2013). Modifications of lowdensity lipoproteins (LDL) via oxidation process result
in modification of their structure and function that can activate both innate and
adaptive immune system (Nagy et al., 1998; Kearney, 2000; Chawla et al., 2001;
Stocker and Keaney, 2004; Itabe, 2009). Atherosclerosis also can caused by other
risk factors including hypertension, smoking, diabetes mellitus, genetic
predisposition, and obesity (Willeit et al., 2000; Hadi, Carr and Al Suwaidi, 2005;
Homem de Bittencourt et al., 2007; Insull, 2009; Azhar, 2010). Cigarette smoking
and diabetes also can affect vascular biology but unfortunately, the mechanisms is
less well understood (Libby, Ridker and Hansson, 2011).
1.2 Lipoprotein
Lipoproteins are particles that compose of hydrophobic core containing
phospholipid, antioxidants, cholesterol ester, hydrophilic coat that contains free
cholesterol (FC), vitamins, apolipoprotein molecules and phospholipid (Ginsberg,
1998; Hegele, 2009). Insolubility of cholesterol and triglycerol in plasma restrict
their movement from the liver to the bloodstream. Therefore, liver will undergo some
modification by wrapping the lipid with certain protein namely apolipoprotein to
form a new molecule called lipoprotein which act as a carrier protein and it also acts
3
as a transport vehicles for the lipid in the blood circulation (Ginsberg, 1998; Kumar
et al., 2011). Most of the lipoprotein particles have a common structure in which they
will form a micellar complexes with a hydrophobic lipid core and an amphipathic
surface monolayer (Ginsberg, 1998; Hegele, 2009; Kumar et al., 2011).
The cholesterol and triglyceride are most important plasma lipids (Brown et al.,
1986; Hegele 2009). Cholesterol has numerous roles such as to trigger the activation
of neuron signalling molecules, component of cell membranes, the precursor for
steroid hormones, vitamin D, oxysterols and bile acids (Crockett, 1998; Hegele,
2009). On the other hand, triglyceride synthesised in intestinal and liver cells,
transported through the plasma and undergoes lipolysis in the endothelial cell surface
(Brown et al., 1986; Hegele 2009). Triglycerides are mainly building up by FFSs and
linked by ester bond to a glycerol backbone and it is play an important role in
production of energy (Ginsberg, 1998; Hegele, 2009).
1.2.1 Lipoprotein physiology
Lipoprotein can be divided into different types such as chylomicron (CM), very low
density lipoprotein (VLDL), lowdensity lipoprotein (LDL) and highdensity
lipoprotein (HDL). Each lipoprotein types (CM, VLDL, LDL and HDL) are
distinguished based on their size, electrophoretic mobility, density, function and
composition (Ginsberg, 1998; Hegele, 2009). Affinities of the apolipoproteins in the
surface components of the lipoprotein will alter and it often diffuse from one
lipoprotein and bind to another during lipoprotein metabolism (Itabe, 2009; Yoshida
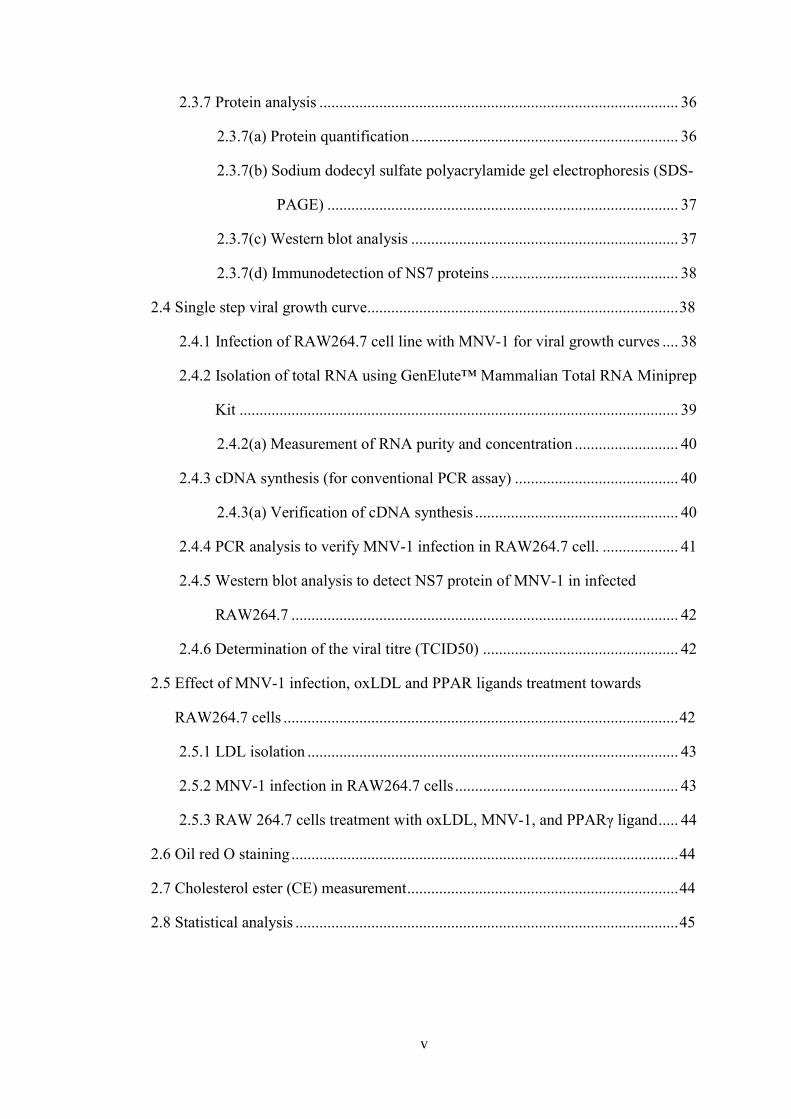
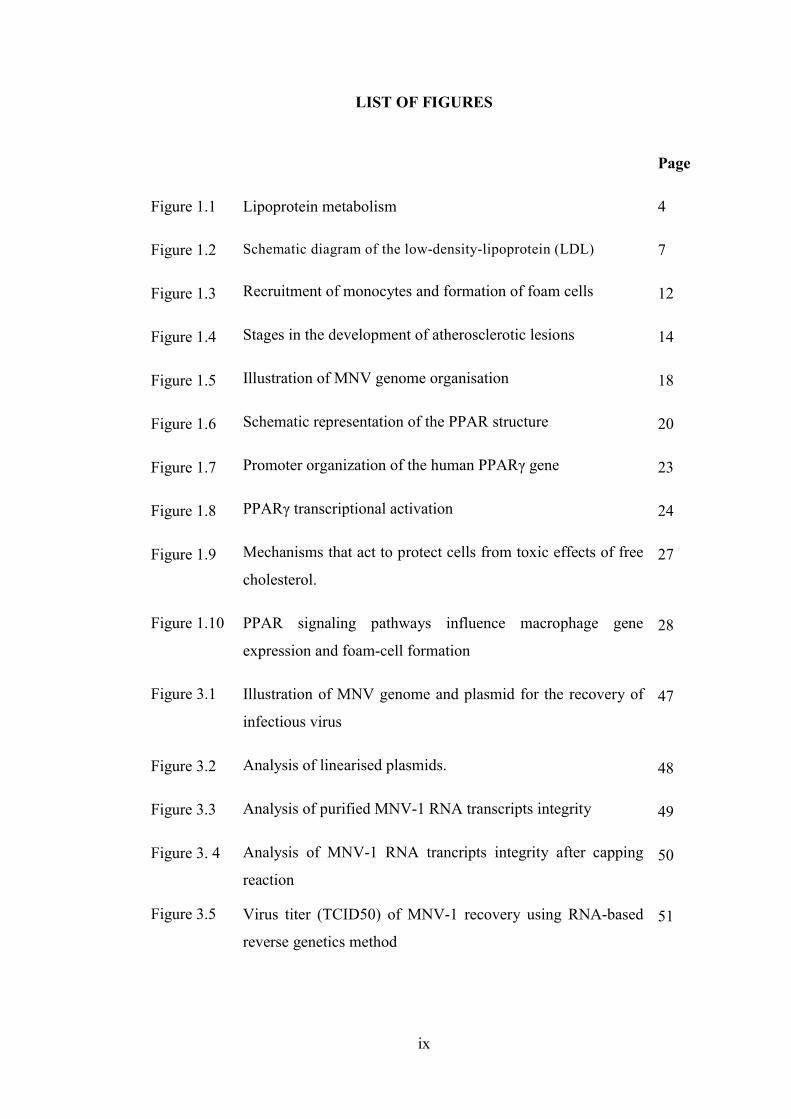
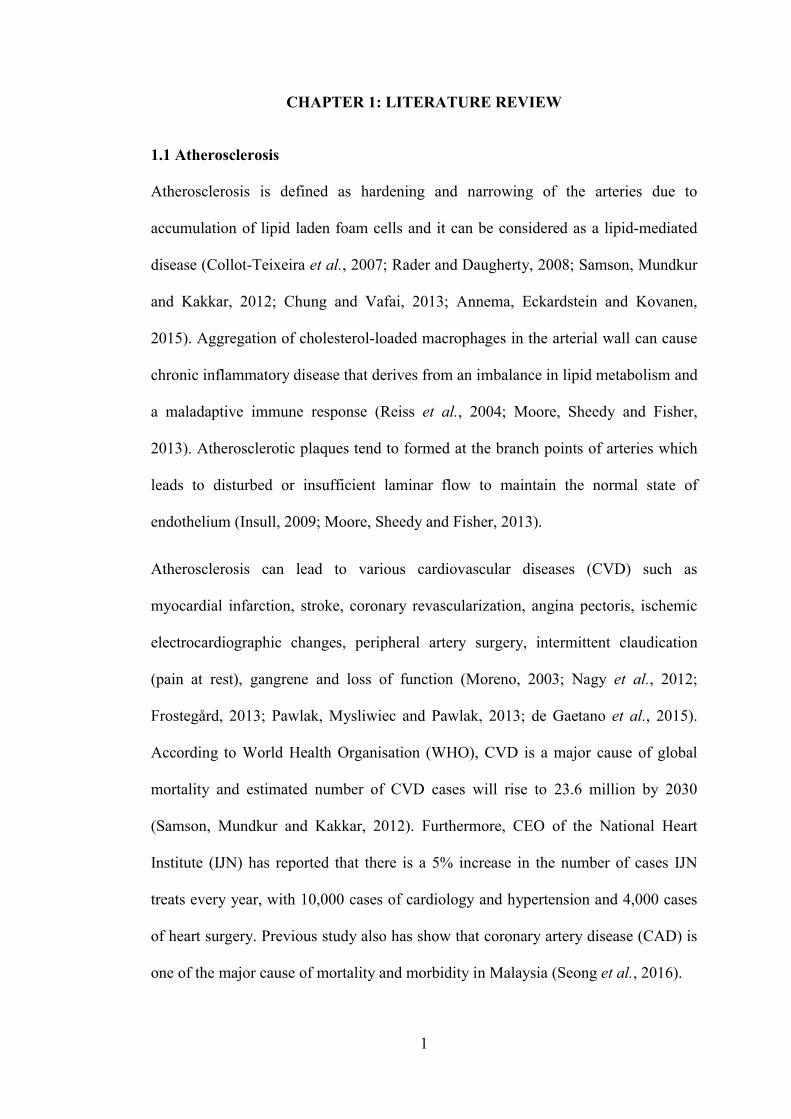
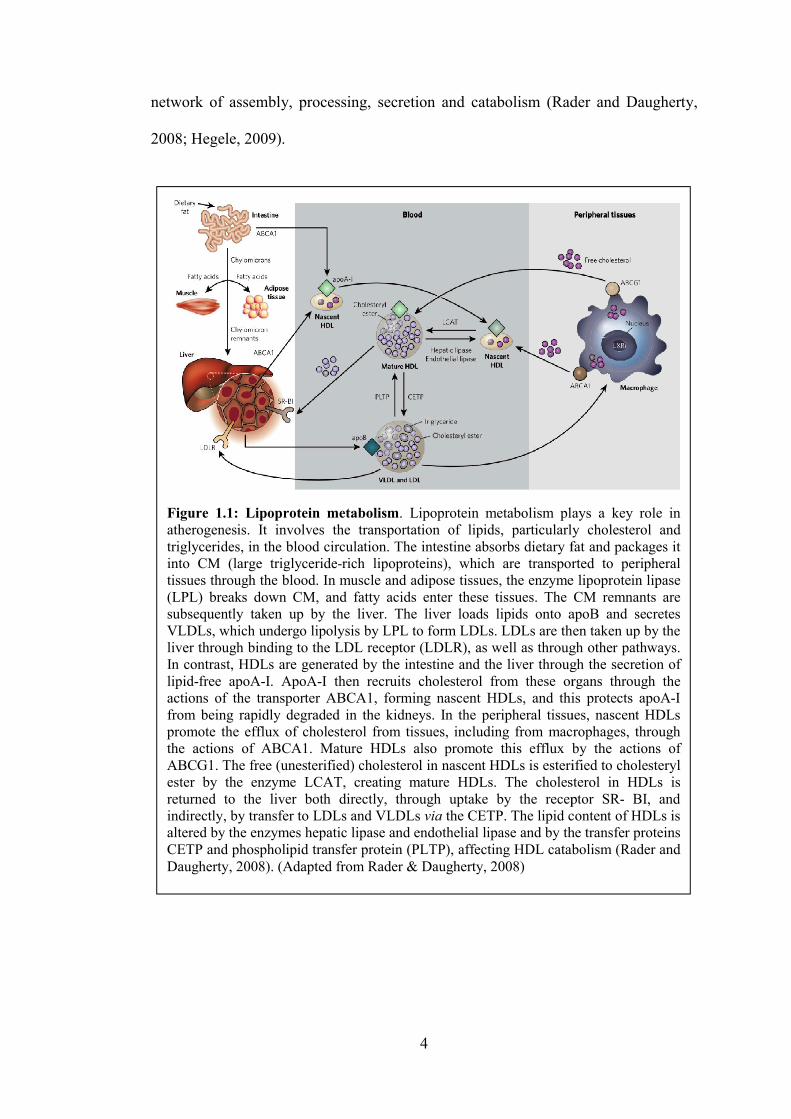
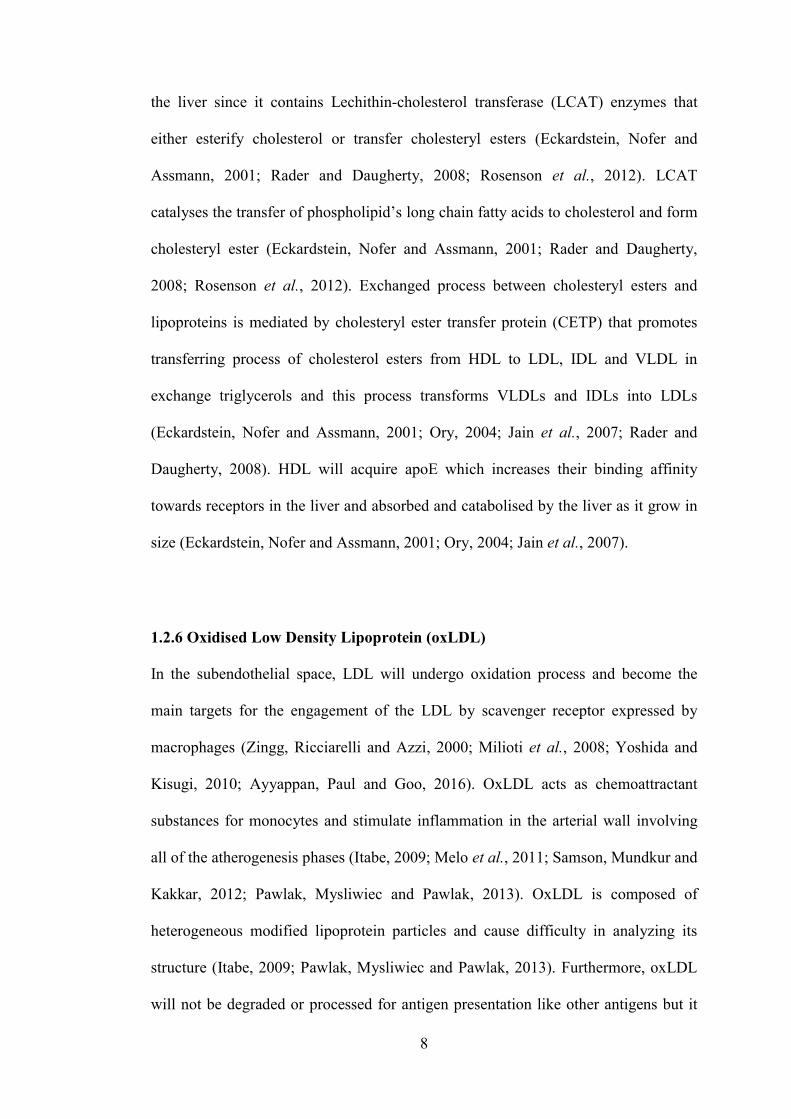
and Kisugi, 2010). Lipoprotein metabolism as shown in Figure 1.1 is a complex
network of assembly,
2008; Hegele, 2009).
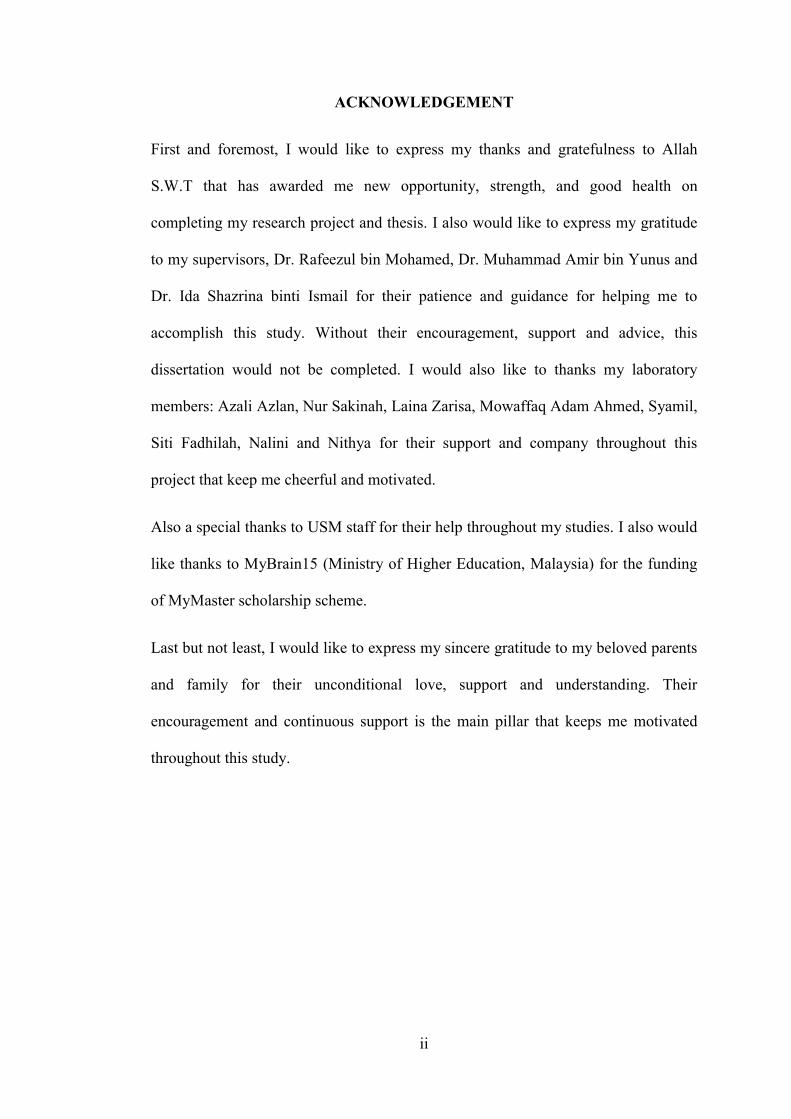
Figure 1.1: Lipoprotein metabolismatherogenesis. It involves the transportation of lipids, particularly cholesterol and triglycerides, in the blood circulation. The intestine absorbs dietary fat and packages it into CM (large triglyceridetissues through the blood. In muscle and adipose tissues, the enzyme lipoprotein lipase (LPL) breaks down CM, and fatty acids enter these tissues. The CM remnants are subsequently taken up by the liver. The liver loads lipids onto apoB andVLDLs, which undergo lipolysis by LPL to form LDLs. LDLs are then taken up by the liver through binding to the LDL receptor (LDLR), as well as through other pathways. In contrast, HDLs are generated by the intestine and the liver through the secrlipidfree apoAI. ApoAactions of the transporter ABCA1, forming nascent HDLs, and this protects apoAfrom being rapidly degraded in the kidneys. In the peripheral tissues, nascent HDLs promote the efflux of cholesterol from tissues, including from macrophages, through the actions of ABCA1. Mature HDLs also promote this efflux by the actions of ABCG1. The free (unesterified) cholesterol in nascent HDLs is esterified to cholesteryl ester by the enzyme LCAT, creating mature HDLs. The cholesterol in HDLs is returned to the liver both directly, through uptake by the receptor SRindirectly, by transfer to LDLs and VLDLs altered by the enzymes CETP and phospholipid transfer protein (PLTP), affecting HDL catabolism Daugherty, 2008). (Adapted from
4
network of assembly, processing, secretion and catabolism (Rader and Daugherty,
Figure 1.1: Lipoprotein metabolism. Lipoprotein metabolism plays a atherogenesis. It involves the transportation of lipids, particularly cholesterol and triglycerides, in the blood circulation. The intestine absorbs dietary fat and packages it into CM (large triglyceriderich lipoproteins), which are transporttissues through the blood. In muscle and adipose tissues, the enzyme lipoprotein lipase (LPL) breaks down CM, and fatty acids enter these tissues. The CM remnants are subsequently taken up by the liver. The liver loads lipids onto apoB andVLDLs, which undergo lipolysis by LPL to form LDLs. LDLs are then taken up by the liver through binding to the LDL receptor (LDLR), as well as through other pathways. In contrast, HDLs are generated by the intestine and the liver through the secr
I. ApoAI then recruits cholesterol from these organs through the actions of the transporter ABCA1, forming nascent HDLs, and this protects apoAfrom being rapidly degraded in the kidneys. In the peripheral tissues, nascent HDLs promote the efflux of cholesterol from tissues, including from macrophages, through the actions of ABCA1. Mature HDLs also promote this efflux by the actions of ABCG1. The free (unesterified) cholesterol in nascent HDLs is esterified to cholesteryl
y the enzyme LCAT, creating mature HDLs. The cholesterol in HDLs is returned to the liver both directly, through uptake by the receptor SRindirectly, by transfer to LDLs and VLDLs via the CETP. The lipid content of HDLs is altered by the enzymes hepatic lipase and endothelial lipase and by the transfer proteins CETP and phospholipid transfer protein (PLTP), affecting HDL catabolism
. (Adapted from Rader & Daugherty, 2008)
(Rader and Daugherty,
. Lipoprotein metabolism plays a key role in atherogenesis. It involves the transportation of lipids, particularly cholesterol and triglycerides, in the blood circulation. The intestine absorbs dietary fat and packages it
rich lipoproteins), which are transported to peripheral tissues through the blood. In muscle and adipose tissues, the enzyme lipoprotein lipase (LPL) breaks down CM, and fatty acids enter these tissues. The CM remnants are subsequently taken up by the liver. The liver loads lipids onto apoB and secretes VLDLs, which undergo lipolysis by LPL to form LDLs. LDLs are then taken up by the liver through binding to the LDL receptor (LDLR), as well as through other pathways. In contrast, HDLs are generated by the intestine and the liver through the secretion of
I then recruits cholesterol from these organs through the actions of the transporter ABCA1, forming nascent HDLs, and this protects apoAI from being rapidly degraded in the kidneys. In the peripheral tissues, nascent HDLs promote the efflux of cholesterol from tissues, including from macrophages, through the actions of ABCA1. Mature HDLs also promote this efflux by the actions of ABCG1. The free (unesterified) cholesterol in nascent HDLs is esterified to cholesteryl
y the enzyme LCAT, creating mature HDLs. The cholesterol in HDLs is returned to the liver both directly, through uptake by the receptor SR BI, and
the CETP. The lipid content of HDLs is hepatic lipase and endothelial lipase and by the transfer proteins
CETP and phospholipid transfer protein (PLTP), affecting HDL catabolism (Rader and
5
1.2.2 Chylomicrons (CM)
CM is lipoproteins that transports dietary lipids from the intestinal cells to another
tissue (Ginsberg, 1998; Desvergne and Wahli, 1999; Zingg, Ricciarelli and Azzi,
2000; Jain et al., 2007). Nascent CM is wrapped with a few types of apolipoprotein
such as apoB48, apoAI, apoAII and apoA IV (Ginsberg, 1998; Hegele, 2009). In
the blood circulation, the nascent CM acquires apoE and apoC from plasma HDL in
exchange for phospholipids (Ginsberg, 1998; Hegele, 2009). Triglycerols to be
hydrolyzed into fatty acids when CM bind to membrane bound lipoprotein lipases
(LPL) located in adipose and muscle tissues (Ginsberg, 1998; Lusis, Fogelman and
Fonarow, 2004; Jain et al., 2007; Hegele, 2009). Fatty acids are resynthesised once
again into triglycerols and stored once it is transported into the adipose cell while in
the muscle, fatty acids are oxidised to provide energy (Desvergne and Wahli, 1999;
Jain et al., 2007).
1.2.3 Very Low Density Lipoproteins (VLDL)
VLDL is synthesised in the liver and made up of fatty acids and cholesterol
(Ginsberg, 1998; Lusis and Pajukanta, 2008). Liver secretes VLDLs via exocytosis
and primary apolipoprotein of VLDL is apoB100 (Ory, 2004; Hegele, 2009; Itabe,
2009; Libby, Ridker and Hansson, 2011; Paik et al., 2015). Similar to CM, VLDL
undergoes changes in the plasma in which the nascent VLDL acquires apoC and
apoE from HDL (Ginsberg, 1998; Ory, 2004; Annema, Eckardstein and Kovanen,
2015). Triglycerols are hydrolyzed into fatty acids when VLDL binds to the LPL in
the adipose and muscle tissues (Ory, 2004; Hegele, 2009; Itabe, 2009).
6
In the muscle, fatty acids oxidation provides energy and transported into the adipose
cell, then resynthesised once again into triglycerols and stored (Savage, 2005).
Tissues absorb the fatty acids and monoglycerols, causing VLDL to shrink, formed
IDLs and transfers its phospholipids and converts apoC to HDL (Ginsberg, 1998;
Ory, 2004; Annema, Eckardstein and Kovanen, 2015). IDLs can be further
catabolised by LPL in which they will lose apoE to form LDLs when it bind to liver
cells receptors (Ginsberg, 1998; Annema, Eckardstein and Kovanen, 2015).
1.2.4 Low Density Lipoproteins (LDL)
LDL is a spherical cholesterol rich lipoprotein which contains mostly apoB100 and
play a critical role as a plasma cholesterol carrier in the blood (Mertens and Holvoet,
2001; Colpo, 2005; Itabe, 2009; Kumar et al., 2011; Pawlak, Mysliwiec and Pawlak,
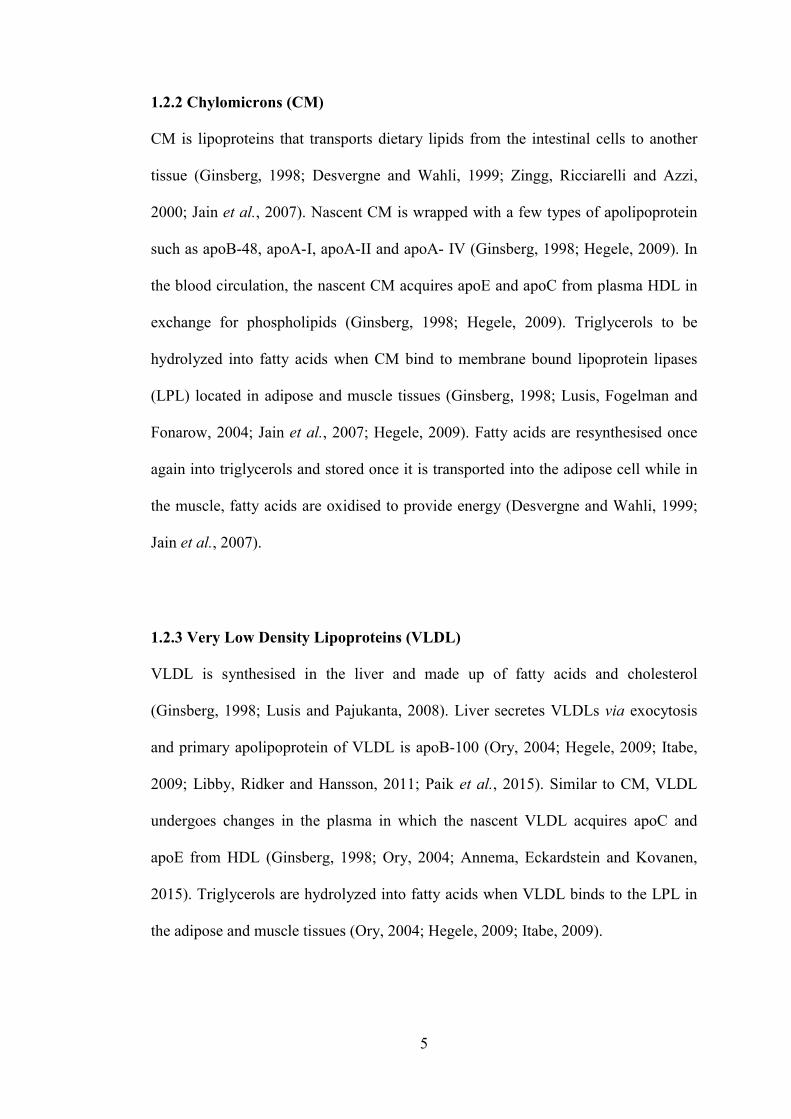
2013). LDL content consists of cholesteryl esters that form hydrophobic core and
triglycerides that are surrounded by phospholipid and cholesterol monolayer with a
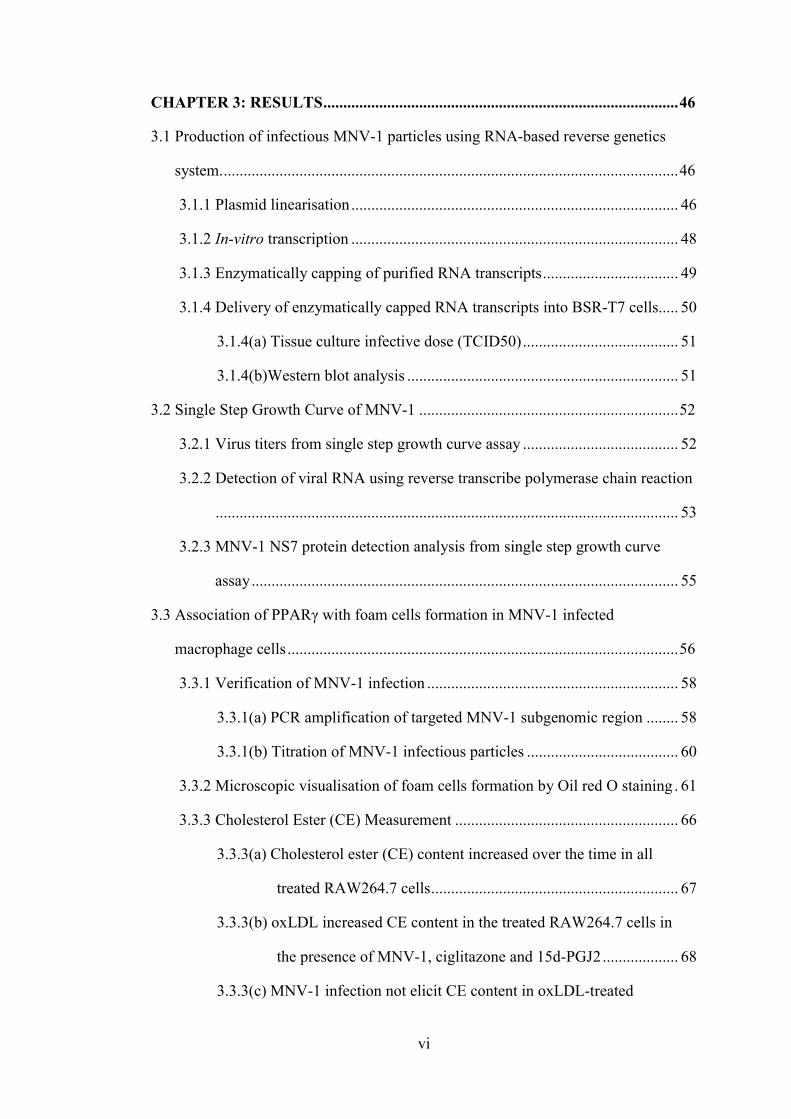
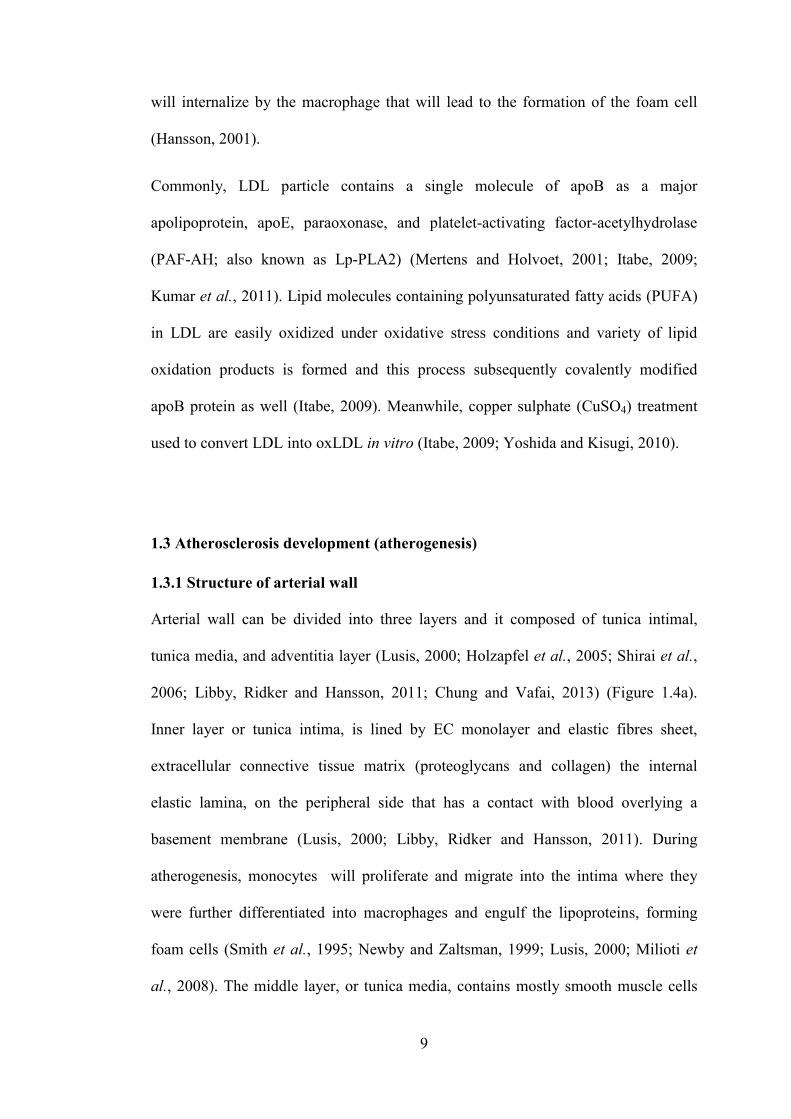
single molecule of apoB100 as shown in Figure 1.2 (Mertens and Holvoet, 2001;
Milioti et al., 2008; Kumar et al., 2011).
In LDL surface’s phospholipids and FC are aligned, while triglycerides and
cholesteryl ester are packed in the central core of the LDL particle (Milioti et al.,
2008; Itabe, 2009). LDL vary in both diameter (18–25 nm) and density (1.019–1.063
g/ml) (Milioti et al., 2008; Kumar et al., 2011). LDL is known as bad cholesterol and
it concentration positively correlates with the coronary heart disease (Ginsberg,
1998; Samson, Mundkur and Kakkar, 2012; Annema, Eckardstein and Kovanen,
2015). Oxidation of LDL is one of the early event in atherosclerosis since oxidized
LDL can contributes to atherogenesis
Yoshida and Kisugi, 2010)
1.2.5 High Density Lipoprotein
HDL is secreted by live
when acquiring FC from cell membrane and triglycerol
(Eckardstein, Nofer and Assmann, 2001; Lusis and Paj
Daugherty, 2008). It always referred as good cholesterol because
remove excess cholesterol
metabolised into bile salts
Oram, 2003; Rader and Daugherty, 2008; Libby, Ridker and Hansson, 2011;
Rosenson et al., 2012)
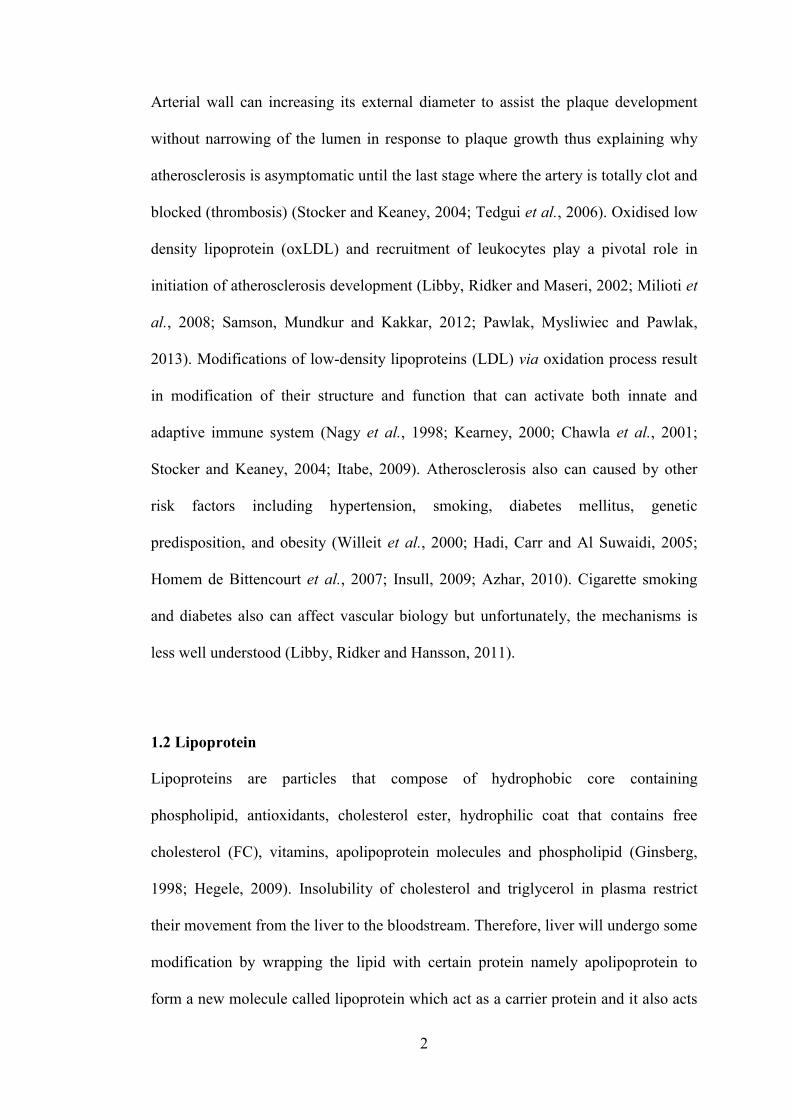
Figure 1.2: Schematic diagram of the lowas transporter of unesterified cholesterol, cholesterol ester, and triglycerblood (Milioti et al. 2008). The size of LDL particle is approxiamately 21composed of cholesterol ester acontains of phospholipids and unesterified cholesterol in which a single protein called apoB100 is embedded https://particulatefouling.wikispaces
7
contributes to atherogenesis (Mertens and Holvoet, 2001; Itabe, 2009;
Yoshida and Kisugi, 2010).
High Density Lipoproteins (HDL)
HDL is secreted by liver and intestinal cells in disk shaped but they become spherical
acquiring FC from cell membrane and triglycerol from other lipoproteins
(Eckardstein, Nofer and Assmann, 2001; Lusis and Pajukanta, 2008; Rader and
It always referred as good cholesterol because
remove excess cholesterol (also known as reverse cholesterol transport)
ed into bile salts in the liver (Eckardstein, Nofer and Assmann, 2001;
Oram, 2003; Rader and Daugherty, 2008; Libby, Ridker and Hansson, 2011;
, 2012). HDL is actually the transporter of plasma cholesterol back to
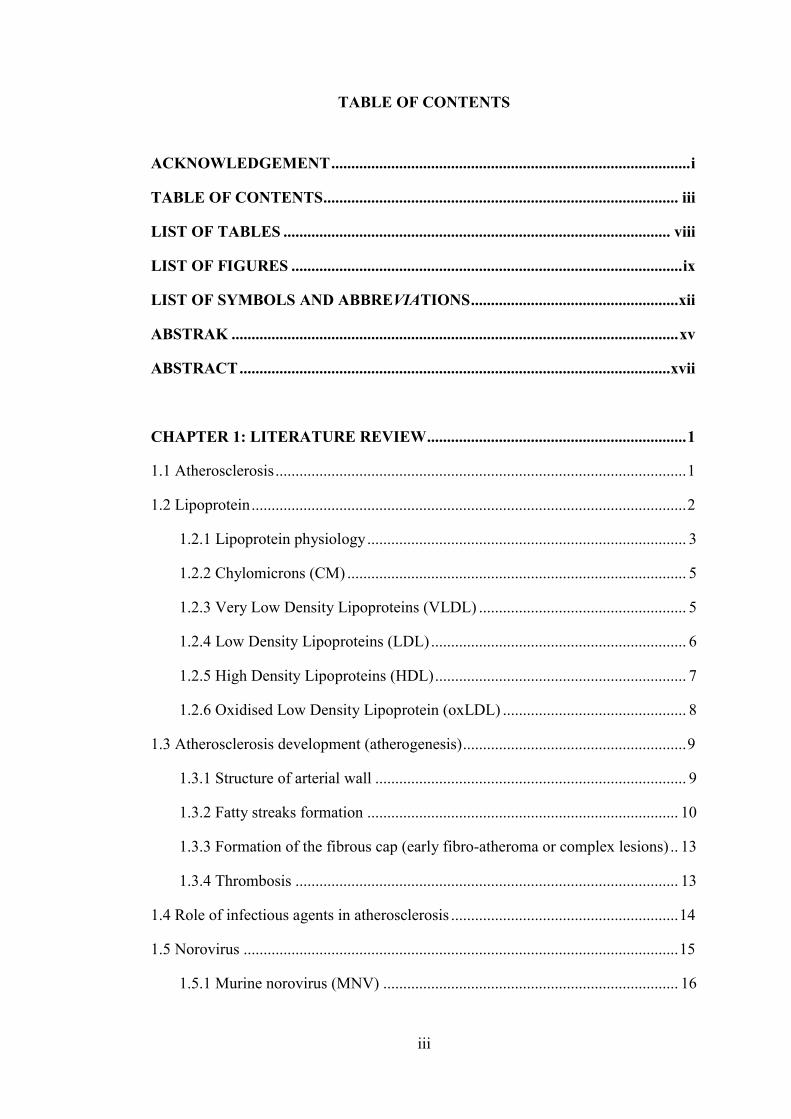
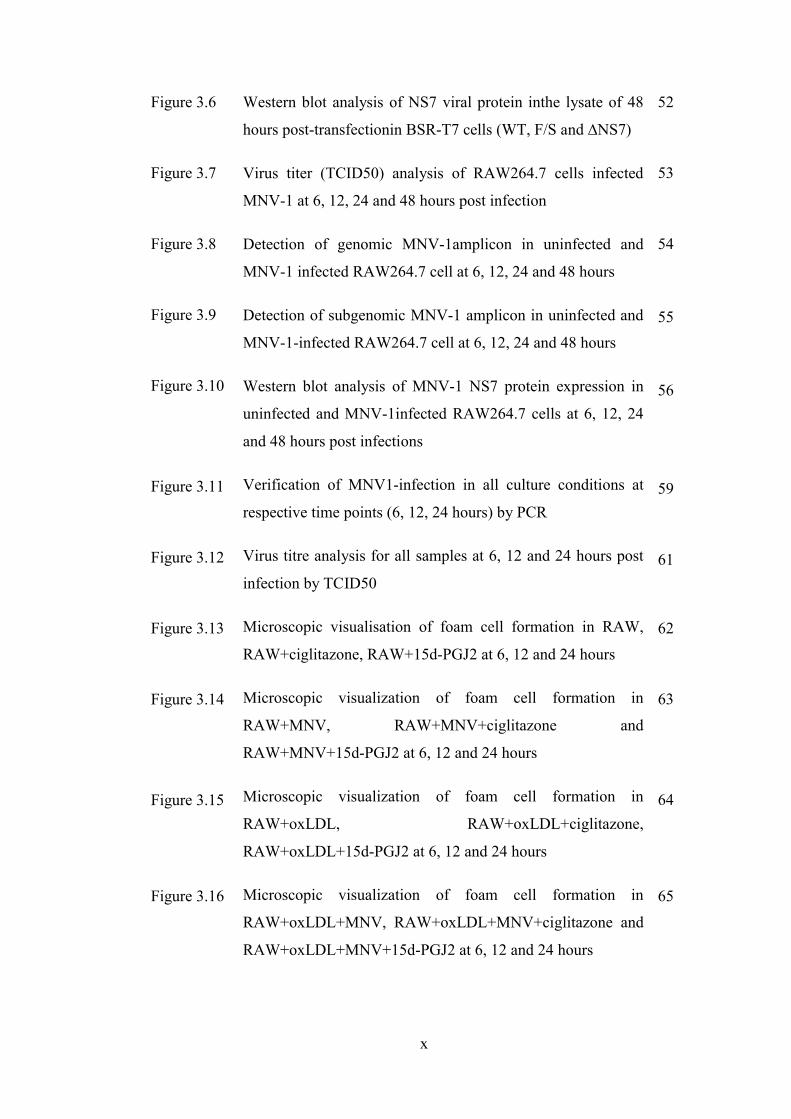
Figure 1.2: Schematic diagram of the low-density-lipoprotein (LDL). as transporter of unesterified cholesterol, cholesterol ester, and triglycer
. 2008). The size of LDL particle is approxiamately 21composed of cholesterol ester and triglycerides. Commonly, the outer layer of LDL contains of phospholipids and unesterified cholesterol in which a single protein called
100 is embedded (Milioti et al., 2008). (Modified from Milioti https://particulatefouling.wikispaces.com/Low+Density+Lipoprotein).
(Mertens and Holvoet, 2001; Itabe, 2009;
but they become spherical
from other lipoproteins
ukanta, 2008; Rader and
It always referred as good cholesterol because of the abilities to
(also known as reverse cholesterol transport) and
(Eckardstein, Nofer and Assmann, 2001;
Oram, 2003; Rader and Daugherty, 2008; Libby, Ridker and Hansson, 2011;
a cholesterol back to
lipoprotein (LDL). LDL acts as transporter of unesterified cholesterol, cholesterol ester, and triglycerides in the
. 2008). The size of LDL particle is approxiamately 2124 nm that nd triglycerides. Commonly, the outer layer of LDL
contains of phospholipids and unesterified cholesterol in which a single protein called . (Modified from Milioti et al. 2008 and
.com/Low+Density+Lipoprotein).
8
the liver since it contains Lechithincholesterol transferase (LCAT) enzymes that
either esterify cholesterol or transfer cholesteryl esters (Eckardstein, Nofer and
Assmann, 2001; Rader and Daugherty, 2008; Rosenson et al., 2012). LCAT
catalyses the transfer of phospholipid’s long chain fatty acids to cholesterol and form
cholesteryl ester (Eckardstein, Nofer and Assmann, 2001; Rader and Daugherty,
2008; Rosenson et al., 2012). Exchanged process between cholesteryl esters and
lipoproteins is mediated by cholesteryl ester transfer protein (CETP) that promotes
transferring process of cholesterol esters from HDL to LDL, IDL and VLDL in
exchange triglycerols and this process transforms VLDLs and IDLs into LDLs
(Eckardstein, Nofer and Assmann, 2001; Ory, 2004; Jain et al., 2007; Rader and
Daugherty, 2008). HDL will acquire apoE which increases their binding affinity
towards receptors in the liver and absorbed and catabolised by the liver as it grow in
size (Eckardstein, Nofer and Assmann, 2001; Ory, 2004; Jain et al., 2007).
1.2.6 Oxidised Low Density Lipoprotein (oxLDL)
In the subendothelial space, LDL will undergo oxidation process and become the
main targets for the engagement of the LDL by scavenger receptor expressed by
macrophages (Zingg, Ricciarelli and Azzi, 2000; Milioti et al., 2008; Yoshida and
Kisugi, 2010; Ayyappan, Paul and Goo, 2016). OxLDL acts as chemoattractant
substances for monocytes and stimulate inflammation in the arterial wall involving
all of the atherogenesis phases (Itabe, 2009; Melo et al., 2011; Samson, Mundkur and
Kakkar, 2012; Pawlak, Mysliwiec and Pawlak, 2013). OxLDL is composed of
heterogeneous modified lipoprotein particles and cause difficulty in analyzing its
structure (Itabe, 2009; Pawlak, Mysliwiec and Pawlak, 2013). Furthermore, oxLDL
will not be degraded or processed for antigen presentation like other antigens but it
9
will internalize by the macrophage that will lead to the formation of the foam cell
(Hansson, 2001).
Commonly, LDL particle contains a single molecule of apoB as a major
apolipoprotein, apoE, paraoxonase, and plateletactivating factoracetylhydrolase
(PAFAH; also known as LpPLA2) (Mertens and Holvoet, 2001; Itabe, 2009;
Kumar et al., 2011). Lipid molecules containing polyunsaturated fatty acids (PUFA)
in LDL are easily oxidized under oxidative stress conditions and variety of lipid
oxidation products is formed and this process subsequently covalently modified
apoB protein as well (Itabe, 2009). Meanwhile, copper sulphate (CuSO4) treatment
used to convert LDL into oxLDL in vitro (Itabe, 2009; Yoshida and Kisugi, 2010).
1.3 Atherosclerosis development (atherogenesis)
1.3.1 Structure of arterial wall
Arterial wall can be divided into three layers and it composed of tunica intimal,
tunica media, and adventitia layer (Lusis, 2000; Holzapfel et al., 2005; Shirai et al.,
2006; Libby, Ridker and Hansson, 2011; Chung and Vafai, 2013) (Figure 1.4a).
Inner layer or tunica intima, is lined by EC monolayer and elastic fibres sheet,
extracellular connective tissue matrix (proteoglycans and collagen) the internal
elastic lamina, on the peripheral side that has a contact with blood overlying a
basement membrane (Lusis, 2000; Libby, Ridker and Hansson, 2011). During
atherogenesis, monocytes will proliferate and migrate into the intima where they
were further differentiated into macrophages and engulf the lipoproteins, forming
foam cells (Smith et al., 1995; Newby and Zaltsman, 1999; Lusis, 2000; Milioti et
al., 2008). The middle layer, or tunica media, contains mostly smooth muscle cells
10
(SMC) embedded in a complex extracellular matrix (Lusis, 2000; Libby, Ridker and
Hansson, 2011; Frostegård, 2013). SMCs migrate from the media into the intima
during atherogenesis, and proliferate in response to mediators such as platelet
derived growth factor (Libby, Ridker and Hansson, 2011; Nagy et al., 2012). Outer
layer of arteries called tunica adventitia, contains mast cells, fibroblasts, dendritic
cells, monocytes/macrophages, Tcells, small vessels (also known as vasa vasorum
that provide an important source of nutrition to arteries and veins), endothelial
progenitor cells nerve endings and microvessels (Libby, Ridker and Hansson, 2011;
Frostegård, 2013). Each layer of artery have a specific histological features and
mechanical functions as shown in Figure 1.4a (Holzapfel et al., 2005; Libby, Ridker
and Hansson, 2011).
1.3.2 Fatty streaks formation
In the normal condition LDL acts as a plasma cholesterol carrier in the blood but
after undergo oxidization process, it will initiate the atherogenesis (Stocker and
Keaney, 2004; Boullier et al., 2005; Corcoran et al., 2011; Kumar et al., 2011). As
shown in Figure 1.4b, 1.4c and 1.4d, atherogenesis is initiated by lipid retention,
oxidation, and modification that lead to the chronic inflammation, leading to
formation and development of thrombosis or stenosis (Witztum and Steinberg, 1991;
Chen et al., 1997; Koopman, Schaart and Hesselink, 2001; Stocker and Keaney,
2004; Milioti et al., 2008; Insull, 2009; Itabe, 2009; Samson, Mundkur and Kakkar,
2012). Normally, endothelium does not support binding of the white blood cells but
during early initiation of an atherogenesis, oxLDL stimulates arterial EC to express
selective adhesion molecules on their surface such as VCAM1, ICAM1 that bind to
various receptor expressed on the leukocytes surface as shown in Figure 1.3 and 1.4b
11
(Lusis, 2000; Libby, Ridker and Maseri, 2002; Rader and Daugherty, 2008; Libby,
Ridker and Hansson, 2011; Samson, Mundkur and Kakkar, 2012). In addition,
monocyte chemoattractant protein1 (MCP1) is the main factor that is responsible to
trigger the migration of monocytes into the intima (Van Lenten et al., 1995; Lusis,
2000; Libby, Ridker and Maseri, 2002; Samson, Mundkur and Kakkar, 2012;
Ayyappan, Paul and Goo, 2016). Inside the intima, macrophage colonystimulating
factor (MCSF) is the growth factor that contributes to the differentiation of the
blood monocyte into the macrophage as shown in Figure 1.3 and 1.4b (Smith et al.,
1995; Qiao et al., 1997; Libby, Ridker and Maseri, 2002; Rader and Daugherty,
2008; Libby, Ridker and Hansson, 2011).
In atherosclerotic arteries, macrophages involved transformed into foam cells
through a process that regulated by the balance process between modified LDL
uptake and cholesterol efflux (Ley, Miller and Hedrick, 2011; de Gaetano et al.,
2015). Formation of foam cells as shown in Figure 1.3 are comprising complex and
multistep mechanisms that depend on different signalling pathways (CollotTeixeira
et al., 2007; Rader and Daugherty, 2008; Melo et al., 2011).
Macrophages express scavenger receptors such as SRA1 and CD36 that can
recognise and internalise oxLDL (Mertens and Holvoet, 2001; Akiyama et al., 2002;
CollotTeixeira et al., 2007; Corcoran et al., 2011; Ley, Miller and Hedrick, 2011).
The engagement of oxLDL by macrophages also will release various pro
inflammatory mediators resulting in a chronic inflammatory reaction as shown in
Figure 1.4b (Libby, Ridker and Hansson, 2011). Previous studies have showed
various strong evidences that linked atherosclerosis with the immune response
alteration and chronic inflammation (Insull, 2009; Kapoor et al., 2012; Samson,
Mundkur and Kakkar, 2012; Matsuura et al., 2014). In order to maintain the
homeostasis, macrophages try to clean up cholesterol
arteries (de Gaetano
macrophages namely foam cells will form lipid streaks in the arteries which then
trigger various inflammatory responses
Ricote et al., 1999; Ley, Miller and Hedrick, 2011; Libby, Ridker and Hansson,
2011; Samson, Mundkur and Kakkar, 2012; de Gaetano
can be considered as a precursor of advanced lesions
accumulation of lipid
Tedgui et al., 2006).
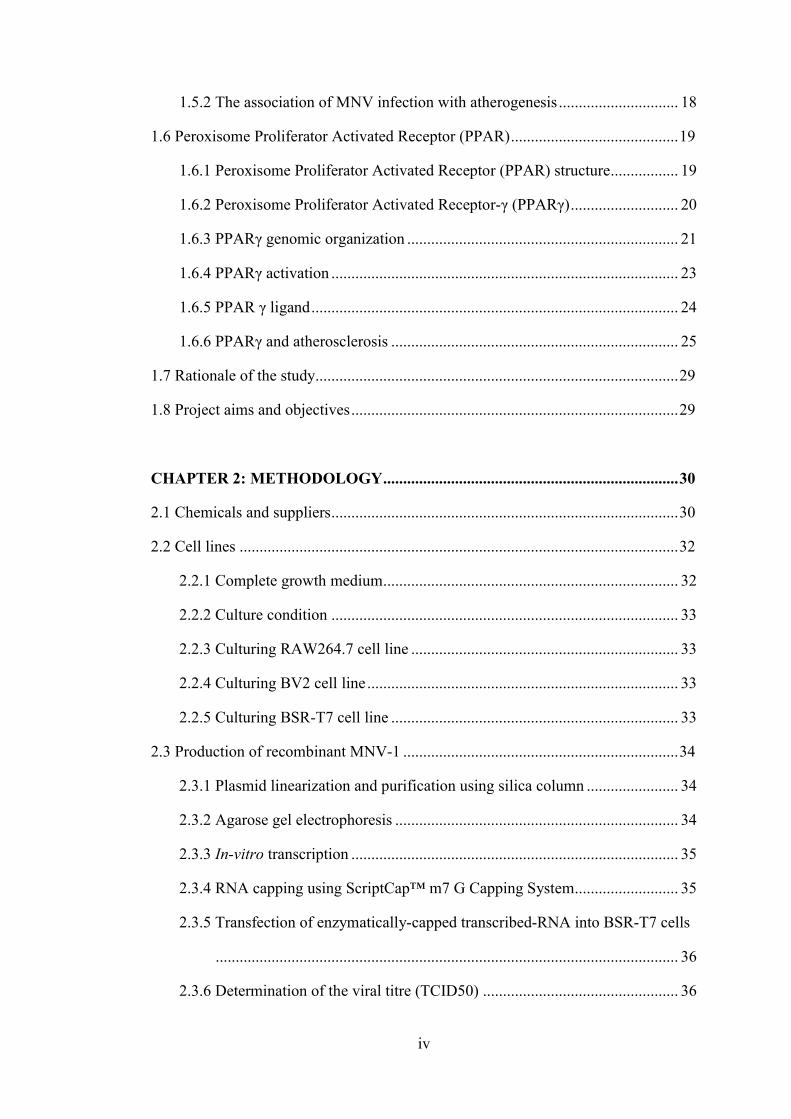
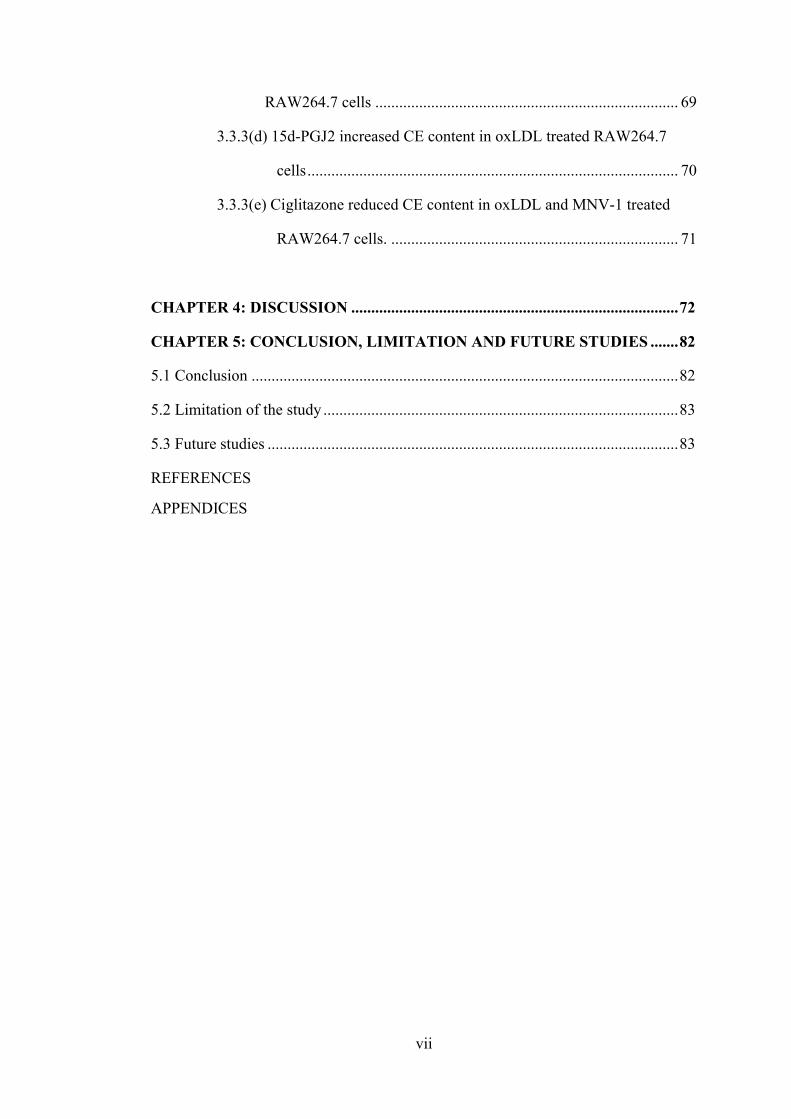
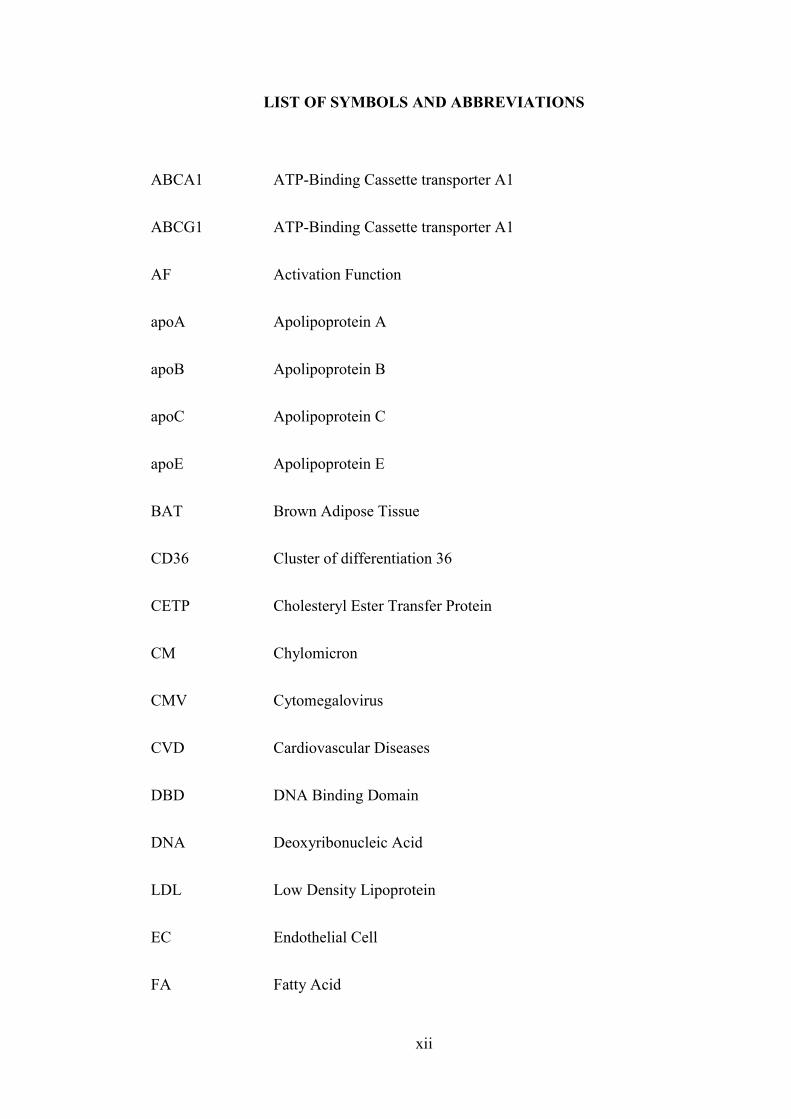
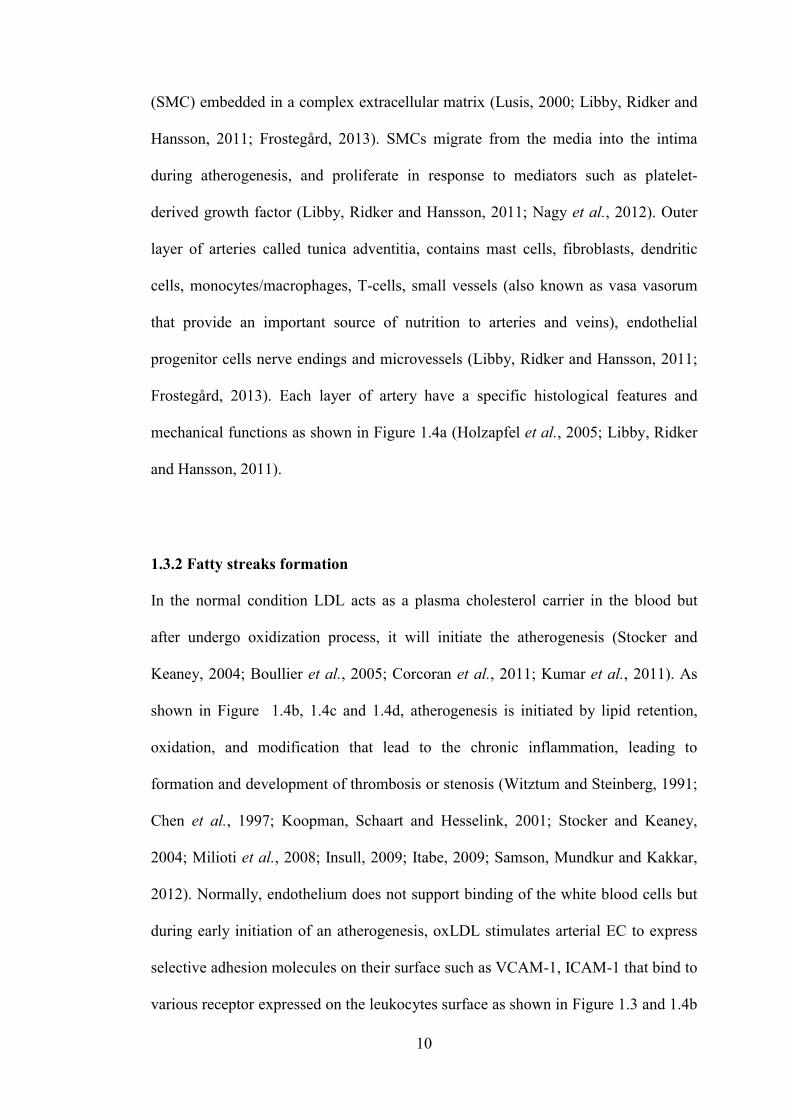
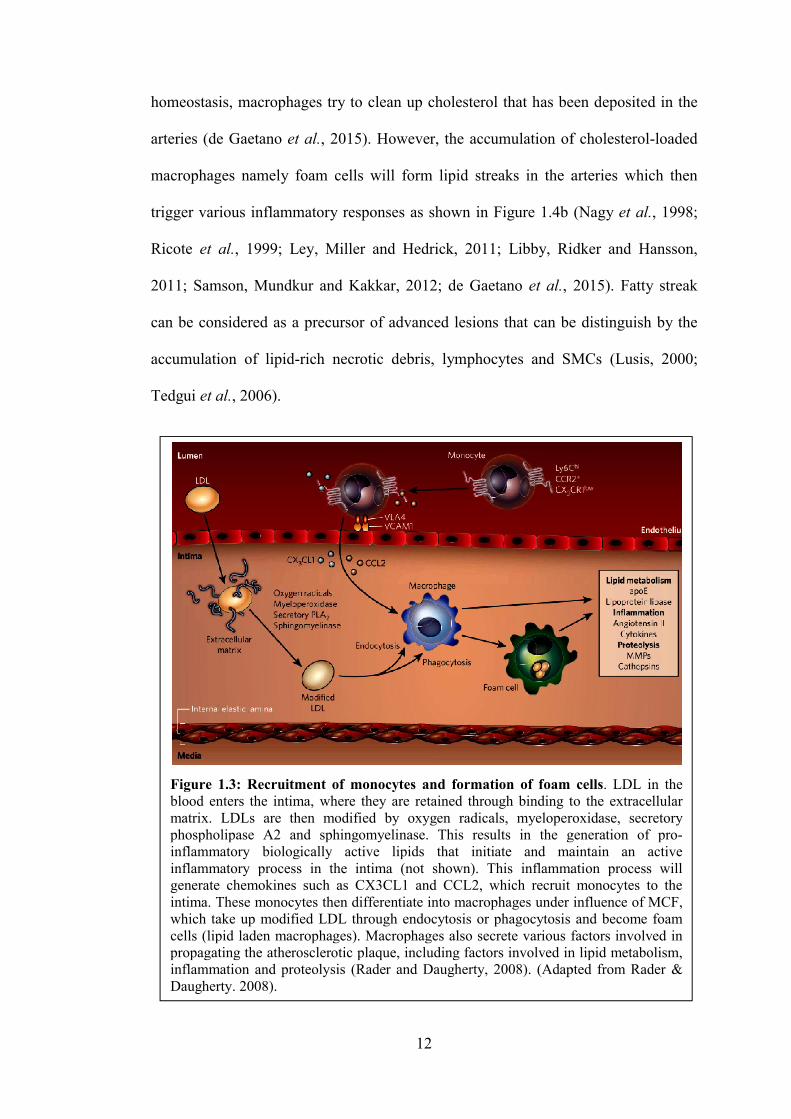
Figure 1.3: Recruitment of monocytes and formation of foam cellsblood enters the intima, where they are retained through binding to the extracellular matrix. LDLs are then modified by oxygen radicals, myelopephospholipase A2 and sphingomyelinase. This results in the generation of proinflammatory biologically active lipids that initiate and maintain an active inflammatory process in the intima (not shown). This inflammation process will generate chemokines such as CX3CL1 and CCL2, which recruit monocytes to the intima. These monocytes then differentiate into macrophages under influence of MCF, which take up modified LDL through endocytosis or phagocytosis and become foam cells (lipid laden mpropagating the atherosclerotic plaque, including factors involved in lipid metabolism, inflammation and proteolysis Daugherty. 2008).
12
, macrophages try to clean up cholesterol that has been
(de Gaetano et al., 2015). However, the accumulation of ch
macrophages namely foam cells will form lipid streaks in the arteries which then
trigger various inflammatory responses as shown in Figure 1.4b
, 1999; Ley, Miller and Hedrick, 2011; Libby, Ridker and Hansson,
2011; Samson, Mundkur and Kakkar, 2012; de Gaetano et al., 2015)
can be considered as a precursor of advanced lesions that can be distinguish
accumulation of lipidrich necrotic debris, lymphocytes and SMCs
Figure 1.3: Recruitment of monocytes and formation of foam cellsblood enters the intima, where they are retained through binding to the extracellular matrix. LDLs are then modified by oxygen radicals, myeloperoxidase, secretory phospholipase A2 and sphingomyelinase. This results in the generation of proinflammatory biologically active lipids that initiate and maintain an active inflammatory process in the intima (not shown). This inflammation process will
erate chemokines such as CX3CL1 and CCL2, which recruit monocytes to the intima. These monocytes then differentiate into macrophages under influence of MCF, which take up modified LDL through endocytosis or phagocytosis and become foam
acrophages). Macrophages also secrete various factors involved in propagating the atherosclerotic plaque, including factors involved in lipid metabolism, inflammation and proteolysis (Rader and Daugherty, 2008). (Adapted from Rader &
that has been deposited in the
f cholesterolloaded
macrophages namely foam cells will form lipid streaks in the arteries which then
as shown in Figure 1.4b (Nagy et al., 1998;
, 1999; Ley, Miller and Hedrick, 2011; Libby, Ridker and Hansson,
, 2015). Fatty streak
that can be distinguish by the
rich necrotic debris, lymphocytes and SMCs (Lusis, 2000;
Figure 1.3: Recruitment of monocytes and formation of foam cells. LDL in the blood enters the intima, where they are retained through binding to the extracellular
roxidase, secretory phospholipase A2 and sphingomyelinase. This results in the generation of proinflammatory biologically active lipids that initiate and maintain an active inflammatory process in the intima (not shown). This inflammation process will
erate chemokines such as CX3CL1 and CCL2, which recruit monocytes to the intima. These monocytes then differentiate into macrophages under influence of MCF, which take up modified LDL through endocytosis or phagocytosis and become foam
acrophages). Macrophages also secrete various factors involved in propagating the atherosclerotic plaque, including factors involved in lipid metabolism,
. (Adapted from Rader &
13
1.3.3 Formation of the fibrous cap (early fibro-atheroma or complex lesions)
Fibrous cap formation can either progress to a complex atheroma or regress to a
simpler plaque and its formation can remain asymptomatic (Tabas, 1997; Libby,
Ridker and Maseri, 2002; Rader and Daugherty, 2008; Ellertsen, Petri and Bäck,
2011; Frostegård, 2013). This stage initiated by the migration and proliferation of
SMC into the intima or subendothelial space to produce a distinct fibrous cap
(Newby and Zaltsman, 1999; Libby, Ridker and Maseri, 2002; Libby, Ridker and
Hansson, 2011). Once the lesion reaches this stage, there are two possibilities; either
the fibrous cap remains intact which stabilise the plaque, or plaque development
continues and becomes more vulnerable and prone to rupture as shown in Figure 1.4c
(Libby, Ridker and Maseri, 2002; Insull, 2009; Libby, Ridker and Hansson, 2011).
1.3.4 Thrombosis
Plaque erosions or rupture and thrombosis are depends on the composition and
plaque weakness caused by chronic inflammatory condition that can be the most
critical clinical aspect of atherosclerosis as shown in Figure 1.4d (Tabas, 1997; Lusis,
2000; CollotTeixeira et al., 2007; Libby, Ridker and Hansson, 2011). Thrombosis is
the process that responsible for clinically observable events affecting peripheral
vascular, coronary and cerebrovascular (Tedgui et al., 2006). Susceptibility to
atherothrombosis differs not only in individual susceptibility but also in arterial
susceptibility (Falk, 2006).
14
1.4 Role of infectious agents in atherosclerosis
There are several studies showed that the infection of bacteria and viruses are the
factor that can contribute to the pathogenesis of atherosclerosis either directly by
infection of vascular cells or indirectly by the immune system effects (Cainelli,
Concia and Vento, 2000; Willeit et al., 2000; Prediman K. Shah, 2001; Madjid et al.,
2003; Reeves et al., 2004; Paik et al., 2011, 2015; Rosenfeld and Campbell, 2011;
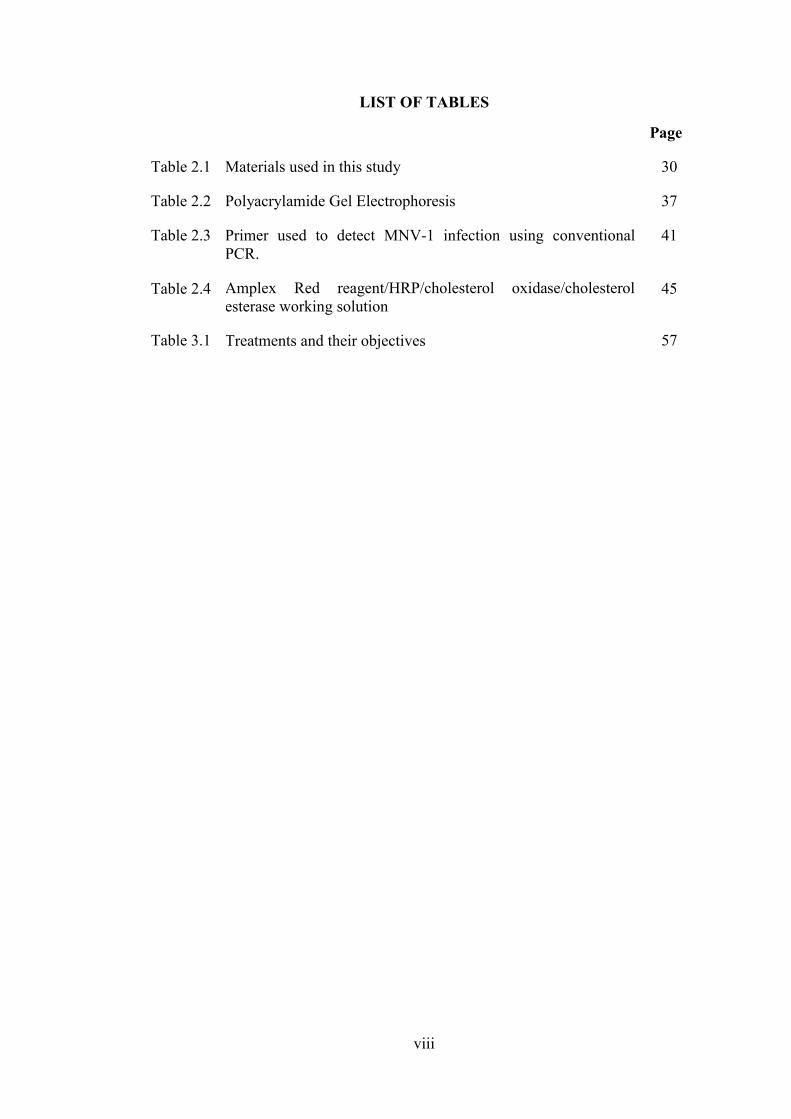
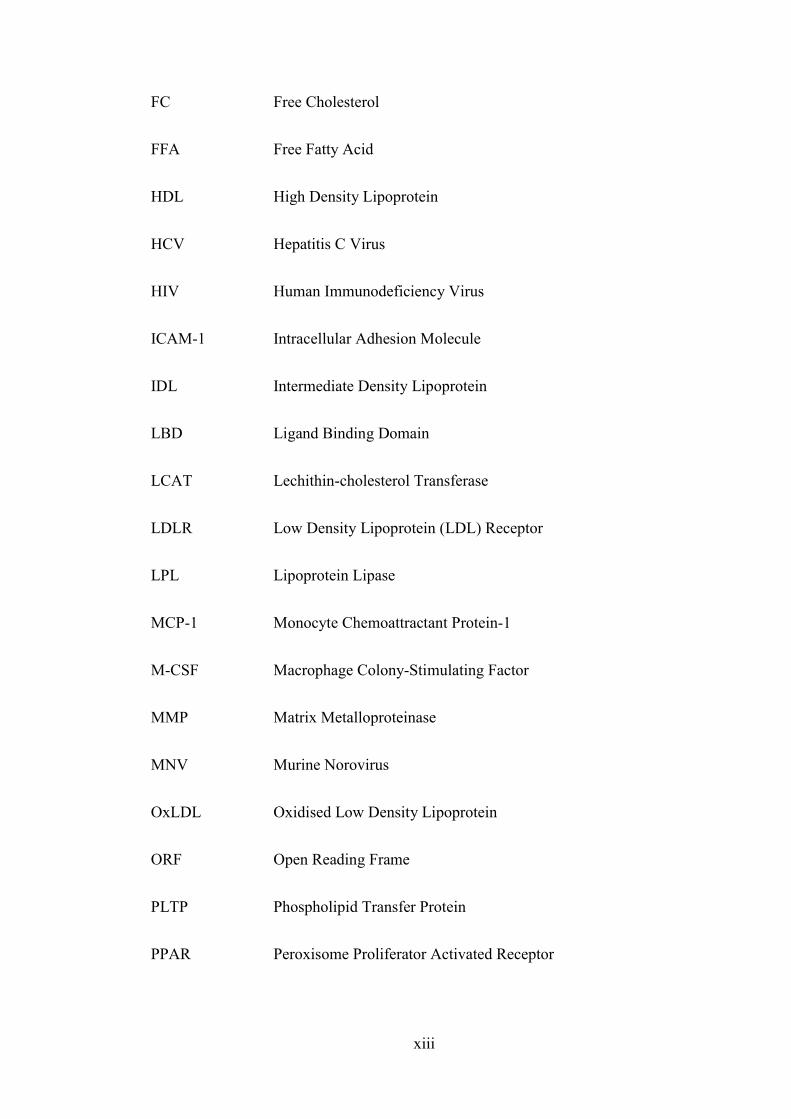
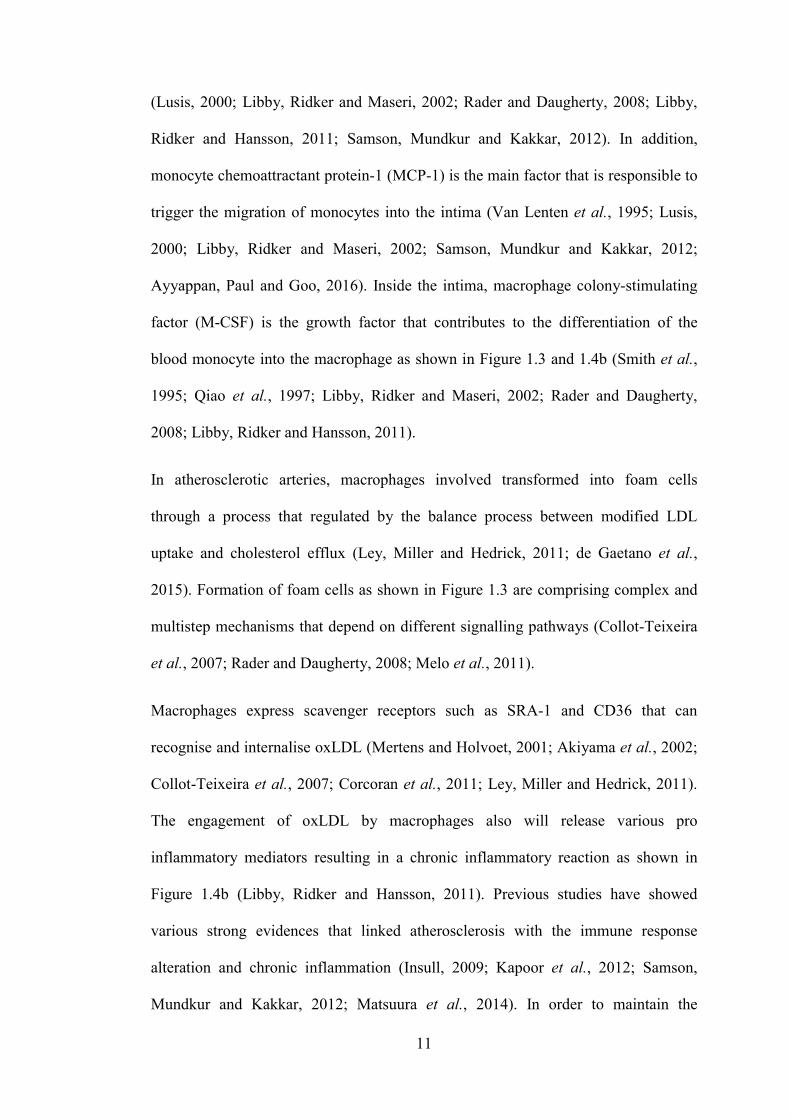
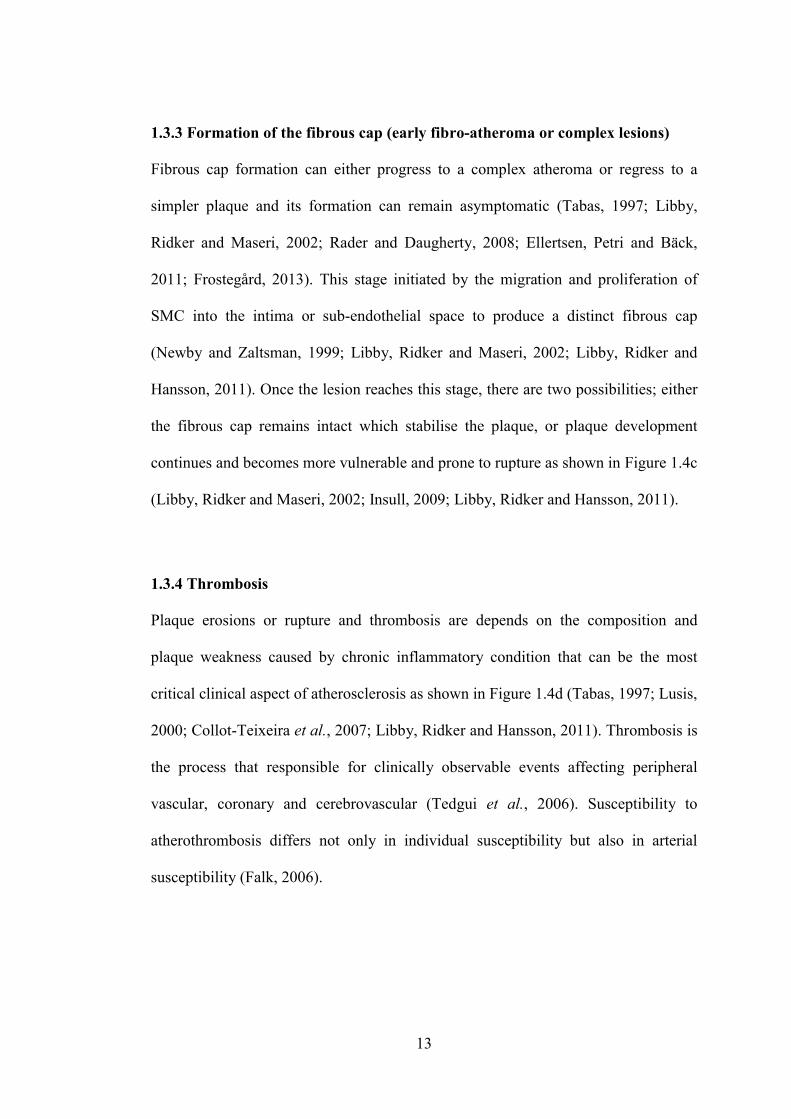
Figure 1.4: Stages in the development of atherosclerotic lesions. a) The normal artery contains three layers namely tunica adventitia, tunica media and tunica intima b) The atherogenesis initiated by the adhesion of blood leukocytes to the activated endothelial monolayer, facilitated the migration of the bound leukocytes into the intima, maturation of monocytes into macrophages, and their uptake of lipid which convert the lipid laden macrophages into foam cells. c) Lesion progression involves the migration of SMC from the media to the intima, the proliferation of SMC and the heightened synthesis of extracellular matrix macromolecules such as collagen, elastin and proteoglycans. Extracellular lipid derived from dead and dying cells can accumulate in the central region of a plaque, often denoted the lipid or necrotic core. d) Thrombosis, the ultimate complication of atherosclerosis, often complicates a physical disruption of the atherosclerotic plaque. The burst of the plaque’s fibrous cap will cause the blood coagulation components to come into contact with tissue factors in the plaque’s interior, triggering the thrombus to extend into the vessel lumen that can block blood circulation (Libby, Ridker and Hansson, 2011). (Adapted from Libby et al. 2011).
15
Dushkin, 2012; Tall and Yvancharvet, 2015; Hsu et al., 2016). The findings were
supported by in vivo studies that revealed an acceleration of the atherogenesis by
infection (Reeves et al., 2004; Rosenfeld and Campbell, 2011; Dushkin, 2012; Paik
et al., 2015). Infectious agent that has been reported as an accelerator for
atherosclerosis are including C. pneumoniae, Porphyromonasgingi- valis (P.
gingivalis), Helicobacter pylori (H. pylori), influenza A virus, hepatitis C virus
(HCV), cytomegalovirus (CMV), murine norovirus (MNV) and human
immunodeficiency virus (HIV) (Prediman K. Shah, 2001; Madjid et al., 2003;
Reeves et al., 2004; Paik et al., 2011, 2015; Rosenfeld and Campbell, 2011;
Dushkin, 2012; Tall and Yvancharvet, 2015; Hsu et al., 2016). Infectious organisms
have shown an ability to involve in the inflammation within the blood vessel either
by directly infecting vascular cells or innate immune response activation (Rosenfeld
and Campbell, 2011). Currently, there is a concept stated that not only one infectious
agent is responsible for the atherogenesis but it caused by the aggregate effects of
multiple infectious agents known as the ″infectious burden″ or ″pathogen burden″
(Prediman K. Shah, 2001; Rosenfeld and Campbell, 2011; Frostegård, 2013).
Recently, murine norovirus4 (MNV4) infection has been shown to accelerate the
atherosclerotic plaque development in mouse model of atherosclerosis (Paik et al.,
2011, 2015). The subsequent sections described about the MNV and their
involvement in atherosclerosis development.
1.5 Norovirus
Norovirus that is earlier known as “Norwalklike viruses” or “small round structured
viruses,” is a nonenveloped viruses that have a positivesense, linear and single
stranded RNA genome from caliciviridae family (Green et al. 2001; Wobus et al.
16
2004; Waugh et al. 2014). Human noroviruses are one of the major factor of
nonbacterial, epidemic gastroenteritis that typically lasting for 24 to 48 hours all over
the world and most of the cases have been reported to occur in schools, nursing
homes, hospitals, restaurants, and cruise ships (Hsu et al., 2005; Hwang et al., 2015;
Paik et al., 2015). Norovirus infection caused gastroenteritis that develop symptom
such as vomiting, diarrhea, lowgrade fever, malaise, and abdominal cramping or
pain (Wobus, Thackray and Virgin, 2006; Hsu, Riley and Livingston, 2007;
Thackray et al., 2007; Kahan et al., 2011; Strong et al., 2012; Waugh et al., 2014;
Niendorf et al., 2016). It responsible for more than 90% of all epidemic nonbacterial
gastroenteritis outbreaks (SubbaReddy et al., 2012) and causing about 23 million
infections per year in the United States alone (Thackray et al., 2007). Previously,
MNV is the only norovirus that efficiently grows in tissue culture (Gonzalez
Hernandez, Bragazzi Cunha and Wobus, 2012; Paik et al., 2015; Hsu et al., 2016).
Due to inability of human norovirus to replicate in cell culture or small animal
models, it has limited the research in order to have further understanding of the
interaction between this virus and their hosts (Hardy, 2005; McFadden et al., 2011;
Arias et al., 2012; Thorne, Bailey and Goodfellow, 2012; Waugh et al., 2014; Hwang
et al., 2015).
1.5.1 Murine norovirus (MNV)
There are four types of MNV namely MNV1, MNV2, MNV3, and MNV4
(Wobus, Thackray and Virgin, 2006). MNV1 caused transient and short duration of
infection while MNV2, MNV3 and MNV4 can cause persistent and prolonged
fecal shedding in infected immunocompetent mice infection (Wobus, Thackray and
Virgin, 2006; Hsu, Riley and Livingston, 2007; Thackray et al., 2007). Genetically,
17
MNV is the most similar to HuNV and has been widely utilised as a surrogate to
study norovirus in the cell culture system. Since first norovirus (MNV1) was
described in 2003, MNV model system has provides the first opportunity to
understand the relationship between basic mechanisms and pathogenesis of norovirus
in tissue culture and in the natural host (Wobus, Thackray and Virgin, 2006). The
identification of the first MNV strain (MNV1) propagation in the murine
macrophage cell line RAW264.7 (Thackray et al., 2007) that originally isolated from
the brain of severely immunocompromised mice by serial passage (Wobus, Thackray
and Virgin, 2006). Discovery of the MNV1 enables investigation of the molecular
mechanisms that promote norovirus evolution and development of diagnostic assays
(including immunohistochemistry) to detect viral antigens, serologic assays for
detection of antiMNV anti bodies, and molecular assays to detect viral RNA (Paik
et al., 2015; Hsu et al., 2016). MNV is one of the virus from the Caliciviridae family
that have singlestranded and positivesense RNA where it infect mice and shown
tropism toward antigenpresenting cells such as dendritic cells, macrophages and
more recently, has been reported to infect B cells (Paik et al., 2015; Hsu et al., 2016).
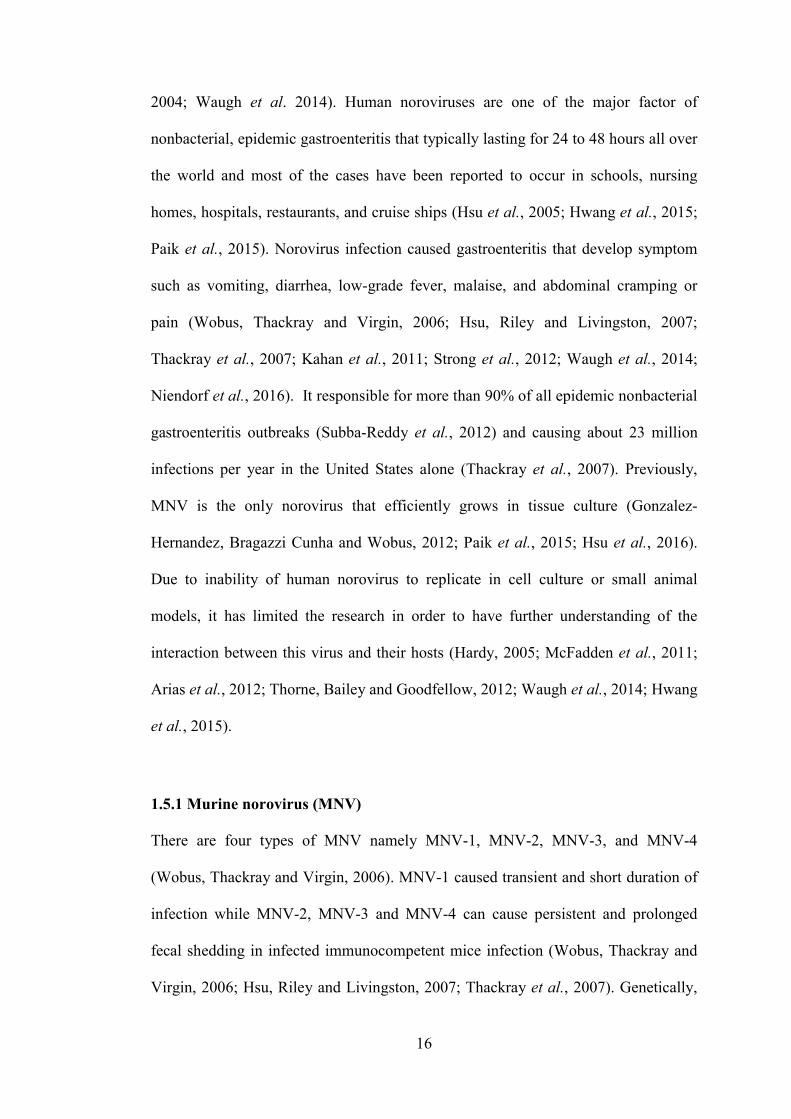
MNV genome consists of four open reading frames (ORFs) which are known as
ORF1 that encodes a large polyprotein which is cleaved to produce the viral non
structural proteins required for viral genome replication, (NS17); ORF2 that encodes
the major capsid protein VP1; ORF3 that encodes a minor structural protein VP2
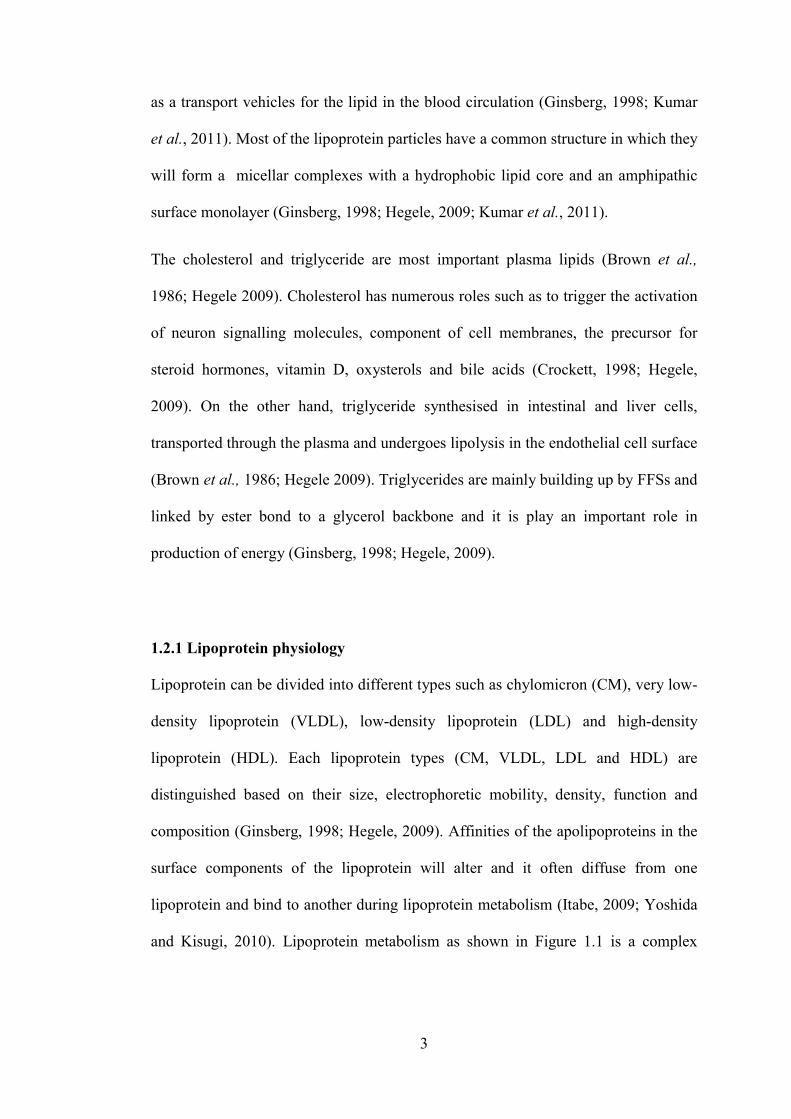
whereas ORF4 encodes for virulence factor 1 (VF1) protein as shown in Figure 1.5
(McFadden et al., 2011; Arias et al., 2012).
18
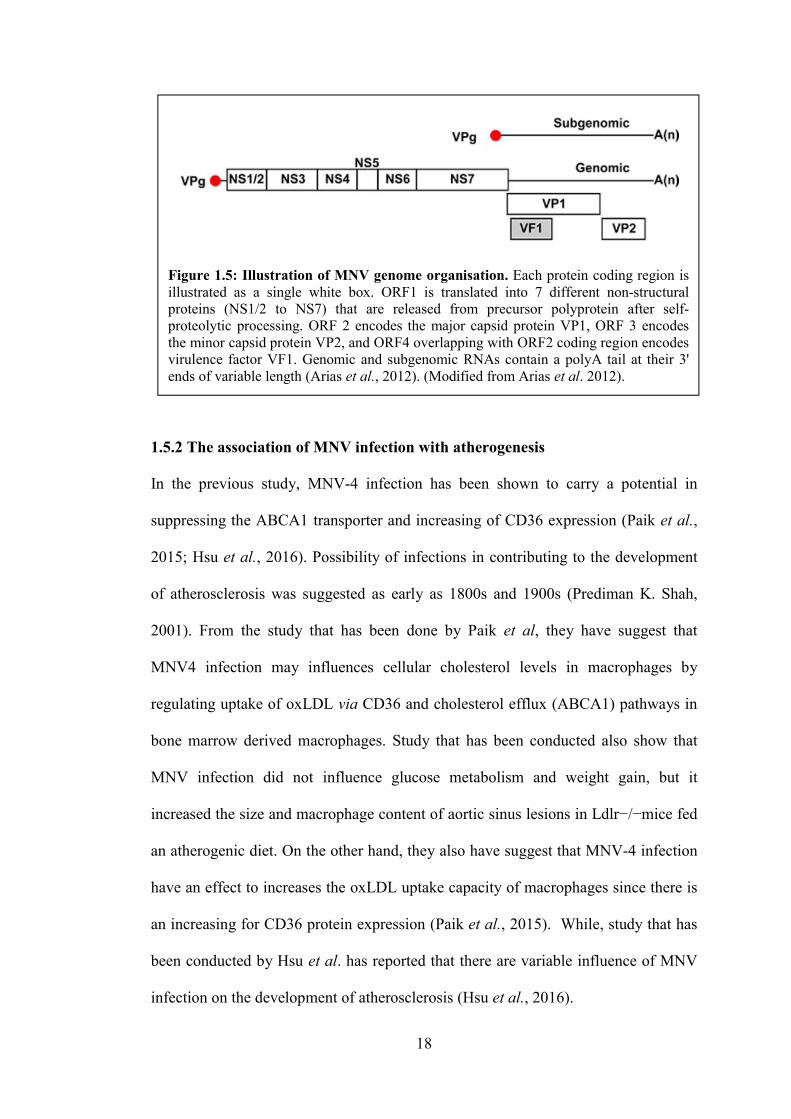
1.5.2 The association of MNV infection with atherogenesis
In the previous study, MNV4 infection has been shown to carry a potential in
suppressing the ABCA1 transporter and increasing of CD36 expression (Paik et al.,
2015; Hsu et al., 2016). Possibility of infections in contributing to the development
of atherosclerosis was suggested as early as 1800s and 1900s (Prediman K. Shah,
2001). From the study that has been done by Paik et al, they have suggest that
MNV4 infection may influences cellular cholesterol levels in macrophages by
regulating uptake of oxLDL via CD36 and cholesterol efflux (ABCA1) pathways in
bone marrow derived macrophages. Study that has been conducted also show that
MNV infection did not influence glucose metabolism and weight gain, but it
increased the size and macrophage content of aortic sinus lesions in Ldlr−/−mice fed
an atherogenic diet. On the other hand, they also have suggest that MNV4 infection
have an effect to increases the oxLDL uptake capacity of macrophages since there is
an increasing for CD36 protein expression (Paik et al., 2015). While, study that has
been conducted by Hsu et al. has reported that there are variable influence of MNV
infection on the development of atherosclerosis (Hsu et al., 2016).
Figure 1.5: Illustration of MNV genome organisation. Each protein coding region is illustrated as a single white box. ORF1 is translated into 7 different nonstructural proteins (NS1/2 to NS7) that are released from precursor polyprotein after selfproteolytic processing. ORF 2 encodes the major capsid protein VP1, ORF 3 encodes the minor capsid protein VP2, and ORF4 overlapping with ORF2 coding region encodes virulence factor VF1. Genomic and subgenomic RNAs contain a polyA tail at their 3' ends of variable length (Arias et al., 2012). (Modified from Arias et al. 2012).
19
1.6 Peroxisome Proliferator Activated Receptor (PPAR)
Peroxisome proliferator activated receptors (PPAR) are transcription factors that is
ligandactivated from a subfamily of the nuclear receptor gene family (Issemann and
Green, 1990; Nagy et al., 1998; Azhar, 2010; Libby, Ridker and Hansson, 2011).
PPARs exist in three subtypes namely PPARα, PPARδ/β, and PPARγ that is result
from differential splicing (Brun et al. 1996; Ray et al. 2006; Tyagi et al. 2011;
Norazmi et al. 2012). PPARα (NR1C1) is expressed in tissues with high fatty acid
(FA) oxidation, such as heart, kidney, brown adipose tissue (BAT), and liver, where
it regulates FA transport, esterification and oxidation via transcriptional activation of
genes encoding enzymes involved in each step of FA breakdown. PPARγ (NR1C3)
is predominantly express in adipose tissue and plays ban essential role in adipocyte
differentiation and survival (Desvergne and Wahli, 1999; Evans et al., 2004; Metzger
et al., 2005). While PPARβ/δ (NR1C2) is expressed ubiquitously but abundantly
detected in skeletal muscle (Escher et al., 2001).
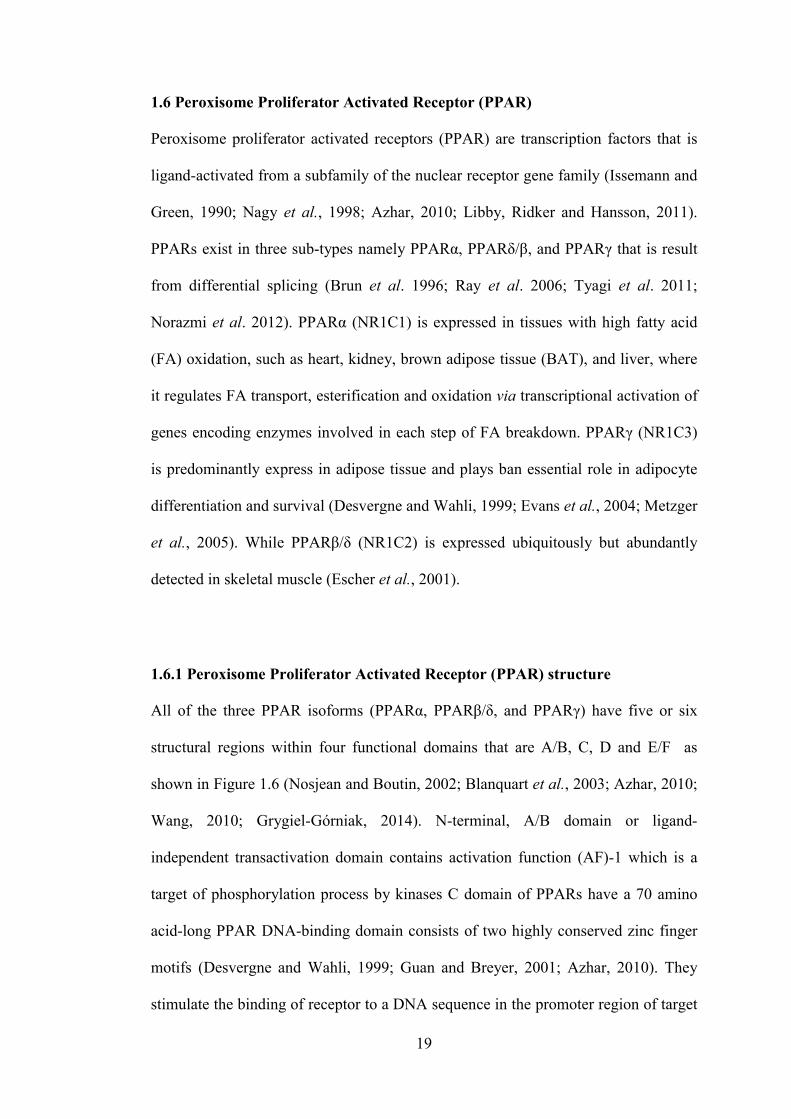
1.6.1 Peroxisome Proliferator Activated Receptor (PPAR) structure
All of the three PPAR isoforms (PPARα, PPARβ/δ, and PPARγ) have five or six
structural regions within four functional domains that are A/B, C, D and E/F as
shown in Figure 1.6 (Nosjean and Boutin, 2002; Blanquart et al., 2003; Azhar, 2010;
Wang, 2010; GrygielGórniak, 2014). Nterminal, A/B domain or ligand
independent transactivation domain contains activation function (AF)1 which is a
target of phosphorylation process by kinases C domain of PPARs have a 70 amino
acidlong PPAR DNAbinding domain consists of two highly conserved zinc finger
motifs (Desvergne and Wahli, 1999; Guan and Breyer, 2001; Azhar, 2010). They
stimulate the binding of receptor to a DNA sequence in the promoter region of target
20
genes known as the peroxisome proliferator response element (PPRE) (Zhang and
Young, 2002; Argmann et al., 2003; Khoo et al., 2003; GrygielGórniak, 2014). The
D domain or hinge region of PPAR acts as a base for cofactors binding (Auwerx,
1999; Debril et al., 2001; Azhar, 2010). While, Cterminal, E/F domain or ligand
binding domain (LBD) playing a main role for ligand specificity and activation of
PPAR that lead to PPRE binding, thus increasing target genes expression (Desvergne
and Wahli, 1999; Cunard et al., 2004; Azhar, 2010; Lefebvre, Benomar and Staels,
2010). Liganddependent transactivation function 2 (AF2) is responsible for
recruitment of cofactors in order to assist the transactivation process (Desvergne and
Wahli, 1999; Cunard et al., 2004; Azhar, 2010; Lefebvre, Benomar and Staels,
2010).
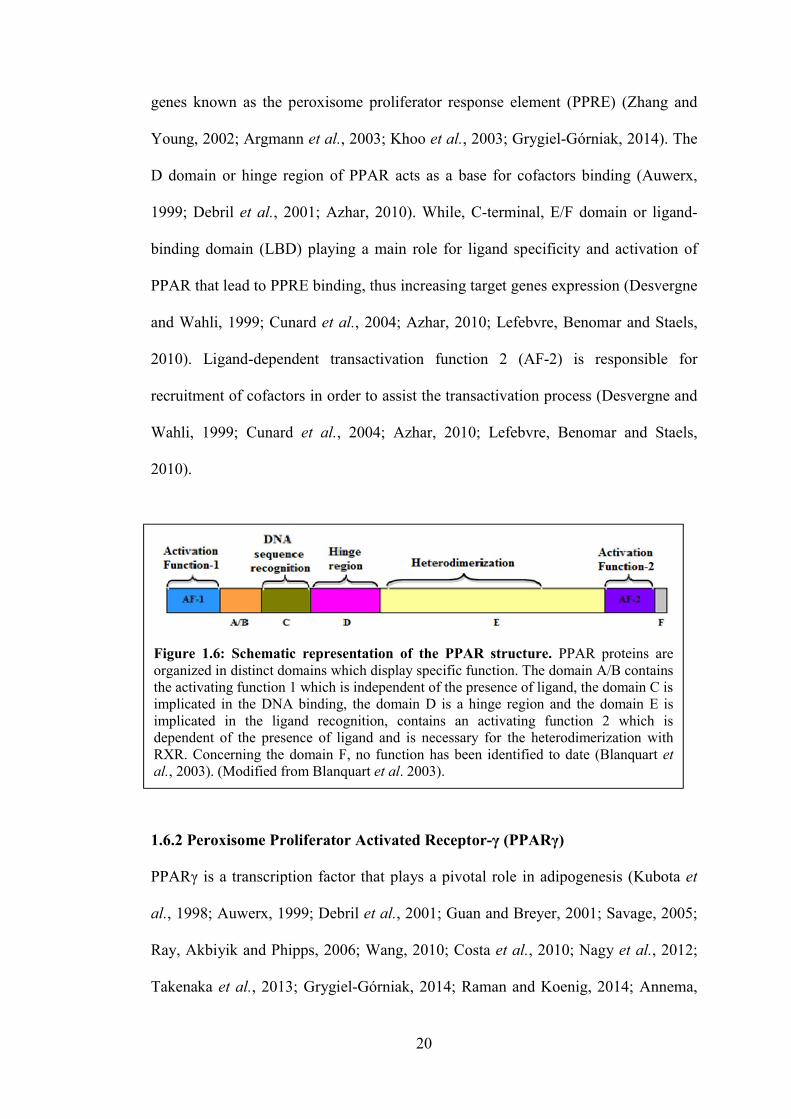
1.6.2 Peroxisome Proliferator Activated Receptor-γ (PPARγ)
PPARγ is a transcription factor that plays a pivotal role in adipogenesis (Kubota et
al., 1998; Auwerx, 1999; Debril et al., 2001; Guan and Breyer, 2001; Savage, 2005;
Ray, Akbiyik and Phipps, 2006; Wang, 2010; Costa et al., 2010; Nagy et al., 2012;
Takenaka et al., 2013; GrygielGórniak, 2014; Raman and Koenig, 2014; Annema,
Figure 1.6: Schematic representation of the PPAR structure. PPAR proteins are organized in distinct domains which display specific function. The domain A/B contains the activating function 1 which is independent of the presence of ligand, the domain C is implicated in the DNA binding, the domain D is a hinge region and the domain E is implicated in the ligand recognition, contains an activating function 2 which is dependent of the presence of ligand and is necessary for the heterodimerization with RXR. Concerning the domain F, no function has been identified to date (Blanquart et al., 2003). (Modified from Blanquart et al. 2003).