ROLE OF GENETIC VARIATION OF αS1 CASEIN, LACTATION TIME ...
18
Egyptian Journal of Sheep & Goat Sciences, Vol. 11, No. 1, P: 17- 34 , April 2016 ISSN : 2090-0368 - Online ISSN : 2090-0376 (Website : http://www.easg.eg.net) 17 ROLE OF GENETIC VARIATION OF αS1-CASEIN, LACTATION TIME AND PARITY ON MILK PRODUCTION AND COMPOSITION OF ZARAIBI GOATS Doaa F. Teleb 1* , Jehane I. Eid 2,3 , Elbeltagy A. R 4 , Shaimaa A. Mohamed 1 , Akmal A. El-Ghor 2 1 Sheep & Goat Research Department, Animal Production Research Institute. 2 Zoology Department, Faculty of Science, Cairo University – 12613 3 Department of Biology, Faculty of Applied Science, Umm Al-Qura University, Makkah Al- Mukarramah, Kingdom of Saudi Arabia 4 Biotechnology Research Department, Animal Production Research Institute, Ministry of Agriculture and Land Reclamation, Dokki,. Giza, Egypt. * Corresponding author- Email address: [email protected] ABSTRACT The aim of this study was to investigate the effect of CSN1S1 gene polymorphism, time of lactation and parity on milk quantity and quality. A total number of 165 Zaraibi goats (105 kids, 7 bucks and 53 does) after kidding season of February/ March 2013 were used in this experiment. The electrophoretic pattern of digested fragments of PCR amplified goat CSN1S1 products with XmnI enzyme showed the presence of 9 genotypes, 4 homozygous (AA, BB, CC and DD) and the other 5 heterozygous (AC, AD, BC, BD and CD). The nine genotypes were derived from 4 alleles; three strong alleles (A, B and C) with frequencies (17.76, 27.63 and 26.97%, respectively) and one intermediate allele (D) with frequency 27.63%. BB and CC were the most common homozygous genotypes detected in the present study with similar frequency (18.42%) followed by DD (17.76%), BD (13.82%), AA (10.53%), AC (10.53%), BC (4.61%), AD (3.95%) and CD (1.97%). Daily milk yield, percentage of milk fat, protein, total solid and solid not fat significantly affected by CSN1S1 genotypes. Zaraibi does carrying AD variant showed the highest levels of daily milk yield, fat, protein, total solid and solid not fat. Sequence analysis showed that only the deletion of nucleotide C in allele A caused substitution of TTC to TTG forming Leu (Leucine) instead of Phe (Phenyl alanine) in mature protein. Meanwhile, no polymorphism detected between nucleotide 1 and 274 at amplified sequence of exon 9, so this region is considered as a highly conserved among alleles (A, B, C and D). Daily milk yields in Zaraibi does were significantly high at the first week after kidding, peaked at the 2 nd week then decrease till the end of lactation. Moreover, the highest milk yields were recorded in does at the 7 th and 6 th parities, while the lowest values observed in does at the 1 st and 2 nd parities. In addition, percentages of fat and total solids were the highest at day 90 (end of suckling period) than during days 120 and 210 of lactation period. Milk protein was the highest at end of lactation (day 210), while lactose levels showed the lowest values. In conclusion, studying genetic polymorphism for Zaraibi goats CSN1S1 gene is important for identifying favorable genotypes associated with high milk yields, protein and fat. Breeding program would be changed toward selecting animals carrying the strong and mild alleles for milk protein and fat required for economic goat milk industry. Key words: Goats, CSN1S1 polymorphism, lactation time, parity, milk yield, milk composition.
Transcript of ROLE OF GENETIC VARIATION OF αS1 CASEIN, LACTATION TIME ...
Egyptian Journal of Sheep & Goat Sciences, Vol. 11, No. 1, P: 17- 34 , April 2016
ISSN : 2090-0368 - Online ISSN : 2090-0376 (Website : http://www.easg.eg.net) 17
ROLE OF GENETIC VARIATION OF αS1-CASEIN, LACTATION TIME AND PARITY ON MILK PRODUCTION AND COMPOSITION OF ZARAIBI GOATS
Doaa F. Teleb1*, Jehane I. Eid2,3, Elbeltagy A. R4, Shaimaa A. Mohamed1, Akmal A. El-Ghor2
1Sheep & Goat Research Department, Animal Production Research Institute.
2Zoology Department, Faculty of Science, Cairo University – 12613
3Department of Biology, Faculty of Applied Science, Umm Al-Qura University, Makkah Al-
Mukarramah, Kingdom of Saudi Arabia
4Biotechnology Research Department, Animal Production Research Institute, Ministry of
Agriculture and Land Reclamation, Dokki,. Giza, Egypt.
* Corresponding author- Email address: [email protected]
ABSTRACT
The aim of this study was to investigate the effect of CSN1S1 gene polymorphism, time of
lactation and parity on milk quantity and quality. A total number of 165 Zaraibi goats (105 kids, 7 bucks
and 53 does) after kidding season of February/ March 2013 were used in this experiment. The
electrophoretic pattern of digested fragments of PCR amplified goat CSN1S1 products with XmnI
enzyme showed the presence of 9 genotypes, 4 homozygous (AA, BB, CC and DD) and the other 5
heterozygous (AC, AD, BC, BD and CD). The nine genotypes were derived from 4 alleles; three strong
alleles (A, B and C) with frequencies (17.76, 27.63 and 26.97%, respectively) and one intermediate
allele (D) with frequency 27.63%. BB and CC were the most common homozygous genotypes detected
in the present study with similar frequency (18.42%) followed by DD (17.76%), BD (13.82%), AA
(10.53%), AC (10.53%), BC (4.61%), AD (3.95%) and CD (1.97%). Daily milk yield, percentage of
milk fat, protein, total solid and solid not fat significantly affected by CSN1S1 genotypes. Zaraibi does
carrying AD variant showed the highest levels of daily milk yield, fat, protein, total solid and solid not
fat. Sequence analysis showed that only the deletion of nucleotide C in allele A caused substitution of
TTC to TTG forming Leu (Leucine) instead of Phe (Phenyl alanine) in mature protein. Meanwhile, no
polymorphism detected between nucleotide 1 and 274 at amplified sequence of exon 9, so this region is
considered as a highly conserved among alleles (A, B, C and D).
Daily milk yields in Zaraibi does were significantly high at the first week after kidding, peaked
at the 2nd week then decrease till the end of lactation. Moreover, the highest milk yields were recorded
in does at the 7th and 6th parities, while the lowest values observed in does at the 1st and 2nd parities. In
addition, percentages of fat and total solids were the highest at day 90 (end of suckling period) than
during days 120 and 210 of lactation period. Milk protein was the highest at end of lactation (day 210),
while lactose levels showed the lowest values.
In conclusion, studying genetic polymorphism for Zaraibi goats CSN1S1 gene is important for
identifying favorable genotypes associated with high milk yields, protein and fat. Breeding program
would be changed toward selecting animals carrying the strong and mild alleles for milk protein and fat
required for economic goat milk industry.
Key words: Goats, CSN1S1 polymorphism, lactation time, parity, milk yield, milk composition.
ROLE OF GENETIC VARIATION OF αS1-CASEIN, LACTATION TIME AND PARITY ON MILK PRODUCTION AND COMPOSITION OF ZARAIBI GOATS
Doaa F. Teleb, et al., 2016 18
INTRODUCTION
In Egypt, Zaraibi (Egyptian Nubian) goats
are the most promising dairy goat among the local
Egyptian breeds. They characterize by high
genetic potential as a dairy and prolific breed
which reared mainly for milk production (Marai
et al., 2001 and Galal et al., 2005). Interest in the
use of goat milk has been increased lately, as goat's
milk composition is very similar to cow's milk
which make it widely used for processing
(consume goat milk, cheese, yoghurts, fermented
milk products, etc.). Another important aspect to
be considered is the growing importance of the use
of goat milk as an alternative to cow milk in the
infant diet because of its digestibility and low
allergicity (Mowlem, 2005).
Ruminant milk production and
composition is influenced by several factors as
breed, age, stage of lactation, nutrition,
environment and genetic factors (Clark and
Sherbon, 2000).
In goat milk, the main protein fractions are
caseins. They affect the physiochemical,
nutritional and technological properties of milk
and thus exhibit both quantitative and qualitative
variation arising from genetic polymorphism in
the encoded genes (Ramunno et al., 2000 &
2001). They proposed as polymorphic markers for
the selection in order to improve yield and quality
of milk (Othman et al., 2013). Four caseins were
expressed in goats' milk (αs1, αs2, β- and κ-
caseins) coded by the CSN1S1, CSN1S2, CSN2
and CSN3, respectively. They are located within
250-kb segment of caprine chromosome 6
(Martin et al., 2002). CSN1S1 is the most
polymorphic casein gene, where more than 17
alleles (A, B1, B2, B3, B4, C, D, E, F, G, H, I, L,
M, N, 01 and 02) have been detected and grouped
into 4 classes according to its expression levels in
milk. Each allele has unique characteristic from
single nucleotide substitution/ deletions to large
insertion/ deletions or interallelic recombination
(Cosenza et al., 2003 and Ramunno et al., 2005).
Since, milk quantity and quality varies
greatly between different genotypes raised at
different locations, detection of candidate genes
and suitable genetic markers for milk production
traits are very important. So, this study was
designed to investigate the effect of genetic
polymorphism of CSN1S1 gene, as well as,
lactation time and animal parity on milk yield and
composition in Zaraibi goats.
MATERIALS AND METHODS
Animals and Management
This study was carried out at Sakha
Experimental Station, Kafr El-Sheikh, Animal
Production Research Institute (APRI), Agriculture
Research Center (ARC), Ministry of Agriculture
and Land Reclamation (MALR).
A total number of 165 Zaraibi goats (105
kids, 7 bucks and 53 does) were chosen after
kidding season of February/ March 2013. Does
weight ranged from 28 to 42 kg and age between
24 to 108 months. All animals were fed according
to NRC (2007) allowances. Water and salt mineral
blocks were available all the time.
Milk and blood samples
Milk yields of 50 Zaraibi does were
recorded during suckling at days 7, 14, 30, 60 and
90 and during lactation period at days 120 and 210
for daily and total milk yield calculation. During
suckling, milking was done using oxytocin
technique according to Banda et al. (2006).
Meanwhile, does were machine milked during
lactation period. The amount of milk measured on
day 7 after kidding multiplied by 7 to calculate the
yield of the first week. Average milk yields at days
14, 30, 60, 90, 120 and 210 were calculated by
multiplying daily milk records by the number of
days. Moreover, total milk yield was estimated by
summing milk yields taken during suckling and
lactation periods.
Ten ml of blood samples were collected
from all animals on ethylenediaminetetraacetic
acid (EDTA) as anticoagulant and kept in -20°C
for DNA extraction.
Egyptian Journal of Sheep & Goat Sciences, Vol. 11, No. 1, P: 17- 34 , April 2016
ISSN : 2090-0368 - Online ISSN : 2090-0376 (Website : http://www.easg.eg.net) 19
DNA extraction, Quantification and
Sequencing
Genomic DNA was extracted from all
collected blood samples using salting out method
as described by Miller et al. (1988). The
concentrations and purity of extracted DNA were
measured using spectrophotometer (Eppendorf
Biophotometer plus) at wavelengths 260 and 280
nm.
PCR Amplification was performed on Bio Rad
thermal cycler (model C1000). Amplification
protocol of CSN1S1was carried out according to
Ramunno et al. (2000) with changing annealing
temperature to 59oC (Table 1). Moreover,
restriction analysis was performed by using Fast
Digest XmnI restriction enzyme (Cat. No.:
#FD1534).
Allele specific PCR (AS-PCR) method
was used to distinguish allele A from 0 (Cosenza
et al., 2003) and allele B from E (Feligini et al.,
2005). The primers used for AS- PCR are
illustrated in Table (1).
PCR and PCR- RFLP products were run
directly by electrophoresis using 1% agarose gel
that stained with ethidium bromide in 1X TBE
(Tris- base buffer), where GeneRuler 50 bp
(Thermo Scientific) was used as molecular size
marker. The bands were visualized under ultra-
violet (UV) light and photographed with Gel
Documentation system (SynGene, GeneTools-File
version: 4.02.03, France). Gel-Pro Analyzer
program (Media Cybernetics, Silver Spring, MD,
USA, v3.1.0.0) was used to estimate the size and
quantity of the band representing each allele.
In order to determine genetic
polymorphism of CSN1S1 in Zaraibi goats, the
region between nucleotides 208 and 420 (part of
intron 8, exon 9 and part of the intron 9) was
amplified (Accession no. X56462.1). Cycle
sequencing reaction was performed using
BigDye® Terminator (v3.1) cycle sequencing Kit
(Applied Biosystems). Amplicons representing
unique banding patterns of CSN1S1 gene was
sequenced using automated DNA ABI Prism
(3130) Genetic Analyzer based on
dideoxynucleotide chain-termination technique
(Sanger et al., 1977). Multiple Sequence
alignment was performed with BioEdit sequence
alignment editor program (v7.2.5). The BLAST
algorithm was used to search the NCBI (National
Center for Biotechnology Information) Gen Bank
(http://www.ncbi.nlm.nih.gov/) for homologous
sequences of CSN1S1 in goats.
Milk Analysis
Milk samples from morning milking at
days 90, 120 and 210 were used for chemical
analysis. Milk components (percentage of fat,
protein, lactose, total solid and solid not fat) were
estimated using infra-red spectroscopy (Milko-
Scan 133B; N. Foss Electric, DK 3400 Hillerod,
Denmark) according to (Smith et al., 1993 and
Lynch et al., 2006).
Statistical Analysis
Genotypes were estimated by counting the
electrophoretic pattern of PCR amplified goat
CSN1S1 products. Alleles and genotypes
frequencies were calculated according to the
formulas:
ƒ(A) =[(AA*2+AC+AD)/2N] for alleles
frequencies.
ƒ(AA) = ƒ(A)*ƒ(A)*N, for homozygous
genotype frequencies
ƒ(AC) = ƒ(A)* ƒ(C)*N for heterozygous
genotypes frequencies,
where A is allele and AA, AC and AD were
the counted genotype and N is number of tested
individuals.
The calculated frequencies for alleles and
genotypes should verify Hardy-Weinberg
equilibrium where [ƒ(A)+ƒ(B)+ƒ(C)+ƒ (D)]2=1
All collected data were statistically
analyzed using General Linear Models (SAS,
2000). Results were expressed as least square
means (LSM± SE). Two models were used in this
study, the first model was to estimate the effect of
time and parity on daily milk yields, while the
ROLE OF GENETIC VARIATION OF αS1-CASEIN, LACTATION TIME AND PARITY ON MILK PRODUCTION AND COMPOSITION OF ZARAIBI GOATS
20 Doaa F. Teleb, et al., 2016
second one was used to explore the effect of
CSN1S1 genotypes on daily milk yield and
composition.
First model:
Yijk= µ+Ti+Pj+eijk
Where,
μ = the overall mean,
Y= the observed records of daily milk yield and
milk composition,
Ti= the fixed effect of ith time of daily milk yield
(i=7, 14, 30, 60, 90, 120, 210) or the fixed effect
of time of milk composition (i = 90, 120, 210),
Pj= the fixed effect of jth parity of does
(j=1,……7),
eijk= Random error.
Second model:
Yij=µ+GAi+eij
Where,
μ = the overall mean,
Y= the observed records of daily milk yield and
milk composition (at 90, 120, 210 days).
GAi= the fixed effect of ith CSN1S1 genotypes
(i = AA, BB, CC, DD, AC, AD, BD),
eij= Random error.
RESULTS AND DISCUSSION
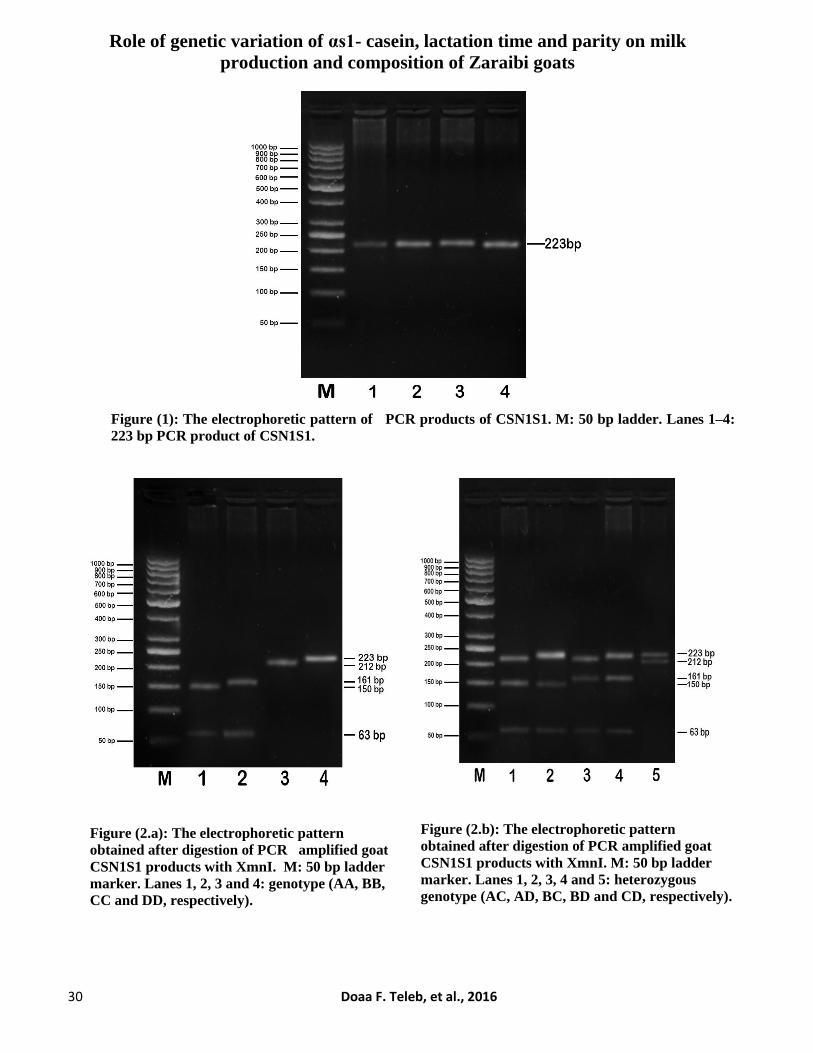
CSN1S1 Polymorphism
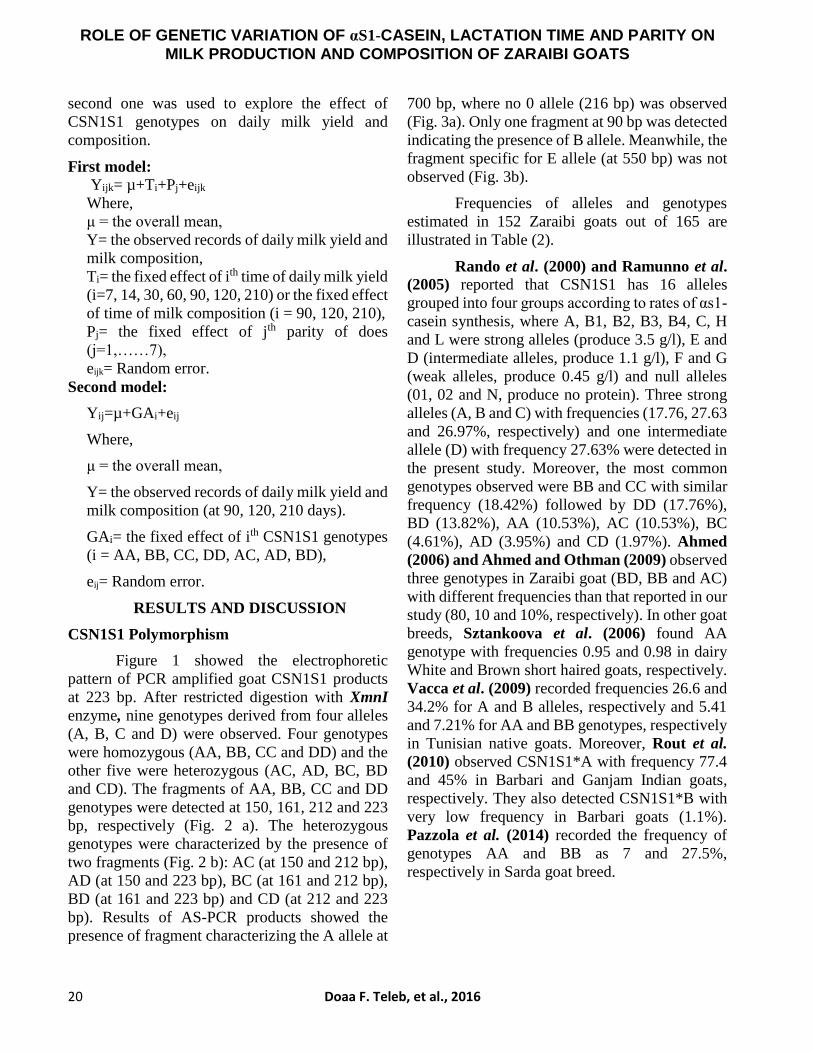
Figure 1 showed the electrophoretic
pattern of PCR amplified goat CSN1S1 products
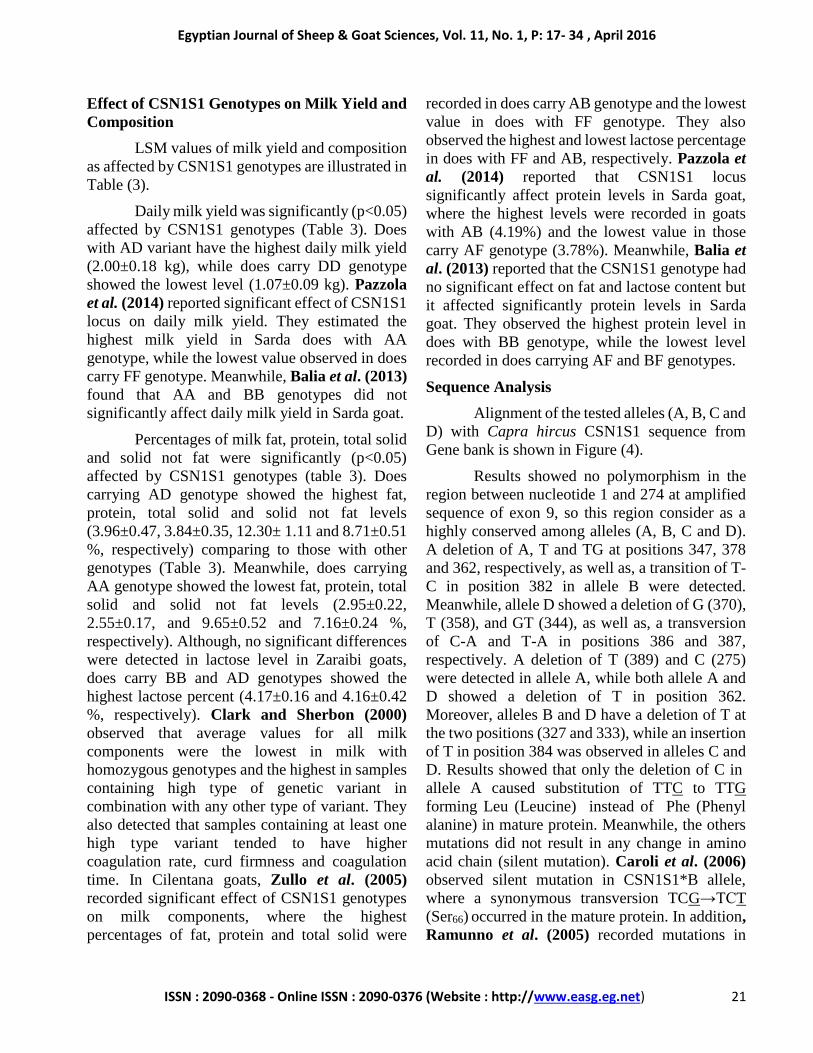
at 223 bp. After restricted digestion with XmnI
enzyme, nine genotypes derived from four alleles
(A, B, C and D) were observed. Four genotypes
were homozygous (AA, BB, CC and DD) and the
other five were heterozygous (AC, AD, BC, BD
and CD). The fragments of AA, BB, CC and DD
genotypes were detected at 150, 161, 212 and 223
bp, respectively (Fig. 2 a). The heterozygous
genotypes were characterized by the presence of
two fragments (Fig. 2 b): AC (at 150 and 212 bp),
AD (at 150 and 223 bp), BC (at 161 and 212 bp),
BD (at 161 and 223 bp) and CD (at 212 and 223
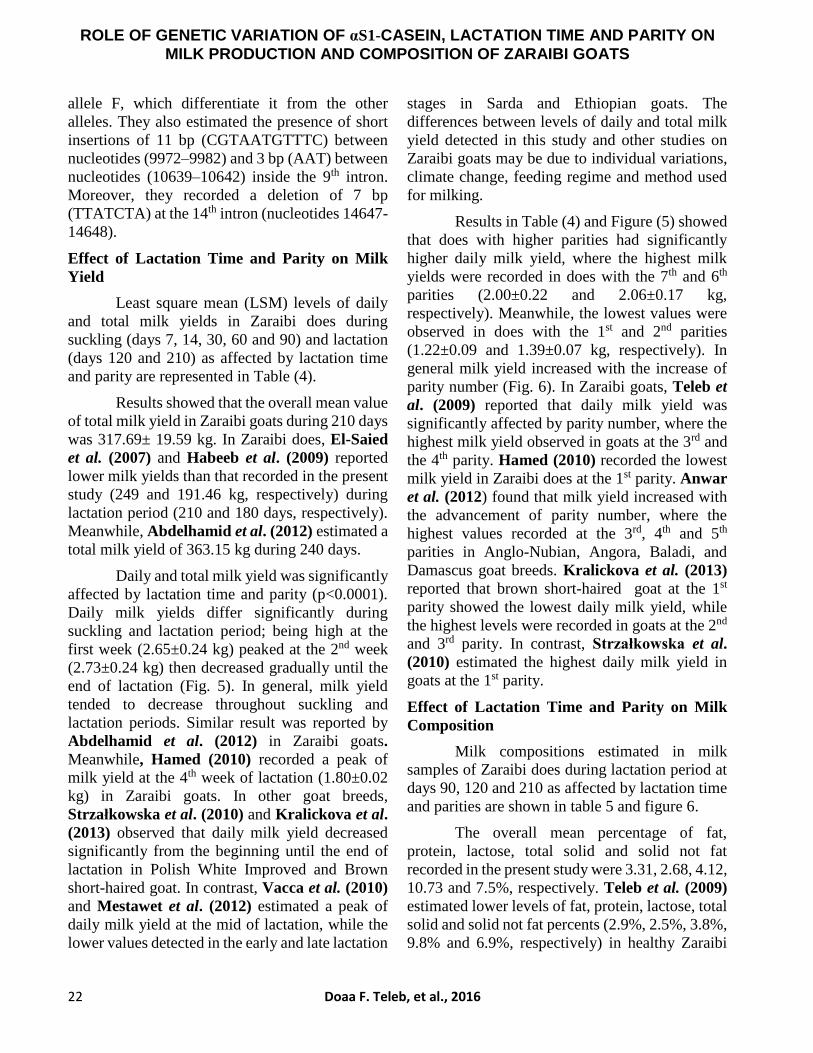
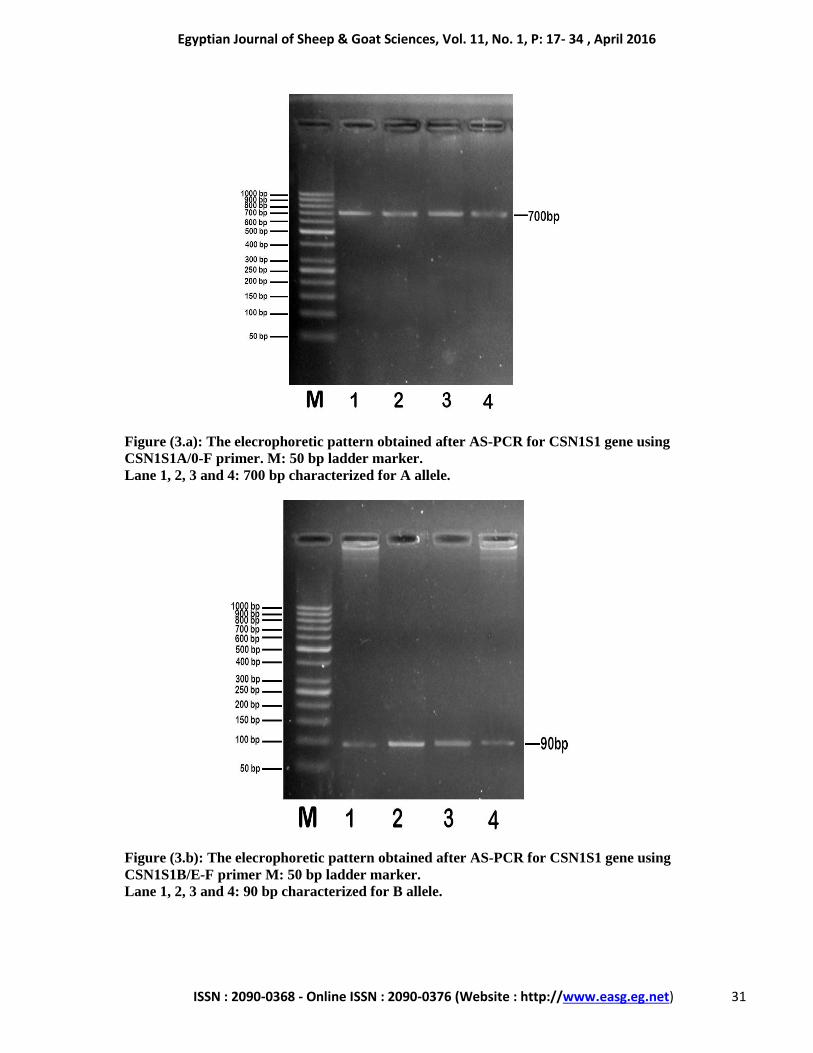
bp). Results of AS-PCR products showed the
presence of fragment characterizing the A allele at
700 bp, where no 0 allele (216 bp) was observed
(Fig. 3a). Only one fragment at 90 bp was detected
indicating the presence of B allele. Meanwhile, the
fragment specific for E allele (at 550 bp) was not
observed (Fig. 3b).
Frequencies of alleles and genotypes
estimated in 152 Zaraibi goats out of 165 are
illustrated in Table (2).
Rando et al. (2000) and Ramunno et al.
(2005) reported that CSN1S1 has 16 alleles
grouped into four groups according to rates of αs1-
casein synthesis, where A, B1, B2, B3, B4, C, H
and L were strong alleles (produce 3.5 g/l), E and
D (intermediate alleles, produce 1.1 g/l), F and G
(weak alleles, produce 0.45 g/l) and null alleles
(01, 02 and N, produce no protein). Three strong
alleles (A, B and C) with frequencies (17.76, 27.63
and 26.97%, respectively) and one intermediate
allele (D) with frequency 27.63% were detected in
the present study. Moreover, the most common
genotypes observed were BB and CC with similar
frequency (18.42%) followed by DD (17.76%),
BD (13.82%), AA (10.53%), AC (10.53%), BC
(4.61%), AD (3.95%) and CD (1.97%). Ahmed
(2006) and Ahmed and Othman (2009) observed
three genotypes in Zaraibi goat (BD, BB and AC)
with different frequencies than that reported in our
study (80, 10 and 10%, respectively). In other goat
breeds, Sztankoova et al. (2006) found AA
genotype with frequencies 0.95 and 0.98 in dairy
White and Brown short haired goats, respectively.
Vacca et al. (2009) recorded frequencies 26.6 and
34.2% for A and B alleles, respectively and 5.41
and 7.21% for AA and BB genotypes, respectively
in Tunisian native goats. Moreover, Rout et al.
(2010) observed CSN1S1*A with frequency 77.4
and 45% in Barbari and Ganjam Indian goats,
respectively. They also detected CSN1S1*B with
very low frequency in Barbari goats (1.1%).
Pazzola et al. (2014) recorded the frequency of
genotypes AA and BB as 7 and 27.5%,
respectively in Sarda goat breed.
Egyptian Journal of Sheep & Goat Sciences, Vol. 11, No. 1, P: 17- 34 , April 2016
ISSN : 2090-0368 - Online ISSN : 2090-0376 (Website : http://www.easg.eg.net) 21
Effect of CSN1S1 Genotypes on Milk Yield and
Composition
LSM values of milk yield and composition
as affected by CSN1S1 genotypes are illustrated in
Table (3).
Daily milk yield was significantly (p<0.05)
affected by CSN1S1 genotypes (Table 3). Does
with AD variant have the highest daily milk yield
(2.00±0.18 kg), while does carry DD genotype
showed the lowest level (1.07±0.09 kg). Pazzola
et al. (2014) reported significant effect of CSN1S1
locus on daily milk yield. They estimated the
highest milk yield in Sarda does with AA
genotype, while the lowest value observed in does
carry FF genotype. Meanwhile, Balia et al. (2013)
found that AA and BB genotypes did not
significantly affect daily milk yield in Sarda goat.
Percentages of milk fat, protein, total solid
and solid not fat were significantly (p<0.05)
affected by CSN1S1 genotypes (table 3). Does
carrying AD genotype showed the highest fat,
protein, total solid and solid not fat levels
(3.96±0.47, 3.84±0.35, 12.30± 1.11 and 8.71±0.51
%, respectively) comparing to those with other
genotypes (Table 3). Meanwhile, does carrying
AA genotype showed the lowest fat, protein, total
solid and solid not fat levels (2.95±0.22,
2.55±0.17, and 9.65±0.52 and 7.16±0.24 %,
respectively). Although, no significant differences
were detected in lactose level in Zaraibi goats,
does carry BB and AD genotypes showed the
highest lactose percent (4.17±0.16 and 4.16±0.42
%, respectively). Clark and Sherbon (2000)
observed that average values for all milk
components were the lowest in milk with
homozygous genotypes and the highest in samples
containing high type of genetic variant in
combination with any other type of variant. They
also detected that samples containing at least one
high type variant tended to have higher
coagulation rate, curd firmness and coagulation
time. In Cilentana goats, Zullo et al. (2005)
recorded significant effect of CSN1S1 genotypes
on milk components, where the highest
percentages of fat, protein and total solid were
recorded in does carry AB genotype and the lowest
value in does with FF genotype. They also
observed the highest and lowest lactose percentage
in does with FF and AB, respectively. Pazzola et
al. (2014) reported that CSN1S1 locus
significantly affect protein levels in Sarda goat,
where the highest levels were recorded in goats
with AB (4.19%) and the lowest value in those
carry AF genotype (3.78%). Meanwhile, Balia et
al. (2013) reported that the CSN1S1 genotype had
no significant effect on fat and lactose content but
it affected significantly protein levels in Sarda
goat. They observed the highest protein level in
does with BB genotype, while the lowest level
recorded in does carrying AF and BF genotypes.
Sequence Analysis
Alignment of the tested alleles (A, B, C and
D) with Capra hircus CSN1S1 sequence from
Gene bank is shown in Figure (4).
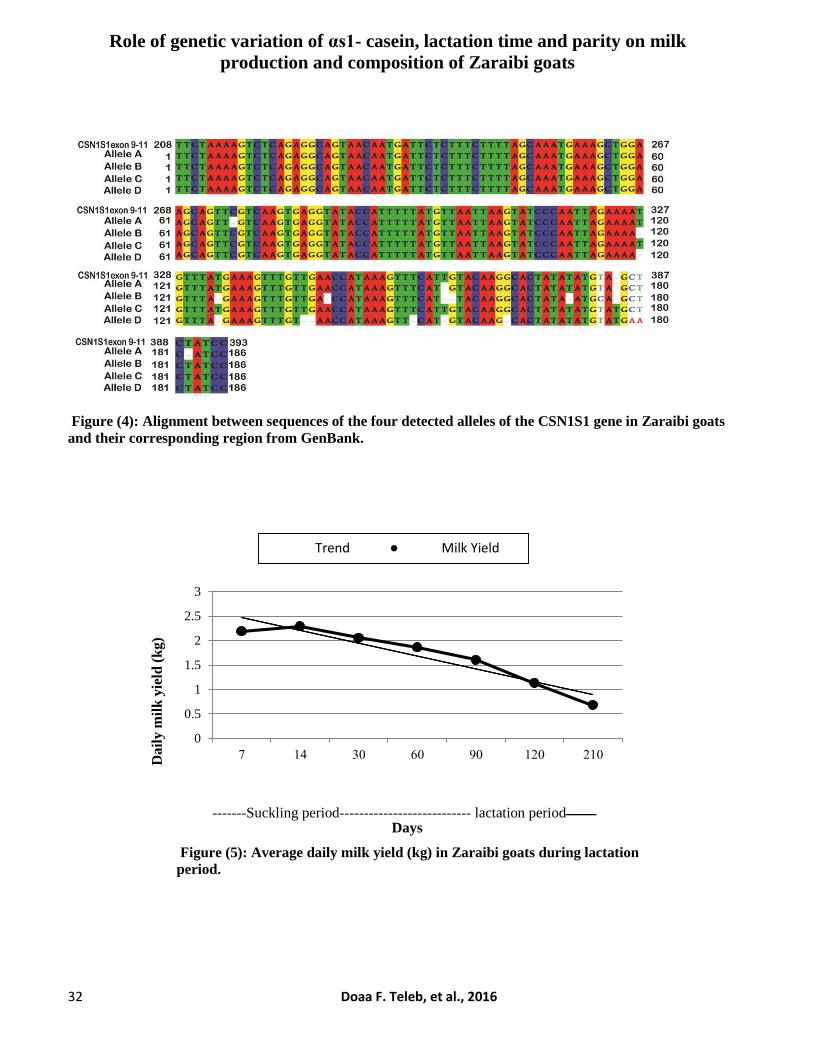
Results showed no polymorphism in the
region between nucleotide 1 and 274 at amplified
sequence of exon 9, so this region consider as a
highly conserved among alleles (A, B, C and D).
A deletion of A, T and TG at positions 347, 378
and 362, respectively, as well as, a transition of T-
C in position 382 in allele B were detected.
Meanwhile, allele D showed a deletion of G (370),
T (358), and GT (344), as well as, a transversion
of C-A and T-A in positions 386 and 387,
respectively. A deletion of T (389) and C (275)
were detected in allele A, while both allele A and
D showed a deletion of T in position 362.
Moreover, alleles B and D have a deletion of T at
the two positions (327 and 333), while an insertion
of T in position 384 was observed in alleles C and
D. Results showed that only the deletion of C in
allele A caused substitution of TTC to TTG
forming Leu (Leucine) instead of Phe (Phenyl
alanine) in mature protein. Meanwhile, the others
mutations did not result in any change in amino
acid chain (silent mutation). Caroli et al. (2006)
observed silent mutation in CSN1S1*B allele,
where a synonymous transversion TCG→TCT
(Ser66) occurred in the mature protein. In addition,
Ramunno et al. (2005) recorded mutations in
ROLE OF GENETIC VARIATION OF αS1-CASEIN, LACTATION TIME AND PARITY ON MILK PRODUCTION AND COMPOSITION OF ZARAIBI GOATS
22 Doaa F. Teleb, et al., 2016
allele F, which differentiate it from the other
alleles. They also estimated the presence of short
insertions of 11 bp (CGTAATGTTTC) between
nucleotides (9972–9982) and 3 bp (AAT) between
nucleotides (10639–10642) inside the 9th intron.
Moreover, they recorded a deletion of 7 bp
(TTATCTA) at the 14th intron (nucleotides 14647-
14648).
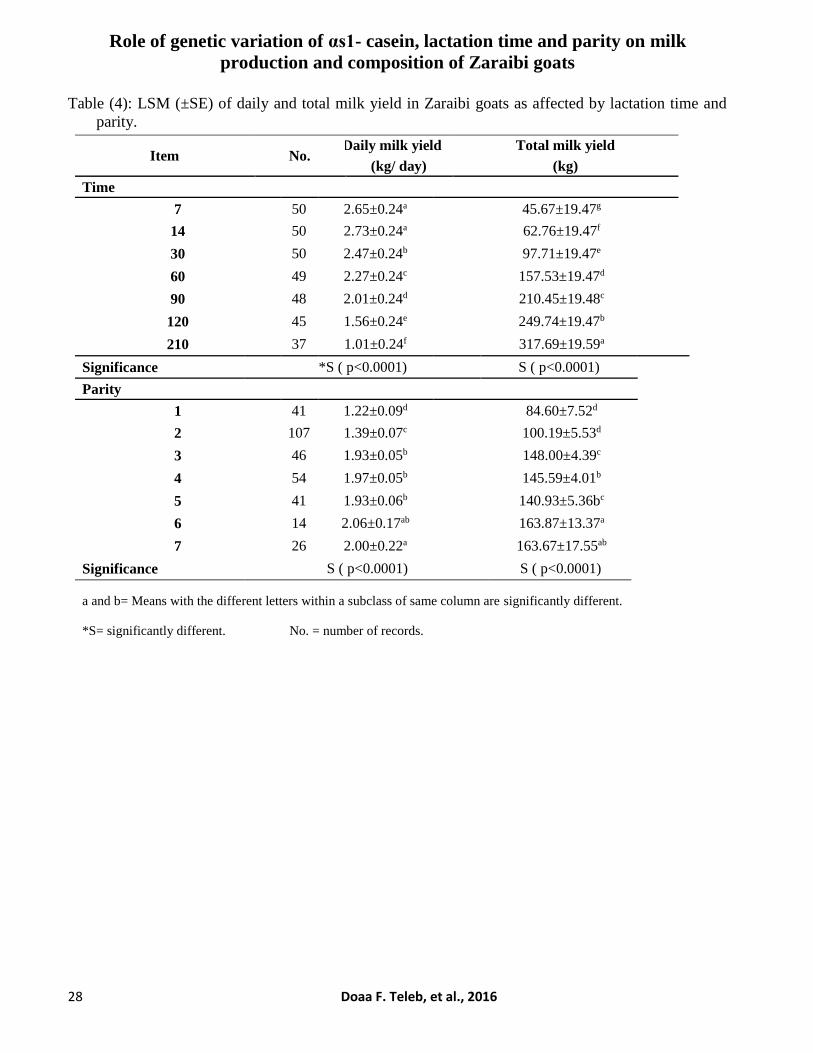
Effect of Lactation Time and Parity on Milk
Yield
Least square mean (LSM) levels of daily
and total milk yields in Zaraibi does during
suckling (days 7, 14, 30, 60 and 90) and lactation
(days 120 and 210) as affected by lactation time
and parity are represented in Table (4).
Results showed that the overall mean value
of total milk yield in Zaraibi goats during 210 days
was 317.69± 19.59 kg. In Zaraibi does, El-Saied
et al. (2007) and Habeeb et al. (2009) reported
lower milk yields than that recorded in the present
study (249 and 191.46 kg, respectively) during
lactation period (210 and 180 days, respectively).
Meanwhile, Abdelhamid et al. (2012) estimated a
total milk yield of 363.15 kg during 240 days.
Daily and total milk yield was significantly
affected by lactation time and parity (p<0.0001).
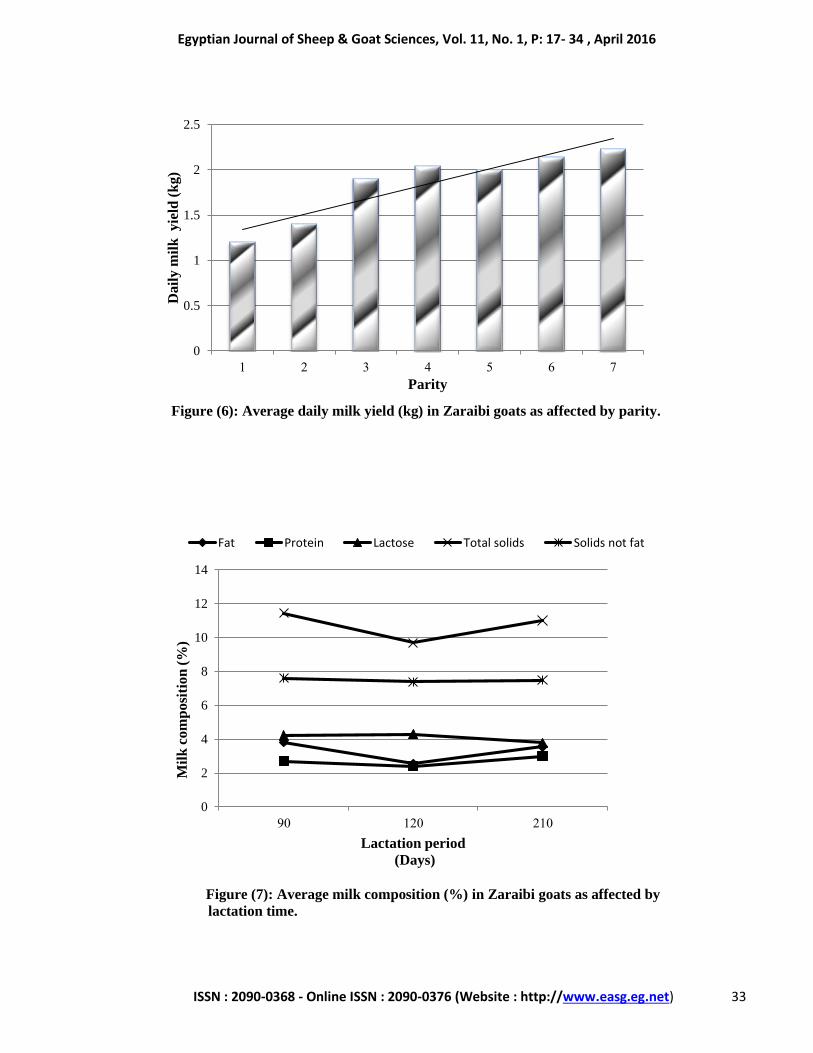
Daily milk yields differ significantly during
suckling and lactation period; being high at the
first week (2.65±0.24 kg) peaked at the 2nd week
(2.73±0.24 kg) then decreased gradually until the
end of lactation (Fig. 5). In general, milk yield
tended to decrease throughout suckling and
lactation periods. Similar result was reported by
Abdelhamid et al. (2012) in Zaraibi goats.
Meanwhile, Hamed (2010) recorded a peak of
milk yield at the 4th week of lactation (1.80±0.02
kg) in Zaraibi goats. In other goat breeds,
Strzałkowska et al. (2010) and Kralickova et al.
(2013) observed that daily milk yield decreased
significantly from the beginning until the end of
lactation in Polish White Improved and Brown
short-haired goat. In contrast, Vacca et al. (2010)
and Mestawet et al. (2012) estimated a peak of
daily milk yield at the mid of lactation, while the
lower values detected in the early and late lactation
stages in Sarda and Ethiopian goats. The
differences between levels of daily and total milk
yield detected in this study and other studies on
Zaraibi goats may be due to individual variations,
climate change, feeding regime and method used
for milking.
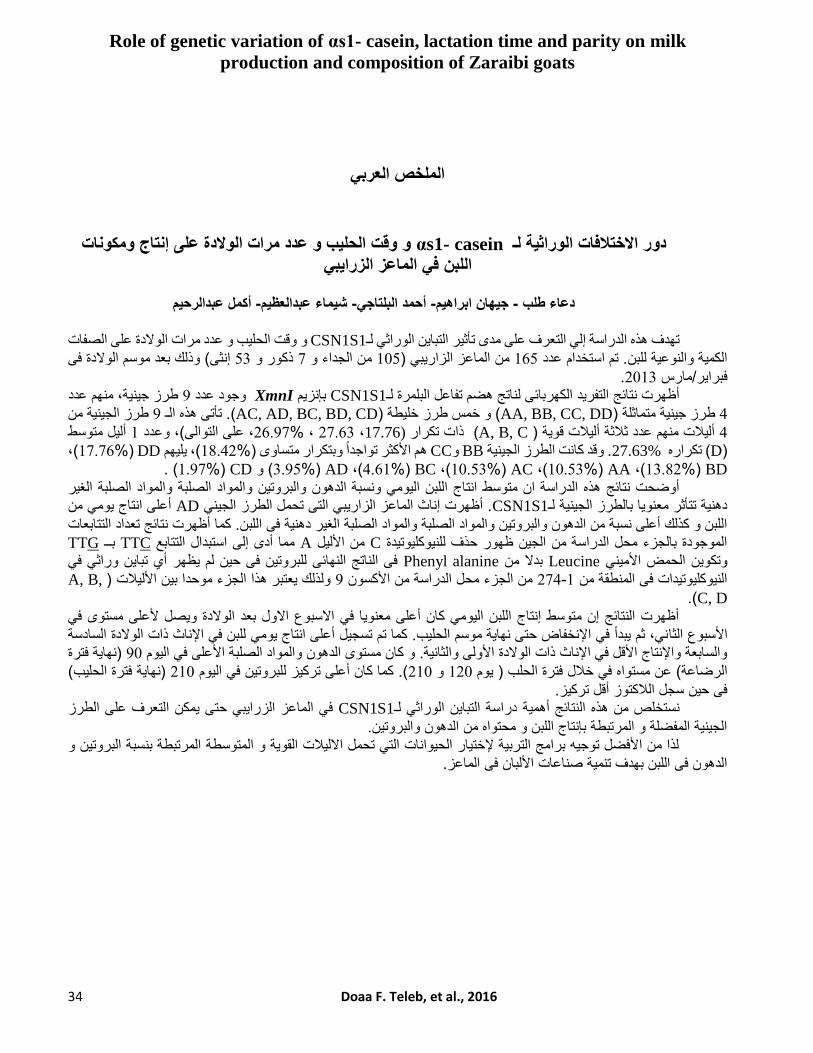
Results in Table (4) and Figure (5) showed
that does with higher parities had significantly
higher daily milk yield, where the highest milk
yields were recorded in does with the 7th and 6th
parities (2.00±0.22 and 2.06±0.17 kg,
respectively). Meanwhile, the lowest values were
observed in does with the 1st and 2nd parities
(1.22±0.09 and 1.39±0.07 kg, respectively). In
general milk yield increased with the increase of
parity number (Fig. 6). In Zaraibi goats, Teleb et
al. (2009) reported that daily milk yield was
significantly affected by parity number, where the
highest milk yield observed in goats at the 3rd and
the 4th parity. Hamed (2010) recorded the lowest
milk yield in Zaraibi does at the 1st parity. Anwar
et al. (2012) found that milk yield increased with
the advancement of parity number, where the
highest values recorded at the 3rd, 4th and 5th
parities in Anglo-Nubian, Angora, Baladi, and
Damascus goat breeds. Kralickova et al. (2013)
reported that brown short-haired goat at the 1st
parity showed the lowest daily milk yield, while
the highest levels were recorded in goats at the 2nd
and 3rd parity. In contrast, Strzałkowska et al.
(2010) estimated the highest daily milk yield in
goats at the 1st parity.
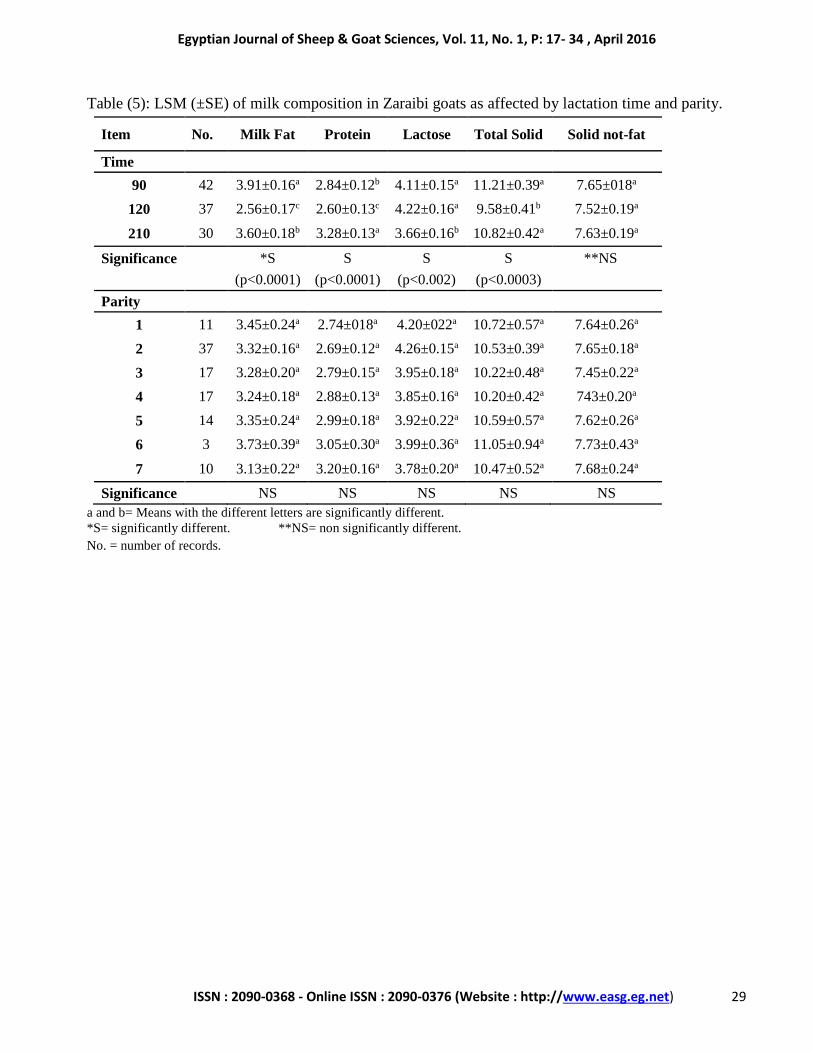
Effect of Lactation Time and Parity on Milk
Composition
Milk compositions estimated in milk
samples of Zaraibi does during lactation period at
days 90, 120 and 210 as affected by lactation time
and parities are shown in table 5 and figure 6.
The overall mean percentage of fat,
protein, lactose, total solid and solid not fat
recorded in the present study were 3.31, 2.68, 4.12,
10.73 and 7.5%, respectively. Teleb et al. (2009)
estimated lower levels of fat, protein, lactose, total
solid and solid not fat percents (2.9%, 2.5%, 3.8%,
9.8% and 6.9%, respectively) in healthy Zaraibi
Egyptian Journal of Sheep & Goat Sciences, Vol. 11, No. 1, P: 17- 34 , April 2016
ISSN : 2090-0368 - Online ISSN : 2090-0376 (Website : http://www.easg.eg.net) 23
goats. Meanwhile, Fernandez et al. (2008)
recorded fat, protein, lactose and total solid
percent to be 3.7, 2.7, 4.5 and 11.9%, respectively
in Mexico goats.
Percentage of fat, protein, lactose and total
solid were significantly (p<0.0001, 0.0001, 0.002
and 0.0003, respectively) affected by lactation
time. Meanwhile, no significant changes in
percentage of solid not fat were recorded. Figure 7
showed that mean values of fat and total solid were
the highest at day 90 of lactation (3.91±0.16 and
11.21±0.39 %, respectively) comparing to days
210 (3.60±0.18 and 10.82±0.42 %, respectively)
and days 120 (2.56±0.17 and 9.58±0.41 %,
respectively). Moreover, milk protein showed the
highest level at the end of lactation (day 210,
3.28±0.13 %), while lactose values were the
lowest (3.66±0.16 %). Similar results were
recorded for fat, total solids and protein percent by
Abdelhamid et al. (2012) in Zaraibi goats, except
for lactose levels where the highest values
recorded at days 90 and 210. Strzałkowska et al.
(2010) reported high fat and protein levels in late
lactation than in early and mid lactation, while
lactose levels decreased during lactation process.
They also reported, a significant higher total solid
in the early and late lactation stage than in the mid
lactation in Polish White Improved goats, which
agree with our result. Moreover, Mestawet et al.
(2012) reported that fat, protein and total solid in
milk were significantly higher in the early and late
lactation than that in mid lactation in different goat
breeds in Ethiopia.
In the present study, does parity had no
significant effect on milk composition (Table 5).
However, does with the 6th parity showed the
highest fat, total solid and solid not fat percent,
while lactose and protein values were the highest
in does with the 2nd and 7th parity. Fernandez et
al. (2008) reported that the highest level of fat and
total solid was at 7th parity, while protein and
lactose showed the highest level at 2nd and 1st
parity, respectively in Mexico goats. Teleb et al.
(2009) reported significant effect of parity number
on milk protein, total solid and solid not fat% in
Zaraibi goats, where the highest levels observed at
the 6th parity. They also reported, significantly
high fat% in does with the 1st parity. Addass et al.
(2013) observed that parity had no significant
effect on protein and total solid levels, but it
significantly affect fat and lactose levels showing
the highest value (5.54 and 5.30%, respectively) at
the 3rd parity in Nigerian goat breed. Meanwhile,
Kralickova et al. (2013) found that the brown
short-haired goats on the 2nd parity had
significantly higher milk total solid and fat than
those on the 1st and 3rd parity, while lactose content
show the highest value in goats with 1st parity
comparing with 2nd and 3rd parity.
CONCLUSION
In the present study, we confirm the effect
of CSN1S1 locus polymorphism, lactation time
and parity on milk yield and composition in
Zaraibi goats. Two strong homozygous genotypes
(BB and AA) with frequency (18.42 and 10.53%,
respectively) and one intermediate genotype (DD,
17.76%) were detected in Zaraibi goats. The
presence of AA and BB genotypes with high
frequency found to be associated with high content
of αS1casein used for cheese industry (Ahmed,
2006), where goats carrying those genotypes
produced milk characterized by a minor diameter
of micelles, significantly higher percent of protein,
fat, total calcium and better parameter for crud
firming time, crud firming and cheese yield
(Martin et al., 1999). Meanwhile, the presence of
DD genotype with high frequency is favorable for
nutritional purpose (as allergic) especially infant
diet, as goat milk with low casein is less allergenic
than cow's milk (Roncada, et al. (2002) and
Ahmed and Othman (2009). In addition, Zaraibi
does with AD variant showed the highest daily
milk yield, fat, protein, total solid and solid not fat
levels, so it is recommended to be increased in
frequency throughout the marker assisted
selection. Identification of genotypes and their
frequencies for goats CSN1S1 are important for
selecting animals carrying the strong and mild
alleles needed for improving milk quantity and
quality for economic goat milk industry.
ROLE OF GENETIC VARIATION OF αS1-CASEIN, LACTATION TIME AND PARITY ON MILK PRODUCTION AND COMPOSITION OF ZARAIBI GOATS
24 Doaa F. Teleb, et al., 2016
ACKNOWLAGEMENT
Sincere thanks to Dr. Hanaa Abdelharith,
Cattle Breeding Research Department, Animal
Production Research Institute for her help in the
statistical analysis.
REFERENCES Abdelhamid, A.M., T.A.M. Ashmawy, Faten F
Abou Ammou and Heba A. El-Sanafawy,
2012. Effect of dietary inclusion of whole
sunflower seeds on feeding lactating Zaraibi
goats: Milk production and composition as
well as mammary gland histology and
economic efficiency. Inter. J. Biotech. Res., 1,
6-19.
Addass, P. A., M. A. Tizhe, A. Midau, P. A. Alheri
and M. M. Yahya, 2013. Effect of genotype,
stage of lactation, season and parity on milk
composition of goat, in Mubi, Adamawa
State, Nigeria. Ann. Bio. Res. 4, 248-252.
Ahmed, Sahar, 2006. Identification of Egyptian
goat αs-casien alleles using PCR-RFLP
method. Int. J. Dairy Sci.1, 27-31.
Ahmed, Sahar and E.O. Othman, 2009.
Genotyping Analysis of Milk Protein Genes
in Different Goat Breeds Reared in Egypt. J.
Genetic Eng. Biotech. 7, 33-39.
Anwar, M. M., T. A. Ramadan and T. A. Taha,
2012. Serum metabolites, milk yield and
physiological responses during the first week
after conditions kidding in Anglo-Nubian,
Angora, Baladi, and Damascus goats under
subtropical conditions. J. Anim. Sci. 90, 4795-
4806.
Balia, F., M. Pazzola, M. L. Dettori, M.C. Mura,
S. Luridiana, V. Carcangiu, P. Gianpiera and
M.V. Giuseppe, 2013. Effect of CSN1S1 gene
polymorphism and stage of lactation on milk
yield and composition of extensively reared
goats. J. Dairy Res. 80, 129-137.
Banda, J.W., J, Steinbach and H.P. Zerfas, 2006.
Composition and yield of milk from non-dairy
goats and sheep in Malawi.
(http://www.fao.org).
Caroli, A., F. Chiatti, S. Chessa, D. Rignanese, P.
Bolla and G. Pagnacco, 2006. Focusing on the
goat casein complex. J. Dairy Sci. 89, 3178-
3187.
Clark, S. and J.W. Sherbon, 2000. Genetic variants
of alpha s1-CN in goat milk: breed
distribution and associations with milk
composition and coagulation properties.
Small Rumin. Res. 38, 135–143.
Cosenza, G., R. Illario, A. Rando, P. Di Gregorio,
P. Masina and L. Ramunno, 2003. Molecular
characterization of the goat CSN1S101 allele,
J. Dairy Res. 70, 237–240.
El-Saied, U.M., A.A. Raheem and I. Shaat, 2007.
Precision of simplified milk recording for
Zaraibi goats. Egyptian J. Anim. Prod., 44,
173-184.
Feligini, M., S. Frati, A. Cubric, V. Curik, A.
Brambilla, P. Parma, I. Curik, G.F. Greppi and
G. Enne, 2005. Caprine αs1casein
polymorphism: characterisation of A, B, E
and F variants by means of various
biochemical and molecular techniques. Food
Technol. Biotech. 432, 123–132.
Fernandez, M., H. Castillo- Juarez, J.R. Gonzalez,
F.J. Fernandez, H Castaneda Vazquez and
J.A. Saltijeral-Oaxaca, 2008. Somatic cell
counts and quality of goat milk produced in
the central region of Mexico. J. Daiy Sci. 2,
45-50.
Galal, S., Ferial Abdel Rasoul, M.R. Anous and I.
Shaat, 2005. Small Ruminant Breeds of
Egypt. In "Characterization of Small
Ruminant Breeds in West Asia and North
Africa, North Africa.", Ed. Luis Iňiguez,
International Center for Agricultural Research
in the Dry Areas (ICARDA), Aleppo, Syria,
pp 141-193.
Habeeb, A.A.M., E.S. El-Gohary and S.A. El-
Saadany, 2009. Improving milk yield and
some physiology body functions of lactating
Zaraibi goats under heat stress conditions of
hot summer season using supplemental diet
with ginger or curcumin. Zag. Vet. 37, 54-67.
Egyptian Journal of Sheep & Goat Sciences, Vol. 11, No. 1, P: 17- 34 , April 2016
ISSN : 2090-0368 - Online ISSN : 2090-0376 (Website : http://www.easg.eg.net) 25
Hamed, A., 2010. Genetics studies on Zaraibi
goats. Ph. D. thesis, Fac of Agric. Al-Azhar
Univ. Egypt.193
Kralickova, S., J. Kuchtik, R. Filipcik, T. Luzova
and K. Sustova, 2013. Effect of chosen factors
on milk yield, basic composition and somatic
cell count of organic milk. Acta Universitatis
Agriculturae et Silviculturae Mendelianae
Brunensis 1, 99–105.
Lynch, J.M., D.M. Barbano, M. Schweisthal and
J.R. Fleming, 2006. Precalibration evaluation
procedures for Mid-Infrared milk analyzers. J.
Dairy Sci. 89, 2761–2774.
Marai, I.F.M., E.I. Abou-Fandoud, A.H. Daader
and A.A. Abu-Ela, 2001. Association between
marker gene alleles and doe traits in Nubian
(Zaraibi) goats in Egypt. Annals of Arid Zone
40, 193-197.
Martin, P., M. Ollivier-Bousquet and F.
Grosclaude, 1999. Genetic Polymorphism of
Casein: A tool to investigate Casein micelle
organized intl. Dairy J. 9, 164-171.
Martin, P., M. Szymanowska, L. Zwierzchowski
and C. Leroux, 2002. The impact of genetic
polymorphisms on protein composition of
ruminant milks. Reprod. Nutr. Dev. 42, 433–
459.
Mestawet, T. A., A. Girma, T. Adnoy, T. G.
Devold, J. A. Narvhus and G. E. Vegarud,
2012: Milk production, composition and
variation at different lactation stages of four
goat breeds in Etiopia. Small Rumin. Res.
105, 176–181.
Miller, S.A., D.D. Dykes and H.F. Polesky, 1988.
A simple salting out procedure for extracting
DNA from human nucleated cells. Nucleic
Acids Res. 16, 12-15.
Mowlem, A., 2005. Marketing goat dairy produce
in the UK. Small Rumin. Res. 60, 207–213.
NRC, 2007. Nutrient Requirements of Small
Ruminants (Goats), Cervids, and New World
Camelids. Washington, DC.
Othman E. O. ,Samia A. El-Fikya, Nagwa A.
Hassanb, Eman R. Mahfouza, Esraa A.
Balabela, 2013. Genetic polymorphism
detection of two α-Casein genes in three
Egyptian sheep breeds. J. Genetic Eng. and
Biotech. 11, 129-134.
Pazzola, M., M.L. Dettori, E. Pira, A. Noce, P.
Paschino and G.M. Vacca, 2014. Effect of
polymorphisms at the casein gene cluster on
milk renneting properties of the Sarda goat.
Small Rumin. Res. 117, 124–130.
Ramunno, L., G. Cosenza, A. Rando, A. Pauciullo,
R. Illario, D. Gallo, D. Di Berardino and
Masina, P. , 2005. Comparative analysis of
gene sequence of goat CSN1S1 F and N
alleles and characterization of CSN1S1
transcript variants in mammary gland.
Genetics 345, 289–299.
Ramunno, L., G. Cosenza, M. Pappalardo, E.
Longobardi, D. Gallo, N. Pastore, P. Digorio
and A. Rando, 2001b. Characterization of two
new alleles at the goat CSN1S2 locus. Anim.
Genetics 32, 264–268.
Ramunno, L., G. Cosenza, M. Pappalardo, N.
Pastore, D. Gallo, P. Di Gregorio and P.
Masina, 2000. Identification of the goat
CSN1S1F allele by means of PCR-RFLP
method. Animal Genetics 31, 342-343.
Rando, A., L. Ramunno and P. Masina, 2000.
Mutations in casein genes. Zoot. Nutr. Anim.
26, 105-114.
Roncada, P., A. Gaviraghi, S. Liberatori, B. Canas,
L. Bini, G.F. Greppi, 2002. Identification of
caseins in goat milk. Proteomics 2, 723-726.
Rout, P.K., A. Kumar, A. Mandal, D. Laloe, S.K.
Singh and R. Roy, 2010. Characterization of
Casein Gene Complex and Genetic Diversity
Analysis in Indian Goats. Anim. Biotech. 21,
122–134.
Sanger, F., S. Nicklen and A.R. Coulson, 1977.
DNA sequencing with chain terminating
inhibitors. Proc. Natl. Acad. Sci. U. S. A. 74,
5463–5467.
SAS., 2000. SAS/STAT® 9.2 User’s Guide, 2nd
ed. SAS Institute Inc, Cary, NC, USA.
ROLE OF GENETIC VARIATION OF αS1-CASEIN, LACTATION TIME AND PARITY ON MILK PRODUCTION AND COMPOSITION OF ZARAIBI GOATS
26 Doaa F. Teleb, et al., 2016
Smith, E. B., D. M. Barbano, J. M. Lynch and J.
R. Fleming, 1993a. Performance of
homogenizers in infrared milk analyzers: A
survey. J. Dairy Sci. 76, 1033–1041.
Strzalkowska, N., A. Jozwik, E. Bagnicka, J.
Krzyzewski, K. Horbanczuk, B. Pyzel, , D.
Sloniewska and J. O. Horbanczuk, 2010. The
concentration of free fatty acids in goat milk
as related to the stage of lactation, age and
somatic cell count. Ani. Sci. Papers and
Reports 28, 389–395.
Sztankoova, Z., V. Matlova, J. Kyselova, O.M.
Jandurova, J. Riha and C. Senese, 2006. A
new allele specific polymerase chain reaction
method (AS-PCR) for detection of the goat
CSN1S101 allele. Small Rumin. Res. 66,
282–285.
Teleb, Doaa F., U. M. El-Saied, A. A. Sallam,
Azza M. El-Baz and A.M. Hussein, 2009.
Effect of Using Echinacea Extract as
Immuno-stimulating Additive on milk yield
Traits, Immunity and Udder Health of Zaraibi
goats, Egyptian J. Sheep & Goat Sci., 4, 33-
53
Vacca G. M., M. L. Dettori, V. Carcangiu, A.M.
Rocchigiani and M. Pazzola, 2010.
Relationships between milk characteristics
and somatic cell score in milk from
primiparous browsing goats. Ani. Sci. J. 81,
594–599.
Vacca, G.M., H. Ouled Ahmed Ben Ali, V.
Carcangiu, M. Pazzola and M.L. Dettori,
2009. Genetic structure of the casein gene
cluster in the Tunisian native goat breed.
Small Rumin. Res. 87, 33–38.
Zullo, A., C.M.A. Barone, L. Chianese, P.
Colatruglio, M. Occidente and D. Matassino,
2005. Protein polymorphisms and coagulation
properties of Cilentana goat milk. Small
Rumin. Res. 58, 223–230.
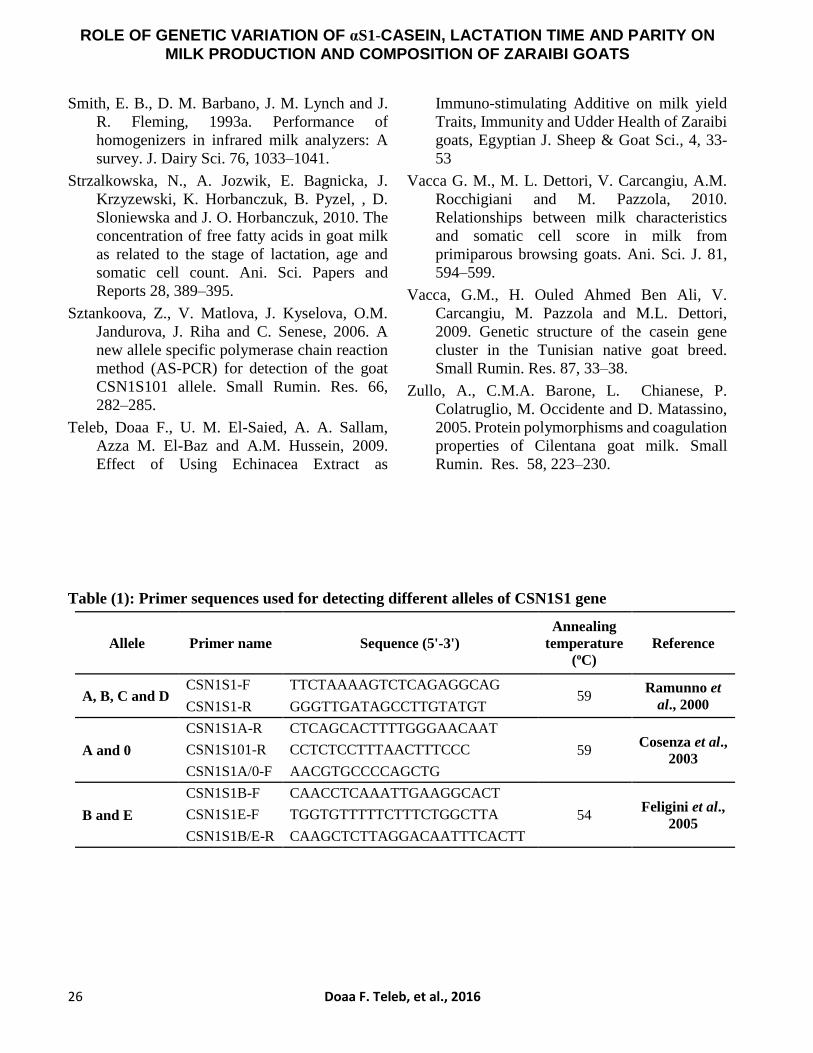
Table (1): Primer sequences used for detecting different alleles of CSN1S1 gene
Allele Primer name Sequence (5'-3')
Annealing
temperature
(oC)
Reference
A, B, C and D CSN1S1-F TTCTAAAAGTCTCAGAGGCAG
59 Ramunno et
al., 2000 CSN1S1-R GGGTTGATAGCCTTGTATGT
A and 0
CSN1S1A-R CTCAGCACTTTTGGGAACAAT
59 Cosenza et al.,
2003 CSN1S101-R CCTCTCCTTTAACTTTCCC
CSN1S1A/0-F AACGTGCCCCAGCTG
B and E
CSN1S1B-F CAACCTCAAATTGAAGGCACT
54 Feligini et al.,
2005 CSN1S1E-F TGGTGTTTTTCTTTCTGGCTTA
CSN1S1B/E-R CAAGCTCTTAGGACAATTTCACTT
Egyptian Journal of Sheep & Goat Sciences, Vol. 11, No. 1, P: 17- 34 , April 2016
ISSN : 2090-0368 - Online ISSN : 2090-0376 (Website : http://www.easg.eg.net) 27
Table (2): Allele and genotype frequencies for CSN1S1 gene in Zaraibi goat.
Alleles Genotypes
Type Frequencies
(%) Type
No. of
Animals
Frequencies
(%)
A 17.76 AA 16 10.53
B 27.63 BB 28 18.42
C 26.97 CC 28 18.42
D 27.63 DD 27 17.76
AC 16 10.53
AD 6 3.95
BC 7 4.61
BD 21 13.82
CD 3 1.97
Total 152 100
Table (3): LSM (±SE) of daily milk yield and composition in Zaraibi goats as affected by CSN1S1
genotypes.
Genotype No Daily milk
yield
Milk Composition (%)
Fat Protein Lactose Total solid Solid not-
fat
AA 14 1.30±0.10b 2.95±0.22b 2.55±0.17b 3.92±0.20a 9.65±0.52b 7.16±0.24b
BB 23 1.29±0.08bc 3.27±0.17ab 2.67±0.13b 4.17±0.16a 10.40±0.42ab 7.54±0.19b
CC 25 1.33±0.07b 3.35±0.15ab 2.70±0.11b 3.97±0.14a 10.12±0.36b 7.37±0.16b
DD 15 1.07±0.09b 3.28±0.21ab 2.98±0.16b 3.96±0.19a 10.63±0.50b 7.64±0.23b
AC 12 1.25±0.11c 3.27±0.24ab 2.82±0.18b 3.96±0.21a 10.36±0.56ab 7.48±0.26b
AD 2 2.00±0.18a 3.96±0.47a 3.84±0.35a 4.16±0.42a 12.30±1.11a 8.71±0.51a
BD 18 1.41±0.08b 3.43±0.19ab 2.80±0.14b 3.81±0.17a 10.33±0.45b 7.31±0.21b
Significance *S ( p<0.05) S ( p<0.05) S ( p<0.05) **NS S ( p<0.05) S ( p<0.05)
a and b= Means with the different letters are significantly different.
*S= significantly different **NS=non significantly different No. = number of records
Role of genetic variation of αs1- casein, lactation time and parity on milk
production and composition of Zaraibi goats
28 Doaa F. Teleb, et al., 2016
Table (4): LSM (±SE) of daily and total milk yield in Zaraibi goats as affected by lactation time and
parity.
Item No. Daily milk yield Total milk yield
(kg/ day) (kg)
Time
7 50 2.65±0.24a 45.67±19.47g
14 50 2.73±0.24a 62.76±19.47f
30 50 2.47±0.24b 97.71±19.47e
60 49 2.27±0.24c 157.53±19.47d
90 48 2.01±0.24d 210.45±19.48c
120 45 1.56±0.24e 249.74±19.47b
210 37 1.01±0.24f 317.69±19.59a
Significance *S ( p<0.0001) S ( p<0.0001)
Parity
1 41 1.22±0.09d 84.60±7.52d
2 107 1.39±0.07c 100.19±5.53d
3 46 1.93±0.05b 148.00±4.39c
4 54 1.97±0.05b 145.59±4.01b
5 41 1.93±0.06b 140.93±5.36bc
6 14 2.06±0.17ab 163.87±13.37a
7 26 2.00±0.22a 163.67±17.55ab
Significance S ( p<0.0001) S ( p<0.0001)
a and b= Means with the different letters within a subclass of same column are significantly different.
*S= significantly different. No. = number of records.
Egyptian Journal of Sheep & Goat Sciences, Vol. 11, No. 1, P: 17- 34 , April 2016
ISSN : 2090-0368 - Online ISSN : 2090-0376 (Website : http://www.easg.eg.net) 29
Table (5): LSM (±SE) of milk composition in Zaraibi goats as affected by lactation time and parity.
Item No. Milk Fat Protein Lactose Total Solid Solid not-fat
Time
90 42 3.91±0.16a 2.84±0.12b 4.11±0.15a 11.21±0.39a 7.65±018a
120 37 2.56±0.17c 2.60±0.13c 4.22±0.16a 9.58±0.41b 7.52±0.19a
210 30 3.60±0.18b 3.28±0.13a 3.66±0.16b 10.82±0.42a 7.63±0.19a
Significance *S S S S **NS
(p<0.0001) (p<0.0001) (p<0.002) (p<0.0003)
Parity
1 11 3.45±0.24a 2.74±018a 4.20±022a 10.72±0.57a 7.64±0.26a
2 37 3.32±0.16a 2.69±0.12a 4.26±0.15a 10.53±0.39a 7.65±0.18a
3 17 3.28±0.20a 2.79±0.15a 3.95±0.18a 10.22±0.48a 7.45±0.22a
4 17 3.24±0.18a 2.88±0.13a 3.85±0.16a 10.20±0.42a 743±0.20a
5 14 3.35±0.24a 2.99±0.18a 3.92±0.22a 10.59±0.57a 7.62±0.26a
6 3 3.73±0.39a 3.05±0.30a 3.99±0.36a 11.05±0.94a 7.73±0.43a
7 10 3.13±0.22a 3.20±0.16a 3.78±0.20a 10.47±0.52a 7.68±0.24a
Significance NS NS NS NS NS
a and b= Means with the different letters are significantly different.
*S= significantly different. **NS= non significantly different.
No. = number of records.
Role of genetic variation of αs1- casein, lactation time and parity on milk
production and composition of Zaraibi goats
30 Doaa F. Teleb, et al., 2016
Figure (1): The electrophoretic pattern of PCR products of CSN1S1. M: 50 bp ladder. Lanes 1–4:
223 bp PCR product of CSN1S1.
Figure (2.a): The electrophoretic pattern
obtained after digestion of PCR amplified goat
CSN1S1 products with XmnI. M: 50 bp ladder
marker. Lanes 1, 2, 3 and 4: genotype (AA, BB,
CC and DD, respectively).
Figure (2.b): The electrophoretic pattern
obtained after digestion of PCR amplified goat
CSN1S1 products with XmnI. M: 50 bp ladder
marker. Lanes 1, 2, 3, 4 and 5: heterozygous
genotype (AC, AD, BC, BD and CD, respectively).
Egyptian Journal of Sheep & Goat Sciences, Vol. 11, No. 1, P: 17- 34 , April 2016
ISSN : 2090-0368 - Online ISSN : 2090-0376 (Website : http://www.easg.eg.net) 31
Figure (3.a): The elecrophoretic pattern obtained after AS-PCR for CSN1S1 gene using
CSN1S1A/0-F primer. M: 50 bp ladder marker.
Lane 1, 2, 3 and 4: 700 bp characterized for A allele.
Figure (3.b): The elecrophoretic pattern obtained after AS-PCR for CSN1S1 gene using
CSN1S1B/E-F primer M: 50 bp ladder marker.
Lane 1, 2, 3 and 4: 90 bp characterized for B allele.
Role of genetic variation of αs1- casein, lactation time and parity on milk
production and composition of Zaraibi goats
32 Doaa F. Teleb, et al., 2016
Figure (4): Alignment between sequences of the four detected alleles of the CSN1S1 gene in Zaraibi goats
and their corresponding region from GenBank.
Days
Figure (5): Average daily milk yield (kg) in Zaraibi goats during lactation
period.
0
0.5
1
1.5
2
2.5
3
7 14 30 60 90 120 210
Da
ily
mil
k y
ield
(k
g)
------- Suckling period --------------------------- lactation periodــــــــــ
Trend ● Milk Yield
Egyptian Journal of Sheep & Goat Sciences, Vol. 11, No. 1, P: 17- 34 , April 2016
ISSN : 2090-0368 - Online ISSN : 2090-0376 (Website : http://www.easg.eg.net) 33
Figure (7): Average milk composition (%) in Zaraibi goats as affected by
lactation time.
Figure (6): Average daily milk yield (kg) in Zaraibi goats as affected by parity.
0
2
4
6
8
10
12
14
90 120 210
Mil
k c
om
posi
tion
(%
)
Lactation period
(Days)
Fat Protein Lactose Total solids Solids not fat
0
0.5
1
1.5
2
2.5
1 2 3 4 5 6 7
Da
ily
mil
k y
ield
(k
g)
Parity
Role of genetic variation of αs1- casein, lactation time and parity on milk
production and composition of Zaraibi goats
34 Doaa F. Teleb, et al., 2016
الملخص العربي
و وقت الحليب و عدد مرات الولادة على إنتاج ومكونات casein s1-αالوراثية لـ الاختلافات دور اللبن في الماعز الزرايبي
أكمل عبدالرحيم -شيماء عبدالعظيم -أحمد البلتاجي -جيهان ابراهيم - دعاء طلب
على الصفات عدد مرات الولادة قت الحليب وو وCSN1S1 لـ وراثيتأثير التباين المدى التعرف على تهدف هذه الدراسة إلي
فى ( وذلك بعد موسم الولادة إنثى 53ذكور و 7و من الجداء 105زاريبي )الماعز من ال 165عدد استخدام. تم بنالكمية والنوعية لل . 2013فبراير/مارس
عدد منهم ،طرز جينية 9وجود عدد XmnIبإنزيم CSN1S1أظهرت نتائج التفريد الكهربائى لناتج هضم تفاعل البلمرة لـطرز الجينية من 9الـ هذه تأتى .(AC, AD, BC, BD, CD) خليطةخمس طرز ( وAA, BB, CC, DDمتماثلة ) جينية طرز 4 متوسطأليل 1عدد و، على التوالى(، 26.97%، 27.63، (17.76ذات تكرار ( A, B, C)ثلاثة أليلات قوية عدد أليلات منهم 4(D )وقد كانت الطرز الجينية %27.63 ه تكرار .BB وCC %( يليهم 18.42هم الأكثر تواجداً وبتكرار متساوى ،)DD %(17.76 ،)
BD %(13.82 ،)AA %(10.53 ،)AC %(10.53 ،)BC %(4.61 ،)AD %(3.95 و )CD %(1.97 . ) الدهون والبروتين والمواد الصلبة والمواد الصلبة الغير بةأوضحت نتائج هذه الدراسة ان متوسط انتاج اللبن اليومي ونس
أعلى انتاج يومي من AD. أظهرت إناث الماعز الزاريبي التى تحمل الطرز الجيني CSN1S1دهنية تتأثر معنويا بالطرز الجينية لـ
التتابعات أظهرت نتائج تعداد كما فى اللبن. اللبن و كذلك أعلى نسبة من الدهون والبروتين والمواد الصلبة والمواد الصلبة الغير دهنية GTTبــ CTTمما أدى إلى استبدال التتابع Aمن الأليل Cالموجودة بالجزء محل الدراسة من الجين ظهور حذف للنيوكليوتيدة
اين وراثي في فى الناتج النهائى للبروتين فى حين لم يظهر أي تب Phenyl alanineبدلا من Leucineوتكوين الحمض الأميني ,A, Bولذلك يعتبر هذا الجزء موحدا بين الأليلات ) 9من الجزء محل الدراسة من الأكسون 274-1النيوكليوتيدات فى المنطقة من
C, D.) أظهرت النتائج إن متوسط إنتاج اللبن اليومي كان أعلى معنويا في الاسبوع الاول بعد الولادة ويصل لأعلى مستوى في
ني، ثم يبدأ في الإنخفاض حتى نهاية موسم الحليب. كما تم تسجيل أعلى انتاج يومي للبن في الإناث ذات الولادة السادسة الأسبوع الثا)نهاية فترة 90والسابعة والإنتاج الأقل في الإناث ذات الولادة الأولى والثانية. و كان مستوى الدهون والمواد الصلبة الأعلى في اليوم
)نهاية فترة الحليب( 210(. كما كان أعلى تركيز للبروتين في اليوم 210و 120يوم ه في خلال فترة الحلب )الرضاعة( عن مستوا فى حين سجل اللاكتوز أقل تركيز.
لتعرف على الطرز حتى يمكن افي الماعز الزرايبي CSN1S1دراسة التباين الوراثي لـ أهميةنستخلص من هذه النتائج
الجينية المفضلة و المرتبطة بإنتاج اللبن و محتواه من الدهون والبروتين. لذا من الأفضل توجيه برامج التربية لإختيار الحيوانات التي تحمل الاليلات القوية و المتوسطة المرتبطة بنسبة البروتين و
الدهون فى اللبن بهدف تنمية صناعات الألبان فى الماعز.
![Adsorption of Milk Proteins (-Casein and -Lactoglobulin ... · protein with a random coil conformation in solution, but recent studies have challenged this view [16]. On the contrary,](https://static.fdocument.org/doc/165x107/5fa3935da2da091e9e210d6e/adsorption-of-milk-proteins-casein-and-lactoglobulin-protein-with-a-random.jpg)