![Excess Thermodynamic and Volumetric Properties of Binary ... · making hydrogen bonded network like water [1]. Aprotic ILs consist of imidazolium and pyrrolidium based cations and](https://static.fdocument.org/doc/165x107/60016a49e76f81379d54bbe7/excess-thermodynamic-and-volumetric-properties-of-binary-making-hydrogen-bonded.jpg)
Risk Management Lessons from Madoff Fraudthierry-roncalli.com/download/madoff-slides.pdf · ·...
25
Transcript of Risk Management Lessons from Madoff Fraudthierry-roncalli.com/download/madoff-slides.pdf · ·...
Risk Management Lessons from Madoff Fraud
Risk Management Lessons from Madoff Fraud
P. Clauss1 T. Roncalli2 G. Weisang3
1ENSAI and CREST, France
2Évry University, France
3Department of Mathematical Sciences,Bentley University, MA
AMF, November 12, 2009
Risk Management Lessons from Madoff Fraud
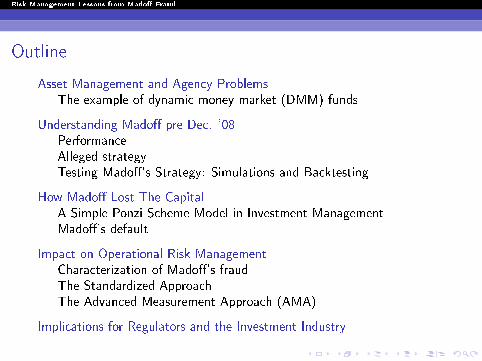
Outline
Asset Management and Agency ProblemsThe example of dynamic money market (DMM) funds
Understanding Madoff pre Dec. '08PerformanceAlleged strategyTesting Madoff's Strategy: Simulations and Backtesting
How Madoff Lost The CapitalA Simple Ponzi Scheme Model in Investment ManagementMadoff's default
Impact on Operational Risk ManagementCharacterization of Madoff's fraudThe Standardized ApproachThe Advanced Measurement Approach (AMA)
Implications for Regulators and the Investment Industry
Risk Management Lessons from Madoff Fraud
Asset Management and Agency Problems
1. Market risks are taken by investors, not by the fund manager.
2. The fund manager is the only decision maker.
I How may investors have control over the fund manager ?
I How can the information asymmetry between the fund manager andinvestors be reduced?
I Agency Problems
Risk Management Lessons from Madoff Fraud
Asset Management and Agency Problems
The example of dynamic money market (DMM) funds
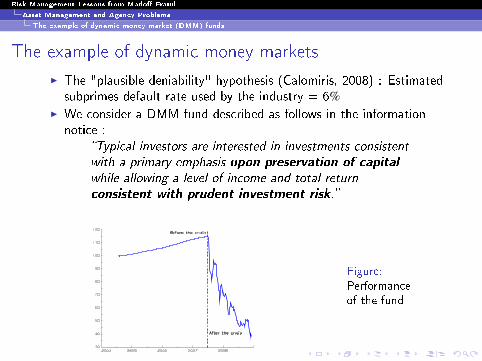
The example of dynamic money markets
I The "plausible deniability" hypothesis (Calomiris, 2008) : Estimatedsubprimes default rate used by the industry = 6%
I We consider a DMM fund described as follows in the informationnotice :
�Typical investors are interested in investments consistent
with a primary emphasis upon preservation of capital
while allowing a level of income and total return
consistent with prudent investment risk.�
Figure:Performanceof the fund
Risk Management Lessons from Madoff Fraud
Understanding Madoff pre Dec. '08
Performance
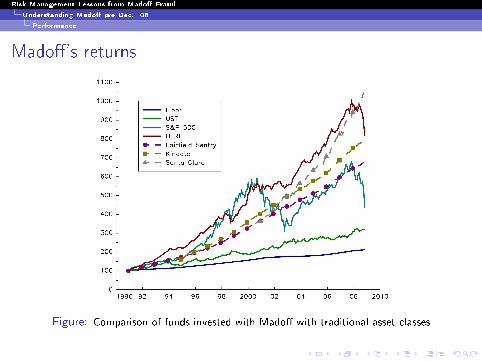
Madoff's returns
Figure: Comparison of funds invested with Madoff with traditional asset classes
Risk Management Lessons from Madoff Fraud
Understanding Madoff pre Dec. '08
Performance
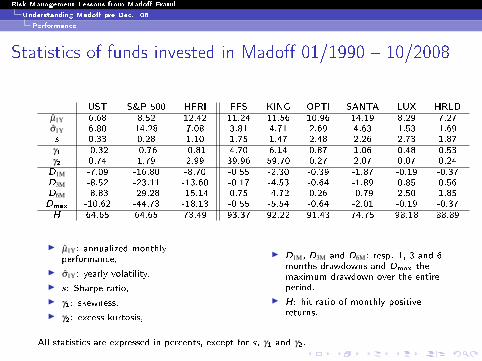
Statistics of funds invested in Madoff 01/1990 � 10/2008
UST S&P 500 HFRI FFS KING OPTI SANTA LUX HRLDµ̂1Y 6.68 8.52 12.42 11.24 11.56 10.96 14.19 8.29 7.27σ̂1Y 6.80 14.28 7.08 3.81 4.71 2.69 4.63 1.53 1.69s 0.33 0.28 1.10 1.75 1.47 2.48 2.26 2.73 1.87γ1 -0.32 -0.76 -0.81 4.70 6.14 0.87 1.06 0.48 0.53γ2 0.74 1.79 2.99 39.96 59.70 0.27 2.07 0.07 0.24D1M -7.09 -16.80 -8.70 -0.55 -2.30 -0.39 -1.87 -0.19 -0.37D3M -8.52 -23.11 -13.60 -0.17 -4.53 -0.64 -1.89 0.85 0.56D6M -8.83 -29.28 -15.14 0.75 -4.72 0.26 -0.79 2.50 1.85Dmax -10.62 -44.73 -18.13 -0.55 -5.54 -0.64 -2.01 -0.19 -0.37H 64.65 64.65 73.49 93.37 92.22 91.43 74.75 98.18 88.89
I µ̂1Y: annualized monthlyperformance,
I σ̂1Y: yearly volatility,I s: Sharpe ratio,I γ1: skewness,I γ2: excess kurtosis,
I D1M, D3M and D6M: resp. 1, 3 and 6months drawdowns and Dmax themaximum drawdown over the entireperiod.
I H: hit ratio of monthly positivereturns.
All statistics are expressed in percents, except for s, γ1 and γ2.
Risk Management Lessons from Madoff Fraud
Understanding Madoff pre Dec. '08
Alleged strategy
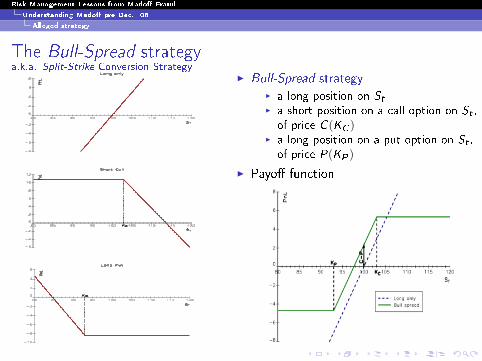
The Bull-Spread strategya.k.a. Split-Strike Conversion Strategy
I Bull-Spread strategyI a long position on StI a short position on a call option on St ,of price C (KC )
I a long position on a put option on St ,of price P(KP )
I Payo� function
Risk Management Lessons from Madoff Fraud
Understanding Madoff pre Dec. '08
Alleged strategy
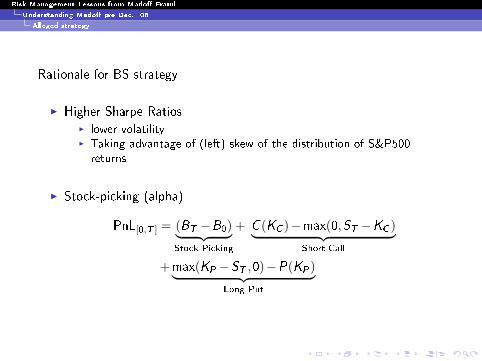
Rationale for BS strategy
I Higher Sharpe RatiosI lower volatilityI Taking advantage of (left) skew of the distribution of S&P500returns
I Stock-picking (alpha)
PnL[0,T ] = (BT −B0)︸ ︷︷ ︸Stock Picking
+ C (KC )−max(0,ST −KC )︸ ︷︷ ︸Short Call
+max(KP −ST ,0)−P(KP)︸ ︷︷ ︸Long Put
Risk Management Lessons from Madoff Fraud
Understanding Madoff pre Dec. '08
Testing Madoff's Strategy: Simulations and Backtesting
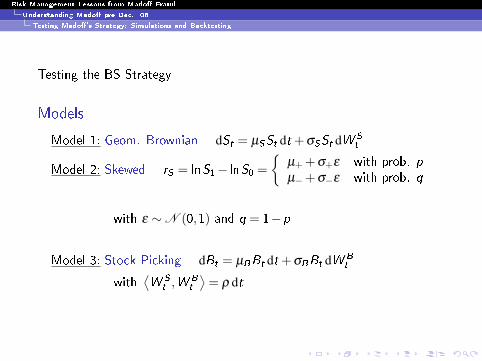
Testing the BS Strategy
Models
Model 1: Geom. Brownian dSt = µSSt dt +σSSt dW S
t
Model 2: Skewed rS = lnS1− lnS0 ={
µ+ +σ+ε with prob. pµ−+σ−ε with prob. q
with ε ∼N (0,1) and q = 1−p
Model 3: Stock Picking dBt = µBBt dt +σBBt dW B
t
with⟨W S
t ,W B
t
⟩= ρ dt
Risk Management Lessons from Madoff Fraud
Understanding Madoff pre Dec. '08
Testing Madoff's Strategy: Simulations and Backtesting
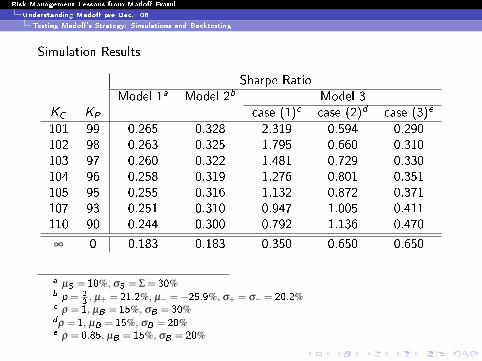
Simulation Results
Sharpe RatioModel 1a Model 2b Model 3
KC KP case (1)c case (2)d case (3)e
101 99 0.265 0.328 2.319 0.594 0.290102 98 0.263 0.325 1.795 0.660 0.310103 97 0.260 0.322 1.481 0.729 0.330104 96 0.258 0.319 1.276 0.801 0.351105 95 0.255 0.316 1.132 0.872 0.371107 93 0.251 0.310 0.947 1.005 0.411110 90 0.244 0.300 0.792 1.136 0.470
∞ 0 0.183 0.183 0.350 0.650 0.650
a µS = 10%, σS = Σ = 30%b p = 2
3, µ+ = 21.2%, µ− =−25.9%, σ+ = σ− = 20.2%
c ρ = 1, µB = 15%, σB = 30%dρ = 1, µB = 15%, σB = 20%e ρ = 0.85, µB = 15%, σB = 20%
Risk Management Lessons from Madoff Fraud
Understanding Madoff pre Dec. '08
Testing Madoff's Strategy: Simulations and Backtesting
Main Results
1. The BS Strategy has a higher Sharpe ratio than the long-onlystrategy (×2 in the most favorable cases).
2. To obtain a Sharpe ratio larger than one, we need a very good stockpicking process :
I systematic outperformance with respect to the index ;I perfect correlation with the index.
Risk Management Lessons from Madoff Fraud
Understanding Madoff pre Dec. '08
Testing Madoff's Strategy: Simulations and Backtesting
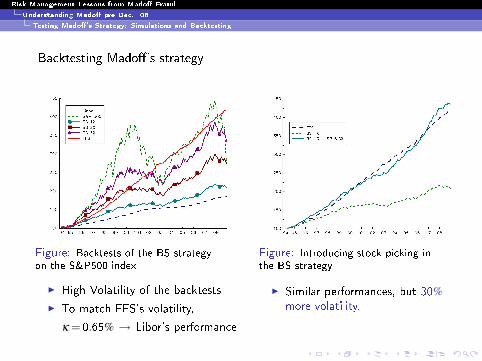
Backtesting Madoff's strategy
Figure: Backtests of the BS strategyon the S&P500 index
I High Volatility of the backtests
I To match FFS's volatility,
κ = 0.65% → Libor's performance
Figure: Introducing stock picking inthe BS strategy
I Similar performances, but 30%more volatility.
Risk Management Lessons from Madoff Fraud
How Madoff Lost The Capital
A Simple Ponzi Scheme Model in Investment Management
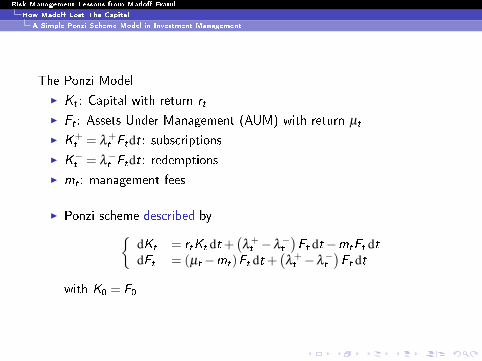
The Ponzi Model
I Kt : Capital with return rt
I Ft : Assets Under Management (AUM) with return µt
I K+t = λ
+t Ftdt: subscriptions
I K−t = λ−t Ftdt: redemptions
I mt : management fees
I Ponzi scheme described by{dKt = rtKt dt +
(λ
+t −λ
−t
)Ft dt−mtFt dt
dFt = (µt −mt)Ft dt +(λ
+t −λ
−t
)Ft dt
with K0 = F0
Risk Management Lessons from Madoff Fraud
How Madoff Lost The Capital
A Simple Ponzi Scheme Model in Investment Management
Main Findings
I Management fees are the main contributors to capital shrinkage.
I Default may be avoided only if mt < λ+t −λ
−t .
I Default time is a negative function of mt and µt .I Higher fees
; more capital used to remunerate the fund managerI Similarly, high µt
; AUM grow more quickly and more fees are generated.
Risk Management Lessons from Madoff Fraud
How Madoff Lost The Capital
Madoff's default
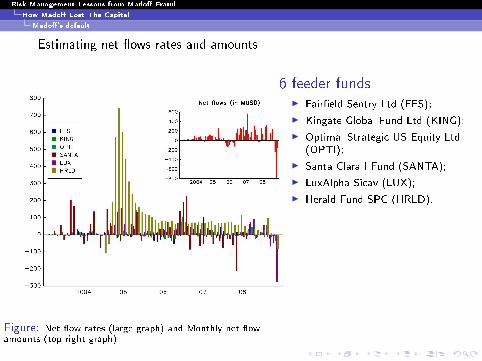
Estimating net �ows rates and amounts
Figure: Net �ow rates (large graph) and Monthly net �owamounts (top-right graph)
6 feeder fundsI Fair�eld Sentry Ltd (FFS);
I Kingate Global Fund Ltd (KING);
I Optimal Strategic US Equity Ltd(OPTI);
I Santa Clara I Fund (SANTA);
I LuxAlpha Sicav (LUX);
I Herald Fund SPC (HRLD).
Risk Management Lessons from Madoff Fraud
How Madoff Lost The Capital
Madoff's default
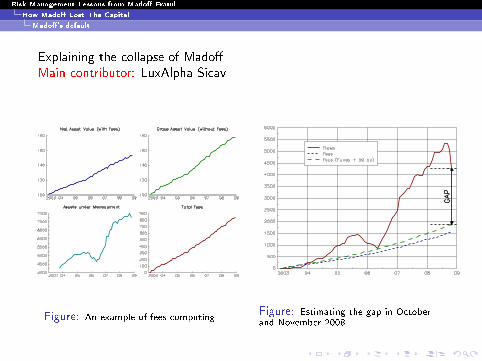
Explaining the collapse of MadoffMain contributor: LuxAlpha Sicav
Figure: An example of fees computingFigure: Estimating the gap in Octoberand November 2008
Risk Management Lessons from Madoff Fraud
Impact on Operational Risk Management
Characterization of Madoff's fraud
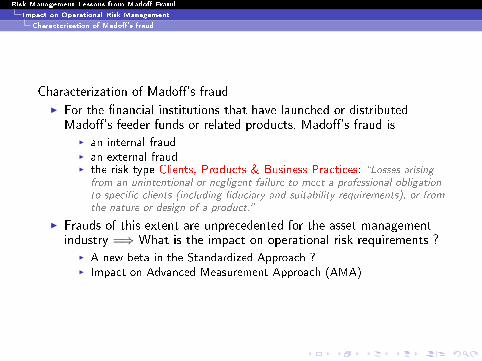
Characterization of Madoff's fraud
I For the �nancial institutions that have launched or distributedMadoff's feeder funds or related products, Madoff's fraud is
I an internal fraudI an external fraudI the risk type Clients, Products & Business Practices: �Losses arising
from an unintentional or negligent failure to meet a professional obligationto speci�c clients (including �duciary and suitability requirements), or fromthe nature or design of a product.�
I Frauds of this extent are unprecedented for the asset managementindustry =⇒ What is the impact on operational risk requirements ?
I A new beta in the Standardized Approach ?I Impact on Advanced Measurement Approach (AMA)
Risk Management Lessons from Madoff Fraud
Impact on Operational Risk Management
The Standardized Approach
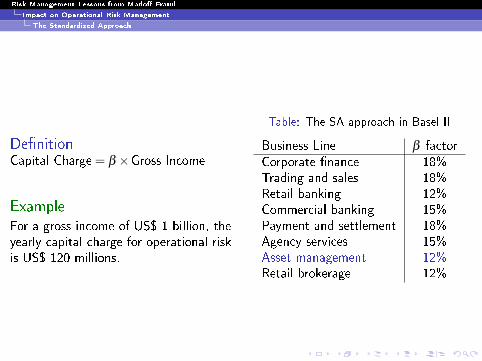
De�nitionCapital Charge = β ×Gross Income
ExampleFor a gross income of US$ 1 billion, theyearly capital charge for operational riskis US$ 120 millions.
Table: The SA approach in Basel II
Business Line β factor
Corporate �nance 18%Trading and sales 18%Retail banking 12%Commercial banking 15%Payment and settlement 18%Agency services 15%Asset management 12%Retail brokerage 12%

Risk Management Lessons from Madoff Fraud
Impact on Operational Risk Management
The Standardized Approach
LDCE 2008
I Asset Management represents 4% of consolidated gross income(7.7% for Trading & Sales).
I Asset Management losses represent 2.5% of total losses (13.6% forTrading & Sales).
I Annual frequency = 704 losses per year larger than 20000 euros(74% for the risk type Execution, Delivery, and Process Managementand 14% for the risk type Clients, Products & Business Practices).
I Annual loss amount = 242.9 ME (53% for the risk type Execution,Delivery, and Process Management and 31% for the risk typeClients, Products & Business Practices).
I The 95th percentile of individual losses is 620000 euros.
=⇒ What would be the impact of Madoff's Fraud ?
Risk Management Lessons from Madoff Fraud
Impact on Operational Risk Management
The Advanced Measurement Approach (AMA)
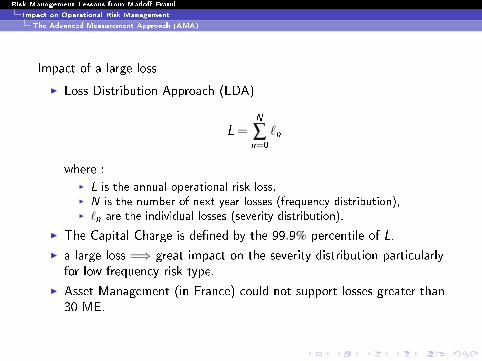
Impact of a large loss
I Loss Distribution Approach (LDA)
L =N
∑n=0
`n
where :I L is the annual operational risk loss,I N is the number of next year losses (frequency distribution),I `n are the individual losses (severity distribution).
I The Capital Charge is de�ned by the 99.9% percentile of L.
I a large loss =⇒ great impact on the severity distribution particularlyfor low frequency risk type.
I Asset Management (in France) could not support losses greater than30 ME.
Risk Management Lessons from Madoff Fraud
Implications for Regulators and the Investment Industry
Rethinking Due Diligence Processes
I 4 of the 10 biggest FOHF managers have invested in Madoff's funds.
I Mado� was on the black lists of several banks.
I Operational due diligence versus Quantitative due diligence =⇒ lackof quantitative expertise.
I Initiatives to de�ne a common analysis framework: AIMA, HFWG,etc.
One solutionProduct-oriented regulation =⇒ Actor-oriented regulation (theimportance of responsibility).
Risk Management Lessons from Madoff Fraud
Implications for Regulators and the Investment Industry
Rethinking the Hedge Fund industry
I 2003-2007: HF bubble (like the internet bubble).
I 2008-2009: Annus horribilis (liquidity, gates, Madoff, WearingCapital, K1).
I �Retailization� of the industry.
I Diabolization of the hedge fund industry.
I Promote transparency, liquidity and standardizationI Platform of managed accounts.I Replication products (carry trades, volatility selling, etc.).I Benchmark (investable indices) =⇒ �rst step to build a regulation onhedge funds.
Risk Management Lessons from Madoff Fraud
Implications for Regulators and the Investment Industry
Impact on Regulations
I The case of LuxAlpha Sicav =⇒ problem of coordination?
I Completing the UCITS III framework ?
Our thinking
I Keep things very clear for investors.
I A part of the HF industry wants to be regulated.I Need a speci�ed format and regulation for these hedge funds.I Create incentives.
I AIFM directive =⇒ Right answer ?
Risk Management Lessons from Madoff Fraud
Implications for Regulators and the Investment Industry
The AIFM Directive
I Good thingsI Regulates unregulated investment productsI Proposes a set of rules (valuation, custody, etc.)I Systemic risk vs investors protection
I Two main problemsI Wide scope of non UCITS investment vehicles (Private Equity,Hedge Funds, Real-Estate, National regulated funds)
I Very di�erents in terms of investors, strategies, risks, etc.I The speci�c case of private equity (+ Solvency II).I Too much large and general !
I Ressources and competencies to regulate the industry.
Risk Management Lessons from Madoff Fraud
Bibliography
For Further Reading I
Carole Bernard, Phelim Boyle.Mr. Madoff's Amazing Returns: An Analysis of the Split-StrikeConversion strategy.Working Paper, 2009.
Charles W. Calomiris.The Subprime Turmoil: What's Old, What's New, and What's Next.Working paper presented at the IMF Ninth Jacques Polak AnnualResearch Conference, October 2008.
Pierre Clauss, Thierry Roncalli, Guillaume Weisang.Risk Management Lessons From Madoff Fraud.forthcoming in International Finance Review, available on SSRN,2009.

![RelationshipbetweenPlasmaFerritinLevelandSiderocyte ...downloads.hindawi.com/journals/anemia/2012/890471.pdfpathway [14]. Excess iron was stored in the form of ferritin in the cytosol](https://static.fdocument.org/doc/165x107/5e249599054bd720750e3cf6/relationshipbetweenplasmaferritinlevelandsiderocyte-pathway-14-excess-iron.jpg)