Rheometry SLIT RHEOMETER - Pennsylvania State...
15
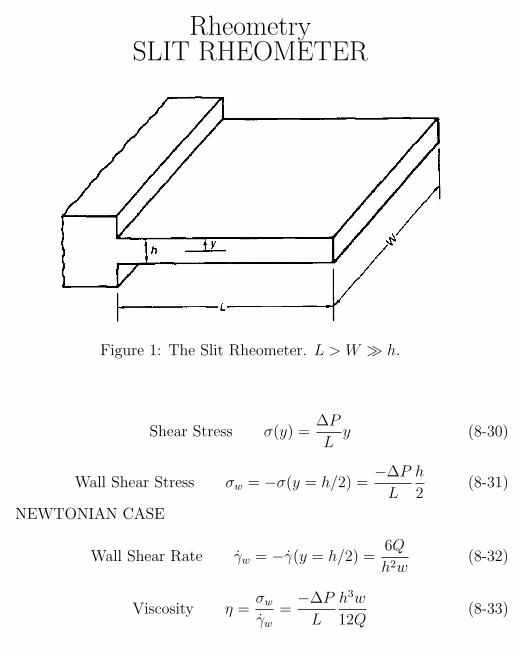
Rheometry SLIT RHEOMETER Figure 1: The Slit Rheometer. L>W h. Shear Stress σ(y)= ΔP L y (8-30) Wall Shear Stress σ w = -σ(y = h/2) = -ΔP L h 2 (8-31) NEWTONIAN CASE Wall Shear Rate ˙ γ w = - ˙ γ (y = h/2) = 6Q h 2 w (8-32) Viscosity η = σ w ˙ γ w = -ΔP L h 3 w 12Q (8-33)
Transcript of Rheometry SLIT RHEOMETER - Pennsylvania State...
RheometrySLIT RHEOMETER
Figure 1: The Slit Rheometer. L > W � h.
Shear Stress σ(y) =∆P
Ly (8-30)
Wall Shear Stress σw = −σ(y = h/2) =−∆P
L
h
2(8-31)
NEWTONIAN CASE
Wall Shear Rate γ̇w = −γ̇(y = h/2) =6Q
h2w(8-32)
Viscosity η =σw
γ̇w
=−∆P
L
h3w
12Q(8-33)
1
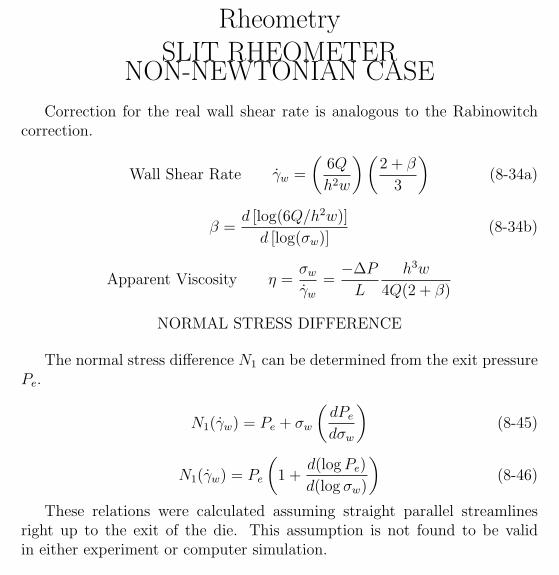
RheometrySLIT RHEOMETER
NON-NEWTONIAN CASE
Correction for the real wall shear rate is analogous to the Rabinowitchcorrection.
Wall Shear Rate γ̇w =
(6Q
h2w
) (2 + β
3
)(8-34a)
β =d [log(6Q/h2w)]
d [log(σw)](8-34b)
Apparent Viscosity η =σw
γ̇w
=−∆P
L
h3w
4Q(2 + β)
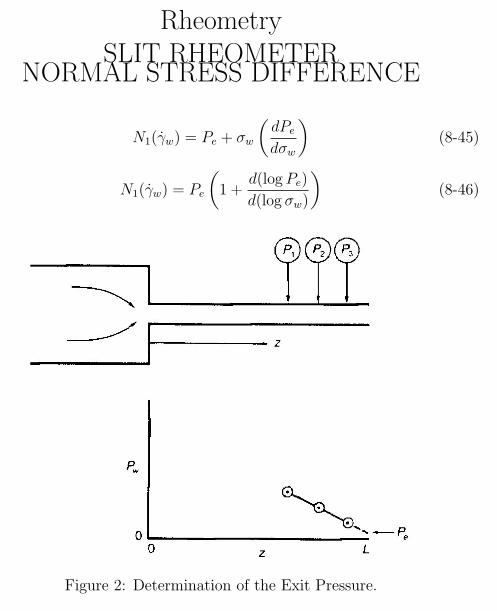
NORMAL STRESS DIFFERENCE
The normal stress difference N1 can be determined from the exit pressurePe.
N1(γ̇w) = Pe + σw
(dPe
dσw
)(8-45)
N1(γ̇w) = Pe
(1 +
d(log Pe)
d(log σw)
)(8-46)
These relations were calculated assuming straight parallel streamlinesright up to the exit of the die. This assumption is not found to be validin either experiment or computer simulation.
2
RheometrySLIT RHEOMETER
NORMAL STRESS DIFFERENCE
N1(γ̇w) = Pe + σw
(dPe
dσw
)(8-45)
N1(γ̇w) = Pe
(1 +
d(log Pe)
d(log σw)
)(8-46)
Figure 2: Determination of the Exit Pressure.
3
RheometrySLIT RHEOMETER
NORMAL STRESS DIFFERENCE
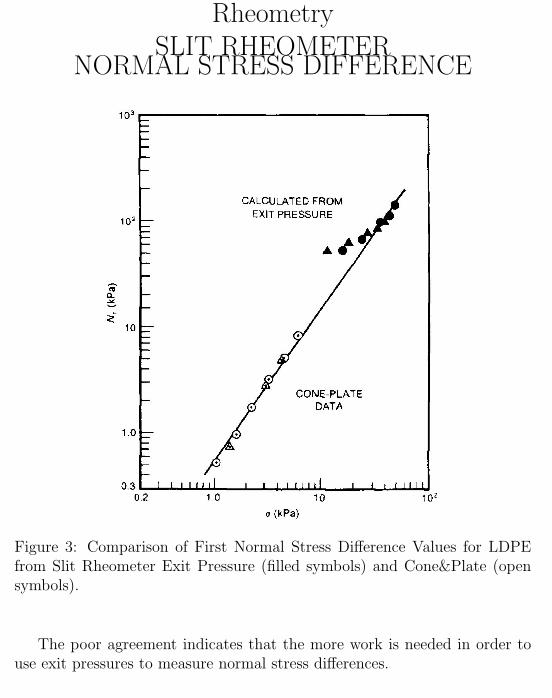
Figure 3: Comparison of First Normal Stress Difference Values for LDPEfrom Slit Rheometer Exit Pressure (filled symbols) and Cone&Plate (opensymbols).
The poor agreement indicates that the more work is needed in order touse exit pressures to measure normal stress differences.
4
RheometrySLIT RHEOMETER
ENTRANCE PRESSURE DROP
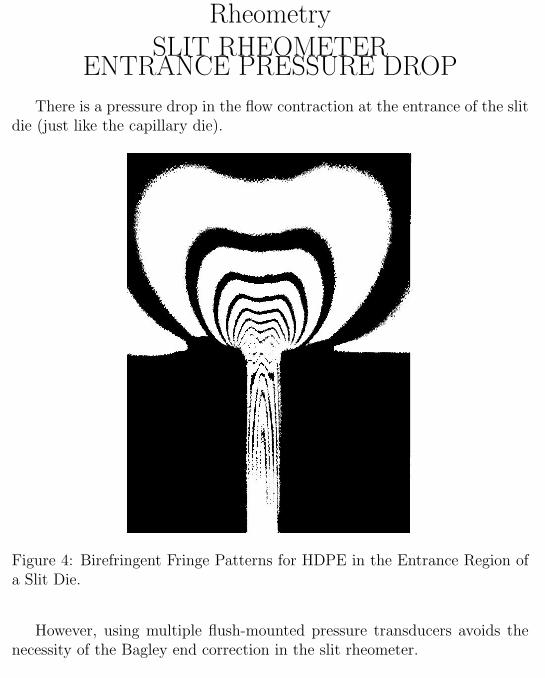
There is a pressure drop in the flow contraction at the entrance of the slitdie (just like the capillary die).
Figure 4: Birefringent Fringe Patterns for HDPE in the Entrance Region ofa Slit Die.
However, using multiple flush-mounted pressure transducers avoids thenecessity of the Bagley end correction in the slit rheometer.
5
RheometrySLIT AND CAPILLARY RHEOMETERS
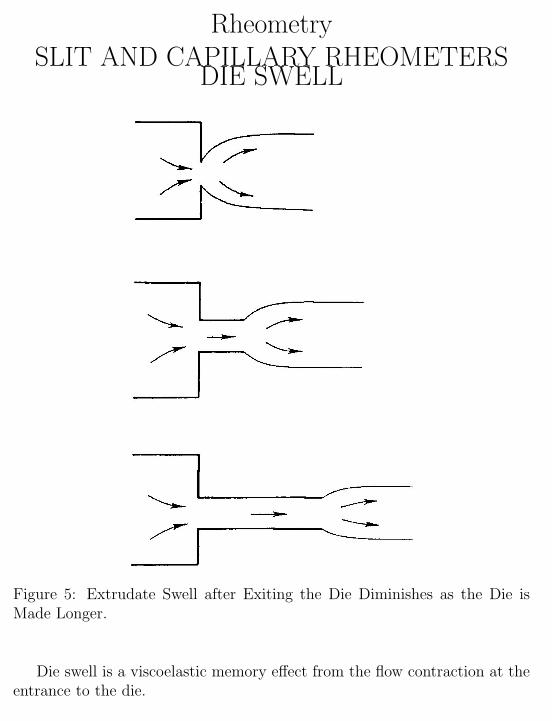
DIE SWELL
Figure 5: Extrudate Swell after Exiting the Die Diminishes as the Die isMade Longer.
Die swell is a viscoelastic memory effect from the flow contraction at theentrance to the die.
6
RheometrySLIT AND CAPILLARY RHEOMETERS
DIE SWELL
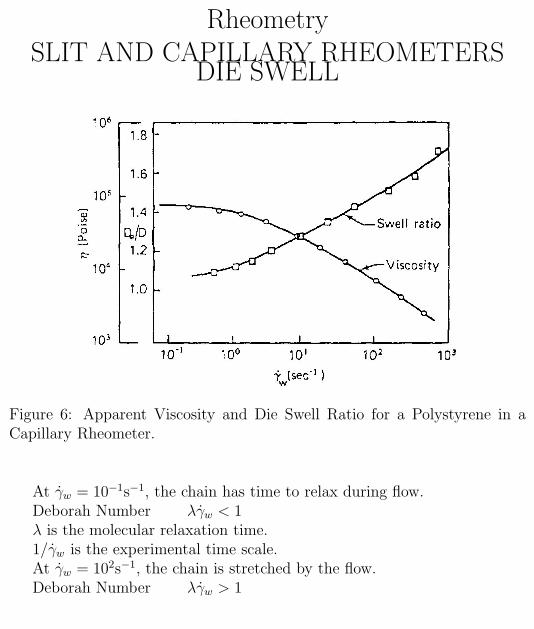
Figure 6: Apparent Viscosity and Die Swell Ratio for a Polystyrene in aCapillary Rheometer.
At γ̇w = 10−1s−1, the chain has time to relax during flow.Deborah Number λγ̇w < 1λ is the molecular relaxation time.1/γ̇w is the experimental time scale.At γ̇w = 102s−1, the chain is stretched by the flow.Deborah Number λγ̇w > 1
7
RheometrySLIT AND CAPILLARY RHEOMETERS
DIE SWELL
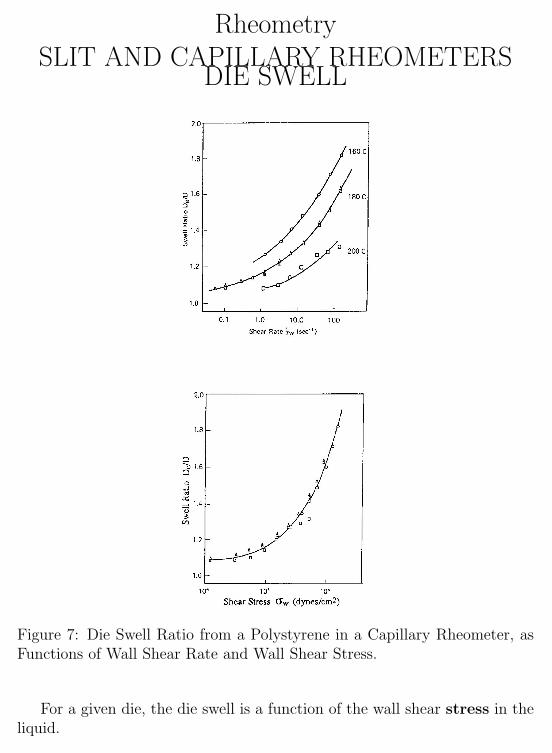
Figure 7: Die Swell Ratio from a Polystyrene in a Capillary Rheometer, asFunctions of Wall Shear Rate and Wall Shear Stress.
For a given die, the die swell is a function of the wall shear stress in theliquid.
8
RheometrySLIT AND CAPILLARY RHEOMETERS
DIE SWELL
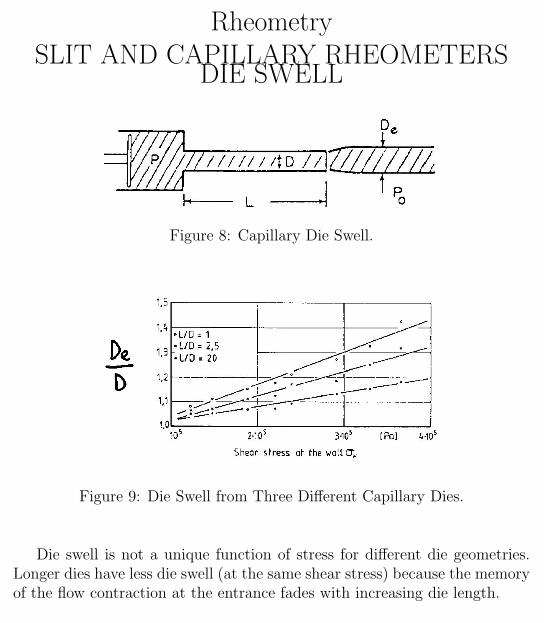
Figure 8: Capillary Die Swell.
Figure 9: Die Swell from Three Different Capillary Dies.
Die swell is not a unique function of stress for different die geometries.Longer dies have less die swell (at the same shear stress) because the memoryof the flow contraction at the entrance fades with increasing die length.
9
RheometrySLIT AND CAPILLARY RHEOMETERS
DIE SWELL
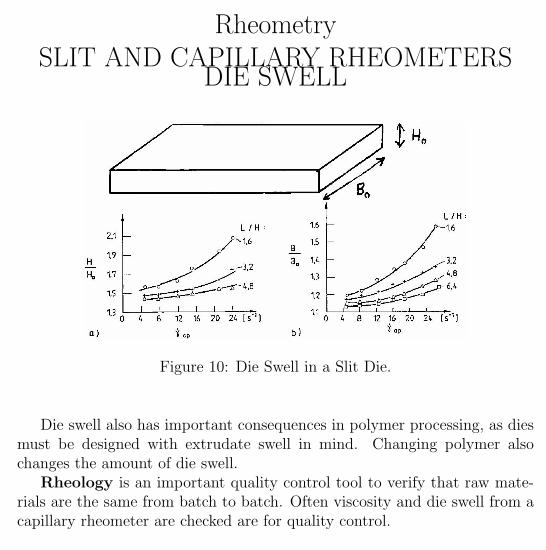
Figure 10: Die Swell in a Slit Die.
Die swell also has important consequences in polymer processing, as diesmust be designed with extrudate swell in mind. Changing polymer alsochanges the amount of die swell.
Rheology is an important quality control tool to verify that raw mate-rials are the same from batch to batch. Often viscosity and die swell from acapillary rheometer are checked are for quality control.
10
RheometrySLIT AND CAPILLARY RHEOMETERS
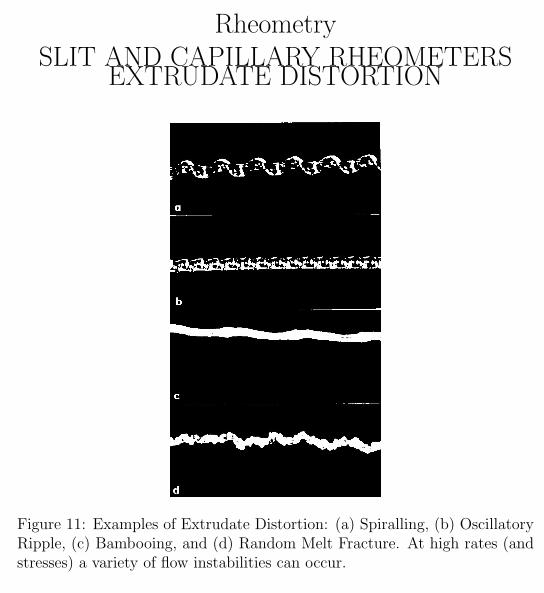
EXTRUDATE DISTORTION
Figure 11: Examples of Extrudate Distortion: (a) Spiralling, (b) OscillatoryRipple, (c) Bambooing, and (d) Random Melt Fracture. At high rates (andstresses) a variety of flow instabilities can occur.
11
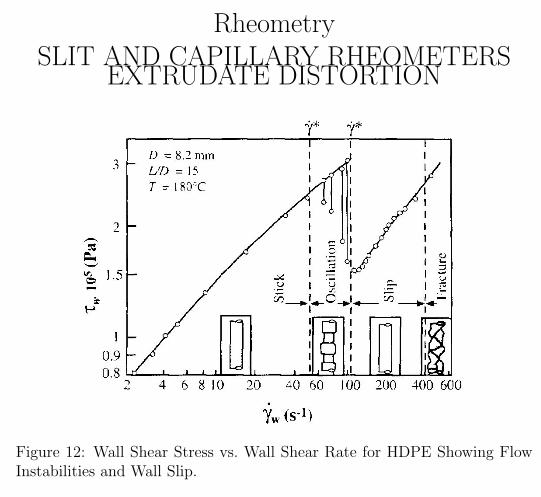
RheometrySLIT AND CAPILLARY RHEOMETERS
EXTRUDATE DISTORTION
Figure 12: Wall Shear Stress vs. Wall Shear Rate for HDPE Showing FlowInstabilities and Wall Slip.
12
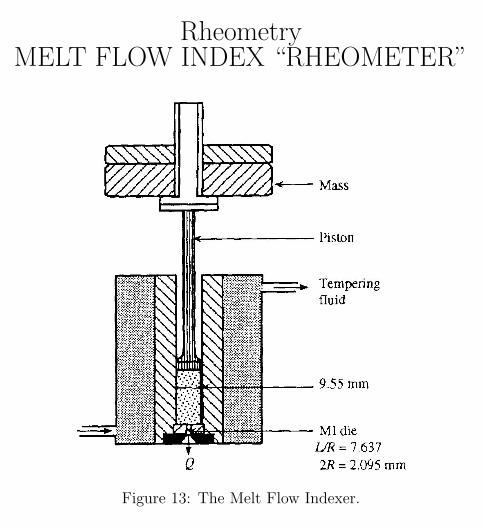
RheometryMELT FLOW INDEX “RHEOMETER”
Figure 13: The Melt Flow Indexer.
13
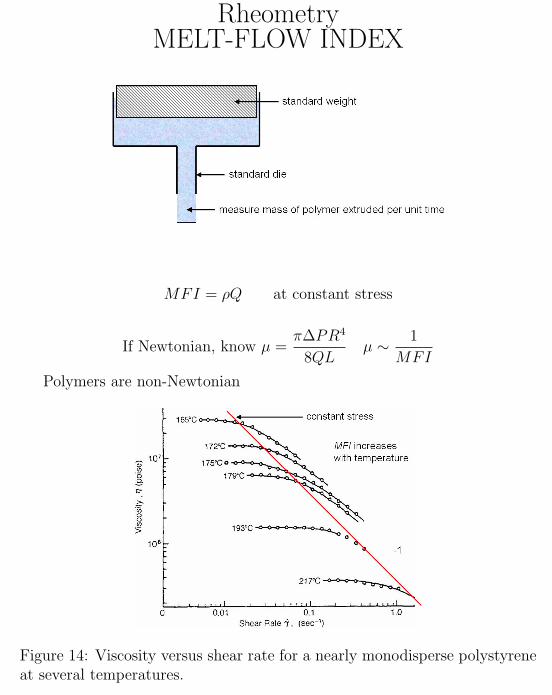
RheometryMELT-FLOW INDEX
MFI = ρQ at constant stress
If Newtonian, know µ =π∆PR4
8QLµ ∼ 1
MFI
Polymers are non-Newtonian
Figure 14: Viscosity versus shear rate for a nearly monodisperse polystyreneat several temperatures.
14
RheometryMELT-FLOW INDEX
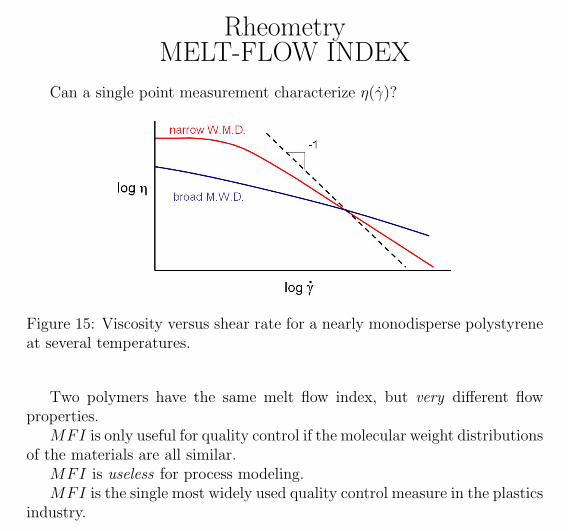
Can a single point measurement characterize η(γ̇)?
Figure 15: Viscosity versus shear rate for a nearly monodisperse polystyreneat several temperatures.
Two polymers have the same melt flow index, but very different flowproperties.
MFI is only useful for quality control if the molecular weight distributionsof the materials are all similar.
MFI is useless for process modeling.MFI is the single most widely used quality control measure in the plastics
industry.
15