Resistance in Humans and Mice , Chong-xian Pan , and...
41
3 Microdose-induced Drug-DNA Adducts as Biomarkers of Chemotherapy Resistance in Humans and Mice Maike Zimmermann 1,2 , Si-Si Wang 1† , Hongyong Zhang 1 , Tzu-yin Lin 1 , Michael Malfatti 3 , Kurt Haack 3 , Ted Ognibene 3 , Hongyuan Yang 4 , Susan Airhart 4 , Kenneth W. Turteltaub 3 , George D. Cimino 2 , Clifford G. Tepper 5 , Alexandra Drakaki 6 , Karim Chamie 7 , Ralph de Vere White 8 , Chong-xian Pan 1,8,9* , and Paul T. Henderson 1,2* 1. Department of Internal Medicine, Division of Hematology and Oncology and UC Davis Comprehensive Cancer Center, University of California Davis, Sacramento, CA. 2. Accelerated Medical Diagnostics Incorporated, Berkeley, CA. 3. Lawrence Livermore National Laboratory, Livermore, CA. 4. The Jackson Laboratory, Sacramento, CA. 5. Department of Biochemistry and Molecular Medicine, UC Davis School of Medicine, CA 6. Department of Medicine, Division of Hematology & Oncology, UCLA Medical Center, Los Angeles CA 7. Department of Urology, UCLA Medical Center, Los Angeles, CA. 8. Department of Urology, University of California Davis, Sacramento, CA. 9. VA Northern California Health Care System, Mather, CA. Running Title: Drug-DNA Adducts as Biomarkers of Chemotherapy Resistance *To whom correspondence should be addressed: Paul Henderson, PhD Chong-xian Pan, MD, PhD UC Davis Comprehensive Cancer Center 4501 X Street, Room 3016 Sacramento, CA 95817 Phone: 916-734-3771 Fax: 916-734-7946 Email: [email protected] and [email protected]. †Current address: Translational Medicine Research Institute, the First Hospital of Jilin University, People’s Republic of China Keywords: diagnostic microdosing, chemotherapy resistance, bladder cancer, accelerator mass spectrometry, patient derived xenografts Funding: Work was funded by NIH grants CA93373 (R. de Vere White), SBIR contracts to AMD Phase I HHSN261201000133C (P.T. Henderson), Phase II HHSN261201200048C (P.T. Henderson), LLNL grants LDRD 08-LW-100 (P.T. Henderson and M. Malfatti), NIH/NIGMS P41 RR13461 (K.W. Turteltaub), American Cancer Society (C.-X. Pan), the Knapp Family Fund (P.T. Henderson), and VA Career Development Award-2 (C.-X. Pan). Work performed (partially) at the Research Resource for Biomedical AMS, which is operated at LLNL under the auspices of the U.S. Department of Energy under contract DE-AC52-07NA27344. The Research Resource is supported by the National Institutes of Health, National Center for Research Resources, Biomedical Technology Program grant P41 RR13461. The UC on June 19, 2018. © 2016 American Association for Cancer Research. mct.aacrjournals.org Downloaded from Author manuscripts have been peer reviewed and accepted for publication but have not yet been edited. Author Manuscript Published OnlineFirst on November 30, 2016; DOI: 10.1158/1535-7163.MCT-16-0381
-
Upload
nguyendang -
Category
Documents
-
view
220 -
download
1
Transcript of Resistance in Humans and Mice , Chong-xian Pan , and...
3
Microdose-induced Drug-DNA Adducts as Biomarkers of Chemotherapy Resistance in Humans and Mice Maike Zimmermann1,2, Si-Si Wang1†, Hongyong Zhang1, Tzu-yin Lin1, Michael Malfatti3, Kurt Haack3, Ted Ognibene3, Hongyuan Yang4, Susan Airhart4, Kenneth W. Turteltaub3, George D. Cimino2, Clifford G. Tepper5, Alexandra Drakaki6, Karim Chamie7, Ralph de Vere White8, Chong-xian Pan1,8,9*, and Paul T. Henderson1,2*
1. Department of Internal Medicine, Division of Hematology and Oncology and UC Davis Comprehensive Cancer Center, University of California Davis, Sacramento, CA. 2. Accelerated Medical Diagnostics Incorporated, Berkeley, CA. 3. Lawrence Livermore National Laboratory, Livermore, CA. 4. The Jackson Laboratory, Sacramento, CA. 5. Department of Biochemistry and Molecular Medicine, UC Davis School of Medicine, CA 6. Department of Medicine, Division of Hematology & Oncology, UCLA Medical Center, Los Angeles CA 7. Department of Urology, UCLA Medical Center, Los Angeles, CA. 8. Department of Urology, University of California Davis, Sacramento, CA. 9. VA Northern California Health Care System, Mather, CA. Running Title: Drug-DNA Adducts as Biomarkers of Chemotherapy Resistance *To whom correspondence should be addressed: Paul Henderson, PhD Chong-xian Pan, MD, PhD UC Davis Comprehensive Cancer Center 4501 X Street, Room 3016 Sacramento, CA 95817 Phone: 916-734-3771 Fax: 916-734-7946 Email: [email protected] and [email protected]. †Current address: Translational Medicine Research Institute, the First Hospital of Jilin University, People’s Republic of China Keywords: diagnostic microdosing, chemotherapy resistance, bladder cancer, accelerator mass spectrometry, patient derived xenografts Funding: Work was funded by NIH grants CA93373 (R. de Vere White), SBIR contracts to AMD Phase I HHSN261201000133C (P.T. Henderson), Phase II HHSN261201200048C (P.T. Henderson), LLNL grants LDRD 08-LW-100 (P.T. Henderson and M. Malfatti), NIH/NIGMS P41 RR13461 (K.W. Turteltaub), American Cancer Society (C.-X. Pan), the Knapp Family Fund (P.T. Henderson), and VA Career Development Award-2 (C.-X. Pan). Work performed (partially) at the Research Resource for Biomedical AMS, which is operated at LLNL under the auspices of the U.S. Department of Energy under contract DE-AC52-07NA27344. The Research Resource is supported by the National Institutes of Health, National Center for Research Resources, Biomedical Technology Program grant P41 RR13461. The UC
on June 19, 2018. © 2016 American Association for Cancer Research. mct.aacrjournals.org Downloaded from
Author manuscripts have been peer reviewed and accepted for publication but have not yet been edited. Author Manuscript Published OnlineFirst on November 30, 2016; DOI: 10.1158/1535-7163.MCT-16-0381
4
Davis Comprehensive Cancer Center Genomics Shared Resource is supported by Cancer Center Support Grant P30CA093373 from the NCI. Competing interests: Drs. Pan, Henderson, Zimmermann and Cimino are shareholders of Accelerated Medical Diagnostics, Inc.
Abstract
We report progress on predicting tumor response to platinum-based chemotherapy with
a novel mass spectrometry approach. Fourteen bladder cancer patients were
administered one diagnostic microdose each of [14C]carboplatin (1% of the therapeutic
dose). Carboplatin-DNA adducts were quantified by accelerator mass spectrometry
(AMS) in blood and tumor samples collected within 24 hours, and compared to
subsequent chemotherapy response. Patients with the highest adduct levels were
responders, but not all responders had high adduct levels. Four patient-derived bladder
cancer xenograft mouse models were used to test the possibility that another drug in
the regimen could cause a response. The mice were dosed with [14C]carboplatin or
[14C]gemcitabine and the resulting drug-DNA adduct levels were compared to tumor
response to chemotherapy. At least one of the drugs had to induce high drug-DNA
adduct levels or create a synergistic increase in overall adducts to prompt a
corresponding therapeutic response, demonstrating proof-of-principle for drug-DNA
adducts as predictive biomarkers.
on June 19, 2018. © 2016 American Association for Cancer Research. mct.aacrjournals.org Downloaded from
Author manuscripts have been peer reviewed and accepted for publication but have not yet been edited. Author Manuscript Published OnlineFirst on November 30, 2016; DOI: 10.1158/1535-7163.MCT-16-0381
5
Introduction
Cisplatin, carboplatin and oxaliplatin are among the most commonly prescribed
chemotherapeutic drugs and are used in over half of all chemotherapy patients for
various cancers, such as bladder, lung, ovarian, and colon. Except in testicular cancer,
their efficacy is modest, and drug resistance is the most common cause of treatment
failure (1, 2). The feasibility of predicting drug resistance by genomics analysis has
been reported for bladder cancer (3, 4). This work led to improved understanding of
resistance mechanisms, and identified over 700 genes involved in cellular response to
platinum-based drug treatment (5). However, the genomics approach has thus far failed
to develop clinically useful tests for predicting resistance.
Platinum-based drugs kill cancer cells through covalent drug-DNA adduct
formation (2, 6). Accordingly, another approach of identifying drug resistance has
focused on quantification of drug-DNA adducts as biomarkers (7-12). The levels of
such adducts are the result of numerous factors that govern cellular responses to drug
exposure including genetics, tumor microenvironment, kidney function, overall patient
health and others (13). The key challenge of this approach is the need to dose patients
with full-dose chemotherapy in order to recover enough analyte to accurately quantify
extremely low levels of drug-DNA adducts (14). Furthermore, therapeutic dosing is a
poor diagnostics strategy and puts patients at risk. To address these problems, we
developed the concept of “diagnostic microdosing” in which patients are administered a
nontoxic sub-therapeutic “microdose” of 14C-labeled drug(s) followed by blood and
tumor biopsy sampling and analysis with accelerator mass spectrometry (AMS), as
summarized in Figure 1. AMS can easily measure one 14C-labeled drug molecule bound
on June 19, 2018. © 2016 American Association for Cancer Research. mct.aacrjournals.org Downloaded from
Author manuscripts have been peer reviewed and accepted for publication but have not yet been edited. Author Manuscript Published OnlineFirst on November 30, 2016; DOI: 10.1158/1535-7163.MCT-16-0381
6
to DNA per 108 nucleotides (15), with a limit of detection of one adduct per 1012
nucleotides (16) and can quantify radiocarbon-labeled drug or metabolites in urine,
blood or DNA samples (17, 18).
Most platinum-based treatments involve either cisplatin or carboplatin. Cisplatin
does not have a carbon atom in the molecule and cannot be detected by AMS.
Although less potent, carboplatin forms the same drug-DNA adduct crosslink structure
as cisplatin (SI Figure 1), and clinical cross-resistance is common (19). Consequently,
these two drugs are sometimes used interchangeably in clinical practice (6, 19).
Therefore, the microdosing approach to identifying carboplatin resistance can possibly
be applied to cisplatin.
We previously used AMS to quantify [14C]carboplatin-DNA monoadduct formation
in cancer cell lines exposed to microdose-relevant drug concentrations (12, 15, 20-23).
The resulting adduct-levels correlated with in vitro carboplatin cytotoxicity. AMS
specifically detected carboplatin-DNA monoadducts, since the 14C-labeled cyclobutane
dicarboxylate (CBDCA) group is released once the diadduct is formed (SI figure 1) (22).
We report here translation of these studies into a prospective Phase I clinical trial
including a cohort of bladder cancer patients (SI Figure 2). Bladder cancer was chosen
for this study as a proof-of-principle because platinum-based therapy is the standard
neoadjuvant treatment and is potentially curative for locally advanced cancer. The
diagnostic microdosing approach may also be used for many other cancer types that
implement similar platinum-based based therapies.
We tested the hypothesis that microdose-induced carboplatin-DNA adducts in
peripheral blood mononuclear cells (PBMC) correlate with response to platinum-based
on June 19, 2018. © 2016 American Association for Cancer Research. mct.aacrjournals.org Downloaded from
Author manuscripts have been peer reviewed and accepted for publication but have not yet been edited. Author Manuscript Published OnlineFirst on November 30, 2016; DOI: 10.1158/1535-7163.MCT-16-0381
7
neoadjuvant chemotherapy. We found that those patients with the highest carboplatin-
DNA adduct levels were responders. However, not all responders had high adduct
levels. This observation led to a second hypothesis that a combination drug partner may
compensate for low platinum-DNA adducts levels to enable a response. This hypothesis
was tested in mice bearing patient-derived tumor xenografts that were donated by four
myoinvasive bladder cancer patients. These mice were dosed with either
[14C]carboplatin and/or [14C]gemcitabine as a model of gemcitabine and platinum (GC)
combination therapy. Mouse tumors with high drug-DNA adducts levels responded to
chemotherapy, whereas low adduct levels correlated with resistance. Collectively, these
results support the feasibility of diagnostic microdosing to improve patient outcomes by
personalizing chemotherapy.
Material and Methods
Chemicals
Unlabeled gemcitabine (GEMZAR®) was obtained from Eli Lilly (Indianapolis, IN, USA),
and carboplatin (CARBOplatin®, 10 mg/mL) from Hospira (Lake Forest, IL, USA). 14C-
labeled carboplatin (specific activity 53 mCi/mmol with the 14C-label in the cyclobutane
dicarboxcylic group) was obtained from GE Healthcare (Waukesha, WI, USA) and
[14C]gemcitabine (specific activity 58.8 mCi/mmol with the 14C-label on the aromatic
nucleobase at the 2 position) was purchased from Moravek Biochemicals (Brea, CA,
USA). [14C]carboplatin for injection was prepared under good manufacturing practice
(GMP) at the GMP facility at UC Davis. The [14C]carboplatin drug substance was
dissolved with sterile water for injection (WFI). The resulting solution was filter sterilized
on June 19, 2018. © 2016 American Association for Cancer Research. mct.aacrjournals.org Downloaded from
Author manuscripts have been peer reviewed and accepted for publication but have not yet been edited. Author Manuscript Published OnlineFirst on November 30, 2016; DOI: 10.1158/1535-7163.MCT-16-0381
8
with 0.2 μm PES syringe filter into sterile glass vials and sealed with a rubber septum.
Specific activity was determined by liquid scintillation counting (LSC). Mixtures of 14C-
labeled and unlabeled drug were used to minimize the usage of radiocarbon and
achieve the different specific activities required for microdoses and therapeutic doses.
Drug solutions for the indicated experiments were prepared immediately before use.
Clinical Study
The study “A phase 0 clinical trial of microdosing carboplatin and molecular profiling for
chemoresistance” (ClinicalTrials.gov identifier NCT01261299) is an ongoing, multisite
feasibility study of the diagnostic microdosing approach. The patient population
consisted of non-small cell lung cancer patients (NSCLC), stage IV with measurable
lesions, and bladder transitional cell carcinoma (TCC) patients, stage II disease and
above for neoadjuvant treatment, or stage III and IV metastatic disease (only data for
TCC are presented here). Informed consent was obtained after the nature and possible
consequences of the studies were explained. Microdoses of [14C]carboplatin were
administered to patients as a diagnostic reagent, followed by standard of care full dose
platinum-based chemotherapy (G/C or MVAC) and evaluation of response. PBMC and
tumor tissue were collected from the patients for analysis of carboplatin-DNA
monoadduct frequencies. Toxicity of the [14C]carboplatin diagnostic reagent
administered as a microdose was assessed using Common Terminology Criteria for
Adverse Events (CTCAE). Patient response to chemotherapy was evaluated using the
RECIST for correlation to carboplatin-DNA monoadduct frequency. The carboplatin
dose for human chemotherapy is calculated using the Calvert formula with an AUC of 6.
on June 19, 2018. © 2016 American Association for Cancer Research. mct.aacrjournals.org Downloaded from
Author manuscripts have been peer reviewed and accepted for publication but have not yet been edited. Author Manuscript Published OnlineFirst on November 30, 2016; DOI: 10.1158/1535-7163.MCT-16-0381
9
Therefore, individual patients were given a microdose of [14C]carboplatin (1.0 x 10⁷
dpm/kg of body weight) containing a total carboplatin dose at 1% of their therapeutic
dose by a 2-minute bolus intravenous infusion (IV). Unlabeled carboplatin and
[14C]carboplatin were mixed immediately before dosing and injected through the
peripheral vein at one arm. Peripheral blood specimens were drawn into BD Vacutainer
CPTTM tubes with sodium citrate (Becton Dickinson) from the other arm at specified time
points before and after the administration of the microdose. PBMC were isolated within
2 hours of collection by centrifugation according to manufacturer’s instruction. A
proportion of total plasma was used for LSC measurement and PK determination.
Tumor biopsy specimens were collected 24 hours after microdosing. Outcomes related
to chemotherapy (including response and adverse events) were collected and
correlated with carboplatin-DNA monoadduct data.
Animal handling and treatment
All animal experiments were performed in compliance with institutional guidelines and
approved by the Animal Use and Care Administrative Advisory Committee at the
University of California, Davis (CA, USA). All animals were kept under pathogen-free
conditions. Female NOD scid gamma severe combined immunodeficient (NSG) mice
(5-8 weeks of age, body weight: 20-25 g) were purchased from Jackson laboratories
(CA, USA). Patient derived tumor xenografts (PDX) were created by subcutaneous
injection at the flank of approximately 1 mm3 cancerous tissue from a patient’s primary
tumor directly into a NSG. PDX tumors (passage 2-4) were allowed to grow to at about
200mm3 before being assessed for drug efficacy and microdosing studies.
on June 19, 2018. © 2016 American Association for Cancer Research. mct.aacrjournals.org Downloaded from
Author manuscripts have been peer reviewed and accepted for publication but have not yet been edited. Author Manuscript Published OnlineFirst on November 30, 2016; DOI: 10.1158/1535-7163.MCT-16-0381
10
Animal dosing with radiolabeled drugs
When the xenografts reached approximately 200 mm3, mice were intravenously injected
through the tail vein with one microdose 10 µL/g of radiolabeled carboplatin
(0.375 mg/kg, 50,000 dpm/g) or gemcitabine (0.092 mg/kg, 1,000 dpm/g) or one
therapeutic dose of radiolabeled carboplatin (37.5 mg/kg, 50,000 dpm/g) or gemcitabine
(9.2 mg/kg, 1,000 dpm/g). Tumor tissues were collected after 4 and 24 hours and stored
at -80°C until DNA isolation.
Efficacy Study
For each treatment group, 8-12 mice were used to allow statistical analysis. When
tumor sizes reached approximately 200 mm3, mice were randomly assigned into
different treatment groups and treated with indicated therapeutic agents (Cisplatin at
2 mg/kg IV Q7Dx3, carboplatin at 30 mg/kg IP Q7Dx4, and gemcitabine at 150 mg/kg IP
Q7Dx4). Mice were monitored for tumor growth and alterations in weight. Tumor size
was determined with a caliper, and tumor volumes were calculated using an ellipsoidal
formula (1/2 × length × width squared). Mice were sacrificed when the tumor length
reached 20 mm in any direction.
DNA isolation
DNA was extracted from minced tumor tissue or PBMC pellet with the Wizard Genomic
DNA Purification Kit according to the manufacturer's instruction (Promega, Madison, WI,
USA). DNA quantity and quality was determined with a NanoDrop 1000
on June 19, 2018. © 2016 American Association for Cancer Research. mct.aacrjournals.org Downloaded from
Author manuscripts have been peer reviewed and accepted for publication but have not yet been edited. Author Manuscript Published OnlineFirst on November 30, 2016; DOI: 10.1158/1535-7163.MCT-16-0381
11
spectrophotometer, the purity was ensured by obtaining a 260/280 nm OD ratio of
approximately 1.9.
AMS
All DNA samples were submitted to Lawrence Livermore National Laboratory (LLNL) for
AMS analysis of radiocarbon content using an established protocol (24). Ten
micrograms of DNA per sample was converted to graphite and measured by AMS for
14C quantification as previously described.
RNA isolation, cDNA Synthesis, RT-PCR
Total RNA was isolated using Qiagen RNeasy Mini Kit and QIAshredder spin columns
(Qiagen, Valencia, CA) following manufacturer instructions. Column bound RNA was
pretreated with Qiagen RNase-Free DNase to remove genomic DNA before elution with
RNase free water. Nucleotide concentration and purity was determined via NanoDrop
1000 spectrophotometer. RNA purity was ensured by obtaining a 260/280 nm OD ratio
approximately 2.0. cDNA was synthesized using RevertAid RT Kit (Thermo Scientific,
Carlsbad, CA) using 1 µg freshly purified RNA and random hexamer primer. Real-Time
PCR (RT-PCR) was performed with BioRad CFX96 Real-Time System instrument in
triplicates of each sample in a volume of 10 μL using a standard protocol (95°C, 2 min,
40 cycles: 95°C, 15 sec; 60°C, 30 sec; 72°C, 30 sec; melting curve 65°C - 95°C, 5 sec).
Per reaction, 4 ng cDNA was mixed with 10 pmol forward and reverse primer, SYBR
green and EconoTaq PLUS 2X Master Mix (Lucigen Corporation, Middleton, WI).
Primer sequences (Integrated DNA Technologies, Coralville, IA) included: GAPDH:
on June 19, 2018. © 2016 American Association for Cancer Research. mct.aacrjournals.org Downloaded from
Author manuscripts have been peer reviewed and accepted for publication but have not yet been edited. Author Manuscript Published OnlineFirst on November 30, 2016; DOI: 10.1158/1535-7163.MCT-16-0381
12
forward 5′-CGCGGGGCTCTCCAGAACATC-3′, reverse 5′-
CTCCGACGCCTGCTTCACCAC-3′; RRM1: forward 5′-GCCGCCAAGAACGAGTCAT-
3′, reverse 5′-AGCAGCCAAAGTATCTAGTTCCA-3′; RRM2: forward 5′-
GTGGAGCGATTTAGCCAAGAA-3′, reverse 5′-CACAAGGCATCGTTTCAATGG-3′;
hENT1: forward 5′-GTGCCTTCGGCTACTTTATCAC-3′, reverse 5′-
GCTAATGAGGTCCAACTTGGTCT-3′; ERCC1: forward 5′-
CTACGCCGAATATGCCATCTC-3′, reverse 5′-GTACGGGATTGCCCCTCTG-3′. mRNA
expression level of indicated genes were normalized to the internal GAPDH expression
via the 2-ΔΔCt method (25).
Whole exome sequencing
Whole-exome sequencing (WES) on the Illumina platform was previously performed for
each bladder cancer PDX model (26), but with new data analysis specific to DNA repair
genes. Details are in Supplemental Information and the the raw sequence data files are
publicly available through the NCBI BioProject database
(https://www.ncbi.nlm.nih.gov/bioproject/) with Accession Number PRJNA352282.
Statistical analysis
All statistical analyses were performed using GraphPad Prism™ software (GraphPad
Software Inc., CA, USA) using 1-way ANOVA with Newman-Keuls multiple comparison
post hoc or a two-tailed Student’s t-test. A p-value below 0.05 was considered
statistically significant. All experiments were carried out at least in triplicate in order to
enable statistically significant comparisons of the results. All results are expressed as
on June 19, 2018. © 2016 American Association for Cancer Research. mct.aacrjournals.org Downloaded from
Author manuscripts have been peer reviewed and accepted for publication but have not yet been edited. Author Manuscript Published OnlineFirst on November 30, 2016; DOI: 10.1158/1535-7163.MCT-16-0381
13
the mean ± SEM unless otherwise noted. A simple correlation of the adduct levels and
response is reported.
on June 19, 2018. © 2016 American Association for Cancer Research. mct.aacrjournals.org Downloaded from
Author manuscripts have been peer reviewed and accepted for publication but have not yet been edited. Author Manuscript Published OnlineFirst on November 30, 2016; DOI: 10.1158/1535-7163.MCT-16-0381

14
Results
Dose formulation and clinical toxicity associated with carboplatin microdosing
A clinical feasibility study (ClinicalTrials.gov identifier NCT01261299) was initiated
with a starting (level 1) dose of [14C]carboplatin of 107 dpm/kg with a total carboplatin
dose of 1% of the therapeutic dose (target AUC of 6). With this dose composition, the
14C-signal in DNA isolated from PBMC was approximately 10-100 times the
background, which allowed accurate adduct measurement by AMS.
A total of 21 patients were accrued, including 14 bladder cancers, 6 non-small
cell lung cancers and one mediastinal mass that was subsequently identified as
Hodgkin’s lymphoma. Of the bladder cancer patients, ten completed the entire study
including microdosing, blood sampling and subsequent full dose chemotherapy. The
patients’ characteristics are shown in SI Table 1. This paper only discusses the bladder
cancer data. No microdose-associated adverse events were observed. Three patients
received an additional dose of [14C]carboplatin at the end of their therapeutic dose
infusion of unlabeled carboplatin in order to compare the therapeutic pharmacokinetics
(PK) and formation of drug-DNA adducts with those of the microdose.
Radiation exposure from the diagnostic microdose was not greater than 0.1 mSv.
In comparison, the annual effective radiation dose equivalent from natural internal
sources is 1.6 mSv per person (27), and exposure for an abdominal CT scan is 10 mSv
(28). Therefore, the diagnostic [14C]carboplatin administered as a microdose appears to
be safe in this patient population.
Linear correlation of carboplatin pharmacokinetics between microdose and
on June 19, 2018. © 2016 American Association for Cancer Research. mct.aacrjournals.org Downloaded from
Author manuscripts have been peer reviewed and accepted for publication but have not yet been edited. Author Manuscript Published OnlineFirst on November 30, 2016; DOI: 10.1158/1535-7163.MCT-16-0381
15
therapeutic dose
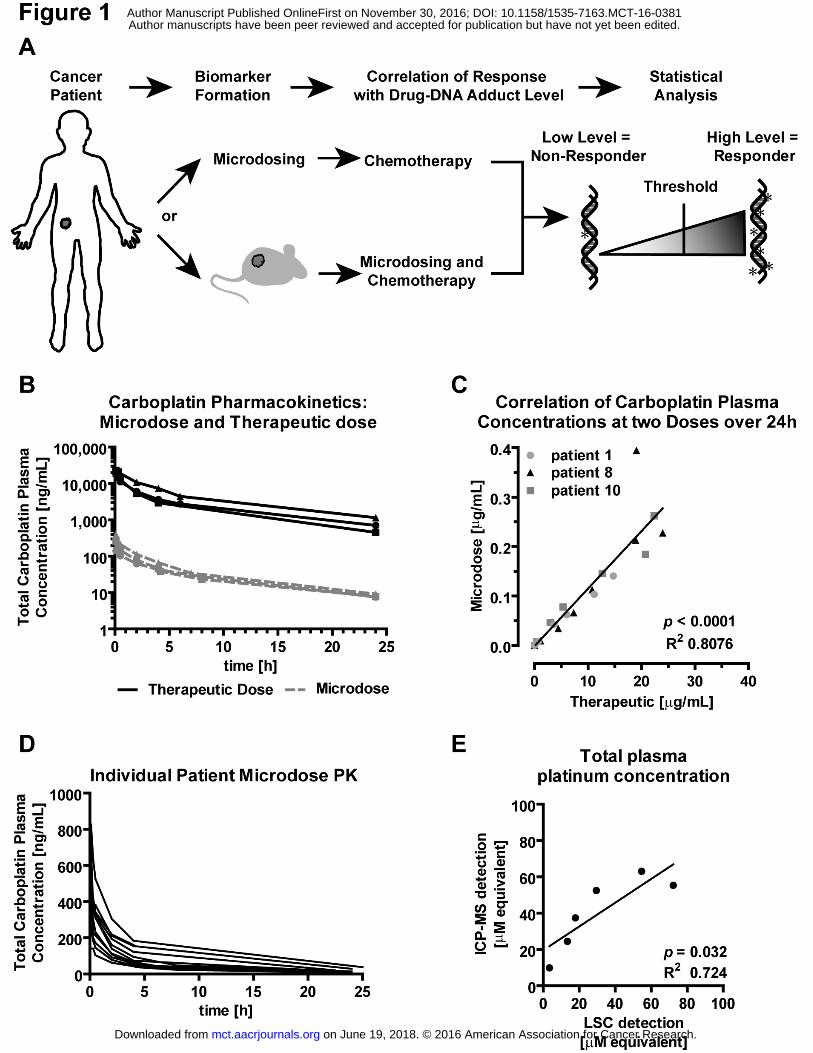
We determined whether the microdose results in a proportionally lower drug
exposure (area under the curve) compared to the therapeutic doses of carboplatin. A
microdose and a full therapeutic dose containing [14C]carboplatin was administered to
three patients, followed by blood sampling over 24 hours and quantitation of plasma 14C
concentration by liquid scintillation counting (LSC) (Figure 1B and SI Table 2). The PK
of the therapeutic and microdoses showed nearly identical elimination kinetics (SI Table
2). The clearance of carboplatin is known to occur in a triphasic manner with an initial
(T1/2α), a second (T1/2β) and a terminal (T1/2γ) phase half-lives reported to be 10 to 98
minutes, 1.3 - 6.0 hours and 8.2 - 125 hours, respectively (29-32). The measured T1/2α
and T1/2β half-lives of 13 - 55 minutes and 4.5 - 8.7 hours, reside well within the range of
these previously reported therapeutic values. At 24 hours after dosing, over 99% of 14C
labeling had been cleared from the blood, suggesting this is the optimal time for biopsy
with little concern of 14C contamination. Comparison of plasma carboplatin equivalent
concentration showed dose proportional linearity between microdoses and a therapeutic
doses (Figure 1C).
Without prior sample fractionation, LSC only measures total 14C concentration of
a given sample without differentiating the parent drug from metabolites. Therefore, the
resulting PK calculations could have been confounded by the circulation of free
[14C]CBDCA. To further validate the approach of determining [14C]carboplatin PK with
LSC, we used inductively coupled plasma mass spectrometry (ICP-MS) to determine
the platinum concentration in specimens from one patient. At the therapeutic dose a
significant linear correlation was observed between ICP-MS measurements and LSC
on June 19, 2018. © 2016 American Association for Cancer Research. mct.aacrjournals.org Downloaded from
Author manuscripts have been peer reviewed and accepted for publication but have not yet been edited. Author Manuscript Published OnlineFirst on November 30, 2016; DOI: 10.1158/1535-7163.MCT-16-0381
16
measurements (R2 = 0.724, p = 0.032, Figure 1E). However, ICP-MS was not able to
detect platinum in the microdosing specimens, which supports the utility of AMS for
diagnostic microdosing applications.
Correlation of microdose-induced [14C]carboplatin-DNA monoadducts in PBMC
with tumor response to subsequent full dose chemotherapy
At 24 hours after intravenous microdosing, PBMC were isolated from patient
blood samples followed by DNA purification. Radiocarbon content in the DNA was
measured by AMS according to published protocols (24). The concentration of
carboplatin-DNA monoadducts was then calculated in units of monoadducts per 108
nucleotides (Figure 2). Patients received platinum-based chemotherapy within four
weeks after the microdosing procedure (typically GC or MVAC). Response was
confirmed if a patient had pT1 or less tumor (partial response: PR, complete response:
CR) at the time of cystectomy; or resistance if a patient still had pT2 or greater (disease
progression: DP), based on standard RECIST criteria (33).
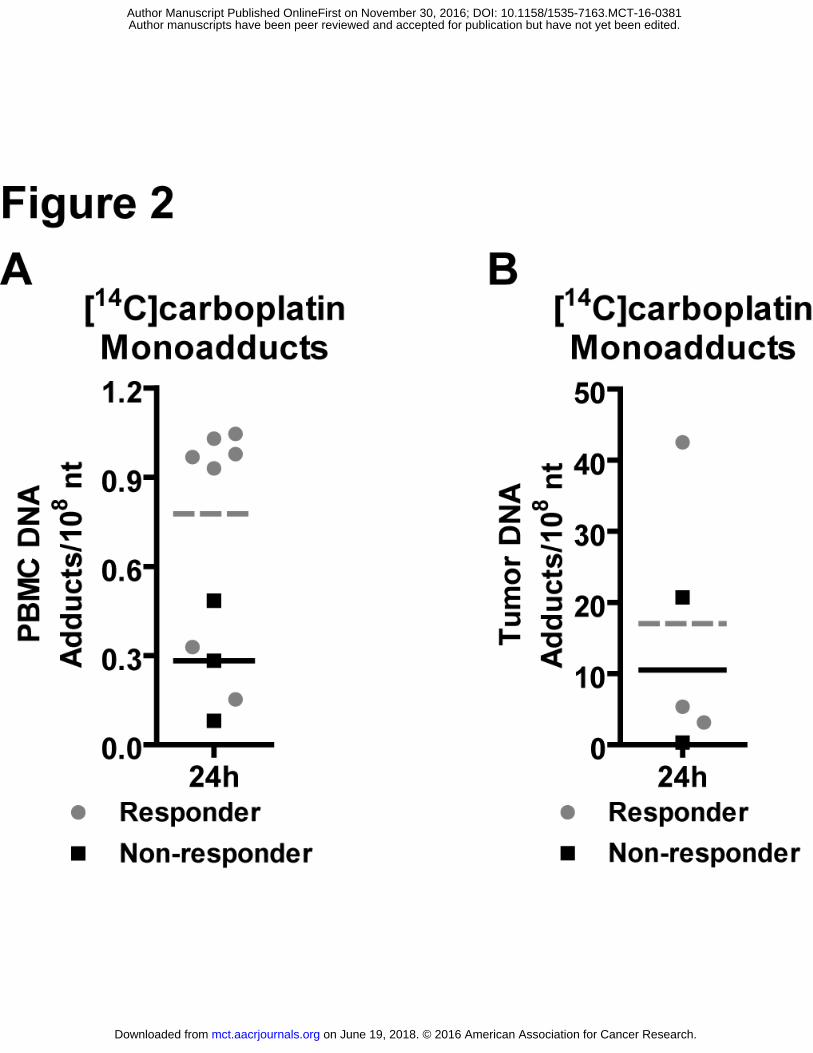
Seven patients responded to chemotherapy (grey circular symbols) whereas
three patients showed disease progression (black square symbols) (Figure 2A and SI
Table 2). Three patients did not receive subsequent chemotherapy: one with renal
failure, and the other two with a clinical diagnosis of T2 disease because of large tumor
mass, but were diagnosed with T1 disease at the biopsy during chemotherapy.
Responders exhibited approximately 2-fold higher mean PBMC monoadduct levels
(grey dashed line) than non-responders (black solid line) (0.741 ± 0.346 versus 0.283 ±
0.202 monoadducts/108 nt, respectively, p = 0.069). There were two distinct groups; one
on June 19, 2018. © 2016 American Association for Cancer Research. mct.aacrjournals.org Downloaded from
Author manuscripts have been peer reviewed and accepted for publication but have not yet been edited. Author Manuscript Published OnlineFirst on November 30, 2016; DOI: 10.1158/1535-7163.MCT-16-0381
17
with high (0.941 ± 0.030 adducts per 108 nt) and the second group with low (0.266 ±
0.158 adducts per 108 nt) DNA adduct levels (p < 0.0001). All five patients in the high
adduct level group responded to chemotherapy. The low adduct level group included
three non-responders and two responders. Tumor adduct levels were measured for five
patients. One with a very high carboplatin-DNA adduct levels responded, whereas the
other tumor samples exhibited no obvious trends (Figure 2B).
Response of patient-derived bladder tumor xenografts (PDX) in mice to
chemotherapy
Since two patients with low PBMC adduct levels also responded to
chemotherapy, we hypothesized that tumor response in those patients with low
carboplatin-DNA adducts was induced by the other components of the treatment
regimen. We developed a diagnostic microdosing protocol to identify resistance to
gemcitabine for use in a mouse model of human bladder cancer. We established four
patient-derived tumor xenograft (PDX) mouse models from randomly selected
myoinvasive bladder cancer patient volunteers using previously described protocols for
nod scid gamma severe combined immune deficient (NSG) mice (26). These models
were named BL0269 (TM00015), BL0293 (TM00016), BL0440 (TM00024) and BL0645
(TM01339), where the BL number is the UC Davis Comprehensive Cancer Center
Biorepository number
(http://www.ucdmc.ucdavis.edu/cancer/research/sharedresources/specimen.html) and
the TM number is the Jackson Laboratory PDX database identifier
(http://tumor.informatics.jax.org/mtbwi/pdxSearch.do). Retrospective analysis of routine
on June 19, 2018. © 2016 American Association for Cancer Research. mct.aacrjournals.org Downloaded from
Author manuscripts have been peer reviewed and accepted for publication but have not yet been edited. Author Manuscript Published OnlineFirst on November 30, 2016; DOI: 10.1158/1535-7163.MCT-16-0381
18
quality control IHC staining showed one model, BL0645, as being CD45+, which
indicates that this tumor formed a lymphocytic tumor. Formation of lymphocytic tumors
from subcutaneous implantation of tumor tissue has been previously reported for PDX
(34). However, we initiated this work under the assumption that the xenograft
represented a tumor of origin from the bladder. The xenograft was a solid tumor with
vasculature and in some regions necrosis, consistent with the other bladder tumors
used in this study. Regardless of the potential molecular differences in origin, BL0645
was useful for this study as a model of synergy between cisplatin or carboplatin and
gemcitabine. We included data from this model because it is not necessary for the
tumor to be rigorously proven to be bladder derived in order to demonstrate correlations
between drug-DNA adduct levels and treatment response.
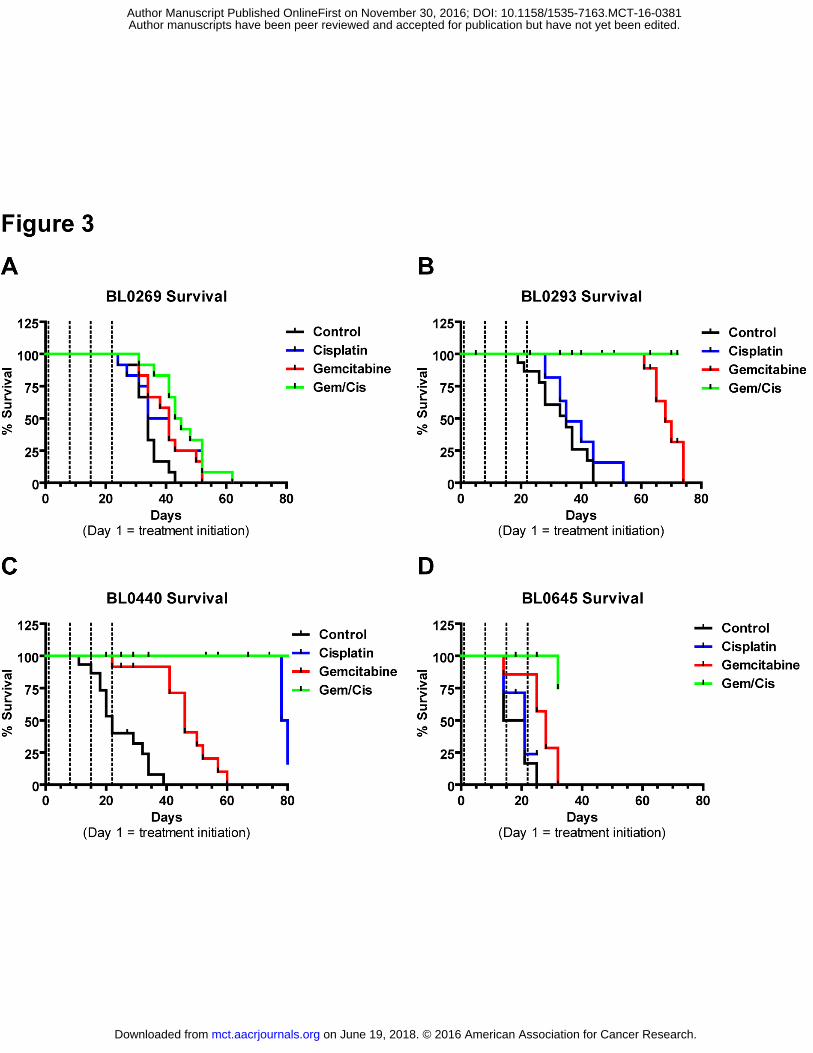
We assessed the sensitivity of each PDX to cisplatin, carboplatin, or gemcitabine
as single agent, as well as to GC combination chemotherapy (Figure 3 and SI Figure 3).
Sensitivity was determined by changes in tumor volume over time (SI Figure 3), and by
tumor-specific survival analysis (Figure 3). Of the four distinct tumor models, BL0269,
BL0293, BL0645 were resistant to cisplatin/carboplatin chemotherapy. BL0269 and
BL0645 were resistant to gemcitabine. We demonstrated that cisplatin shows similar
response efficacy to carboplatin in the mouse models (SI Figure 3). Median survival of
the carboplatin treatment groups is similar to the corresponding cisplatin treatment
groups; for BL0269, BL0293, and BL0440 median survival was 39, 28, and 64 days,
respectively, compared to cisplatin median survival of 38, 35, and 80 days post
treatment initiation (SI Table 3).
on June 19, 2018. © 2016 American Association for Cancer Research. mct.aacrjournals.org Downloaded from
Author manuscripts have been peer reviewed and accepted for publication but have not yet been edited. Author Manuscript Published OnlineFirst on November 30, 2016; DOI: 10.1158/1535-7163.MCT-16-0381
19
Correlation of microdose-induced [14C]carboplatin and [14C]gemcitabine DNA-
adduct levels with PDX drug sensitivity
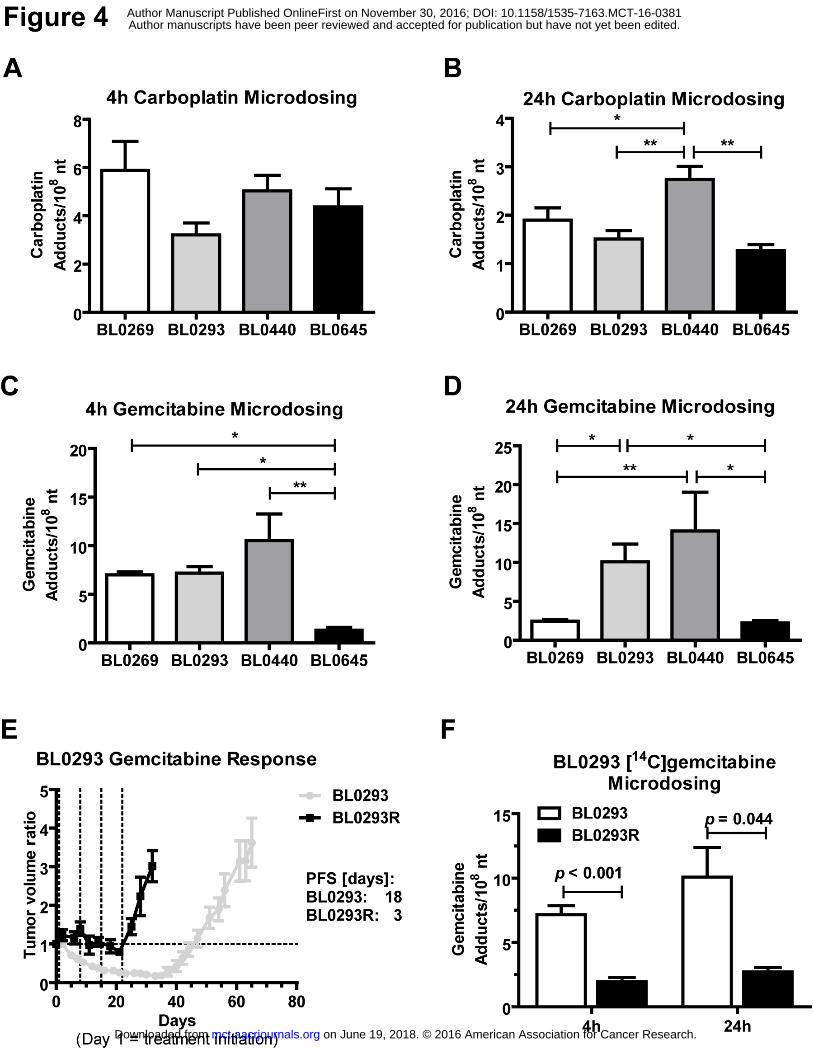
NSG mice bearing indicated PDX were given a microdose of [14C]carboplatin
(0.375 mg/kg of body weight, Figure 4A+B) or [14C]gemcitabine (0.092 mg/kg of body
weight, Figure 4C+D). Each microdose was chosen to target approximately 1% of the
human plasma maximum concentration of 1 µM for carboplatin and 0.3 µM for
gemcitabine. Animals were sacrificed at 4h (Figure 4A+C) and 24h (Figure 4B+D) after
microdose bolus IV injection and drug-DNA adduct levels were determined from purified
tumor tissue DNA by AMS. Carboplatin- and gemcitabine DNA-adduct levels correlated
with PDX drug sensitivity to single agent treatment in NSG mice (Figure 3+4 and SI
Figure 3). The carboplatin and gemcitabine sensitive tumor BL0440 showed significant
higher mean carboplatin monoadduct levels compared to the other resistant models. At
24 hours, BL0440 tumor DNA exhibited 1.5 to 2.2 fold higher mean monoadduct levels
than BL0269, BL0293 and BL0645 (2.73 ± 0.66 versus 1.90 ± 0.80 (p < 0.05),
1.51 ± 0.55 (p < 0.01), and 1.27 ± 0.31 (p < 0.01) monoadducts/108 nt, respectively)
(Figure 4B). There was no significant difference in carboplatin adduct levels between
the three resistant PDX models.
Similarly, at 24h the two gemcitabine sensitive BL0293 and BL0440 PDX models
display 4.1 to 6.3 fold higher gemcitabine adduct levels than the resistant PDX models
BL0269 and BL0645 (10.1 ± 6.47 versus 2.44 ± 0.49 (p < 0.05) and 2.24 ± 0.81
(p < 0.05) and 14.1 ± 11.1 versus 2.44 ± 0.49 (p < 0.01) and 2.24 ± 0.81 (p < 0.05)
adducts/108 nt, respectively). There is no significant difference in gemcitabine-DNA
adduct levels between the two resistant PDX models. Compared to 4h, at 24h the
on June 19, 2018. © 2016 American Association for Cancer Research. mct.aacrjournals.org Downloaded from
Author manuscripts have been peer reviewed and accepted for publication but have not yet been edited. Author Manuscript Published OnlineFirst on November 30, 2016; DOI: 10.1158/1535-7163.MCT-16-0381
20
sensitive PDX models showed a slight increase adduct levels; whereas the resistant
model BL0269 showed a significant decrease in adduct frequency and BL0645 showed
relatively low levels of gemcitabine-DNA adduct formation (Figure 4C+D).
We also generated a gemcitabine-resistant PDX sub-line (BL0293R) through
repeated treatment of mice carrying BL0293 tumors with therapeutic doses of
gemcitabine. After 4 treatment cycles, relapsed tumors were reimplanted into NSG mice
and treatment was resumed for an additional 4 cycles. The combined 8 cycles of full
dose gemcitabine chemotherapy resulted in BL0293R tumors that did not respond to
gemcitabine treatment (Figure 4E). Progression free survival after chemotherapy
decreased from 16.9 ± 1.0 days for BL0293 to 2.3 ± 0.7 days for BL0293R (p < 0.0001).
A 2.5 fold decrease in gemcitabine adduct formation at 4h and 24h was detected in
BL0293R compared to the parental model BL0293 (2.89 ± 1.22 versus 7.17 ± 1.97
(p < 0.001) at 4 hours, and 4.02 ± 1.23 versus 10.1 ± 6.47 (p = 0.044) adducts/108 nt at
24 hours, Figure 4F).
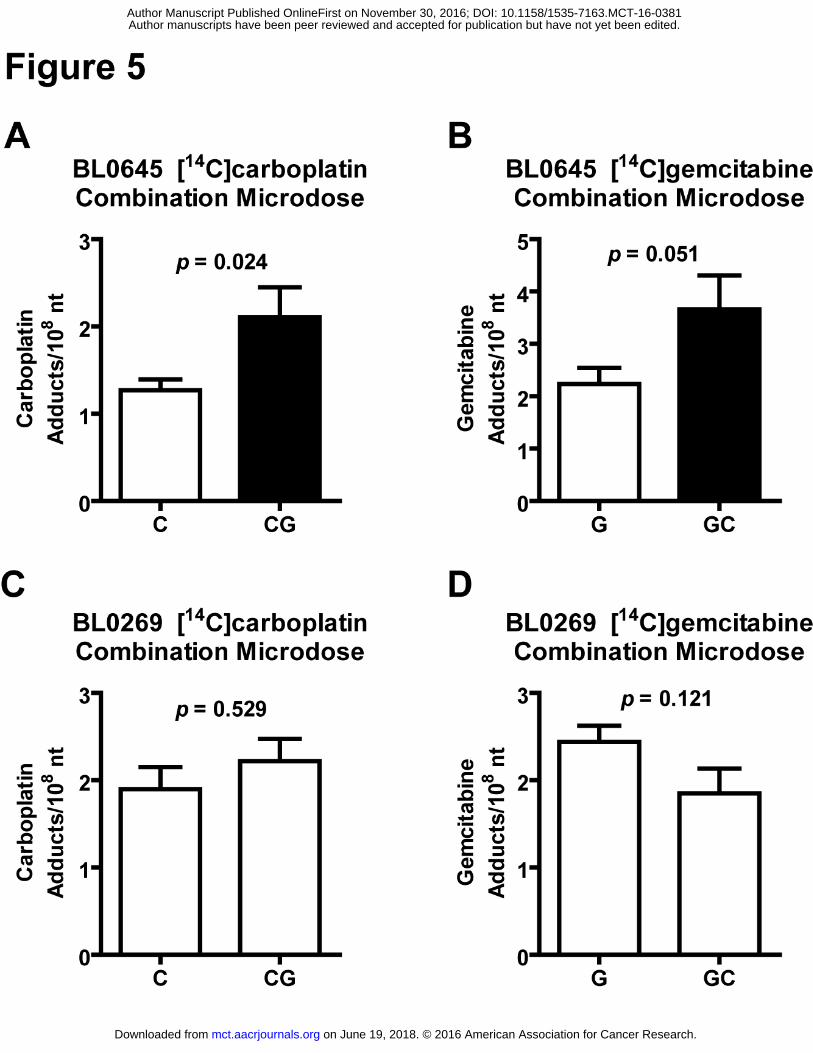
Synergistic GC combination chemotherapy enhanced of drug-DNA adduct levels
in BL0645
We analyzed the effect of combination GC chemotherapy on drug-DNA adduct
formation using BL0645 (Figure 5). This model was resistant towards each of the single
agents, cisplatin and gemcitabine, but had strongly enhanced sensitivity toward
gemcitabine/cisplatin (Gem/Cis) combination therapy, consistent with a synergistic
effect (SI Figure 3G). BL0645 tumor bearing mice were administered a microdose of
[14C]carboplatin alone (white bar) or a microdose of [14C]carboplatin in combination with
on June 19, 2018. © 2016 American Association for Cancer Research. mct.aacrjournals.org Downloaded from
Author manuscripts have been peer reviewed and accepted for publication but have not yet been edited. Author Manuscript Published OnlineFirst on November 30, 2016; DOI: 10.1158/1535-7163.MCT-16-0381
21
a microdose of unlabeled gemcitabine (black bar). The combination of [14C]carboplatin
plus unlabeled gemcitabine resulted in a significant 1.7-fold increase in carboplatin-DNA
monoadduct levels (1.27 ± 0.31 versus 2.10 ± 0.60 adducts/108 nt, p = 0.024) when
compared to a microdose with single agent [14C]carboplatin (Figure 5A). Similarly,
BL0645 bearing mice receiving a microdose of [14C]gemcitabine in combination with a
microdose of unlabeled carboplatin (white bar) showed a 1.6 fold increase in
gemcitabine adduct levels (2.24 ± 0.81 versus 3.66 ± 1.13 adducts/108 nt, p = 0.051)
compared to [14C]gemcitabine alone (black bar, Figure 5B). In contrast, BL0269, which
is resistant to both single agents and combination therapy (Figure 3A), showed no
significant increase in adduct formation upon combination treatment (Figure 5C+D)
(1.90 ± 0.80 carboplatin adducts/108 nt for the combination versus 2.22 ± 0.44
carboplatin adducts/108 nt (p = 0.529) in the single agent carboplatin group, and
2.44 ± 0.49 gemcitabine adducts/108 nt for the combination versus 1.85 ± 0.49
gemcitabine adducts/108 nt (p = 0.121) for the gemcitabine group). Clearly, these
observations of combination-induced increases in adduct levels the BL0645 line are
consistent with the synergistic antitumor activity of the combination therapy for this
tumor.
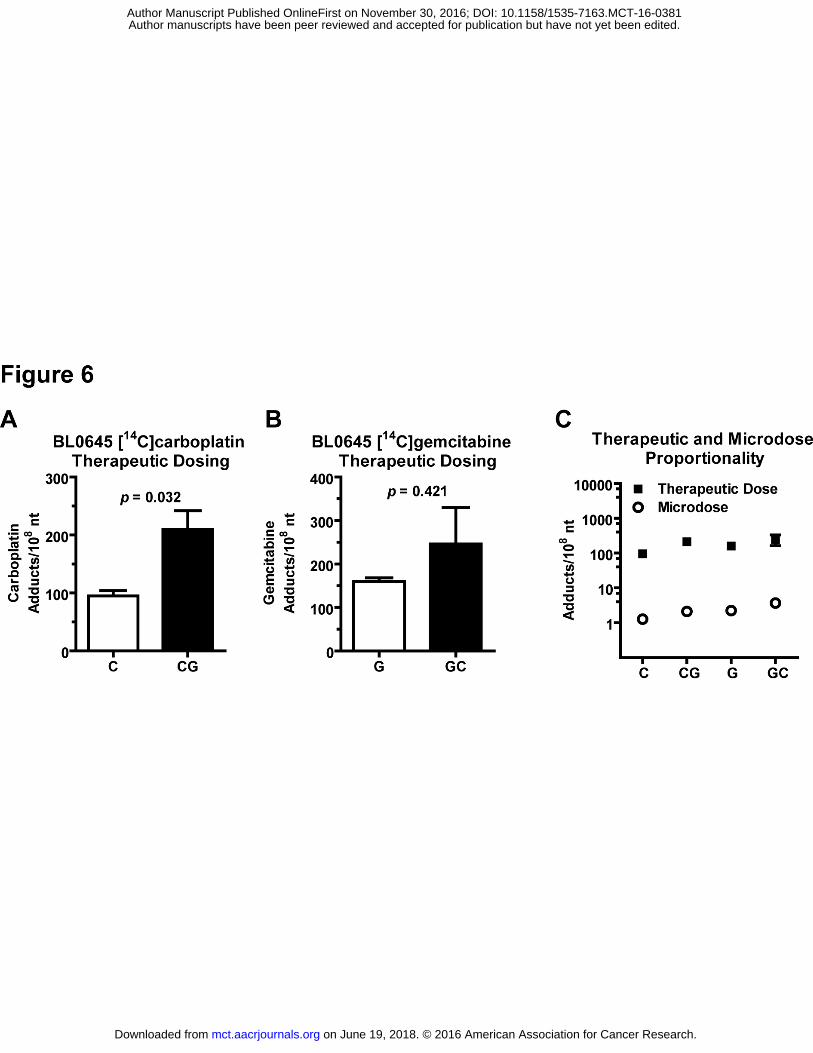
Similar evidence of synergy was obtained in BL0645 tumors treated with
therapeutic levels of [14C]carboplatin or [14C]gemcitabine (Figure 6). A therapeutic dose
of the combination [14C]carboplatin plus unlabeled gemcitabine lead to a significant
increase in adduct levels (94.8 ± 16.0 versus 209.6 ± 64.7 monoadducts/108 nt, p =
0.032) compared to treatment with a therapeutic dose of [14C]carboplatin alone (Figure
6A). Likewise, combination treatment of therapeutic doses of [14C]gemcitabine with
on June 19, 2018. © 2016 American Association for Cancer Research. mct.aacrjournals.org Downloaded from
Author manuscripts have been peer reviewed and accepted for publication but have not yet been edited. Author Manuscript Published OnlineFirst on November 30, 2016; DOI: 10.1158/1535-7163.MCT-16-0381
22
unlabeled carboplatin increases gemcitabine adduct levels (169.2 ± 9.1 versus 268.1 ±
182.8 adducts/108 nt, p = 0.421) compared to [14C]gemcitabine alone (Figure 6B),
although this was not a significant difference. There was an approximately 100-fold
difference in drug-DNA adduct formation when a 100-fold difference in drug
concentration was administered for either drug (Figure 6C).
Poor correlation of expression of selected genes with PDX drug sensitivity
toward carboplatin and gemcitabine
We next correlated response to the expression of a selected panel of genes that
are known to be involved in GC drug resistance including human equilibrative
nucleoside transporter-1 (hENT1), ribonucleotide reductase (RNR, encoded by the
RRM1 and RRM2 genes), and DNA repair protein, excision repair cross complementing
group 1 (ERCC1). Increased expressions of these markers were previously reported to
be involved in acquired resistance to gemcitabine and platinum-based chemotherapy in
some cancers but not in others (35). We did not find any correlation of the expression of
these genes with resistance. RT-PCR analysis of gemcitabine resistance marker RRM1
and RRM2 showed decreased mRNA expression in the gemcitabine sensitive model
BL0293, and elevated levels in another gemcitabine sensitive model BL0440 (SI Figure
4A+B, SI Table 4). hENT1 expression was the highest in the sensitive model BL0440
and is lowest in the resistant model BL0269 (SI Figure 4C). ERCC1 is involved in DNA
repair process and increased expression is reported to be associated with resistance to
platinum based therapy (36). However, RT-PCR data shows that ERCC1 expression is
highest in the carboplatin sensitive tumor model BL0440 compared to the resistant
on June 19, 2018. © 2016 American Association for Cancer Research. mct.aacrjournals.org Downloaded from
Author manuscripts have been peer reviewed and accepted for publication but have not yet been edited. Author Manuscript Published OnlineFirst on November 30, 2016; DOI: 10.1158/1535-7163.MCT-16-0381
23
tumors BL0269, BL0293 and BL0645 (SI Figure 4D).
Analysis of Mutations in DNA Repair Genes in Bladder Cancer PDX Models
We investigated the mutation status of genes associated with DNA repair in each
of the PDX models (BL0269, BL0293, BL0440, and BL0645). Targeted sequencing data
(whole-exome or JAX Cancer Treatment Profile) for each of the PDX (26) were filtered
for 184 known DNA repair genes, including those found to correlate with response to
neoadjuvant chemotherapy (NAC), such as ATM, FANCC, RB1, BRCA1, BRCA2,
ERCC1, ERCC2, and RAD51C (SI Table 5 and SI Table 6) (3, 36-39). A total of 112
somatic variants were identified in the four PDX models (SI Table 7). Each PDX tumor
harbored two or more mutations in genes associated with sensitivity to cisplatin that are
predicted to have moderate or high functional impact, including ATM/FANCC/RB1 (3)
ERCC1/2 (36, 38), and homologous recombination deficiency (HRD) (39). While each
PDX theoretically possesses one or more molecular determinant(s) of cisplatin
sensitivity, it is notable that BL0440 exhibited the highest sensitivity and harbors the
highest number of mutations (n=4), and in genes from 3 different prediction categories,
in addition to a TP53 mutation. In contrast, BL0645 contained 3 mutations in BRCA1/2,
which were within a single category (HRD), and displayed marked resistance to
cisplatin.
on June 19, 2018. © 2016 American Association for Cancer Research. mct.aacrjournals.org Downloaded from
Author manuscripts have been peer reviewed and accepted for publication but have not yet been edited. Author Manuscript Published OnlineFirst on November 30, 2016; DOI: 10.1158/1535-7163.MCT-16-0381
24
Discussion
The main goal of the ongoing clinical study is to correlate carboplatin-DNA adducts to
therapy response in patients. For the PDX mouse models with urothelial bladder
carcinomas, we expanded on this theme to include gemcitabine incorporation into DNA.
This work has provided novel insights into the biology of in vivo cellular responses to
platinum-based treatment and delineates potential opportunities for personalized
therapeutic intervention. Treatment for muscle-invasive bladder cancer has not
advanced beyond platinum-based combination chemotherapy and surgery in the past
30 years (40). Standard of care guidelines recommend inclusion of platinum-based
NAC, but this option is used in less than 20% of patients for a variety of reasons,
including concerns over lack of response to the treatment. Therefore, the ability to
predict response to platinum-based chemotherapy would be highly impactful.
Positive correlations between therapy-induced levels of platinum-based drug-
DNA adducts in PBMC or other surrogate tissues, and good clinical outcome have been
reported in literature for a variety of different solid tumors (7-11, 41). We evaluated the
feasibility of a phenotypic approach to predicting response to platinum-based
chemotherapy in bladder cancer patients by using diagnostic microdosing and AMS
analysis of DNA isolated from PBMC and biopsy samples. The linear correlation
between carboplatin-DNA adduct levels induced by microdose and therapeutic dose
exposures is consistent with our previous cell culture studies (23). The linearity of the
pharmacokinetics between these two drug doses (Fig 1C) can be explained by the fact
that carboplatin is an alkylating agent that directly reacts with DNA without the need for
metabolic activation or transformation (19). The PBMC carboplatin-DNA adduct data
on June 19, 2018. © 2016 American Association for Cancer Research. mct.aacrjournals.org Downloaded from
Author manuscripts have been peer reviewed and accepted for publication but have not yet been edited. Author Manuscript Published OnlineFirst on November 30, 2016; DOI: 10.1158/1535-7163.MCT-16-0381
25
were distributed into two clusters: those patients with adduct levels above
0.7 monoadducts/108 nt all responded to subsequent platinum based therapy; and
those patients with lower levels of adducts were a mixture of responders and non-
responders. With this cutoff there was a clear highly significant difference (p < 0.0001)
between high and low adduct level groups of patients (Figure 2A). The ability to
differentiate between responders and non-responders using the mean carboplatin-DNA
adduct levels for each patient group has yet to reach statistical significance (p = 0.069).
However, considering the small number of patients in the study so far, these statistics
support the feasibility of diagnostic microdosing for bladder cancer. Ultimately, we
envision using carboplatin-DNA adduct levels to predict response in patients by
establishing one or more biomarker cutoff levels in a larger clinical study. These cutoff
levels will then be used to define positive and negative predictive values for a diagnostic
test.
We also showed evidence that killing of PDX bladder cancer cells in mice by
gemcitabine and cisplatin/carboplatin requires a threshold level of drug-DNA damage
from one or both drugs combined, and that microdose-induced drug-DNA adduct levels
are predictive of whether cells can achieve that threshold during full dose therapy. One
PDX was rendered resistant to gemcitabine by repeated therapeutic dosing. This tumor
model of acquired resistance had microdose-induced gemcitabine-DNA adducts that
were apparently below the threshold for this drug. Together, these data indicate that the
diagnostic microdosing approach can be used as a phenotype-based predictive test for
chemotherapy response.
The literature covering platinum-DNA damage and DNA repair capacity arguably
on June 19, 2018. © 2016 American Association for Cancer Research. mct.aacrjournals.org Downloaded from
Author manuscripts have been peer reviewed and accepted for publication but have not yet been edited. Author Manuscript Published OnlineFirst on November 30, 2016; DOI: 10.1158/1535-7163.MCT-16-0381
26
supports the feasibility of PBMC as a surrogate tissue for predicting tumor response to
chemotherapy. In one study, platinum-DNA adduct formation in PBMCs was found to be
more predictive for tumor response to platinum-based therapy than previous platinum-
based therapy, stage of disease, histological type and tumor grading (42). A significantly
better disease-free survival was reported for cisplatin-treated head and neck carcinoma
patients with higher adduct levels (9). However, not all investigators found a relationship
between surrogate tissue adduct levels and tumor response (43, 44). In spite of several
clinical investigations, the utility of platinum-DNA adducts as predictive biomarkers
remains unresolved due to a lack of large studies with a common design with good
measurement sensitivity and precision.
Another approach has focused on correlating DNA repair capacity of PBMCs to
clinical outcomes. In a large clinical study, Wang et al measured DNA repair capacity in
cultured peripheral T-lymphocytes from 591 NSCLC patients that were treated with
platinum-based chemotherapy (45). They found a statistically significant overall inverse
correlation between DNA repair capacity and survival, especially in early stage tumors.
In another study, the ratio of γH2AX, an indicator of DNA double-strand breaks, and the
DNA repair protein MRE11 in PBMC significantly correlated to cisplatin and PARP
inhibitor therapy response in 15 ovarian cancer patients (46). These reports are
consistent with our 24 hour PBMC data, which is enough time for DNA repair to
modulate the adduct levels.
The clinical microdosing study was performed with one chemotherapeutic drug,
but patients were treated with combination chemotherapy. One potential pitfall is that
chemoresistance to one drug may be compensated for by the partner drug in the
on June 19, 2018. © 2016 American Association for Cancer Research. mct.aacrjournals.org Downloaded from
Author manuscripts have been peer reviewed and accepted for publication but have not yet been edited. Author Manuscript Published OnlineFirst on November 30, 2016; DOI: 10.1158/1535-7163.MCT-16-0381
27
combination therapy. This phenomenon potentially explains the results for two of our
responsive patients who had low microdose-induced carboplatin-DNA adducts. To
address this issue, we used gemcitabine microdosing in PDX bearing mice, which has
only previously been reported in cell culture (47). Our study indeed showed that the
levels of gemcitabine incorporated into DNA correlated with the response of PDXs to
chemotherapy.
Another important finding of this study is that high levels of drug-DNA adducts
from either component of a two drug combination is sufficient to inhibit tumor growth.
This observation supports the hypothesis that a threshold level of drug-DNA damage
from one or both drugs is required to achieve a response to therapy. In bladder cancer,
the first-line chemotherapy is usually GC (gemcitabine and cisplatin/carboplatin) or
MVAC (methotrexate, vinblastine doxorobucin/Adriamycin and cisplatin). Many
physicians assume that all of the drug components in these regimens contribute to
efficacy. In contrast to this assumption, even in a limited set of PDXs, some tumors
responded to only one of the drugs, whereas only one model needed both drugs
synergistically in order to respond. Clearly, the diagnostic microdosing approach can
dissect the influence of individual combination chemotherapy components for drugs that
interact with DNA. This capability may be clinically useful considering the heterogeneity
of tumor response to a given drug combination.
We undertook a molecular analysis in four PDX tumor models of a few of the
major mechanistic pathways involved in platinum-based and gemcitabine drug
resistance. For example, the upregulation of ERCC1 expression has been reported to
correlate significantly with cisplatin resistance for some cancers (36, 48, 49). Despite
on June 19, 2018. © 2016 American Association for Cancer Research. mct.aacrjournals.org Downloaded from
Author manuscripts have been peer reviewed and accepted for publication but have not yet been edited. Author Manuscript Published OnlineFirst on November 30, 2016; DOI: 10.1158/1535-7163.MCT-16-0381
28
this, ERCC1 has been shown to have unacceptable sensitivity and specificity as a
biomarker and has thus failed to gain wide-spread acceptance as standard of care for
therapeutic guidance. In this study, we saw no correlation between expression level of
ERCC1 and PDX tumor response toward chemotherapy (Figure 3, SI Figures 3 and 4).
Gemcitabine kills cells mainly through its incorporation into DNA and termination of DNA
replication (50). Several mechanisms have been implicated in mediating gemcitabine
resistance, including loss of membrane import transporters, downregulation of dCK,
increased formation of inactive metabolites (dFdU), upregulation of RNR or downstream
inhibition of caspase executioners that control apoptosis signaling (51, 52). Interestingly,
DNA repair is not associated with cellular response to gemcitabine-DNA adducts (53),
even though the in vitro cytotoxicity directly correlates with the level of drug
incorporation into DNA (50, 54). Analysis of three genes commonly found to be
implicated in resistance toward gemcitabine based chemotherapy (RRM1, RRM2 and
hENT1) showed no correlation between expression level and PDX tumor response
toward chemotherapy (Figure 3, SI Figures 3 and 4). Interestingly, somatic mutations in
DNA repair genes including RB1, FANCC, ATM and others did not obviously confer
sensitivity to cisplatin, carboplatin or gemcitabine. These preliminary findings highlight
the difficulty of finding generally applicable markers of chemotherapy resistance.
In our study, we measured drug-DNA adduct levels from PBMC and tumor
samples as putative predictive biomarkers of therapy response. The formation and
DNA repair of these adducts are governed by a myriad of factors including but not
limited to hundreds of genes, gene-gene interactions, proteins, stroma, drug PK, organ
function and even overall patient health. Therefore, drug-DNA adduct levels as
on June 19, 2018. © 2016 American Association for Cancer Research. mct.aacrjournals.org Downloaded from
Author manuscripts have been peer reviewed and accepted for publication but have not yet been edited. Author Manuscript Published OnlineFirst on November 30, 2016; DOI: 10.1158/1535-7163.MCT-16-0381
29
pharmacodynamic endpoints are potentially more comprehensive and useful than
genomic analysis of limited sets of markers for predicting drug response, at least for
some drugs. We previously showed that platinum-DNA adduct levels and
chemoresistance in isogenic cell cultures can be modulated by ERCC1 and RRM1
mRNA levels (23). Here we extended this analysis to include a limited number of
bladder cancer PDX which showed no correlation of these genomic markers with
therapeutic outcome.
The diagnostic microdosing approach is a platform technology. Even though this
study focused on bladder cancer, the strategy can be applied to many other cancer and
drug types as long as the target-drug complex can be measured by AMS. For example,
our ongoing trial is also accruing non-small cell lung cancer patients. In addition, we
have another trial with [14C]oxaliplatin in colorectal cancer (clincaltrials.gov identifier#:
NCT02569723).
Human PK (AUC) and drug-DNA adduct formation of [14C]carboplatin in
PBMC are dose proportional between a microdose and a therapeutic dose. Dose
proportionality of drug-DNA adduct formation was also observed in the PDX mouse
model. Microdose-induced drug-DNA adduct levels correlated with tumor response in
the PDX model (inhibition of tumor growth and survival) and bladder cancer patients
(tumor response). This applies to the use of [14C]carboplatin for prediction of cisplatin
and carboplatin response, and also applies to the use of [14C]gemcitabine diagnostic
microdosing to predict response to the nucleotide analogue gemcitabine (in mice).
Consistent with our previous findings in cell culture, high levels of in vivo microdose-
induced drug-DNA adduct levels correlated with tumor response.
on June 19, 2018. © 2016 American Association for Cancer Research. mct.aacrjournals.org Downloaded from
Author manuscripts have been peer reviewed and accepted for publication but have not yet been edited. Author Manuscript Published OnlineFirst on November 30, 2016; DOI: 10.1158/1535-7163.MCT-16-0381
30
Acknowledgments
The authors are grateful to Ryan R. Davis (UCDCCC Genomics Shared Resource,
Department of Pathology and Laboratory Medicine) for his expert technical assistance
for the analysis of the WES data. The results here are also based in part upon data
generated by the TCGA Research Network: http://cancergenome.nih.gov/. We are
grateful to all of the patients and families who contributed to this study, as well as to
Susan and Gerry Knapp for their financial support.
on June 19, 2018. © 2016 American Association for Cancer Research. mct.aacrjournals.org Downloaded from
Author manuscripts have been peer reviewed and accepted for publication but have not yet been edited. Author Manuscript Published OnlineFirst on November 30, 2016; DOI: 10.1158/1535-7163.MCT-16-0381
31
References
1. Chen T. Overcoming drug resistance by regulating nuclear receptors. Adv Drug Delivery Rev 2010;62: 1257-64. 2. Kelland L. The resurgence of platinum-based cancer chemotherapy. Nat Rev Cancer 2007;7:573-84. 3. Plimack ER, Dunbrack RL, Brennan TA, Andrake MD, Zhou Y, Serebriiskii IG, et al. Defects in DNA Repair Genes Predict Response to Neoadjuvant Cisplatin-based Chemotherapy in Muscle-invasive Bladder Cancer Eur Urol 2015;68:959-67. 4. McConkey DJ, Choi W, Shen Y, Lee IL, Porten S, Matin SF, et al. A Prognostic Gene Expression Signature in the Molecular Classification of Chemotherapy-naïve Urothelial Cancer is Predictive of Clinical Outcomes from Neoadjuvant Chemotherapy: A Phase 2 Trial of Dose-dense Methotrexate, Vinblastine, Doxorubicin, and Cisplatin with Bevacizumab in Urothelial Cancer. Eur Urol 2016;69:855-62. 5. Shen D-W, Pouliot LM, Hall MD, Gottesman MM. Cisplatin Resistance: A Cellular Self-Defense Mechanism Resulting from Multiple Epigenetic and Genetic Changes. Pharmacol Rev 2012;64:706-21. 6. Ho GY, Woodward N, Coward JIG. Cisplatin versus carboplatin: comparative review of therapeutic management in solid malignancies. Crit Rev Oncol Hematol 2016;102:37-46. 7. Reed E, Parker RJ, Gill I, Bicher A, Dabholkar M, Vionnet JA, et al. Platinum-DNA Adduct in Leukocyte DNA of a Cohort of 49 Patients with 24 Different Types of Malignancies. Cancer Res 1993;53:3694-9. 8. Schellens JH, Ma J, Planting AS, van der Burg ME, van Meerten E, de Boer-Dennert M, et al. Relationship between the exposure to cisplatin, DNA-adduct formation in leucocytes and tumour response in patients with solid tumours. Br J Cancer 1996;73:1569-75. 9. Hoebers FJP, Pluim D, Verheij M, Balm AJM, Bartelink H, Schellens JHM, et al. Prediction of treatment outcome by cisplatin-DNA adduct formation in patients with stage III/IV head and neck squamous cell carcinoma, treated by concurrent cisplatin-radiation (RADPLAT). Int J Cancer 2006;119:750-6. 10. Pieck AC, Drescher A, Wiesmann KG, Messerschmidt J, Weber G, Strumberg D, et al. Oxaliplatin-DNA adduct formation in white blood cells of cancer patients. Br J Cancer 2008;98:1959-65. 11. Kim ES, Lee JJ, He G, Chow C-W, Fujimoto J, Kalhor N, et al. Tissue Platinum Concentration and Tumor Response in Non–Small-Cell Lung Cancer. J Clin Oncol 2012;30:3345-52. 12. Wang S, Zhang H, Scharadin TM, Zimmermann M, Hu B, Pan AW, et al. Molecular Dissection of Induced Platinum Resistance through Functional and Gene Expression Analysis in a Cell Culture Model of Bladder Cancer. PloS One 2016;11:e0146256. 13. Wheate NJ, Walker S, Craig GE, Oun R. The status of platinum anticancer drugs in the clinic and in clinical trials. Dalton Trans 2010;39:8113-27. 14. Cimino GD, Pan CX, Henderson PT. Personalized medicine for targeted and platinum-based chemotherapy of lung and bladder cancer. Bioanalysis 2013;5:369-91. 15. Hah SS, Stivers KM, de Vere White RW, Henderson PT. Kinetics of carboplatin-DNA binding in genomic DNA and bladder cancer cells as determined by accelerator mass spectrometry. Chem Res Toxicol 2006;19:622-6. 16. Mauthe RJ, Dingley KH, Leveson SH, Freeman SPHT, Turesky RJ, Garner RC, et al. Comparison of DNA-adduct and tissue-available dose levels of MeIQx in human and rodent colon following administration of a very low dose. Int J Cancer 1999;80:539-45. 17. Sugiyama Y, Yamashita S. Impact of microdosing clinical study — Why necessary and how useful? Adv Drug Delivery Rev 2011;63:494-502. 18. Sandhu P, Vogel JS, Rose MJ, Ubick EA, Brunner JE, Wallace MA, et al. Evaluation of microdosing strategies for studies in preclinical drug development: demonstration of linear pharmacokinetics in dogs of a nucleoside analog over a 50-fold dose range. Drug Metab Dispos 2004;32:1254-9. 19. Wang D, Lippard SJ. Cellular processing of platinum anticancer drugs. Nat Rev Drug Discovery 2005;4:307-20. 20. Hah SS, Sumbad RA, de Vere White RW, Turteltaub KW, Henderson PT. Characterization of oxaliplatin-DNA adduct formation in DNA and differentiation of cancer cell drug sensitivity at microdose concentrations. Chem Res Toxicol 2007;20:1745-51. 21. Hah SS, Henderson PT, Turteltaub KW. Towards biomarker-dependent individualized chemotherapy: exploring cell-specific differences in oxaliplatin-DNA adduct distribution using accelerator mass spectrometry. Bioorg Med Chem Lett 2010;20:2448-51. 22. Wang S, Zhang H, Malfatti M, de Vere White R, Lara PN, Jr., Turteltaub K, et al. Gemcitabine causes minimal modulation of carboplatin-DNA monoadduct formation and repair in bladder cancer cells. Chem Res
on June 19, 2018. © 2016 American Association for Cancer Research. mct.aacrjournals.org Downloaded from
Author manuscripts have been peer reviewed and accepted for publication but have not yet been edited. Author Manuscript Published OnlineFirst on November 30, 2016; DOI: 10.1158/1535-7163.MCT-16-0381
32
Toxicol 2010;23:1653-5. 23. Henderson PT, Li T, He M, Zhang H, Malfatti M, Gandara D, et al. A microdosing approach for characterizing formation and repair of carboplatin-DNA monoadducts and chemoresistance. Int J Cancer 2011;129:1425-34. 24. Ognibene TJ, Bench G, Vogel JS, Peaslee GF, Murov S. A high-throughput method for the conversion of CO2 obtained from biochemical samples to graphite in septa-sealed vials for quantification of 14C via accelerator mass spectrometry. Anal Chem 2003;75:2192-6. 25. Livak KJ, Schmittgen TD. Analysis of Relative Gene Expression Data Using Real-Time Quantitative PCR and the 2−ΔΔCT Method. Methods 2001;25:402-8. 26. Pan C-X, Zhang H, Tepper CG, Lin T-y, Davis RR, Keck J, et al. Development and Characterization of Bladder Cancer Patient-Derived Xenografts for Molecularly Guided Targeted Therapy. PloS One 2015;10:e0134346. 27. ICRP, The 2007 Recommendations of the International Commission on Radiological Protection. ICRP Publication 103. Ann. ICRP 2007;37:2-4. 28. Brenner DJ, Hall EJ. Computed Tomography — An Increasing Source of Radiation Exposure. N Eng J Med 2007;357:2277-84. 29. van der Vijgh WF. Clinical Pharmacokinetics of Carboplatin. Clin Pharmacokinet 1991;21:242-61. 30. Duffull S, Robinson B. Clinical Pharmacokinetics and Dose Optimisation of Carboplatin. Clin Pharmacokinet 1997;33:161-83. 31. Sharma H, Thatcher N, Baer J, Zaki A, Smith A, McAucliffe CA, et al. Blood clearance of radioactively labelled cis-diammine 1,1-cyclobutane dicarboxylate platinum (II) (CBDCA) in cancer patients. Cancer Chemother Pharmacol 1983;11:5-7. 32. Harland SJ, Newell DR, Siddik ZH, Chadwick R, Calvert AH, Harrap KR. Pharmacokinetics of cis-diammine-1,1-cyclobutane dicarboxylate platinum(II) in patients with normal and impaired renal function. Cancer Res 1984;44:1693-7. 33. Eisenhauer EA, Therasse P, Bogaerts J, Schwartz LH, Sargent D, Ford R, et al. New response evaluation criteria in solid tumours: Revised RECIST guideline (version 1.1). Eur J Cancer 2009;45:228-47. 34. Bondarenko G, Ugolkov A, Rohan S, Kulesza P, Dubrovskyi O, Gursel D, et al. Patient-Derived Tumor Xenografts Are Susceptible to Formation of Human Lymphocytic Tumors. Neoplasia 2015;17:735-41. 35. Ferrandina G, Mey V, Nannizzi S, Ricciardi S, Petrillo M, Ferlini C, et al. Expression of nucleoside transporters, deoxycitidine kinase, ribonucleotide reductase regulatory subunits, and gemcitabine catabolic enzymes in primary ovarian cancer. Cancer Chemother Pharmacol 2010;65:679-86. 36. Ozcan MF, Dizdar O, Dincer N, Balcı S, Guler G, Gok B, et al. Low ERCC1 expression is associated with prolonged survival in patients with bladder cancer receiving platinum-based neoadjuvant chemotherapy. Uro Oncol 2013;31:1709-15. 37. Liu D, Plimack ER, Hoffman-Censits J, et al. CLinical validation of chemotherapy response biomarker ercc2 in muscle-invasive urothelial bladder carcinoma. JAMA Oncology 2016;2:1094-6. 38. Sun J-M, Sung J-Y, Park SH, Kwon GY, Jeong BC, Seo SI, et al. ERCC1 as a biomarker for bladder cancer patients likely to benefit from adjuvant chemotherapy. BMC Cancer 2012;12:1-8. 39. Manié E, Popova T, Battistella A, Tarabeux J, Caux-Moncoutier V, Golmard L, et al. Genomic hallmarks of homologous recombination deficiency in invasive breast carcinomas. Int J Cancer 2016;138:891-900. 40. Network NCC. NCCN Clinical Practice Guidelines in Oncology for Bladder Cancer. http://wwwnccnorg/professionals/physician_gls/f_guidelinesasp. 2012;1. 41. van de Vaart PJM, Belderbos J, de Jong D, Sneeuw KCA, Majoor D, Bartelink H, et al. DNA-adduct levels as a predictor of outcome for NSCLC patients receiving daily cisplatin and radiotherapy. Int J Cancer 2000;89:160-6. 42. Reed E, Ostchega Y, Steinberg SM, Yuspa SH, Young RC, Ozols RF, et al. Evaluation of Platinum-DNA Adduct Levels Relative to Known Prognostic Variables in a Cohort of Ovarian Cancer Patients. Cancer Res 1990;50:2256-60. 43. Motzer RJ, Reed E, Perera F, Tang D, Shamkhani H, Poirier MC, et al. Platinum-DNA adducts assayed in leukocytes of patients with germ cell tumors measured by atomic absorbance spectrometry and enzyme-linked immunosorbent assay. Cancer 1994;73:2843-52. 44. Bonetti A, Apostoli P, Zaninelli M, Pavanel F, Colombatti M, Cetto GL, et al. Inductively coupled plasma mass spectroscopy quantitation of platinum-DNA adducts in peripheral blood leukocytes of patients receiving cisplatin- or carboplatin-based chemotherapy. Clin Cancer Res 1996;2:1829-35. 45. Wang L-E, Yin M, Dong Q, Stewart DJ, Merriman KW, Amos CI, et al. DNA Repair Capacity in Peripheral Lymphocytes Predicts Survival of Patients With Non–Small-Cell Lung Cancer Treated With First-Line Platinum-
on June 19, 2018. © 2016 American Association for Cancer Research. mct.aacrjournals.org Downloaded from
Author manuscripts have been peer reviewed and accepted for publication but have not yet been edited. Author Manuscript Published OnlineFirst on November 30, 2016; DOI: 10.1158/1535-7163.MCT-16-0381
33
Based Chemotherapy. J Clin Oncol 2011;29:4121-8. 46. Lee J-M, Gordon N, Trepel JB, Lee M-J, Yu M, Kohn EC. Development of a multiparameter flow cytometric assay as a potential biomarker for homologous recombination deficiency in women with high-grade serous ovarian cancer. J Transl Med 2015;13:1-12. 47. Wickremsinhe ER, Lutzke BS, Jones BR, Schultz GA, Freeman AB, Pratt SE, et al. Quantification of Gemcitabine Incorporation into Human DNA by LC/MS/MS as a Surrogate Measure for Target Engagement. Anal Chem 2010;82:6576-83. 48. Zhao H, Zhang H, Du Y, Gu X. Prognostic significance of BRCA1, ERCC1, RRM1, and RRM2 in patients with advanced non-small cell lung cancer receiving chemotherapy. Tumour Biol 2014;35:12679-88. 49. Zhang GB, Chen J, Wang LR, Li J, Li MW, Xu N, et al. RRM1 and ERCC1 expression in peripheral blood versus tumor tissue in gemcitabine/carboplatin-treated advanced non-small cell lung cancer. Cancer Chemother Pharmacol 2012;69:1277-87. 50. Huang P, Chubb S, Hertel LW, Grindey GB, Plunkett W. Action of 2',2'-difluorodeoxycytidine on DNA synthesis. Cancer Res 1991;51:6110-7. 51. Morgan MA, Parsels LA, Parsels JD, Mesiwala AK, Maybaum J, Lawrence TS. Role of Checkpoint Kinase 1 in Preventing Premature Mitosis in Response to Gemcitabine. Cancer Res 2005;65:6835-42. 52. Mini E, Nobili S, Caciagli B, Landini I, Mazzei T. Cellular pharmacology of gemcitabine. Ann Oncol 2006;17(suppl 5):v7-v12. 53. Alli E, Sharma VB, Hartman AR, Lin PS, McPherson L, Ford JM. Enhanced sensitivity to cisplatin and gemcitabine in Brca1-deficient murine mammary epithelial cells. BMC Pharmacology 2011;11:7. 54. Huang P, Chubb S, Plunkett W. Termination of DNA synthesis by 9-beta-D-arabinofuranosyl-2-fluoroadenine. A mechanism for cytotoxicity. J Biol Chem 1990;265:16617-25.
on June 19, 2018. © 2016 American Association for Cancer Research. mct.aacrjournals.org Downloaded from
Author manuscripts have been peer reviewed and accepted for publication but have not yet been edited. Author Manuscript Published OnlineFirst on November 30, 2016; DOI: 10.1158/1535-7163.MCT-16-0381
34
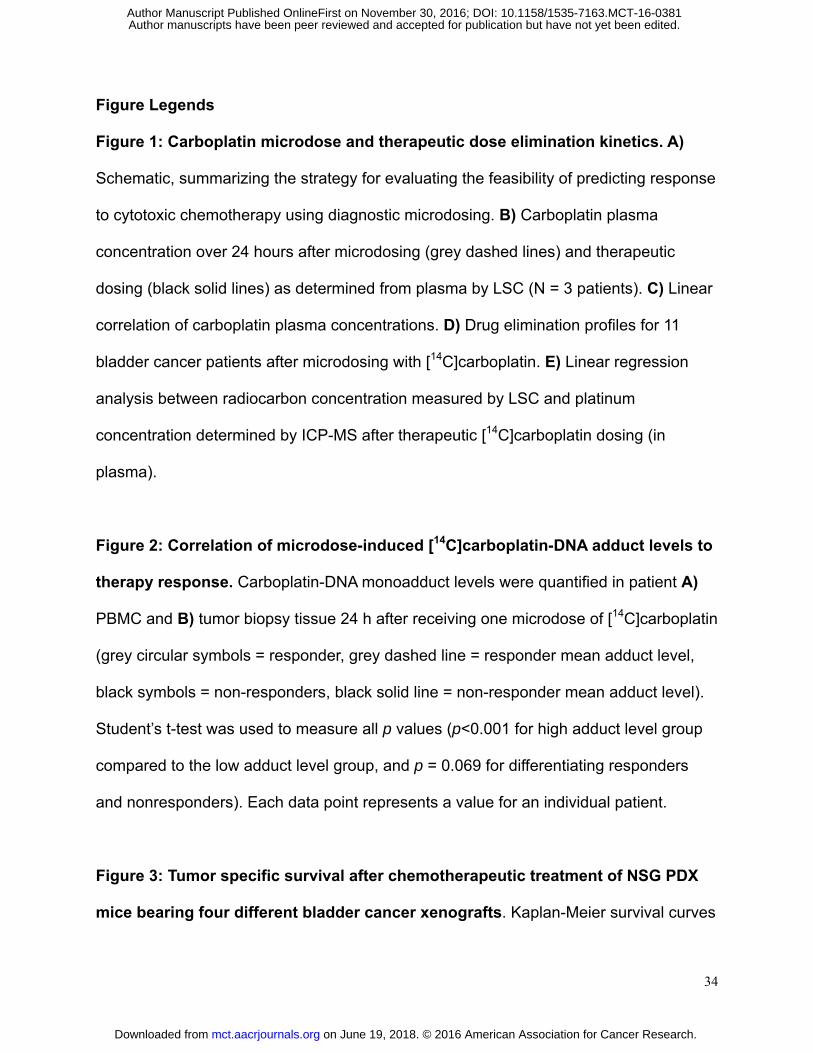
Figure Legends
Figure 1: Carboplatin microdose and therapeutic dose elimination kinetics. A)
Schematic, summarizing the strategy for evaluating the feasibility of predicting response
to cytotoxic chemotherapy using diagnostic microdosing. B) Carboplatin plasma
concentration over 24 hours after microdosing (grey dashed lines) and therapeutic
dosing (black solid lines) as determined from plasma by LSC (N = 3 patients). C) Linear
correlation of carboplatin plasma concentrations. D) Drug elimination profiles for 11
bladder cancer patients after microdosing with [14C]carboplatin. E) Linear regression
analysis between radiocarbon concentration measured by LSC and platinum
concentration determined by ICP-MS after therapeutic [14C]carboplatin dosing (in
plasma).
Figure 2: Correlation of microdose-induced [14C]carboplatin-DNA adduct levels to
therapy response. Carboplatin-DNA monoadduct levels were quantified in patient A)
PBMC and B) tumor biopsy tissue 24 h after receiving one microdose of [14C]carboplatin
(grey circular symbols = responder, grey dashed line = responder mean adduct level,
black symbols = non-responders, black solid line = non-responder mean adduct level).
Student’s t-test was used to measure all p values (p<0.001 for high adduct level group
compared to the low adduct level group, and p = 0.069 for differentiating responders
and nonresponders). Each data point represents a value for an individual patient.
Figure 3: Tumor specific survival after chemotherapeutic treatment of NSG PDX
mice bearing four different bladder cancer xenografts. Kaplan-Meier survival curves
on June 19, 2018. © 2016 American Association for Cancer Research. mct.aacrjournals.org Downloaded from
Author manuscripts have been peer reviewed and accepted for publication but have not yet been edited. Author Manuscript Published OnlineFirst on November 30, 2016; DOI: 10.1158/1535-7163.MCT-16-0381
35
comparing different treatments (N ≥ 8) of A) BL0269, B) BL0293 C) BL0440 and D)
BL0645. Black line = Vehicle (D5W IV Q7Dx3), blue line = cisplatin (2 mg/kg IV Q7Dx3),
red line = gemcitabine (150 mg/kg IP Q7Dx4), green line = G/C combination
chemotherapy (dashed lines represent treatment days).
Figure 4: Microdose-induced carboplatin- and gemcitabine DNA-adduct levels
correlate with PDX drug sensitivity. NSG mice were implanted with the indicated PDX
tumors 14 to 30 days before microdosing. Animals (N ≥ 4 per group) were dosed via tail
vein injection with A and B) 0.375 mg/kg carboplatin, 50,000 dpm/g or C, D and F)
0.092 mg/kg gemcitabine, 1000 dpm/g. Tumors were collected after A and C) 4h or B
and D) 24h and 14C content of isolated tumor DNA was analyzed via AMS. E) Tumor
volume ratio of parental PDX model BL0293 (grey line) and resistant model BL0293R
(black line). BL0293 was defined as resistant after gemcitabine treatment did not affect
tumor growth (8 cycles). Dashed lines represent treatment days. F) Microdose-induced
gemcitabine adduct levels at 4h and 24h of BL0293 and BL0293R. One-Way ANOVA
with Newman-Keuls post hoc test or Student’s t-test was used to measure all p values (*
p < 0.05, ** p < 0.01). Presented are means and error bars represent SEM.
Figure 5: Pharmacodynamic evidence of in vivo for synergy between gemcitabine
and carboplatin. NSG mice were implanted with tumor model A and B) BL0645 or C
and D) BL0269. Animals were dosed via tail vein injection of A and C) 0.375 mg/kg
carboplatin (50,000 dpm/g), or 0.375 mg/kg carboplatin (50,000 dpm/g) plus
0.092 mg/kg gemcitabine, B, D) 0.092 mg/kg gemcitabine (1,000 dpm/g), or
on June 19, 2018. © 2016 American Association for Cancer Research. mct.aacrjournals.org Downloaded from
Author manuscripts have been peer reviewed and accepted for publication but have not yet been edited. Author Manuscript Published OnlineFirst on November 30, 2016; DOI: 10.1158/1535-7163.MCT-16-0381
36
0.092 mg/kg gemcitabine (1,000 dpm/g) plus 0.375 mg/kg carboplatin. Tumors were
collected after 24h and isolated DNA was analyzed via AMS (N ≥ 3). Student’s t-test
was used to measure all p values. Presented are means and error bars represent SEM.
Figure 6: Dose linearity between the microdose and therapeutic dose in PDX
xenograft model BL0645 and BL0293. NSG mice were implanted with PDX model
BL0645 14 days before microdosing. Animals were dose with A) 37.5 mg/kg carboplatin
(50,000 dmp/g, red bar) or 37.5 mg/kg carboplatin (50,000 dpm/g) plus 9.2 mg/kg
unlabeled gemcitabine (green bar), B) 9.2 mg/kg gemcitabine (1,000 dpm/g, red bar) or
9.2 mg/kg gemcitabine (1,000 dpm/g) plus 37.5 mg/kg unlabeled carboplatin (green
bar). After 24h, DNA was isolated from collected tumor tissue and analyzed via AMS. C)
Dose proportionality is shown by plotting microdose and therapeutic dose induced
adduct level onto log scale. Student’s t-test was used to measure all p values.
Presented are means and error bars represent SEM.
on June 19, 2018. © 2016 American Association for Cancer Research. mct.aacrjournals.org Downloaded from
Author manuscripts have been peer reviewed and accepted for publication but have not yet been edited. Author Manuscript Published OnlineFirst on November 30, 2016; DOI: 10.1158/1535-7163.MCT-16-0381
Published OnlineFirst November 30, 2016.Mol Cancer Ther Maike Zimmermann, Si-Si Wang, Hongyong Zhang, et al. Chemotherapy Resistance in Humans and MiceMicrodose-induced Drug-DNA Adducts as Biomarkers of
Updated version
10.1158/1535-7163.MCT-16-0381doi:
Access the most recent version of this article at:
Material
Supplementary
http://mct.aacrjournals.org/content/suppl/2016/11/30/1535-7163.MCT-16-0381.DC1
Access the most recent supplemental material at:
Manuscript
Authoredited. Author manuscripts have been peer reviewed and accepted for publication but have not yet been
E-mail alerts related to this article or journal.Sign up to receive free email-alerts
Subscriptions
Reprints and
To order reprints of this article or to subscribe to the journal, contact the AACR Publications
Permissions
Rightslink site. Click on "Request Permissions" which will take you to the Copyright Clearance Center's (CCC)
.http://mct.aacrjournals.org/content/early/2016/11/30/1535-7163.MCT-16-0381To request permission to re-use all or part of this article, use this link
on June 19, 2018. © 2016 American Association for Cancer Research. mct.aacrjournals.org Downloaded from
Author manuscripts have been peer reviewed and accepted for publication but have not yet been edited. Author Manuscript Published OnlineFirst on November 30, 2016; DOI: 10.1158/1535-7163.MCT-16-0381