Maniatakeion Foundation - Historical Background & Economic Development
this article is distributed under the terms of the creative commons attribution 4.0 international license
corresponding author
*Eliane Tanabe Deliberali Email: [email protected]†Marcelo Moll Brandão Email: [email protected]Ω Flávio Santino Bizarrias Email: [email protected]
Received: 03/05/2018.Revised: 20/08/2018.Accepted: 29/01/2019.Published Online: 12/09/2019.DOI: http://dx.doi.org/10.15728/bbr.2019.16.6.4
Repurchase Intention Conditioned to Economic Confidence in Main Street Retail Districts
Eliane Tanabe Deliberali1, * 1 Universidade Nove de Julho, São Paulo, SP, Brasil
Marcelo Moll Brandão2, † 2 Universidade Federal do Espírito Santo, Vitória, ES, Brasil
Flávio Santino Bizarrias1, Ω
1Universidade Nove de Julho, São Paulo, SP, Brasil
ABSTRACTThe crisis of confidence in Brazil creates a scenario that can influence relations between the attributes of the retailer and consumers. Consumer assessments can be adjusted to economic confidence, leading to more utilitarian values or decreasing the hedonic value of buying experiences. Thus, it is necessary to understand the intervention of economic confidence in the responses of consumers to the attractiveness factors of a retail cluster. We conducted an analysis on the extent to which attribute assessments and crowding perception, hedonic and utility value, and satisfaction, interact with economic confidence, and satisfaction to influence performance and repurchase intention. A survey was carried out in the purchase environment with 300 consumers (region of Rua 25 de Março, São Paulo). Hypotheses were tested by PLS and Process. The mediating role of the economic trust between hedonic value and satisfaction was evidenced, proving adjustment of the hedonic value with the decrease of confidence. Theoretical and practical contributions are discussed in the conclusions.
KEYWORDSUnplanned retail agglomeration, Attractive attributes, Economic confidence
16
590
1. INTRODUCTIONThe current economic situation in Brazil, along with the political crisis, coupled with the increase
in competitiveness experienced within the retail sector in recent years, have caused much of the expansion of businesses oriented toward the middle class to suffer a major downturn. Retailers in general, specifically, street stores, felt a need for greater knowledge of the attractiveness factors of different retail formats. In this paper, street retailing will be treated in the contexts of unplanned retail clusters or, its synonym, street retailers. What happens to the perception of the attractiveness factors of the retailer in crisis contexts? This issue highlights the importance of knowing how much consumers adjust their buying behavior given the perception of the economic situation, or consumer confidence. This construct considers consumer’s subjective assessments of household finances and their expectations about the economic climate (Deleersnyder, Dekimpe, Sarvary, & Parker, 2004; Hunneman, Verhoef, & Sloot, 2015).
Exploring the relationships between the effects of economic reliance on store satisfaction and repurchase intent has warranted greater attention for its added value to strategic retail marketing management in this new competitive context. The effect of retail consumer confidence has not been researched, perhaps because, in times of low confidence, consumers reduce overall ratings, including consumer and purchasing environments (Hunneman et al., 2015).
Another variable that influences the consumer responses included in the tested model, due to the nature of the contexts of retail clusters in the big cities, i.e. the high human density, is the crowding perception. Since the 1980s, the crowding phenomenon has been studied, given the interest in understanding it and identifying how it exerts influence on the environmental and physical factors that make up the retail context, since they have influence on the responses of consumer behavior in relation to the environment of the store (Bateson & Hui, 1987; Dion, 2004; Eroglu, Machleit, & Barr, 2005; Mehta, 2013). In Brazil, studies reinforce the relevance of the crowding phenomenon in the retail context (Brandão, Parente, & Oliveira, 2010; Silva, Albuquerque, Brandão, & Pedron, 2014; Quezado, Costa, & Fuentes, 2014). Crowding perception is a construct that deals more subjectively concerning agglomeration, since it involves the emotional consequence of density (Mehta, 2013). Thus, we include the variable to also analyze its effects on psychological responses, such as the perception of both hedonic and utilitarian values and the market in addition to economic confidence, store satisfaction, and repurchase intention. The retail cluster used for the data collection of the study, via questionnaire, is located in the center of the city of São Paulo. Rua 25 de Março has formal stores and a lot of informal street vendors, who offer their products in trolleys, benches, sidewalks, etc. Next, we considered the stores, as well as shops outside the stores, making up a large commercial establishment, since the cluster is in a very popular region by its retail trade, in fact a retail agglomeration (Dolega & Pavlis, 2015; Teller & Elms, 2010; Teller & Schnedlitz, 2012). From the attributes of the “store,” in this case, the “region” (Hunneman et al., 2015; Parente, Brandão, Miotto, & Plutarco, 2012; Brandão et al, 2010; Teller & Elms, 2010), we investigated the formation of the perception of the hedonic and utilitarian values (Babin, Darden, & Griffin, 1994; Lopes, Teixeira, & Moretti, 2012). Having, as antecedents, environmental factors like the attractiveness of the store, and the impacts of the economic confidence (Hunneman et al., 2015) on satisfaction with the “region” (Harris & Goode, 2004; Hunneman et al., 2015) by consumers, to understand how they develop attitudes towards stores and intention to repurchase (Eisenbeiss, Corneliben, Backhauss, & Hoyer, 2014).
The objective of this work is to understand the relationship between the attractiveness factors of the unplanned retail cluster based on Teller and Elms (2010), including the crowding perception, utilitarian and hedonic value, and consumer responses on satisfaction and repurchase intentions. The
16
591
main contribution of this research is the study of these relations to the public of the retail cluster, including the effect of the consumer confidence variable on the relation between hedonic value and store satisfaction. Thus, broadening the understanding of the phenomenon of attractiveness and consequences in the behavior of the consumer. It is worth noting that consumers adjust their purchasing behavior away from pleasure in the shopping experience given the perception of the economic situation (Deleersnyder et al., 2004). The results point to significant effects of attractiveness factors to the store, except for convenience.
The economic trust variable proved to be a relevant individual mechanism for the explanation of store satisfaction, increasing the understanding of the phenomenon studied here.
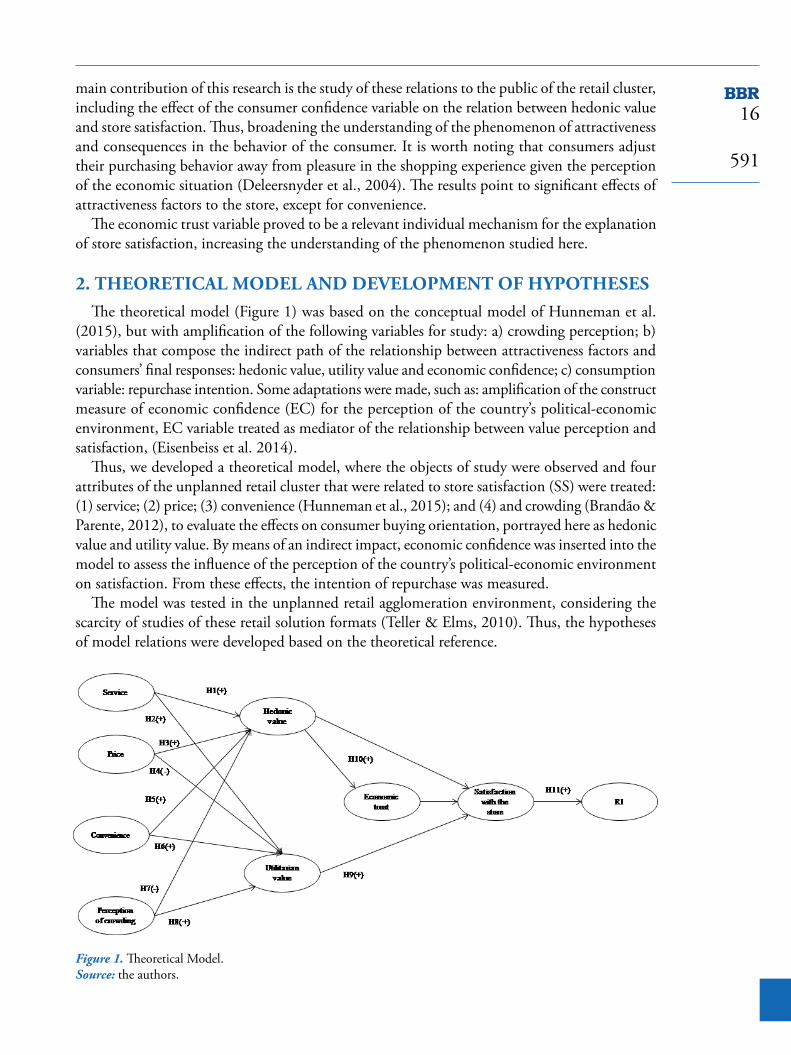
2. THEORETICAL MODEL AND DEVELOPMENT OF HYPOTHESESThe theoretical model (Figure 1) was based on the conceptual model of Hunneman et al.
(2015), but with amplification of the following variables for study: a) crowding perception; b) variables that compose the indirect path of the relationship between attractiveness factors and consumers’ final responses: hedonic value, utility value and economic confidence; c) consumption variable: repurchase intention. Some adaptations were made, such as: amplification of the construct measure of economic confidence (EC) for the perception of the country’s political-economic environment, EC variable treated as mediator of the relationship between value perception and satisfaction, (Eisenbeiss et al. 2014).
Thus, we developed a theoretical model, where the objects of study were observed and four attributes of the unplanned retail cluster that were related to store satisfaction (SS) were treated: (1) service; (2) price; (3) convenience (Hunneman et al., 2015); and (4) and crowding (Brandão & Parente, 2012), to evaluate the effects on consumer buying orientation, portrayed here as hedonic value and utility value. By means of an indirect impact, economic confidence was inserted into the model to assess the influence of the perception of the country’s political-economic environment on satisfaction. From these effects, the intention of repurchase was measured.
The model was tested in the unplanned retail agglomeration environment, considering the scarcity of studies of these retail solution formats (Teller & Elms, 2010). Thus, the hypotheses of model relations were developed based on the theoretical reference.
Figure 1. Theoretical Model. Source: the authors.
16
592
2.1. store attributes and Value perception
Store attributes have relevant weights on consumer perception and may change, depending on the duration of the property, in relation with the change of consumption targets. The environmental factors of the different types of retail clusters, when managed in the marketing mix, can generate utility value perception and provide an efficient purchase, when it allows the consumer to achieve his or hers objectives, or generate the perception of hedonic value, if the purchase reflects potential of entertainment and emotional value (Babin et al., 1994). Likewise, consumers who are attracted to agglomerations by price and atmosphere stimulus do so by perceiving hedonic values. However, the choice of location and parking facilities can generate a greater perception of utilitarian value (Teller, Reutterer, & Schnedlitz, 2008). The retail literature treats perception of value of purchase by value: hedonic and utilitarian.
The hedonic value reflects an individual’s evaluation of an entertainment and how much it was worth the experience received at the time of the purchase. The utility value, on the other hand, reflects whether the purchase objective was achieved (Eroglu et al., 2005), bringing a sense of accomplishment or, alternatively, disappointment, as the shopping task was not completed (Babin et al., 1994). Additionally, consumers may perceive hedonic value in the perception of bargaining. Conversely, the perceived utility value is a work-minded purchase, terminated efficiently or successfully (Babin et al., 1994).
Thus, the attributes of the unplanned retail cluster covered are service, price, and convenience. Service attributes are expected to increase satisfaction with unplanned retail crowding, as good services provide greater value to consumers and are directly related to quality transfer.
Service is understood as the quality and variety of facilities provided to the consumer at the retailer site, such as parking, service, assistance and purchase sales consultancy, and payment conditions. (Allen, 2006), These attributes have historical influence on the level of meaning of the shopping, and the utilitarian or hedonic experience. Based on these theories, it was concluded that:
H1. Ease of offered service has positive relation with the perception of hedonic value.H2. Ease of offered service has positive relation with the perception of utility value.The price variable was treated through the perception of low price and attractive offers
(Hunneman et al., 2015). Studies show that consumers attracted to agglomerations by price stimuli perceive higher hedonic value, especially when there is a perception of bargaining that generates an increase in the sense of involvement and excitement among consumers (Babin et al., 1994; Baker, Parasuraman, Grewal, & Voss, 2002; Teller et al., 2008).
In the hedonic perspective, consumers’ observation of the price depends much more on the moment of purchase than on the experience lived. Thus, price composes the experience and if, for example, a low price means other consumers would be trying to buy the same product in a promotional environment, the idea of a “treasure hunt” overlaps between the dimensions of price perception and the expectation would be of a positive relation between price and hedonic value.
In retail environments, including the most popular retailers, consumer expectation of prices shows a more symmetrical relationship between the quality of products and services and their prices, in a more functional perspective of value, utility value. This is because, in a street retail environment, products are offered with the argument of being best sellers, reducing the perception of risk in the purchase. In this way, the consumer expects a more aligned price and quality relationship through the acquisition (Das, Mukherjee, & Smith, 2017; Chitturi, Rajagopal, & Vijay, 2008). Thus, even though a higher perception of price may be related to a better buying experience and the price may also signal quality (Baker et al., 2002), it does not reach the expectation of a worthwhile buy for the low price in the context of most popular retailers. In this situation, low
16
593
prices and attractive offers make the stores full, and such a condition, prevents the consumer from making a more rational purchase and fulfill the task that was proposed. However, it is expected that the utility value may occur in parallel to the hedonic value given that the discussion of hedonic and utilitarian value is perceived in the stores depending on the opportunities that the consumer has in their daily life.
The clear distinction between the purchase as a task or as an experience can be confused when this purchase represents an opportunity to obtain a good for those who have fewer resources and alternatives to access (Griffin, Babin, & Modianos, 2000). In some street retail contexts, consumer supply can create the expectation of a single, odd purchase, leading to an increase in the search for hedonic value in the purchase (Das et al., 2017). In this sense, buying experiences can direct the higher perception of hedonic value, following the logic of the relationship of higher perception of high price and more quality and service. It should be noted that purchases of street products are typically less planned. In this same reasoning, the perception of high prices does not increase the perception of utilitarian value insofar as the idea of opportunity is lost in the high price, when this comparison of values is realized. The high price leads to a more symbolic value purchase, where more is paid for the experience, while the lower price induces a more efficient purchase, in which one seeks to reduce expenses by maximizing the usefulness of the purchase (Allen, 2006).
Thus, if the value of the price paid in the context of a retail cluster in which consumers assume hedonic buying motivation is measured, the relation of the highest price will be positive with the hedonic value and negative with the perception of utility value, since the highest price raises quality and still becomes a symbolic acquisition in contexts of consumers with lower purchasing power. From this discussion we can propose the following hypotheses:
H3. Price is positively related to the perception of hedonic value.H4. Price has negative relation with the perception of utility value.Convenience-related attractiveness factors have shown relevance to some specific retail formats
or direct importance in consumer assessment (Teller & Elms, 2010). Convenience lowers the transaction cost of the consumer as it has less cost to fetch information and makes the job of buying efficient. Regarding hedonic value, convenience can be understood as proxy for more options found in the cluster, making the shopping experience more exciting and richer in choices. It is assumed that convenience has a positive relation with the perception of hedonic and utilitarian values, described as hypotheses:
H5. Convenience is positively related to the perception of hedonic value.H6. Convenience has a positive relation with the perception of utility value.
2.2. crowding perception and Value (hedonic and utility)
Crowding is a phenomenon that occurs in the center of purchases. For some, a disorder and for others a sign of opportunities (Souza, Santos, & Brandão, 2014; Ferreira, Brandão, & Bizarrias, 2017). Crowding is associated with the dynamic factor of the store environment, where interaction and movement of consumers in the store may vary (Brandão & Parente, 2012). Here, we expand the concept to the study region and the unplanned street retail cluster. The crowding phenomenon has been researched for decades in retail contexts and crowding perception has been treated as a store environmental factor among human factors (Turley & Milliman, 2000). It emerges as a precursor of hedonic and utilitarian value and consumer responses within the perspective of the stimulus-organism-response paradigm (Machleit, 2005).
16
594
One should consider the difference between densities and crowding perception, since one is more objective in relation to the physical environment and is known as a crowding synonym and the other is more subjective and involves the emotional consequence of density (Mehta, 2013). Evidence shows relationships between the store environment, emotional responses and behaviors with positive and negative shopping directions (Brandão & Parente, 2012).
The crowding perception can be evidenced as an antecedent of the perceived value in the shopping experience, with hedonic value being reduced when crowding perception increases. The inverse, the increment of utility value, if human and physical density means the best consumer choice (value) and are composed of people who are not similar to the consumer (O’Guinn, Tanner, & Maeng, 2015), or generate a situation that surpasses the possibility of spatial control and consumer decision (Dion, 2004). The crowding perception has been treated as undifferentiated for the positive or negative emotions generated from the amount of people in the buying environment. There has been the adoption of human density treatment in retail contexts of developed countries, and with lower human density, as a standard for all retail contexts. In Brazil, and in countries with greater human density, customers may respond to the crowding perception generating an increase in hedonic value (Brandão, 2012; Metha, 2013). This is due to the pleasure in interacting with other people and evaluating the possibility of opportunities and promotions where there are more consumers. In the case of the relation between crowding perception and utility value, the expectation is that more people become stressed due to the reduction of personal space and control of the situation, which can hinder the purchase task (DION, 2004). Based on these arguments, we have:
H7. Crowding perception has negative relation with the hedonic value perception.H8. Crowding perception has a positive relation with the utility value perception.
2.3. hedonic Value, economic confidence, utility Value, and consumer satisfaction
In times of recession, consumer confidence is generally low, and becomes more price oriented, tending to value more options with lower quality, and less attention to quality of service. However, in the opposite direction, studies reveal that retailers should not only rely on the strategy of favorable prices at moments of low economic confidence of consumers, and that other attributes, such as services, have a greater contribution to satisfaction (Hunneman et al., 2015). Although a positive price assessment leads to store satisfaction in times of economic recession, consumers may present low confidence and greater price sensitivity (Hunneman et al., 2015), which does not solely mean looking at price. Attributes of convenience, such as location, can be indicative of how easy it is to get to the store. However, in times of economic recession and low consumer confidence, consumers may prefer to shop nearby to reduce transportation costs. Thus, convenience may lose relevance in these periods (Hunneman et al., 2015).
The concept of value is multifaceted (Babin et al., 1994). For some, value is price, for others, it is a process of exchange, a trade-off between cost and benefit, or what I receive for what I give (Zeithaml, 1988). In the study by Babin et al. (1994), this concept of value approaches utilitarian value. There are still interpretations of value as constituting a trade-off between perceived quality and price or, alternatively, a global subjective assessment that considers several relevant criteria (Babin et al., 1994). Another evaluation of the perceived value is considering the value of the shopping experience, which can evoke value when succeeding with the intended purchase objective or providing pleasure and / or fun (Babin et al., 1994). For Allen (2006), there are two routes in which values influence consumer choices: by way of products of utilitarian meaning or
16
595
products of hedonic meanings. A route in which human values, through an affective judgment, are congruent with the symbolic value of the product, and another route in which the relevant tangible attributes mediate the relationship with a utilitarian choice.
Studies have shown that consumption activities produce both hedonic and utility results (Babin et al., 1994). Hedonic value is understood as the subjective and personal form of pleasure at the time of purchase, meaning entertainment, increased excitement, greater involvement, and recreation (Babin et al., 1994), as well as the symbolic value of the products, in the view of Allen (2006). In contrast, the utilitarian value perception means a rational purchase related to the execution of a successful task (Babin et al., 1994), that is, by how much the consumer perceives the utility value in his purchases in the retail agglomerate of unplanned street, based on service attributes (Allen, 2006). In addition, consumers who are attracted to agglomerations, given their environment, exploited here by region attributes and price, perceive higher hedonic value, and that shopping orientation has an impact on customer promotion (Teller et al., 2008). The perception of hedonic and utilitarian values has already been evidenced as an intervening variable of the relationship between crowding and satisfaction (Eroglu et al., 2005) and the relationship between environmental factors and physical factors, as well as human factors and consumer responses (Baker et al., 2002).
Satisfaction with the store is defined as the general attitude of the consumer to it, based on the perceptions of store attributes (Steenkamp & Wedel, 1991). Studies show that environmental stimuli affect satisfaction among other responses and they point out that consumer satisfaction depends on the hedonic and utility value (Turley & Milliman, 2000; Baker et al., 2002). Since the utility value is antecedent to consumer satisfaction, we can describe the hypothesis:
H9. Utility value is positively related to store satisfaction.Consumer responses, including of satisfaction, are adjusted in times of economic crisis.
Confidence has a direct influence on satisfaction (Harris & Goode, 2004), as consumer confidence is considered to take into account subjective consumer assessments about the optics of their domestic finances and their expectations regarding the economic climate, considering this is a direct effect on the willingness to buy more (Hunneman et al., 2015). With confidence understood as economic trust, it is expected that low economic confidence will make the consumer more pessimistic reducing their assessment of various aspects of life, including retailing, making them more selective.
The adjustment of consumer assessments is expected in the hedonic value and not in the utility value. In the case of the relation between utility value and satisfaction, the most rational consumer evaluations are captured, the utility value being defined by the cost-benefit ratio of a choice and the price paid for a service. The utility value depends on the direct relation between the costs that the consumer could assume to reach expectations of benefits and does not include among its dimensions the emotions, being of a more rational nature. Given that this is a more cognitive and rational measure, it has the consequence of satisfaction and repurchase intention aligned with the financial conditions of the consumer. Here, it was admitted that the rational perspective of the utilitarian value has in its formation the level of economic confidence, since the consumer realizes utility value relating to financial and non-financial costs and benefits of the purchase.
For hedonic value that deals with the value of the experience, the pleasure of the moment of purchase, with dimensions considered more subjective and emotional of the shopping experience, it is expected that the relation with the satisfaction is mediated by the economic trust in contexts of consumption in crisis, as is the reality of the Brazilian market starting in 2014. The economic
16
596
crisis affects everyone but is felt more in the lower income classes, which depend on the labor market. Economic trust, treated as an individual’s perception, becomes a mechanism that explains greater consumer satisfaction, that is, by determining whether the hedonic value will influence satisfaction. According to Hunneman et al. (2015), the effect of consumer confidence on satisfaction has not been investigated, perhaps because in times of low consumer confidence, the consumer becomes more pessimistic and may reduce overall evaluations, including of the places visited, such as the unplanned retail cluster.
Consumer confidence is not a consequence of hedonic value, since this is a more comprehensive variable related to the consumer’s living conditions and their future perceptions about the economy and maintenance or increase of income. However, measuring consumer confidence makes it possible to differentiate and control the effect of this variable on consumer assessments. It is expected that consumers with low confidence present lower satisfaction, explaining that even when there is an increase in hedonic value, lower confidence leads to less satisfaction, and, on the contrary, an increase in confidence increases satisfaction. Thus, consumer confidence explains how hedonic value increases satisfaction. The hypothesis is stated:
H10. Hedonic value has a positive relationship with consumer satisfaction indirectly, as it increases economic confidence and mediates this relationship.
2.4. store satisfaction and repurchase intent
Repurchase intention or the consumer’s willingness to buy back at the retailer pole is another variable measure of response. The dynamic aspect of the relationships between suppliers and buyers has a central aspect in satisfaction, with a direct impact on the cumulativeness of satisfaction, and not only on the specific satisfaction of a moment of purchase transaction on the willingness to continue later in the buying process. According to Eisenbeiss et al. (2014), companies want to increase their relationships with consumers, so using value-based metrics for their customers is becoming a strategy of greater interest. It was chosen as an indicator based on consumers’ purchasing activity, and as a parameter of investigation of the response to the retailer, the repurchase intention (RI), leading to the following hypothesis:
H11. Satisfaction with the store has a positive relationship with the Repurchase Intention (RI).
3. SCALES AND MEASURESTo measure the variables of this study, we used store attributes, high price perception, service,
convenience, consumer satisfaction, and consumer confidence, based on Hunneman et al. (2015), and affixed on a 10-point Likert scale. The satisfaction with the store was based on Harris and Goode (2004), and Cronin, Brady and Hult (2000), the crowding perception was based on Bateson and Hui (1987), and Dion (2004), and utility and hedonic value was based in Babin et al. (1994), affixed on a Likert 5-point scale.
The repurchase intention was based on Lopes et al. (2012), with open questions; keeping to the original study scales. To measure satisfaction with the region, the satisfaction scale about the Harris and Goode store (2004), was used as a proxy to measure to what degree people believe they have made the right decision about items purchased in the region, dealing with affective aspects of satisfaction and evaluation (Bruner II, 2009).
Also asked were the frequency of visitation to the place, products bought, transportation used, and number of stores visited, among other variables of profile and demographic. A pre-test of the questionnaire was provided to 30 people and used to check understanding, difficulties, and response time.
16
597
4. METHOD AND RESEARCH TECHNIQUES
4.1. data collection procedures
Data collection was performed via vivo survey (Teller et al., 2008, Teller & Elms, 2010). Consumers were approached in the region of Rua 25 de Março whom had been seen making a purchase. The questions were read to the individual respondents by the interviewer, who explained the respective way of answering each scale, according to the case (Likert scale of 5 or 10 points, or semantic differential). Interviews were conducted by the researchers themselves and other duly prepared interviewers and occurred throughout March and April 2016.
4.2. data analysis procedures
Initially, the convergent validity and then the discriminant validity of the model were verified according to the procedures proposed by Hair, Hult, Ringle and Sarstedt (2014). The factorial load of each item of the construct scales was lower than 0.70, if the construct explanation was preserved superior to 50%, that is, the Average Extracted Variance (AVE) of each construct was analyzed so that all were above 0.50 (Hair et al., 2014). The values of internal consistency (Cronbach’s Alpha, AC) and Compound Reliability (CC) were observed, with AC above 0.60 and 0.70 and CC values of 0.70 and 0.90.
The results were satisfying in relation to the reference values (Hair et al., 2014). The cross loadings were then checked (Chin, 1998), and in the criteria of Fornell and Larcker (1981), the comparison of the square roots of the AVE values of each construct with the correlations between them which were larger than the correlations.
The following analysis was based on the structural model (Ringle, Silva, & Bido, 2014). First, the Pearson coefficient of determination (R2) was evaluated to verify the variance portion of the endogenous variables explained by the structural model. The suggested parameters for the area of social and behavioral sciences (Cohen, 1988), of R2 = 2% were adopted as small effect; R2 = 13% as mean effect; and R2 = 26% as a large effect. To verify if multiple linear regressions were significant, student’s t-test was evaluated for each relation between observed variables (OV) and latent variables (LV), OV-LV and LV-LV, being considered values greater than 1.96 for acceptance (Ringle et al., 2014). To extract the values of the t-test, bootstrapping was calculated in the SmartPLS 2.0 software for resampling, as recommended by Hair, Hult, Ringle and Sarstedt (2014). The next evaluation was the model adjustment quality indicator (Q2), which confirms the relevance or predictive validity of the model and the effect size indicator (f2), known as the Cohen Indicator (Ringle et al., 2014). We then evaluated whether Q2> 0 and f2 are within the criteria of 0.02 for small; 0.15 for medium; and 0.35 for large (Hair et al., 2014). To test whether the indirect path of the relationship between hedonic value and satisfaction is mediated by economic trust, we used the Model 2 of the software Process (Hayes, 2013).
5. SEARCH RESULTSThe sample was non-probabilistic, with 300 valid questionnaires, answered by 207 women
and 93 men, with 52% of respondents being of age up to 30 years and 48% being older than 30 years. The level of schooling of the sample was 11% incomplete secondary education, 30% complete secondary education, 31% incomplete upper, 22% complete higher education and 6% other levels. In the income category, the sample is concentrated in the C (64%) and D (23%) classes. Table 1 presents the descriptive and the reliability of the scales used in the study.
16
598
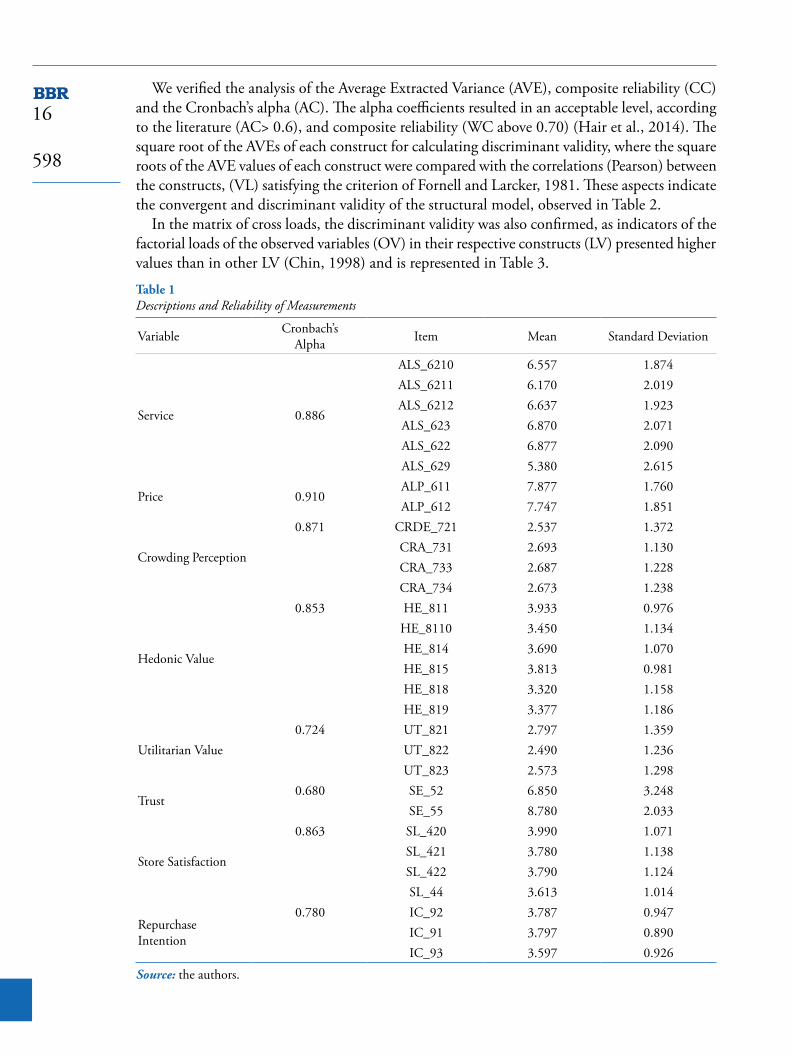
Table 1 Descriptions and Reliability of Measurements
Variable Cronbach’s Alpha Item Mean Standard Deviation
Service 0.886
ALS_6210 6.557 1.874ALS_6211 6.170 2.019ALS_6212 6.637 1.923ALS_623 6.870 2.071ALS_622 6.877 2.090ALS_629 5.380 2.615
Price 0.910ALP_611 7.877 1.760ALP_612 7.747 1.851
Crowding Perception
0.871 CRDE_721 2.537 1.372CRA_731 2.693 1.130CRA_733 2.687 1.228CRA_734 2.673 1.238
Hedonic Value
0.853 HE_811 3.933 0.976HE_8110 3.450 1.134HE_814 3.690 1.070HE_815 3.813 0.981HE_818 3.320 1.158HE_819 3.377 1.186
Utilitarian Value0.724 UT_821 2.797 1.359
UT_822 2.490 1.236UT_823 2.573 1.298
Trust0.680 SE_52 6.850 3.248
SE_55 8.780 2.033
Store Satisfaction
0.863 SL_420 3.990 1.071SL_421 3.780 1.138SL_422 3.790 1.124SL_44 3.613 1.014
Repurchase Intention
0.780 IC_92 3.787 0.947IC_91 3.797 0.890IC_93 3.597 0.926
Source: the authors.
We verified the analysis of the Average Extracted Variance (AVE), composite reliability (CC) and the Cronbach’s alpha (AC). The alpha coefficients resulted in an acceptable level, according to the literature (AC> 0.6), and composite reliability (WC above 0.70) (Hair et al., 2014). The square root of the AVEs of each construct for calculating discriminant validity, where the square roots of the AVE values of each construct were compared with the correlations (Pearson) between the constructs, (VL) satisfying the criterion of Fornell and Larcker, 1981. These aspects indicate the convergent and discriminant validity of the structural model, observed in Table 2.
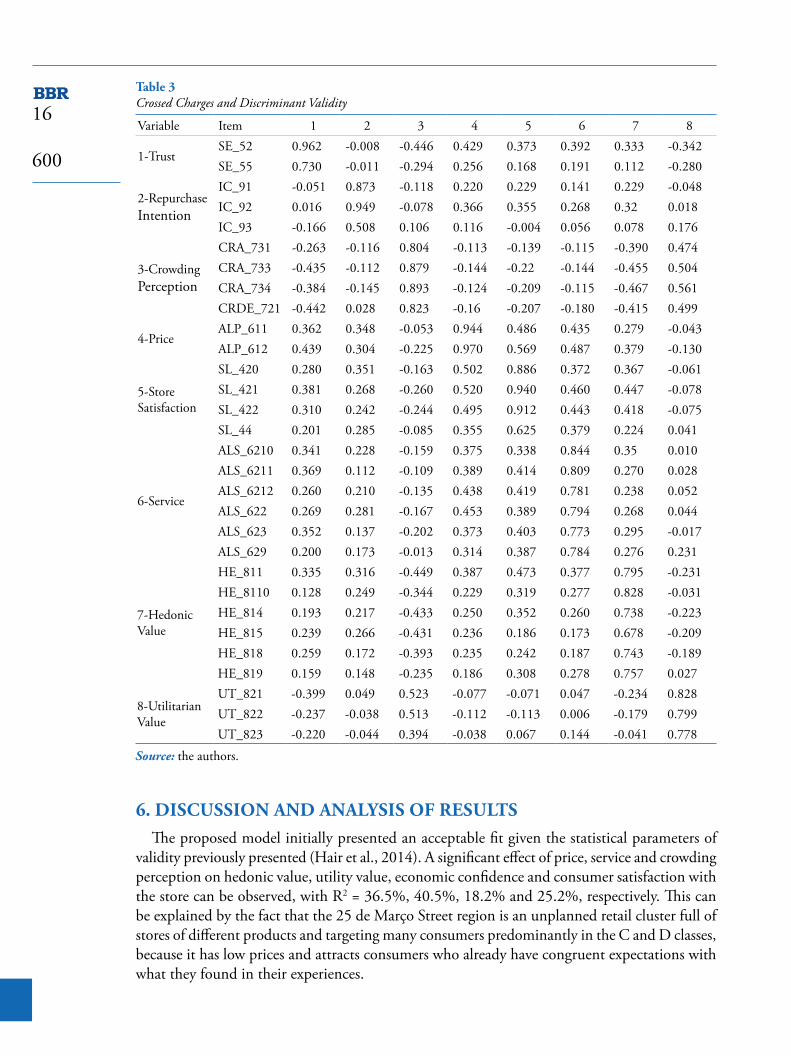
In the matrix of cross loads, the discriminant validity was also confirmed, as indicators of the factorial loads of the observed variables (OV) in their respective constructs (LV) presented higher values than in other LV (Chin, 1998) and is represented in Table 3.
16
599
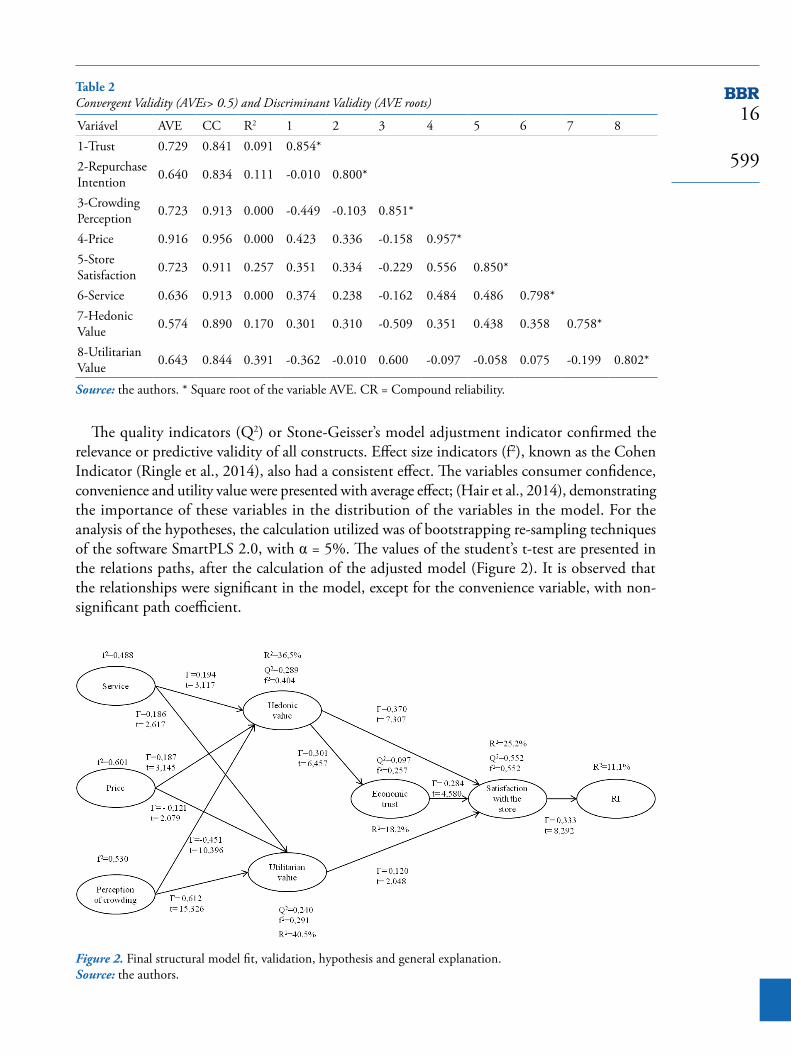
Table 2 Convergent Validity (AVEs> 0.5) and Discriminant Validity (AVE roots)
Variável AVE CC R2 1 2 3 4 5 6 7 81-Trust 0.729 0.841 0.091 0.854*2-Repurchase Intention 0.640 0.834 0.111 -0.010 0.800*
3-Crowding Perception 0.723 0.913 0.000 -0.449 -0.103 0.851*
4-Price 0.916 0.956 0.000 0.423 0.336 -0.158 0.957*5-Store Satisfaction 0.723 0.911 0.257 0.351 0.334 -0.229 0.556 0.850*
6-Service 0.636 0.913 0.000 0.374 0.238 -0.162 0.484 0.486 0.798*7-Hedonic Value 0.574 0.890 0.170 0.301 0.310 -0.509 0.351 0.438 0.358 0.758*
8-Utilitarian Value 0.643 0.844 0.391 -0.362 -0.010 0.600 -0.097 -0.058 0.075 -0.199 0.802*
Source: the authors. * Square root of the variable AVE. CR = Compound reliability.
The quality indicators (Q2) or Stone-Geisser’s model adjustment indicator confirmed the relevance or predictive validity of all constructs. Effect size indicators (f2), known as the Cohen Indicator (Ringle et al., 2014), also had a consistent effect. The variables consumer confidence, convenience and utility value were presented with average effect; (Hair et al., 2014), demonstrating the importance of these variables in the distribution of the variables in the model. For the analysis of the hypotheses, the calculation utilized was of bootstrapping re-sampling techniques of the software SmartPLS 2.0, with α = 5%. The values of the student’s t-test are presented in the relations paths, after the calculation of the adjusted model (Figure 2). It is observed that the relationships were significant in the model, except for the convenience variable, with non-significant path coefficient.
Figure 2. Final structural model fit, validation, hypothesis and general explanation. Source: the authors.
16
600
Table 3 Crossed Charges and Discriminant Validity
Variable Item 1 2 3 4 5 6 7 8
1-TrustSE_52 0.962 -0.008 -0.446 0.429 0.373 0.392 0.333 -0.342SE_55 0.730 -0.011 -0.294 0.256 0.168 0.191 0.112 -0.280
2-Repurchase Intention
IC_91 -0.051 0.873 -0.118 0.220 0.229 0.141 0.229 -0.048IC_92 0.016 0.949 -0.078 0.366 0.355 0.268 0.32 0.018IC_93 -0.166 0.508 0.106 0.116 -0.004 0.056 0.078 0.176
3-Crowding Perception
CRA_731 -0.263 -0.116 0.804 -0.113 -0.139 -0.115 -0.390 0.474CRA_733 -0.435 -0.112 0.879 -0.144 -0.22 -0.144 -0.455 0.504CRA_734 -0.384 -0.145 0.893 -0.124 -0.209 -0.115 -0.467 0.561CRDE_721 -0.442 0.028 0.823 -0.16 -0.207 -0.180 -0.415 0.499
4-PriceALP_611 0.362 0.348 -0.053 0.944 0.486 0.435 0.279 -0.043ALP_612 0.439 0.304 -0.225 0.970 0.569 0.487 0.379 -0.130
5-Store Satisfaction
SL_420 0.280 0.351 -0.163 0.502 0.886 0.372 0.367 -0.061SL_421 0.381 0.268 -0.260 0.520 0.940 0.460 0.447 -0.078SL_422 0.310 0.242 -0.244 0.495 0.912 0.443 0.418 -0.075SL_44 0.201 0.285 -0.085 0.355 0.625 0.379 0.224 0.041
6-Service
ALS_6210 0.341 0.228 -0.159 0.375 0.338 0.844 0.35 0.010ALS_6211 0.369 0.112 -0.109 0.389 0.414 0.809 0.270 0.028ALS_6212 0.260 0.210 -0.135 0.438 0.419 0.781 0.238 0.052ALS_622 0.269 0.281 -0.167 0.453 0.389 0.794 0.268 0.044ALS_623 0.352 0.137 -0.202 0.373 0.403 0.773 0.295 -0.017ALS_629 0.200 0.173 -0.013 0.314 0.387 0.784 0.276 0.231
7-Hedonic Value
HE_811 0.335 0.316 -0.449 0.387 0.473 0.377 0.795 -0.231HE_8110 0.128 0.249 -0.344 0.229 0.319 0.277 0.828 -0.031HE_814 0.193 0.217 -0.433 0.250 0.352 0.260 0.738 -0.223HE_815 0.239 0.266 -0.431 0.236 0.186 0.173 0.678 -0.209HE_818 0.259 0.172 -0.393 0.235 0.242 0.187 0.743 -0.189HE_819 0.159 0.148 -0.235 0.186 0.308 0.278 0.757 0.027
8-Utilitarian Value
UT_821 -0.399 0.049 0.523 -0.077 -0.071 0.047 -0.234 0.828UT_822 -0.237 -0.038 0.513 -0.112 -0.113 0.006 -0.179 0.799UT_823 -0.220 -0.044 0.394 -0.038 0.067 0.144 -0.041 0.778
Source: the authors.
6. DISCUSSION AND ANALYSIS OF RESULTSThe proposed model initially presented an acceptable fit given the statistical parameters of
validity previously presented (Hair et al., 2014). A significant effect of price, service and crowding perception on hedonic value, utility value, economic confidence and consumer satisfaction with the store can be observed, with R2 = 36.5%, 40.5%, 18.2% and 25.2%, respectively. This can be explained by the fact that the 25 de Março Street region is an unplanned retail cluster full of stores of different products and targeting many consumers predominantly in the C and D classes, because it has low prices and attracts consumers who already have congruent expectations with what they found in their experiences.
16
601
The hypotheses of the paths of the structural model presented significant relations, being confirmed almost in totality. H5 (Г = - 0.009, t = 0.908) and H6 (Г = 0.088, t = 1.330) were not confirmed for the convenience variable and its relation to the hedonic value perception and utility value, respectively. For Lloyd, Chan, Yip and Chan (2014), consumers who greatly value time-related issues, convenience has a greater influence on hedonic value. The opposite occurs when consumers attribute less value to time, when the greater influence of the convenience of services occurs in the utility value.
In this way, theoretically, it is possible that both characteristics are observed in this sample, invalidating the hypothesis of convenience influence in the perception of value. Evidence suggests that convenience plays a central role in services, especially the reduction of time and distance. If this strategy is not taken by the retailer, the perception of value is no longer significant (Reimers & Chao, 2014). That is, the fact that the region studied was in a central region, and that there were several suppliers near the focal store, did not show relevance to the perception of purchase value given the small variance of this variable. Otherwise, there is little convenience for the large influx of people in a region unprepared to accommodate many people. It is worth noting that the convenience construct consisted of only two items, and it may be a suggestion to replace its scale with another one with a larger number of items, with measures more representative for the research site. It is also worth considering that convenience is a consequence of the point-of-view of the theory of half-ends chains, by checking the attribute-consequence-value link (A-C-V) of how much the consumer seeks actions that minimize the effects of the consequences. Therefore, it is worthwhile to add to the study the concept of value for the client and to evaluate how it perceives the benefit of buying in the retail cluster with all its practical and emotional aspect, vis a vis the assumed sacrifices, such as money spent, time, energy, and psychological factors. That is, to understand the perceived value, since this is a positive function of what one receives and a negative function of what one sacrifices, based on their beliefs (Ikeda & Veludo-De-Oliveira, 2005).
Finally, we observe that the proposed structural model explains 11% of the repurchase intention (R2 = 0.111) in the region of Rua 25 de Março (25 de Março Street). We can consider this effect as low-middle, according to Cohen’s (1998), criterion for social sciences. It is observed that there are other factors not absorbed by the model to explain such a construct. The repurchase intention (RI) variable had a low average power of explanation, with R² of 11%, but with a high predictive quality evaluation of the Q²> 0 model with 4.6%.
The Bateson and Hui (1987), scale of crowding perception was excluded, with only the Dion (2004), scales remaining. Despite the use of the 5-point Likert method for the Bateson and Hui scales (1987), it could be replaced by semantic differential measurement for better suitability. The Dion scales (2004), contributed four of their six items to measure the construct, demonstrating relevance to the variable crowding perception in the model.
The model studied has, in economical trust, a fundamental aspect. When evaluating the construct economic confidence, it is observed that it has greater relevance for the explanation of satisfaction with the store. Without this variable, the store satisfaction R2 drops to 18.65%. That is, economic confidence increases the explanatory capacity of the proposed model and summarizes its importance as a mediating variable. We highlight the mediating role of economic trust in the final model, observed in Figure 2, where all the relationships become meaningful in explaining the shopping experience in an unplanned retail cluster.
The mediation test was performed using the procedures described by Hayes (2013) for Model 4 of Process®, complemented by the Sobel test (Sobel, 1982). The hedonic value does not have a
16
602
direct effect on satisfaction (β = 0.19, p <0.01, CI: lower limit -0.27, upper limit 0.65) considering the confidence interval. However, this effect only occurs indirectly (βmean = 0.55, p <0.01, Z = 4.0, p <0.01, CI: with lower limit 0.15, upper limit 0.96) being the economic trust mediating the relationship between hedonic value and satisfaction, which supports H10. Therefore, economic trust acts as a mechanism that relates hedonic value and consumer satisfaction, that is, in a retail context, the hedonic value depends on the consumer’s economic confidence to influence satisfaction. Thus, it is also reasonable to understand that the decline in economic confidence would make hedonic value no longer influence satisfaction.
Finally, it is possible to verify the relevant influences in this study of the attributes of the retail cluster on the hedonic and utilitarian value. That is, when the consumer positively evaluates the service, he feels that his purchase will have more hedonic value (H1: Г = 0.194, t = 3.117) and utility (H2: Г = 0.186, t = 2.617). We observed that the higher the price, the greater the sense of hedonic value in the shopping experience (H3: Г = 0.187, t = 3.145).
The results suggest that the relationship between price and hedonic value is due to prices raising perceived quality and a possibility of symbolic purchase as discussed by Allen (2006), or it also refers to a certain relativization of the perceptions of hedonic and utilitarian values evidenced by Griffin et al. (2000). However, the higher the price, the lower the utility value of the purchase (H4: Г = -0.121, t = 2.079). The object of study is a typically hedonic site. The same is true when one perceives a greater crowding (crowding perception), as this gives rise to a lower hedonic value (H7: Г = 0.451, t = 10.396), but higher utility value (H8: Г = 0.612, t = 15.326). This last point, referring to the influence of the crowding perception requires thinking about the specific context of purchases in agglomerates retailers. Given that different consumers may perceive greater hedonic or utility value in the same purchasing environment, in this work only the direct relations between crowding perception and high prices with hedonic and utility value were tested, but it makes sense to think that the interaction between crowding perception and high prices could differentiate subsets of stores within the same cluster.
7. CONCLUSIONS AND RECOMMENDATIONSThis work shows its pertinence given the relevance of the study of retail clusters in the field of
market research, as it is an important solution in the retail contexts of developed and emerging economies. It is still an option that should be understood as part of the urban structures that keep the streets alive and the neighborhoods and communities more pleasant for both locals and people who pass by. With a more focused look at the condition of a market in economic crisis, the relevance of studies on retail clusters becomes even more evident as consumer responses are adjusted, in part, by economic confidence. The relationship between hedonic value and satisfaction depends on the consumer’s economic confidence. This may mean that, at the street level, consumers are more satisfied in stores that claim to have overall higher hedonic value when they have greater economic confidence. From the consumer point of view, this result suggests that they are not subject to the promotional and hedonic incentive appeals that seek to generate more consumption. However, if we consider retailers operating at popular retailers their strategies to make purchases less utilitarian and more hedonic may lose efficiency in economic crisis environments, given the lower economic confidence of consumers.
This study presents relevant methodological aspects, since a real sample was used, being careful to invite respondents who have just made their purchase, that is, still under the effects of the perceptions generated by the shopping experience, and still in the environment of the unplanned retail cluster.
16
603
It can be argued that high prices generate a greater hedonic value perception and an inverse thought suggests that more attractive prices do in fact generate greater perception of utilitarian value, for example, at a moment of purchase that generates joy, entertainment, or “treasure hunt” in a retail cluster. However, for the utility value dimension, high prices are not necessarily attractive because they decrease the expected result in the acquisition of the good and the fulfillment of the purchase task. Services are perceived positively both for the perception of hedonic value and utility, which suggests that the service is a benefit in the experience and task of purchase. It is interesting to note the opposite effect of crowding perception. For consumers with a perception of hedonic value, it was in the negative sense of the path coefficient, that is, it seems that the probable annoyance of a crowded and restricted place decreases the perception of hedonic value. Already for consumers with a perceived utility value, the crowding perception accentuated it, which seems to be a sign of a good shopping opportunity ahead.
The relationship between crowding perception and negative hedonic value perception should be better understood in future surveys of retail clusters, since this relationship in interaction with price perception could increase knowledge about market segmentation in retail clusters. Our explanation is supported by the sample profile (even 50% being class D, 80% have completed high school or more). Is the “March 25 party” (25 de Março street retail district) really a party or is it the “possible party day”? This would generate a more utilitarian than hedonic buying experience for consumers, or only reinforce discussions about the need to relativize the perception of utilitarian and hedonic values according to the consumer profile? Possible argument as the crowding perception increases the positive responses of its composition of people with social similarity (O’Guinn et al., 2015). The crowding perception as an environmental factor of the retail cluster, and not just one (moderator) condition. Retaking studies from the 1980s (a factor that interacts with all other humans and physicists) and reinforcing the need for contextual purchasing studies with due attention to the human factors of the environment. The characterization of the study sample shows a mostly female, young, and low-income public with a high school education or higher. This fact is in line with the previous research results of Teller and Elms (2010), whose downtown public was characterized in the same way, once again reinforcing the possible contribution of their scales to the conclusion of this study.
It is worth emphasizing that the economic trust variable deserves special mention, since in this study it represents a punctual perception, at a time of unfavorable economic and political conjuncture, capturing the evaluations of respondents who tend to be more homogeneous than desired.
A priority suggestion would be to replicate the study at different time periods, seeking to capture the perception of consumer confidence in different economic and political scenarios to compare the results in several economic cycles. In a way, by treating the variable as one-dimensional, there is evidence of some national optimism about economic projections, especially consumer personal finance. The temporal treatment can bring other important contributions to the analysis of the impact of this variable in the model.
This study served as an important contribution, including for the continuity of new research. The study by Teller and Elms (2010), can contribute in this sense, as it explored the attractiveness of the unplanned retail cluster in the city center, based on similar and complementary attributes to those used in this study. New and important attributes of attractiveness (Teller & Elms, 2010; Parente et al., 2012), should be considered, such as accessibility, parking conditions, variety of retail and non-retail stores, variety of products, value of merchandise, sales personnel, orientation and infrastructure. It is also worth investigating the mediating role (full or partial) of consumer
16
604
confidence in the relationships between attributes of the buying environment (agglomerates or stores) and consumer responses. Does trust or lack of it in the economic environment affect the perception of the consumers’ response, regardless of the efforts of the retailer? What is the size of consumer adjustment based on your confidence in the economic environment?
When starting to have access to a wide variety of purchase options, it is considered that it is possible for the low-income consumer to perceive more hedonic value in a store than to the high-income consumer in the buying process, that is, you can feel greater pleasure when conquering access to purchases (Brandão & Parente, 2012). Utility consumer prefers cleaner and moderately crowded shopping places in both unplanned and unplanned retail clusters.
REFERENCESAllen, M. W. (2006, Nov.) A dual-process model of the influence of human values on consumer
choice. Revista Psicologia: Organizações e Trabalho, Florianópolis, 6(1), 15-49.Babin, B. J., Darden, W. R., & Griffin, M. (1994, Mar.). Work and/or fun: Measuring hedonic
and utilitarian shopping value. Journal of Consumer Research, 20, 644-56.Baker, J., Parasuraman, A., Grewal, D., & Voss, G. B. (2002). The influence of multiple store
environment cues on perceived merchandise value and patronage intentions. Journal of Marketing, 66, 120-141.
Bateson, J. E. G., & Hui, M. K. (1987). A model for crowding in the service experience: Empirical findings. American Marketing Association, 85-90.
Bowman, D., & Narayandas, D. (2004). Linking customer management effort to customer profitability in business markets. Journal of Marketing Research, 41, 433-447.
Brandão, M. M. (2012). Crowding no varejo: Diferenças na satisfação e percepção de valor hedônico de consumidores de alta e baixa renda no Brasil (Tese de doutorado). Fundação Getúlio Vargas, Escola de Administração de Empresas de São Paulo, São Paulo, SP, Brasil.
Brandão, M. M., & Parente, J. (2012). Brasileiro gosta de “muvuca”? Impacto da densidade humana no comportamento de compra. RAE, 52(6), 613-627, São Paulo.
Brandão, M. M., Parente, J., & Oliveira, B. B. (2010). Percepção de crowding no varejo: Uma investigação exploratória no mercado brasileiro. RAE-eletrônica, 9(2), art. 11.
Bruner II, G. C. (2009). Marketing Scales Handbook, V5. GCBII Productions Carbondale, Illinois USA.
CHIN, W. W. The partial least squares approach for structural equation modeling. In Marcoulides, G.A. (Ed.). Modern methods for business research. London: Lawrence Erlbaum Associates, p. 295-236, 1998.
Chitturi, R., Rajagopal R., & Vijay, M. (2008). Delight by design: The role of hedonic versus utilitarian benefits. Journal of Marketing, 72(3), 48-63.
Cohen, J. (1988). Statistical power analysis for the behavioral sciences. Psychology Press (2nd ed.). New York.
Cronin JR., J. J., Brady, M. K., & Hult, G. T. M. (2000). Assessing the effects of quality, value, and customer satisfaction on consumer behavioral intentions in service environments. Journal of Retailing, 76(2), 193-218.
Das, G., Mukherjee, A., & Smith, R. J. (2017). The Perfect Fit: The Moderating Role of Selling Cues on Hedonic and Utilitarian Product Types, Journal of Retailing.
16
605
Deleersnyder, B., Dekimpe, M. G., Sarvary, M., & Parker, P. M. (2004). Weathering tight economic times: The sales evolution of consumer durables over the business cycle. Marketing Science Institute – MSI, (04-002), Working Paper Series, Issue two.
Dion, D. (2004). Personal control and coping with retail crowding. International Journal of Service Industry Management, 15(3), 250-263.
Dolega, L. M., & Pavlis, A. S. (2015). Estimating attractiveness, hierarchy and catchment area extents for a national set of retail centre agglomerations. Journal of Retailing and Consumer Services, 28, 78-90.
Eisenbeiss, M., Corneliben, M., Backhauss, K., & Hoyer, W. D. (2014). Non linear and asymmetric returns on customer satisfaction: do they vary across situations and consumers? Journal of Academy Marketing Science, 42, 242-263, Austin, Texas, USA.
Eroglu, S. A., Machleit, K., & Barr, T. F. (2005). Perceived retail crowding and shopping satisfaction: the role of shopping values. Journal of Business Research, 58, 1146-1153.
Ferreira, M. C. O., Brandão, M. M., & Bizarrias, F. S. (2017). Undestanding consumer´s responses to negative emotions related to crowding on satisfaction and impulse purchase in retail: the mediating role of coping. RAUSP Management Journal, Revista de Administração, 52, 431-442.
Fornell, C., & Larcker, D. F. Evaluating structural equation models with unobservable variables and measurement error. Journal of Marketing Research, 18(1), 39-50, 1981.
Griffin, M., Babin, B. J., & Modianos, D. (2000). Shopping values of russian consumers: The impacto of habituation in a developing economy. Journal of Retailing, 76(1), 33-52.
Hair, J. F., Hult, G. T. M., Ringle, C., & Sarstedt, M. A. (2014). Primer on partial least squares structural equation modeling (PLS-SEM). Los Angeles: SAGE Publications.
Harris, L. C., & Goode, M. M. H. (2004). The four levels of loyalty and the pivotal role of trust: A study of online service dynamics. Journal of Retailing, 80(2), 139-158.
Hayes, A. F. (2013). Introduction to mediation, moderation, and conditional process analysis: A regression-based approach. New York: Guilford Press.
Homburg, C., Koschate, N., & Hoyer W. D. (2005). Do satisfied customers really pay more? A study of the relationship between customer satisfaction and willingness to pay. Journal of Marketing, 69, 84-96.
Hunneman, A., Verhoef, P. C., & Sloot, L. M. (2015). The impact of consumer confidence on store satisfaction and share of wallet formation. Journal of Retailing, 91(3), 516-532, New York University.
Ikeda, A. A., & Veludo-De-Oliveira, T. M. (2005). O conceito de valor para o cliente: definições e implicações gerenciais em marketing. REAd (44th ed.), 11(2).
Kalish, S., & Nelson, P. (1991). A comparison of ranking, rating and reservation price measurement in conjoint analysis. Marketing Letters, 2(4), 327-335.
Lopes, E. L., Teixeira, J. M., & Moretti, S. L. A. (2012). Valor de compra hedônico ou utilitário e sua influência no varejo: Resultados de um survey no setor de construção civil. Revista O&SUFBA, 19(60), 87-108, Salvador.
Lloyd, A. E., Chan, R., Yip, L., Chan, A. (2014). Time buying and time saving: effects on service convenience and the shopping experience at the mall. Journal of Services Marketing, 28, 36-49.
Machleit, K. A. (2005). Perceived retail crowding and shopping satisfaction: the role of shopping values. Journal of Business Research, 58, p. 1146-1153.
16
606
Mehta, R. (2013). Understanding perceived retail crowding: A critical review and research agenda. Journal of Retailing and Consumer Services, 20, 642-649.
O´Guinn, T. C., Tanner, R. J., & Maeng, A. (2015). Turning to space: Social density, social class, and the value of things in stores. Journal of Consumer Research, 42.
Parente, J., Brandão, M. M., Miotto, A. P., & Plutarco, F. (2012). Polos varejistas de rua ou shopping centers? Comparando as preferências da baixa renda. BBR – Brazilian Business Review, 162-189, Edição Especial BBR Conference, Vitória-ES.
Quezado, I., Costa, R. B. L., & Fuentes, V. L. P. (2014). Aglomeração e valor de compra em centros de consumo de baixa renda. Rev. Adm., 7(1), 49-64, UFSM, Santa Maria.
Reimers, V., & Chao, F. (2014). The role of convenience in a recreational shopping trip. European Journal of Marketing, 48, 2213-2236.
Reinartz, W. J., & Kumar, V. (2003). Customer relationship characteristics on profitable lifetime duration. Journal of Marketing, 67, 77-99.
Ringle, C., Silva, D., & Bido, D. (2014). Modelagem de equações estruturais com utilização do SmartPLS. Brazilian Journal of Marketing – BJM, Revista Brasileira de Marketing – ReMark, 13(2), Edição Especial.
Silva, M. A. B., Albuquerque, R. A. F., Brandão, M. M., & Pedron, C. B. (2014). Na cidade pequena a loja com “muvuca” é pior ou melhor do que na cidade grande? XVII SEMEAD – Seminários de Administração.
Sobel, M. E. (1982). Asymptotic confidence intervals for indirect effects in structural equation models. Sociological Methodology, 13, 290-312.
Souza, H. A. R., Santos, A., & Brandão, M. M. (2014). Explorando o ambiente de loja para pequenos varejos. Anais do III SINGEP e II S2IS, São Paulo, SP, Brasil.
Steenkamp, J. B. E. M., & Wedel, M. (1991). Segmenting retail markets on store image using a consumer-based methodology. Journal of Retailing, 67(3), 300-20.
Teller, C., & Elms, J. (2010). Managing the attractiveness of evolved and created retail agglomerations formats. Marketing Intelligence & Planning, 28(1), 25-45.
Teller, C., & Schnedlitz, P. (2012). Drivers of agglomeration effects in retailing: The shopping mall tenant’s perspective. Journal of Marketing Management, 28(9-10), 1043-1061.
Teller, C., Reutterer, T., & Schnedlitz, P. (2008). Urban place marketing and retail agglomeration customers. The International Review of Retail, Distribution and Consumer Research, 18(3), 283-309.
Turley, L. W., & Milliman, R. E. (2000). Atmospheric effects on shopping behavior: A review of the experimental evidence. Journal of Business Research, 49, 193-211.
Zeithaml, V. A. (1988). Consumer perceptions of price, quality, and value: A means-end model and synthesis of evidence. Journal of Marketing, 52(3), 2-22.