Relevance of Primary γ′ Dissolution … · Relevance of Primary £¤ Dissolution and Abnormal...
9
Relevance of Primary £ ¤ Dissolution and Abnormal Grain Growth in UDIMET 720LI Jiayu Chen + , Panda Zhang, Jianxin Dong, Maicang Zhang and Zhihao Yao School of Materials, University of Science and Technology Beijing, Beijing 100083, China The relevance of the dissolution behavior of the primary £ A phase and abnormal grain growth in UDIMET 720LI (U720LI) alloy was studied under various heat treatment conditions and through corresponding simulation based on the classical dynamic model using MATLAB TM . The results indicated that the dissolution kinetics and volume fraction of the dissolved primary £ A phase increased by increasing the dissolution temperature. Additionally, an increase temperature promoted abnormal grain growth. Fine and coarse grains randomly mixed during the temperature range of 1155°C to 1170°C. The dissolution mechanism was rationalized, with the elastic splitting of the primary £ A phase involved in the early stage of the dissolution process. The dissolution process of the primary £ A phase was dominated by the diffusion mechanism in the latter stages. The dissolution-sensitive temperature range which should be avoid to inhibit the abnormal grain growth was given. Simulation results were consistent with the experimental data and thus the classical dynamic model was further used to investigate the influence of Al and Ti content on the dissolution behavior of the primary £ A phase. With an increase in Al and Ti content, the full dissolution time decreased, whereas volume fraction of the primary £ A phase increased. Volume fraction of the primary £ A phase was more affected by variation of Al content than Ti content. In terms of the impact on the full dissolution time of the primary £ A phase, there was no obvious difference between same variation of Al content and Ti content. Trends in the changes of the dissolution-sensitive temperature range under various Al and Ti contents were also given in this paper. [doi:10.2320/matertrans.M2015283] (Received July 9, 2015; Accepted September 29, 2015; Published November 25, 2015) Keywords: superalloy, dissolution, abnormal grain growth, dynamic modeling 1. Introduction U720LI is an age-hardening nickel-based superalloy with high strength, corrosion resistance and high-temperature endurance, which is used in turbine disks in the temperature range of 650-750°C for long-time service and at 900°C for short-time service. The total content of strengthening elements accounts for 14%, and volume fraction of the £ A phase is up to 40%³50%. The microstructure of U720LI consists of a primary £ A phase, a secondary £ A phase and a tertiary £ A phase. 1,2) The mechanical properties of the alloy are deeply influenced by the content of these three different £ A phases. 1,3) Abnormal grain growth leads to the mixed structure of fine and coarse grains, which degrades the fatigue resistance. Humphreys 4) studied the influence of the pinning force of the second phase and the driving force of grain growth on abnormal grain growth. His research showed that abnormal grain growth happens when volume fraction of the second phase is in the range of 0.05³0.3. Thus, volume fraction of the dissolving primary £ A phase needs to be studied to avoid the existence of an uneven distribution of the primary £ A phase, which can induce a mixed structure. Blavette, Bostel and Sarrau 5) analyzed the composition of the £ A phase through electron probe micro-analysis and suggested that the contents of Al and Ti in large-sized £ A phases were higher than the contents of Al and Ti in small-sized £ A phases. Small-sized £ A phases dissolved at a lower temperature during heat treatment, whereas large-sized £ A phases dissolved at a higher temperature. Previous studies on the behavior of £ A phases were investigated based on the thermodynamic calculation and experimental experiment which made it difficult to control the grain size. Due to high volume fractions of £ A phases in UDIMET 720LI complicate the dissolution process of £ A phases, the relevance of volume fraction of the second phase, abnormal grain growth and dissolution temperature range leading to the abnormal grain growth based on the dynamic model have not been studied. Because of the varied size distribution of the £ A phase in U720LI, the dissolution process of the £ A phase occurred in the temperature range near the £ A solvus temperature. Temperature fluctuations within the temperature range led to significant changes in volume fraction of the primary £ A phase. As the secondary and tertiary £ A phases fully dissolved during the solution treatment and reprecipitated in the subsequent aging treatment, 6,7) great changes in volume fraction of the dissolved primary £ A phase during this temperature range caused subsequent changes in volume fraction of the secondary and tertiary £ A precipitates. Therefore, this phenomenon caused remarkable changes in properties that was sensitive to volume fraction of the £ A phase, such as creep resistance. Meanwhile, the dissolution behavior of the £ A phase was sensitive to the solution temperature and time around the £ A solvus temperature which led to the occurrence of the abnormal grain growth during the temperature range and this temperature range was named dissolution-sensitive temperature range. To optimize the mechanical performance, the aim of this study is to investigate the relevance of the dissolution process of the primary £ A phase and the abnormal grain growth during solution treatment so as to give a guiding temperature range to inhibit the existence of the mixed structure. Furthermore, the influence of the contents of Al and Ti on the dissolution-sensitive temperature range is also studied in this paper. The microstructures of samples solution treated at different temperatures and for various durations were studied and a relevant dissolution mechanism was rationalized in this paper. According to the parameters of the thermodynamic + Graduate Student, University of Science and Technology Beijing. Corresponding author, E-mail: chenjiayu975@126.com Materials Transactions, Vol. 56, No. 12 (2015) pp. 1968 to 1976 © 2015 The Japan Institute of Metals and Materials
-
Upload
trinhduong -
Category
Documents
-
view
221 -
download
0
Transcript of Relevance of Primary γ′ Dissolution … · Relevance of Primary £¤ Dissolution and Abnormal...
Relevance of Primary £ ¤ Dissolution and Abnormal Grain Growthin UDIMET 720LI
Jiayu Chen+, Panda Zhang, Jianxin Dong, Maicang Zhang and Zhihao Yao
School of Materials, University of Science and Technology Beijing, Beijing 100083, China
The relevance of the dissolution behavior of the primary £ A phase and abnormal grain growth in UDIMET 720LI (U720LI) alloy wasstudied under various heat treatment conditions and through corresponding simulation based on the classical dynamic model using MATLABTM.The results indicated that the dissolution kinetics and volume fraction of the dissolved primary £ A phase increased by increasing the dissolutiontemperature. Additionally, an increase temperature promoted abnormal grain growth. Fine and coarse grains randomly mixed during thetemperature range of 1155°C to 1170°C. The dissolution mechanism was rationalized, with the elastic splitting of the primary £ A phase involvedin the early stage of the dissolution process. The dissolution process of the primary £ A phase was dominated by the diffusion mechanism in thelatter stages. The dissolution-sensitive temperature range which should be avoid to inhibit the abnormal grain growth was given. Simulationresults were consistent with the experimental data and thus the classical dynamic model was further used to investigate the influence of Al and Ticontent on the dissolution behavior of the primary £ A phase. With an increase in Al and Ti content, the full dissolution time decreased, whereasvolume fraction of the primary £ A phase increased. Volume fraction of the primary £ A phase was more affected by variation of Al content than Ticontent. In terms of the impact on the full dissolution time of the primary £ A phase, there was no obvious difference between same variation of Alcontent and Ti content. Trends in the changes of the dissolution-sensitive temperature range under various Al and Ti contents were also given inthis paper. [doi:10.2320/matertrans.M2015283]
(Received July 9, 2015; Accepted September 29, 2015; Published November 25, 2015)
Keywords: superalloy, dissolution, abnormal grain growth, dynamic modeling
1. Introduction
U720LI is an age-hardening nickel-based superalloy withhigh strength, corrosion resistance and high-temperatureendurance, which is used in turbine disks in the temperaturerange of 650750°C for long-time service and at 900°C forshort-time service. The total content of strengtheningelements accounts for 14%, and volume fraction of the £ Aphase is up to 40%³50%. The microstructure of U720LIconsists of a primary £ A phase, a secondary £ A phase and atertiary £ A phase.1,2) The mechanical properties of the alloyare deeply influenced by the content of these three different£ A phases.1,3)
Abnormal grain growth leads to the mixed structure of fineand coarse grains, which degrades the fatigue resistance.Humphreys4) studied the influence of the pinning force ofthe second phase and the driving force of grain growth onabnormal grain growth. His research showed that abnormalgrain growth happens when volume fraction of the secondphase is in the range of 0.05³0.3. Thus, volume fraction ofthe dissolving primary £ A phase needs to be studied to avoidthe existence of an uneven distribution of the primary £ Aphase, which can induce a mixed structure. Blavette, Bosteland Sarrau5) analyzed the composition of the £ A phasethrough electron probe micro-analysis and suggested that thecontents of Al and Ti in large-sized £ A phases were higherthan the contents of Al and Ti in small-sized £ A phases.Small-sized £ A phases dissolved at a lower temperatureduring heat treatment, whereas large-sized £ A phasesdissolved at a higher temperature. Previous studies on thebehavior of £ A phases were investigated based on thethermodynamic calculation and experimental experimentwhich made it difficult to control the grain size. Due to high
volume fractions of £ A phases in UDIMET 720LI complicatethe dissolution process of £ A phases, the relevance of volumefraction of the second phase, abnormal grain growth anddissolution temperature range leading to the abnormal graingrowth based on the dynamic model have not been studied.Because of the varied size distribution of the £ A phase inU720LI, the dissolution process of the £ A phase occurredin the temperature range near the £ A solvus temperature.Temperature fluctuations within the temperature range ledto significant changes in volume fraction of the primary £ Aphase. As the secondary and tertiary £ A phases fully dissolvedduring the solution treatment and reprecipitated in thesubsequent aging treatment,6,7) great changes in volumefraction of the dissolved primary £ A phase during thistemperature range caused subsequent changes in volumefraction of the secondary and tertiary £ A precipitates.Therefore, this phenomenon caused remarkable changes inproperties that was sensitive to volume fraction of the £ Aphase, such as creep resistance. Meanwhile, the dissolutionbehavior of the £ A phase was sensitive to the solutiontemperature and time around the £ A solvus temperature whichled to the occurrence of the abnormal grain growth during thetemperature range and this temperature range was nameddissolution-sensitive temperature range. To optimize themechanical performance, the aim of this study is toinvestigate the relevance of the dissolution process of theprimary £ A phase and the abnormal grain growth duringsolution treatment so as to give a guiding temperaturerange to inhibit the existence of the mixed structure.Furthermore, the influence of the contents of Al and Ti onthe dissolution-sensitive temperature range is also studied inthis paper.
The microstructures of samples solution treated at differenttemperatures and for various durations were studied and arelevant dissolution mechanism was rationalized in thispaper. According to the parameters of the thermodynamic
+Graduate Student, University of Science and Technology Beijing.Corresponding author, E-mail: [email protected]
Materials Transactions, Vol. 56, No. 12 (2015) pp. 1968 to 1976©2015 The Japan Institute of Metals and Materials
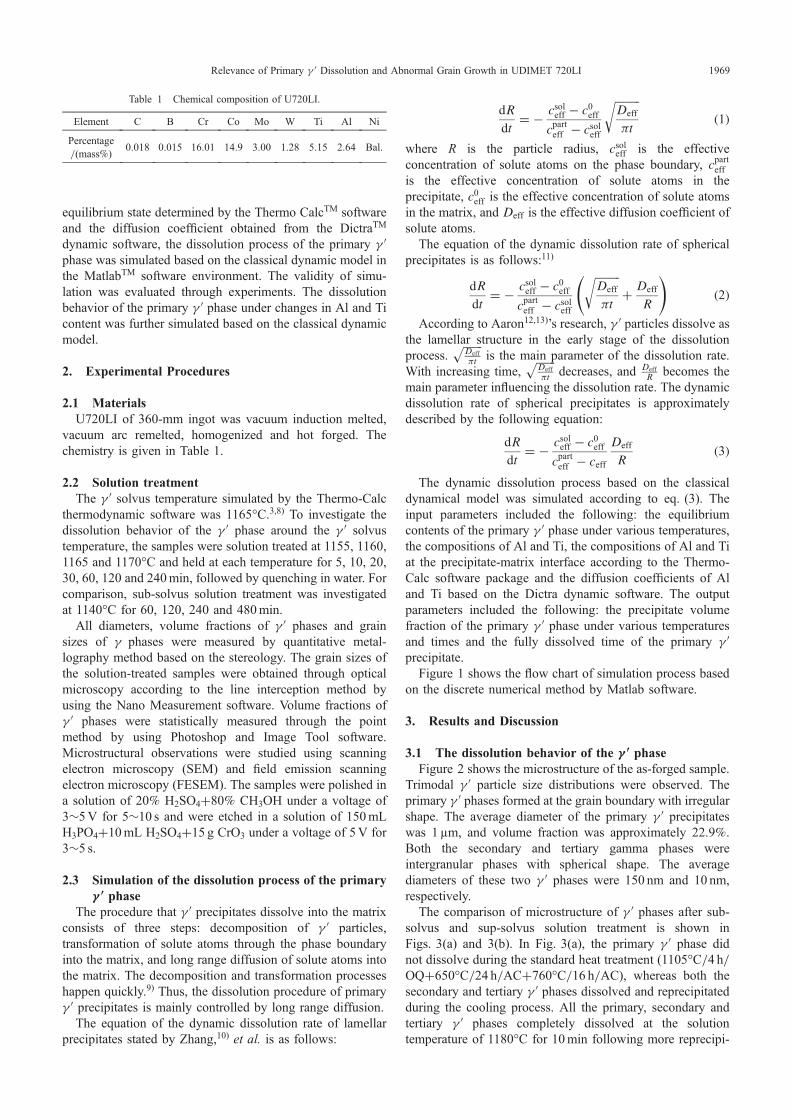
equilibrium state determined by the Thermo CalcTM softwareand the diffusion coefficient obtained from the DictraTM
dynamic software, the dissolution process of the primary £ Aphase was simulated based on the classical dynamic model inthe MatlabTM software environment. The validity of simu-lation was evaluated through experiments. The dissolutionbehavior of the primary £ A phase under changes in Al and Ticontent was further simulated based on the classical dynamicmodel.
2. Experimental Procedures
2.1 MaterialsU720LI of 360-mm ingot was vacuum induction melted,
vacuum arc remelted, homogenized and hot forged. Thechemistry is given in Table 1.
2.2 Solution treatmentThe £ A solvus temperature simulated by the Thermo-Calc
thermodynamic software was 1165°C.3,8) To investigate thedissolution behavior of the £ A phase around the £ A solvustemperature, the samples were solution treated at 1155, 1160,1165 and 1170°C and held at each temperature for 5, 10, 20,30, 60, 120 and 240min, followed by quenching in water. Forcomparison, sub-solvus solution treatment was investigatedat 1140°C for 60, 120, 240 and 480min.
All diameters, volume fractions of £ A phases and grainsizes of £ phases were measured by quantitative metal-lography method based on the stereology. The grain sizes ofthe solution-treated samples were obtained through opticalmicroscopy according to the line interception method byusing the Nano Measurement software. Volume fractions of£ A phases were statistically measured through the pointmethod by using Photoshop and Image Tool software.Microstructural observations were studied using scanningelectron microscopy (SEM) and field emission scanningelectron microscopy (FESEM). The samples were polished ina solution of 20% H2SO4+80% CH3OH under a voltage of3³5V for 5³10 s and were etched in a solution of 150mLH3PO4+10mL H2SO4+15 g CrO3 under a voltage of 5V for3³5 s.
2.3 Simulation of the dissolution process of the primary£ ¤ phase
The procedure that £ A precipitates dissolve into the matrixconsists of three steps: decomposition of £ A particles,transformation of solute atoms through the phase boundaryinto the matrix, and long range diffusion of solute atoms intothe matrix. The decomposition and transformation processeshappen quickly.9) Thus, the dissolution procedure of primary£ A precipitates is mainly controlled by long range diffusion.
The equation of the dynamic dissolution rate of lamellarprecipitates stated by Zhang,10) et al. is as follows:
dR
dt¼ � csoleff � c0eff
cparteff � csoleff
ffiffiffiffiffiffiffiffiffiDeff
³t
rð1Þ
where R is the particle radius, csoleff is the effectiveconcentration of solute atoms on the phase boundary, cparteff
is the effective concentration of solute atoms in theprecipitate, c0eff is the effective concentration of solute atomsin the matrix, and Deff is the effective diffusion coefficient ofsolute atoms.
The equation of the dynamic dissolution rate of sphericalprecipitates is as follows:11)
dR
dt¼ � csoleff � c0eff
cparteff � csoleff
ffiffiffiffiffiffiffiffiffiDeff
³t
rþ Deff
R
!ð2Þ
According to Aaron12,13)’s research, £ A particles dissolve asthe lamellar structure in the early stage of the dissolutionprocess.
ffiffiffiffiffiffiffiDeff
³t
pis the main parameter of the dissolution rate.
With increasing time,ffiffiffiffiffiffiffiDeff
³t
pdecreases, and Deff
R becomes themain parameter influencing the dissolution rate. The dynamicdissolution rate of spherical precipitates is approximatelydescribed by the following equation:
dR
dt¼ � csoleff � c0eff
cparteff � ceff
Deff
Rð3Þ
The dynamic dissolution process based on the classicaldynamical model was simulated according to eq. (3). Theinput parameters included the following: the equilibriumcontents of the primary £ A phase under various temperatures,the compositions of Al and Ti, the compositions of Al and Tiat the precipitate-matrix interface according to the Thermo-Calc software package and the diffusion coefficients of Aland Ti based on the Dictra dynamic software. The outputparameters included the following: the precipitate volumefraction of the primary £ A phase under various temperaturesand times and the fully dissolved time of the primary £ Aprecipitate.
Figure 1 shows the flow chart of simulation process basedon the discrete numerical method by Matlab software.
3. Results and Discussion
3.1 The dissolution behavior of the £ ¤ phaseFigure 2 shows the microstructure of the as-forged sample.
Trimodal £ A particle size distributions were observed. Theprimary £ A phases formed at the grain boundary with irregularshape. The average diameter of the primary £ A precipitateswas 1 µm, and volume fraction was approximately 22.9%.Both the secondary and tertiary gamma phases wereintergranular phases with spherical shape. The averagediameters of these two £ A phases were 150 nm and 10 nm,respectively.
The comparison of microstructure of £ A phases after sub-solvus and sup-solvus solution treatment is shown inFigs. 3(a) and 3(b). In Fig. 3(a), the primary £ A phase didnot dissolve during the standard heat treatment (1105°C/4 h/OQ+650°C/24 h/AC+760°C/16 h/AC), whereas both thesecondary and tertiary £ A phases dissolved and reprecipitatedduring the cooling process. All the primary, secondary andtertiary £ A phases completely dissolved at the solutiontemperature of 1180°C for 10min following more reprecipi-
Table 1 Chemical composition of U720LI.
Element C B Cr Co Mo W Ti Al Ni
Percentage/(mass%)
0.018 0.015 16.01 14.9 3.00 1.28 5.15 2.64 Bal.
Relevance of Primary £ A Dissolution and Abnormal Grain Growth in UDIMET 720LI 1969
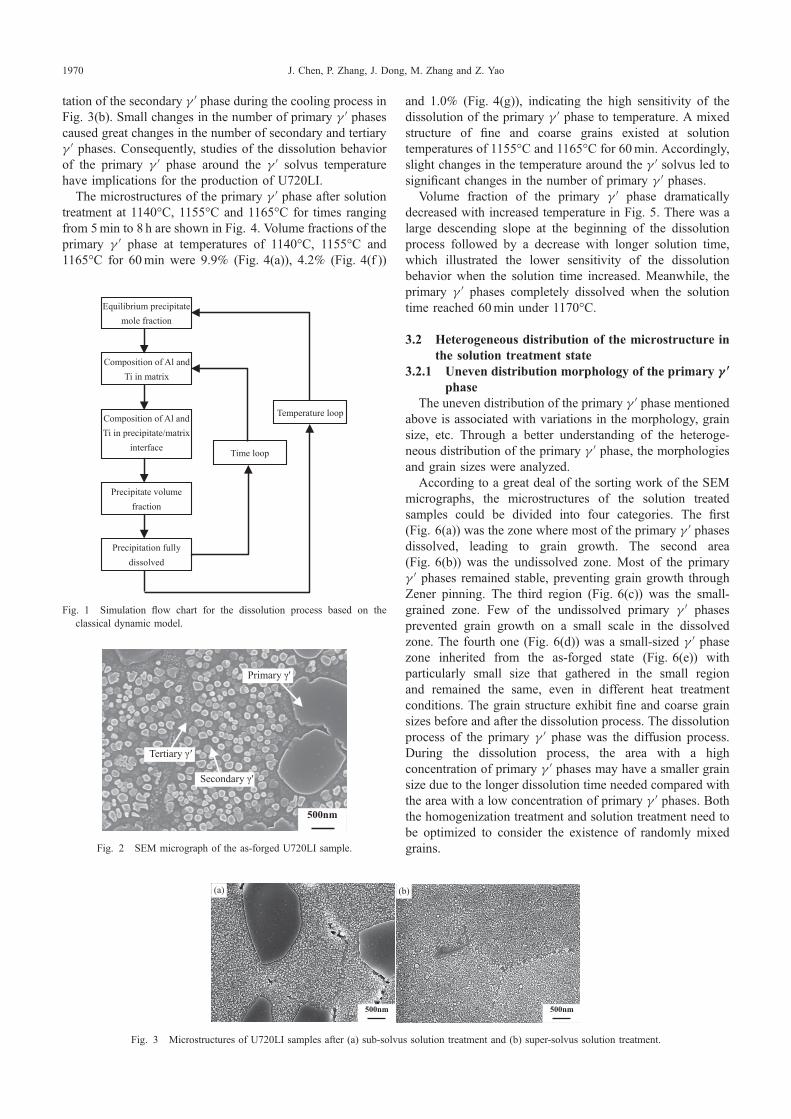
tation of the secondary £ A phase during the cooling process inFig. 3(b). Small changes in the number of primary £ A phasescaused great changes in the number of secondary and tertiary£ A phases. Consequently, studies of the dissolution behaviorof the primary £ A phase around the £ A solvus temperaturehave implications for the production of U720LI.
The microstructures of the primary £ A phase after solutiontreatment at 1140°C, 1155°C and 1165°C for times rangingfrom 5min to 8 h are shown in Fig. 4. Volume fractions of theprimary £ A phase at temperatures of 1140°C, 1155°C and1165°C for 60min were 9.9% (Fig. 4(a)), 4.2% (Fig. 4(f ))
and 1.0% (Fig. 4(g)), indicating the high sensitivity of thedissolution of the primary £ A phase to temperature. A mixedstructure of fine and coarse grains existed at solutiontemperatures of 1155°C and 1165°C for 60min. Accordingly,slight changes in the temperature around the £ A solvus led tosignificant changes in the number of primary £ A phases.
Volume fraction of the primary £ A phase dramaticallydecreased with increased temperature in Fig. 5. There was alarge descending slope at the beginning of the dissolutionprocess followed by a decrease with longer solution time,which illustrated the lower sensitivity of the dissolutionbehavior when the solution time increased. Meanwhile, theprimary £ A phases completely dissolved when the solutiontime reached 60min under 1170°C.
3.2 Heterogeneous distribution of the microstructure inthe solution treatment state
3.2.1 Uneven distribution morphology of the primary £ ¤phase
The uneven distribution of the primary £ A phase mentionedabove is associated with variations in the morphology, grainsize, etc. Through a better understanding of the heteroge-neous distribution of the primary £ A phase, the morphologiesand grain sizes were analyzed.
According to a great deal of the sorting work of the SEMmicrographs, the microstructures of the solution treatedsamples could be divided into four categories. The first(Fig. 6(a)) was the zone where most of the primary £ A phasesdissolved, leading to grain growth. The second area(Fig. 6(b)) was the undissolved zone. Most of the primary£ A phases remained stable, preventing grain growth throughZener pinning. The third region (Fig. 6(c)) was the small-grained zone. Few of the undissolved primary £ A phasesprevented grain growth on a small scale in the dissolvedzone. The fourth one (Fig. 6(d)) was a small-sized £ A phasezone inherited from the as-forged state (Fig. 6(e)) withparticularly small size that gathered in the small regionand remained the same, even in different heat treatmentconditions. The grain structure exhibit fine and coarse grainsizes before and after the dissolution process. The dissolutionprocess of the primary £ A phase was the diffusion process.During the dissolution process, the area with a highconcentration of primary £ A phases may have a smaller grainsize due to the longer dissolution time needed compared withthe area with a low concentration of primary £ A phases. Boththe homogenization treatment and solution treatment need tobe optimized to consider the existence of randomly mixedgrains.
Primary γ′
500nm
Secondary γ′
Tertiary γ′
Fig. 2 SEM micrograph of the as-forged U720LI sample.
Time loop
Equilibrium precipitate mole fraction
Composition of Al and Ti in matrix
Precipitate volume fraction
Precipitation fully dissolved
Composition of Al and Ti in precipitate/matrix
interface
Temperature loop
Fig. 1 Simulation flow chart for the dissolution process based on theclassical dynamic model.
(a)
500nm
(b)
500nm
Fig. 3 Microstructures of U720LI samples after (a) sub-solvus solution treatment and (b) super-solvus solution treatment.
J. Chen, P. Zhang, J. Dong, M. Zhang and Z. Yao1970
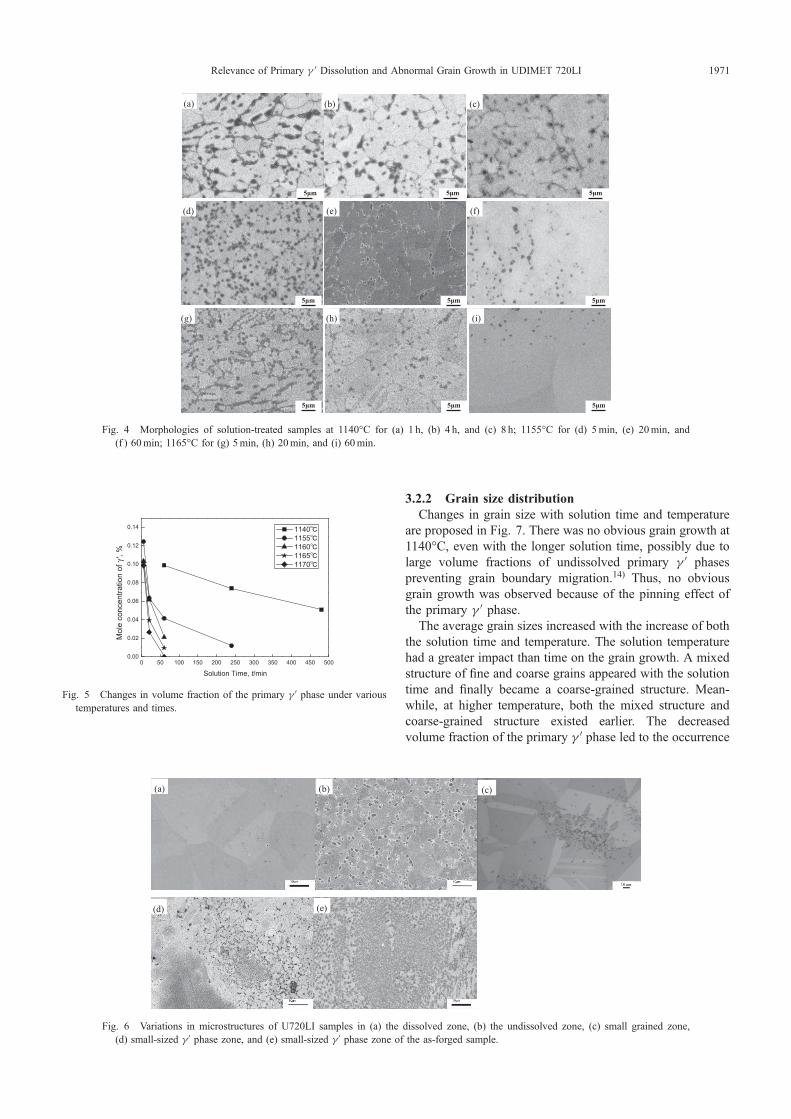
3.2.2 Grain size distributionChanges in grain size with solution time and temperature
are proposed in Fig. 7. There was no obvious grain growth at1140°C, even with the longer solution time, possibly due tolarge volume fractions of undissolved primary £ A phasespreventing grain boundary migration.14) Thus, no obviousgrain growth was observed because of the pinning effect ofthe primary £ A phase.
The average grain sizes increased with the increase of boththe solution time and temperature. The solution temperaturehad a greater impact than time on the grain growth. A mixedstructure of fine and coarse grains appeared with the solutiontime and finally became a coarse-grained structure. Mean-while, at higher temperature, both the mixed structure andcoarse-grained structure existed earlier. The decreasedvolume fraction of the primary £ A phase led to the occurrence
(a) (b) (c)
5μm 5μm 5μm
5μm 5μm 5μm
(d) (e) (f)
(g) (h) (i)
5μm 5μm 5μm
Fig. 4 Morphologies of solution-treated samples at 1140°C for (a) 1 h, (b) 4 h, and (c) 8 h; 1155°C for (d) 5min, (e) 20min, and(f ) 60min; 1165°C for (g) 5min, (h) 20min, and (i) 60min.
0 50 100 150 200 250 300 350 400 450 5000.00
0.02
0.04
0.06
0.08
0.10
0.12
0.14
Mol
e co
ncen
tratio
n of
γ',
%
Solution Time, t/min
1140 1155 1160 1165 1170
Fig. 5 Changes in volume fraction of the primary £ A phase under varioustemperatures and times.
(a) (b) (c)
V
(d) (e)
Fig. 6 Variations in microstructures of U720LI samples in (a) the dissolved zone, (b) the undissolved zone, (c) small grained zone,(d) small-sized £ A phase zone, and (e) small-sized £ A phase zone of the as-forged sample.
Relevance of Primary £ A Dissolution and Abnormal Grain Growth in UDIMET 720LI 1971
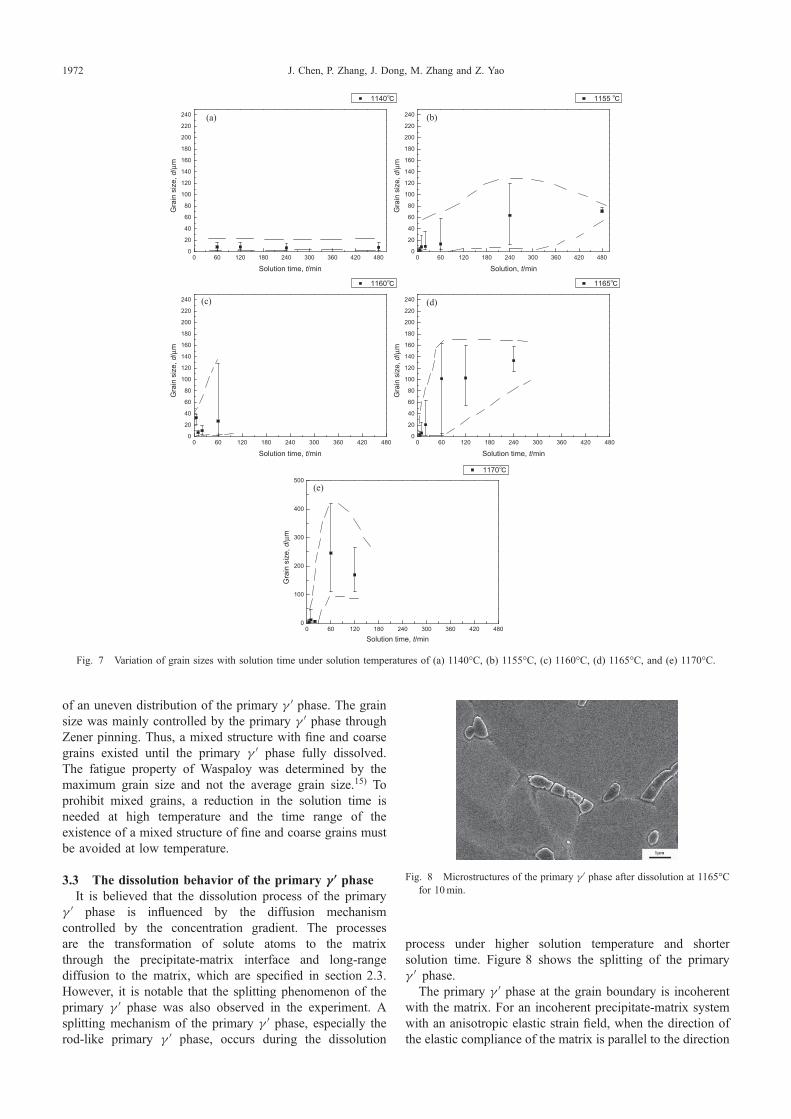
of an uneven distribution of the primary £ A phase. The grainsize was mainly controlled by the primary £ A phase throughZener pinning. Thus, a mixed structure with fine and coarsegrains existed until the primary £ A phase fully dissolved.The fatigue property of Waspaloy was determined by themaximum grain size and not the average grain size.15) Toprohibit mixed grains, a reduction in the solution time isneeded at high temperature and the time range of theexistence of a mixed structure of fine and coarse grains mustbe avoided at low temperature.
3.3 The dissolution behavior of the primary £ ¤ phaseIt is believed that the dissolution process of the primary
£ A phase is influenced by the diffusion mechanismcontrolled by the concentration gradient. The processesare the transformation of solute atoms to the matrixthrough the precipitate-matrix interface and long-rangediffusion to the matrix, which are specified in section 2.3.However, it is notable that the splitting phenomenon of theprimary £ A phase was also observed in the experiment. Asplitting mechanism of the primary £ A phase, especially therod-like primary £ A phase, occurs during the dissolution
process under higher solution temperature and shortersolution time. Figure 8 shows the splitting of the primary£ A phase.
The primary £ A phase at the grain boundary is incoherentwith the matrix. For an incoherent precipitate-matrix systemwith an anisotropic elastic strain field, when the direction ofthe elastic compliance of the matrix is parallel to the direction
0 60 120 180 240 300 360 420 4800
20
40
60
80
100
120
140
160
180
200
220
240
Gra
in s
ize,
d/μ
m
Solution time, t/min
1140
(a)
0 60 120 180 240 300 360 420 4800
20
40
60
80
100
120
140
160
180
200
220
240
Gra
in s
ize,
d/μ
m
Solution, t/min
1155
(b)
0 60 120 180 240 300 360 420 4800
20
40
60
80
100
120
140
160
180
200
220
240
Gra
in s
ize,
d/μ
m
Solution time, t/min
1160
(c)
0 60 120 180 240 300 360 420 4800
20
40
60
80
100
120
140
160
180
200
220
240
Gra
in s
ize,
d/μ
m
Solution time, t/min
1165
(d)
0 60 120 180 240 300 360 420 4800
100
200
300
400
500
Gra
in s
ize,
d/μ
m
1170
Solution time, t/min
(e)
Fig. 7 Variation of grain sizes with solution time under solution temperatures of (a) 1140°C, (b) 1155°C, (c) 1160°C, (d) 1165°C, and (e) 1170°C.
Fig. 8 Microstructures of the primary £ A phase after dissolution at 1165°Cfor 10min.
J. Chen, P. Zhang, J. Dong, M. Zhang and Z. Yao1972
of elastic stiffness of precipitate, two opposite elastic strainfields overlap at the precipitate-matrix interface, leading toelastic strain energy concentrated in some direction. Throughsimulation study of the secondary £ A phase within grains,Cha16) et al. observed that solute atoms in the matrix aroundthe interface are trapped into the £ A phase because of thecentralized distribution of the elastic strain energy. There-fore, grooves form in the edge of the £ A phase, whichpartly accelerate the dissolution of the £ A phase. Thus, thesplitting process is the intrusion of the matrix into the £ Aphase.
The splitting of the precipitate is influenced by manyfactors:1720) the initial size of the precipitate, the heattreatment temperature, the distortion energy caused bymismatch, etc. The essence of splitting is the diffusion ofsolute atoms. Accordingly, the temperature is the main reasonfor the splitting process. Lee21) suggested that the splittingrate increases with the increase of temperature, and splittingdoes not happen when the temperature is below the threshold.From these points of view, the diffusion dynamics of thesplitting process is more complicate.
A decrease in the sizes of the primary £ A phase and latticemisfit degree occurs with increased solution time, and themorphology also changes from lamellar to spherical. There-fore, the effect of the diffusion mechanism caused by theelastic strain field decreases, and the diffusion mechanismcaused by the concentration gradient dominates in the laterstage of the dissolution process.
According to the equation for the dynamic dissolution rateof spherical precipitates mentioned in section 2.3 and theanalysis of the dissolution mechanism of the primary £ Aphase, the lamellar precipitate dissolution model was used tosimulate the early stage of the dissolution process, and thespherical precipitate dissolution model was used in the laterstage of the dissolution process.
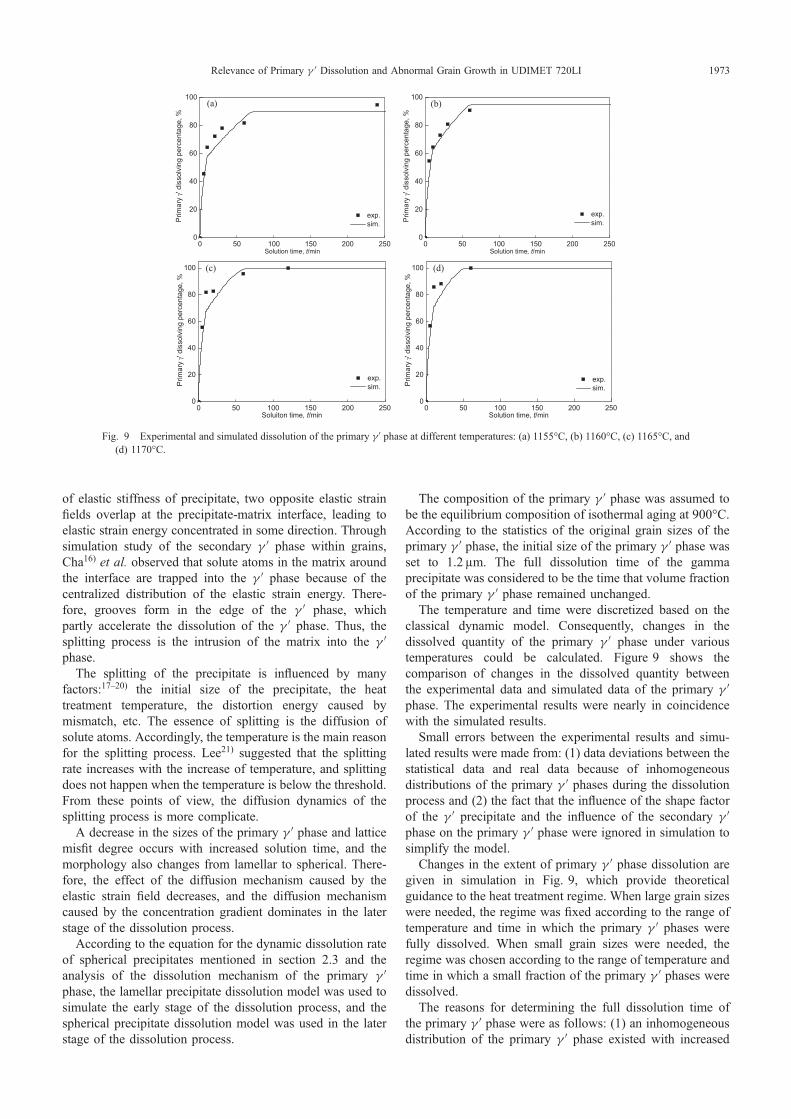
The composition of the primary £ A phase was assumed tobe the equilibrium composition of isothermal aging at 900°C.According to the statistics of the original grain sizes of theprimary £ A phase, the initial size of the primary £ A phase wasset to 1.2 µm. The full dissolution time of the gammaprecipitate was considered to be the time that volume fractionof the primary £ A phase remained unchanged.
The temperature and time were discretized based on theclassical dynamic model. Consequently, changes in thedissolved quantity of the primary £ A phase under varioustemperatures could be calculated. Figure 9 shows thecomparison of changes in the dissolved quantity betweenthe experimental data and simulated data of the primary £ Aphase. The experimental results were nearly in coincidencewith the simulated results.
Small errors between the experimental results and simu-lated results were made from: (1) data deviations between thestatistical data and real data because of inhomogeneousdistributions of the primary £ A phases during the dissolutionprocess and (2) the fact that the influence of the shape factorof the £ A precipitate and the influence of the secondary £ Aphase on the primary £ A phase were ignored in simulation tosimplify the model.
Changes in the extent of primary £ A phase dissolution aregiven in simulation in Fig. 9, which provide theoreticalguidance to the heat treatment regime. When large grain sizeswere needed, the regime was fixed according to the range oftemperature and time in which the primary £ A phases werefully dissolved. When small grain sizes were needed, theregime was chosen according to the range of temperature andtime in which a small fraction of the primary £ A phases weredissolved.
The reasons for determining the full dissolution time ofthe primary £ A phase were as follows: (1) an inhomogeneousdistribution of the primary £ A phase existed with increased
0
20
40
60
80
100(a)
exp.sim.P
rimar
yγ'
diss
olvi
ng p
erce
ntag
e, %
Solution time, t/min
0
20
40
60
80
100(b)
exp.sim.P
rimar
yγ'
diss
olvi
ng p
erce
ntag
e, %
Solution time, t/min
0
20
40
60
80
100 (c)
exp.sim.P
rimar
yγ '
diss
olvi
ng p
erce
ntag
e, %
Soluiton time, t/min
0 50 100 150 200 250 0 50 100 150 200 250
0 50 100 150 200 250 0 50 100 150 200 2500
20
40
60
80
100 (d)
exp.sim.P
rimar
yγ'
diss
olvi
ng p
erce
ntag
e, %
Solution time, t/min
Fig. 9 Experimental and simulated dissolution of the primary £ A phase at different temperatures: (a) 1155°C, (b) 1160°C, (c) 1165°C, and(d) 1170°C.
Relevance of Primary £ A Dissolution and Abnormal Grain Growth in UDIMET 720LI 1973
solution time. Thus, a mixed structure exists before theprimary £ A phases fully dissolve, which significantlydegrades the service life of the material. To remove themixed structure, the solution treatment time must be longerthan the full dissolution time of the primary £ A phases. (2)Grain coarsening occurs with increased solution time at hightemperature, which also degrades the mechanical perform-ance. The time of the solution treatment at high temperaturemust be shorter than the full dissolution time of the primary£ A phases to avoid grain coarsening.
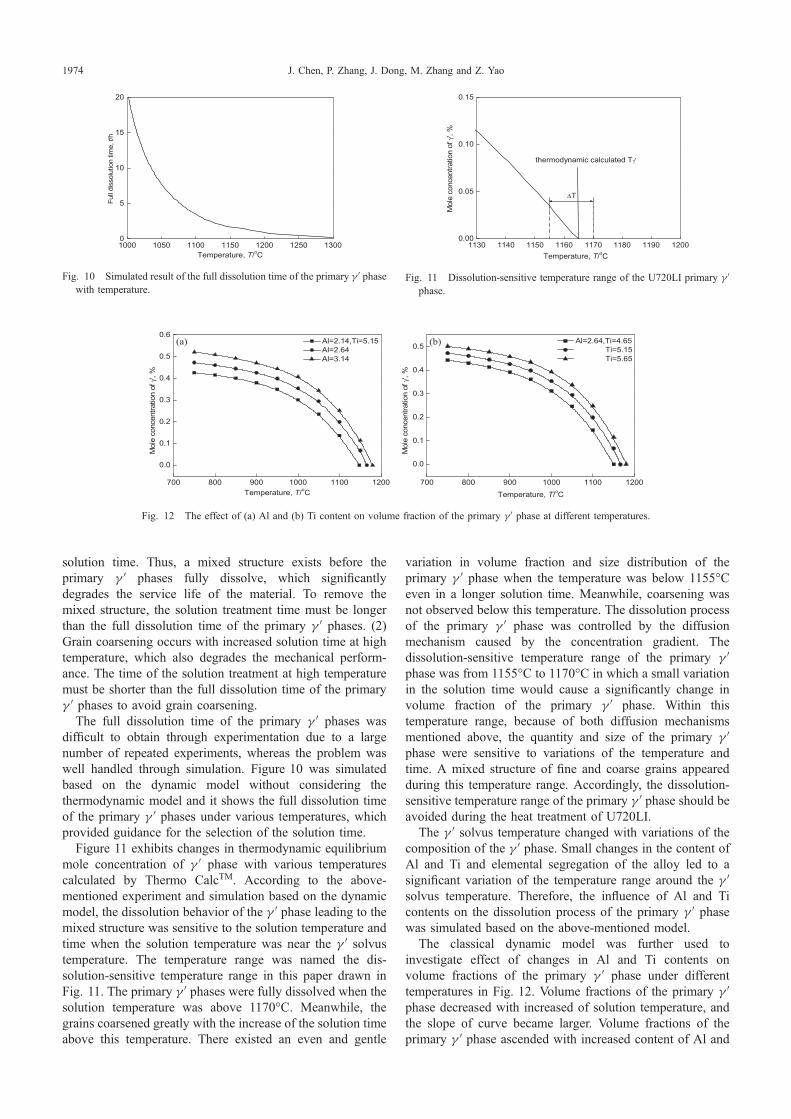
The full dissolution time of the primary £ A phases wasdifficult to obtain through experimentation due to a largenumber of repeated experiments, whereas the problem waswell handled through simulation. Figure 10 was simulatedbased on the dynamic model without considering thethermodynamic model and it shows the full dissolution timeof the primary £ A phases under various temperatures, whichprovided guidance for the selection of the solution time.
Figure 11 exhibits changes in thermodynamic equilibriummole concentration of £ A phase with various temperaturescalculated by Thermo CalcTM. According to the above-mentioned experiment and simulation based on the dynamicmodel, the dissolution behavior of the £ A phase leading to themixed structure was sensitive to the solution temperature andtime when the solution temperature was near the £ A solvustemperature. The temperature range was named the dis-solution-sensitive temperature range in this paper drawn inFig. 11. The primary £ A phases were fully dissolved when thesolution temperature was above 1170°C. Meanwhile, thegrains coarsened greatly with the increase of the solution timeabove this temperature. There existed an even and gentle
variation in volume fraction and size distribution of theprimary £ A phase when the temperature was below 1155°Ceven in a longer solution time. Meanwhile, coarsening wasnot observed below this temperature. The dissolution processof the primary £ A phase was controlled by the diffusionmechanism caused by the concentration gradient. Thedissolution-sensitive temperature range of the primary £ Aphase was from 1155°C to 1170°C in which a small variationin the solution time would cause a significantly change involume fraction of the primary £ A phase. Within thistemperature range, because of both diffusion mechanismsmentioned above, the quantity and size of the primary £ Aphase were sensitive to variations of the temperature andtime. A mixed structure of fine and coarse grains appearedduring this temperature range. Accordingly, the dissolution-sensitive temperature range of the primary £ A phase should beavoided during the heat treatment of U720LI.
The £ A solvus temperature changed with variations of thecomposition of the £ A phase. Small changes in the content ofAl and Ti and elemental segregation of the alloy led to asignificant variation of the temperature range around the £ Asolvus temperature. Therefore, the influence of Al and Ticontents on the dissolution process of the primary £ A phasewas simulated based on the above-mentioned model.
The classical dynamic model was further used toinvestigate effect of changes in Al and Ti contents onvolume fractions of the primary £ A phase under differenttemperatures in Fig. 12. Volume fractions of the primary £ Aphase decreased with increased of solution temperature, andthe slope of curve became larger. Volume fractions of theprimary £ A phase ascended with increased content of Al and
0
5
10
15
20
Full
diss
olut
ion
time,
t /h
Temperature, T/oC1000 1050 1100 1150 1200 1250 1300
Fig. 10 Simulated result of the full dissolution time of the primary £ A phasewith temperature.
0.00
0.05
0.10
0.15
thermodynamic calculated Tγ'
Mol
e co
ncen
tratio
n of
γ', %
Temperature, T/oC
ΔT
1130 1140 1150 1160 1170 1180 1190 1200
Fig. 11 Dissolution-sensitive temperature range of the U720LI primary £ Aphase.
0.0
0.1
0.2
0.3
0.4
0.5
0.6
Mol
e co
ncen
tratio
n of
γ', %
Temperature, T/oC
Al=2.14,Ti=5.15Al=2.64Al=3.14
(a)
700 800 900 1000 1100 1200 700 800 900 1000 1100 1200
0.0
0.1
0.2
0.3
0.4
0.5 (b)
Mol
e co
ncen
tratio
n of
γ', %
Temperature, T/oC
Al=2.64,Ti=4.65Ti=5.15Ti=5.65
Fig. 12 The effect of (a) Al and (b) Ti content on volume fraction of the primary £ A phase at different temperatures.
J. Chen, P. Zhang, J. Dong, M. Zhang and Z. Yao1974
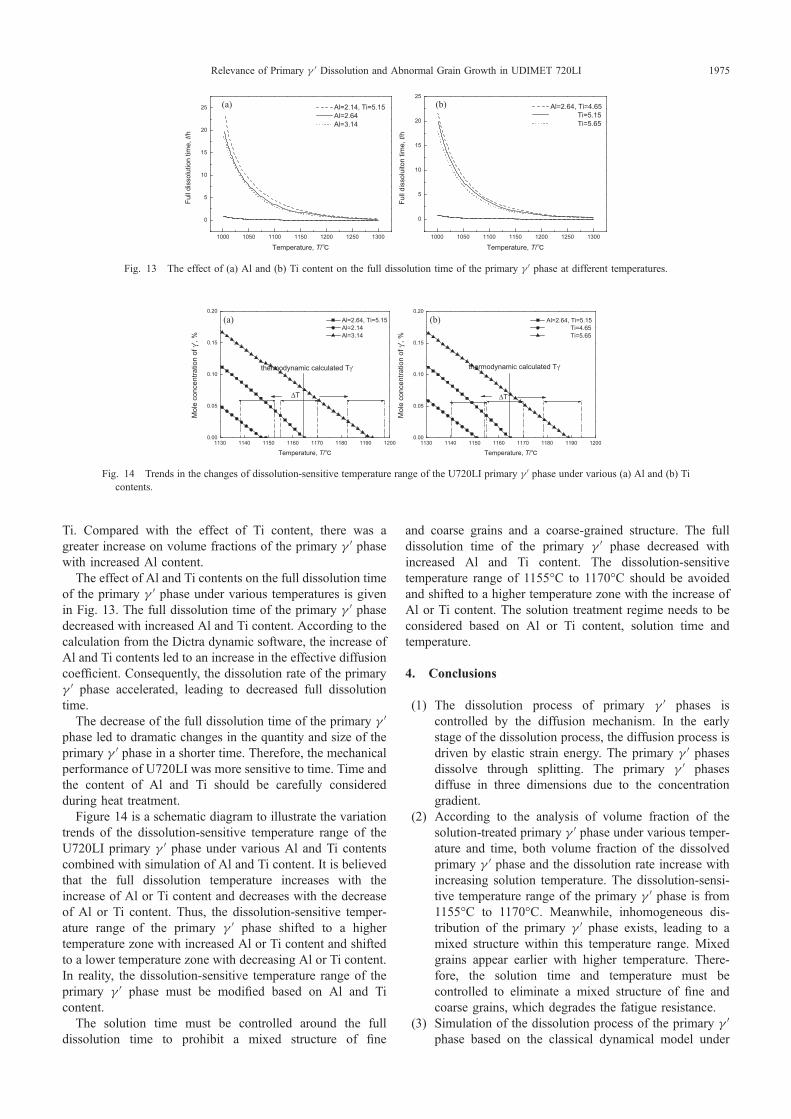
Ti. Compared with the effect of Ti content, there was agreater increase on volume fractions of the primary £ A phasewith increased Al content.
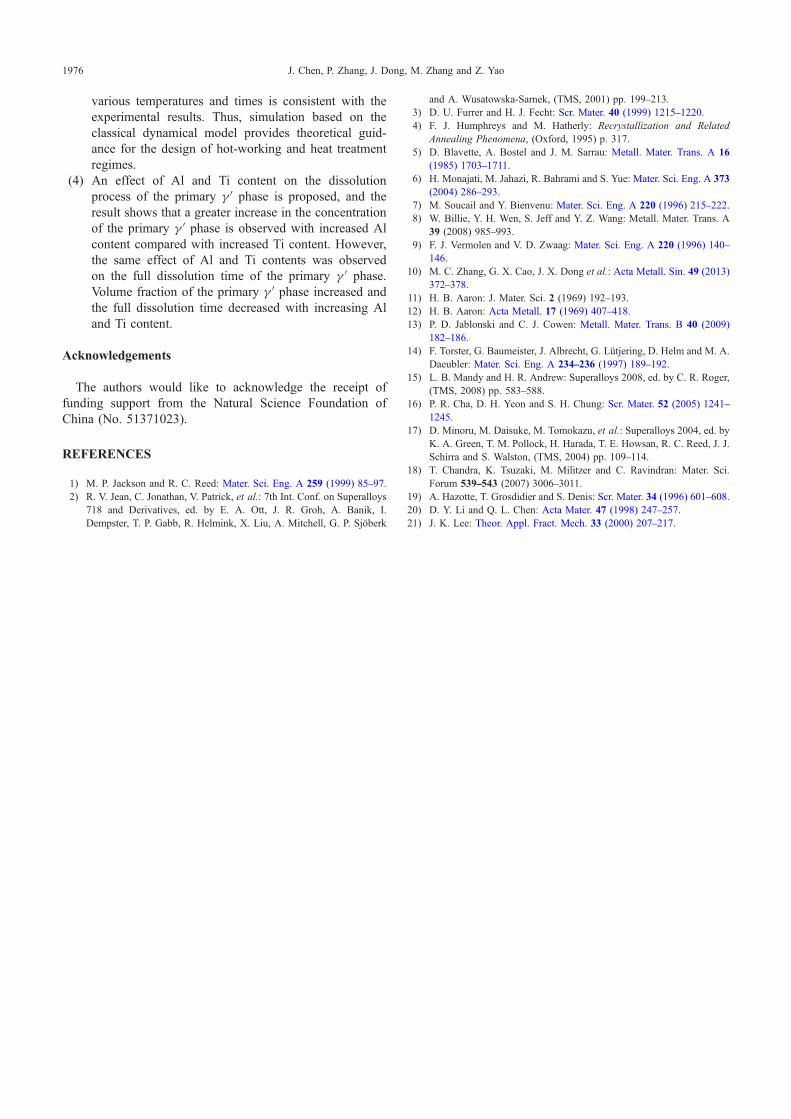
The effect of Al and Ti contents on the full dissolution timeof the primary £ A phase under various temperatures is givenin Fig. 13. The full dissolution time of the primary £ A phasedecreased with increased Al and Ti content. According to thecalculation from the Dictra dynamic software, the increase ofAl and Ti contents led to an increase in the effective diffusioncoefficient. Consequently, the dissolution rate of the primary£ A phase accelerated, leading to decreased full dissolutiontime.
The decrease of the full dissolution time of the primary £ Aphase led to dramatic changes in the quantity and size of theprimary £ A phase in a shorter time. Therefore, the mechanicalperformance of U720LI was more sensitive to time. Time andthe content of Al and Ti should be carefully consideredduring heat treatment.
Figure 14 is a schematic diagram to illustrate the variationtrends of the dissolution-sensitive temperature range of theU720LI primary £ A phase under various Al and Ti contentscombined with simulation of Al and Ti content. It is believedthat the full dissolution temperature increases with theincrease of Al or Ti content and decreases with the decreaseof Al or Ti content. Thus, the dissolution-sensitive temper-ature range of the primary £ A phase shifted to a highertemperature zone with increased Al or Ti content and shiftedto a lower temperature zone with decreasing Al or Ti content.In reality, the dissolution-sensitive temperature range of theprimary £ A phase must be modified based on Al and Ticontent.
The solution time must be controlled around the fulldissolution time to prohibit a mixed structure of fine
and coarse grains and a coarse-grained structure. The fulldissolution time of the primary £ A phase decreased withincreased Al and Ti content. The dissolution-sensitivetemperature range of 1155°C to 1170°C should be avoidedand shifted to a higher temperature zone with the increase ofAl or Ti content. The solution treatment regime needs to beconsidered based on Al or Ti content, solution time andtemperature.
4. Conclusions
(1) The dissolution process of primary £ A phases iscontrolled by the diffusion mechanism. In the earlystage of the dissolution process, the diffusion process isdriven by elastic strain energy. The primary £ A phasesdissolve through splitting. The primary £ A phasesdiffuse in three dimensions due to the concentrationgradient.
(2) According to the analysis of volume fraction of thesolution-treated primary £ A phase under various temper-ature and time, both volume fraction of the dissolvedprimary £ A phase and the dissolution rate increase withincreasing solution temperature. The dissolution-sensi-tive temperature range of the primary £ A phase is from1155°C to 1170°C. Meanwhile, inhomogeneous dis-tribution of the primary £ A phase exists, leading to amixed structure within this temperature range. Mixedgrains appear earlier with higher temperature. There-fore, the solution time and temperature must becontrolled to eliminate a mixed structure of fine andcoarse grains, which degrades the fatigue resistance.
(3) Simulation of the dissolution process of the primary £ Aphase based on the classical dynamical model under
1000 1050 1100 1150 1200 1250 1300
0
5
10
15
20
25 (a)
Full
diss
olut
ion
time,
t/h
Temperature, T/
Al=2.14, Ti=5.15 Al=2.64 Al=3.14
1000 1050 1100 1150 1200 1250 1300
0
5
10
15
20
25(b)
Full
diss
olui
ton
time,
t/h
Temperature, T/
Al=2.64, Ti=4.65 Ti=5.15 Ti=5.65
Fig. 13 The effect of (a) Al and (b) Ti content on the full dissolution time of the primary £ A phase at different temperatures.
1130 1140 1150 1160 1170 1180 1190 12000.00
0.05
0.10
0.15
0.20
ΔT
thermodynamic calculated Tγ'
Mol
e co
ncen
tratio
n of
γ',
%
Temperature, T/
Al=2.64, Ti=5.15 Al=2.14 Al=3.14
(a)
1130 1140 1150 1160 1170 1180 1190 12000.00
0.05
0.10
0.15
0.20
thermodynamic calculated Tγ'
ΔT
Al=2.64, Ti=5.15 Ti=4.65 Ti=5.65
Mol
e co
ncen
tratio
n of
γ',
%
Temperature, T/
(b)
Fig. 14 Trends in the changes of dissolution-sensitive temperature range of the U720LI primary £ A phase under various (a) Al and (b) Ticontents.
Relevance of Primary £ A Dissolution and Abnormal Grain Growth in UDIMET 720LI 1975
various temperatures and times is consistent with theexperimental results. Thus, simulation based on theclassical dynamical model provides theoretical guid-ance for the design of hot-working and heat treatmentregimes.
(4) An effect of Al and Ti content on the dissolutionprocess of the primary £ A phase is proposed, and theresult shows that a greater increase in the concentrationof the primary £ A phase is observed with increased Alcontent compared with increased Ti content. However,the same effect of Al and Ti contents was observedon the full dissolution time of the primary £ A phase.Volume fraction of the primary £ A phase increased andthe full dissolution time decreased with increasing Aland Ti content.
Acknowledgements
The authors would like to acknowledge the receipt offunding support from the Natural Science Foundation ofChina (No. 51371023).
REFERENCES
1) M. P. Jackson and R. C. Reed: Mater. Sci. Eng. A 259 (1999) 8597.2) R. V. Jean, C. Jonathan, V. Patrick, et al.: 7th Int. Conf. on Superalloys
718 and Derivatives, ed. by E. A. Ott, J. R. Groh, A. Banik, I.Dempster, T. P. Gabb, R. Helmink, X. Liu, A. Mitchell, G. P. Sjöberk
and A. Wusatowska-Sarnek, (TMS, 2001) pp. 199213.3) D. U. Furrer and H. J. Fecht: Scr. Mater. 40 (1999) 12151220.4) F. J. Humphreys and M. Hatherly: Recrystallization and Related
Annealing Phenomena, (Oxford, 1995) p. 317.5) D. Blavette, A. Bostel and J. M. Sarrau: Metall. Mater. Trans. A 16
(1985) 17031711.6) H. Monajati, M. Jahazi, R. Bahrami and S. Yue: Mater. Sci. Eng. A 373
(2004) 286293.7) M. Soucail and Y. Bienvenu: Mater. Sci. Eng. A 220 (1996) 215222.8) W. Billie, Y. H. Wen, S. Jeff and Y. Z. Wang: Metall. Mater. Trans. A
39 (2008) 985993.9) F. J. Vermolen and V. D. Zwaag: Mater. Sci. Eng. A 220 (1996) 140
146.10) M. C. Zhang, G. X. Cao, J. X. Dong et al.: Acta Metall. Sin. 49 (2013)
372378.11) H. B. Aaron: J. Mater. Sci. 2 (1969) 192193.12) H. B. Aaron: Acta Metall. 17 (1969) 407418.13) P. D. Jablonski and C. J. Cowen: Metall. Mater. Trans. B 40 (2009)
182186.14) F. Torster, G. Baumeister, J. Albrecht, G. Lütjering, D. Helm and M. A.
Daeubler: Mater. Sci. Eng. A 234236 (1997) 189192.15) L. B. Mandy and H. R. Andrew: Superalloys 2008, ed. by C. R. Roger,
(TMS, 2008) pp. 583588.16) P. R. Cha, D. H. Yeon and S. H. Chung: Scr. Mater. 52 (2005) 1241
1245.17) D. Minoru, M. Daisuke, M. Tomokazu, et al.: Superalloys 2004, ed. by
K. A. Green, T. M. Pollock, H. Harada, T. E. Howsan, R. C. Reed, J. J.Schirra and S. Walston, (TMS, 2004) pp. 109114.
18) T. Chandra, K. Tsuzaki, M. Militzer and C. Ravindran: Mater. Sci.Forum 539543 (2007) 30063011.
19) A. Hazotte, T. Grosdidier and S. Denis: Scr. Mater. 34 (1996) 601608.20) D. Y. Li and Q. L. Chen: Acta Mater. 47 (1998) 247257.21) J. K. Lee: Theor. Appl. Fract. Mech. 33 (2000) 207217.
J. Chen, P. Zhang, J. Dong, M. Zhang and Z. Yao1976