
Reductions in NO 2 Driven by Policy and Recession Patricia Castellanos 1 & K. Folkert Boersma 1,2...
12
Reductions in NO 2 Driven by Policy and Recession Patricia Castellanos 1 & K. Folkert Boersma 1,2 AGU l Netherlands Meteorological Institute (KNMI) 2 Eindhoven University of Technology, Fluid Dynamic
-
Upload
gerard-ryan -
Category
Documents
-
view
220 -
download
3
Transcript of Reductions in NO 2 Driven by Policy and Recession Patricia Castellanos 1 & K. Folkert Boersma 1,2...

Reductions in NO2 Driven by Policy and Recession
Patricia Castellanos1 & K. Folkert Boersma1,2
AGU
1Royal Netherlands Meteorological Institute (KNMI) 2Eindhoven University of Technology, Fluid Dynamics Lab
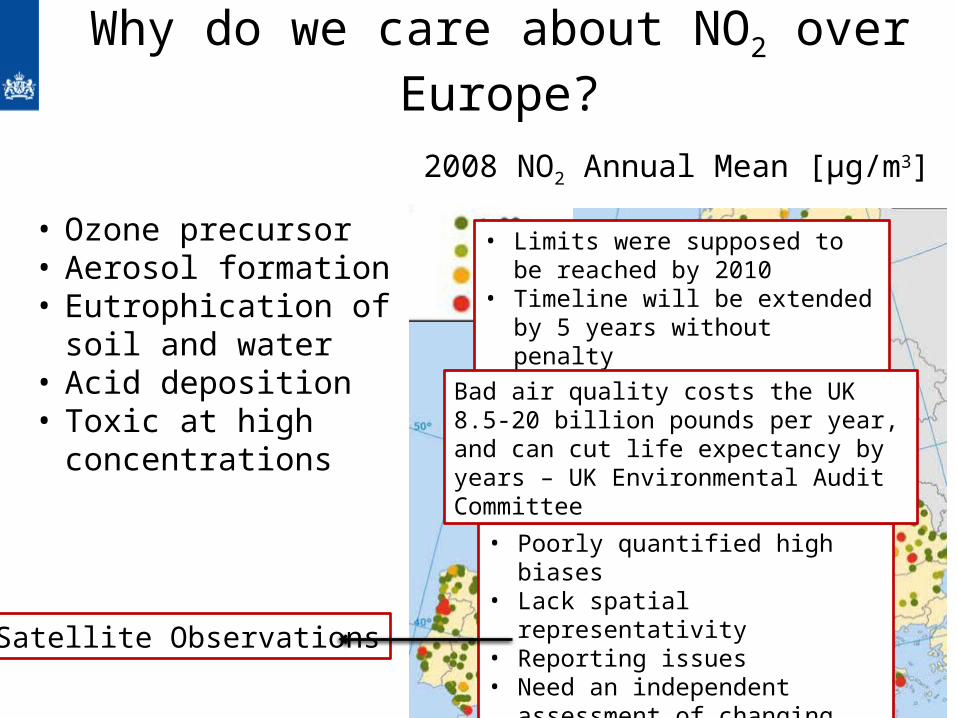
Why do we care about NO2 over Europe?
2008 NO2 Annual Mean [μg/m3]• Ozone precursor• Aerosol formation• Eutrophication of soil
and water• Acid deposition• Toxic at high
concentrations
• Limits were supposed to be reached by 2010
• Timeline will be extended by 5 years without penalty
• Poorly quantified high biases• Lack spatial representativity• Reporting issues• Need an independent assessment
of changing NO2 concentrations
Bad air quality costs the UK 8.5-20 billion pounds per year, and can cut life expectancy by years – UK Environmental Audit Committee
Satellite Observations
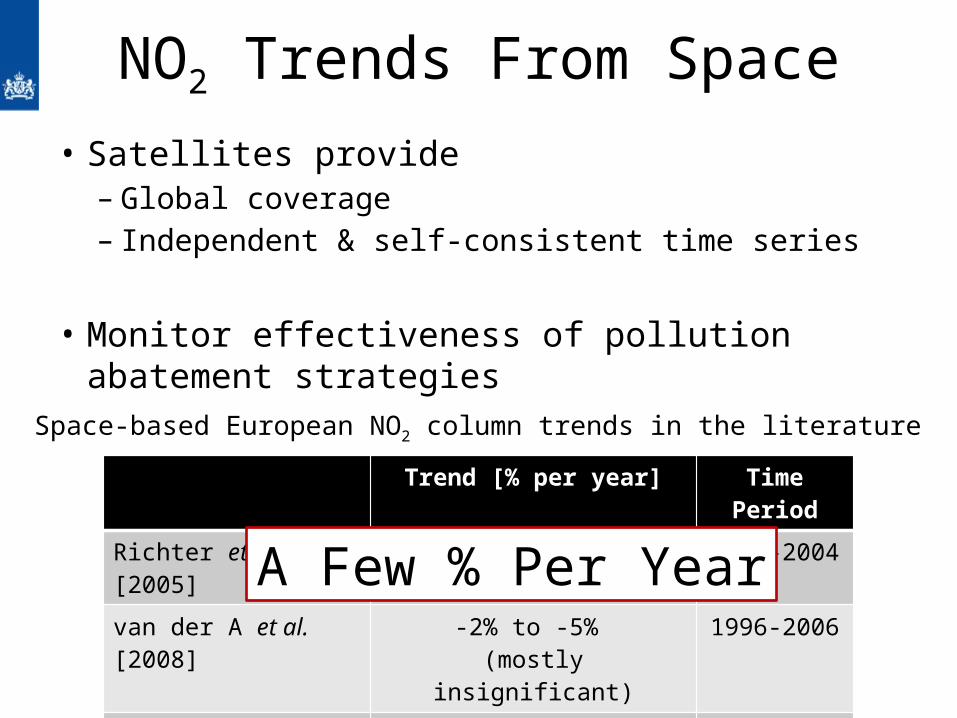
NO2 Trends From Space
• Satellites provide – Global coverage– Independent & self-consistent time series
• Monitor effectiveness of pollution abatement strategies
Trend [% per year] Time Period
Richter et al. [2005] -3% to -4% 1996-2004
van der A et al. [2008] -2% to -5% (mostly insignificant)
1996-2006
Konovalov et al. [2008] -2% to -5% 1996-2005
Space-based European NO2 column trends in the literature
A Few % Per Year
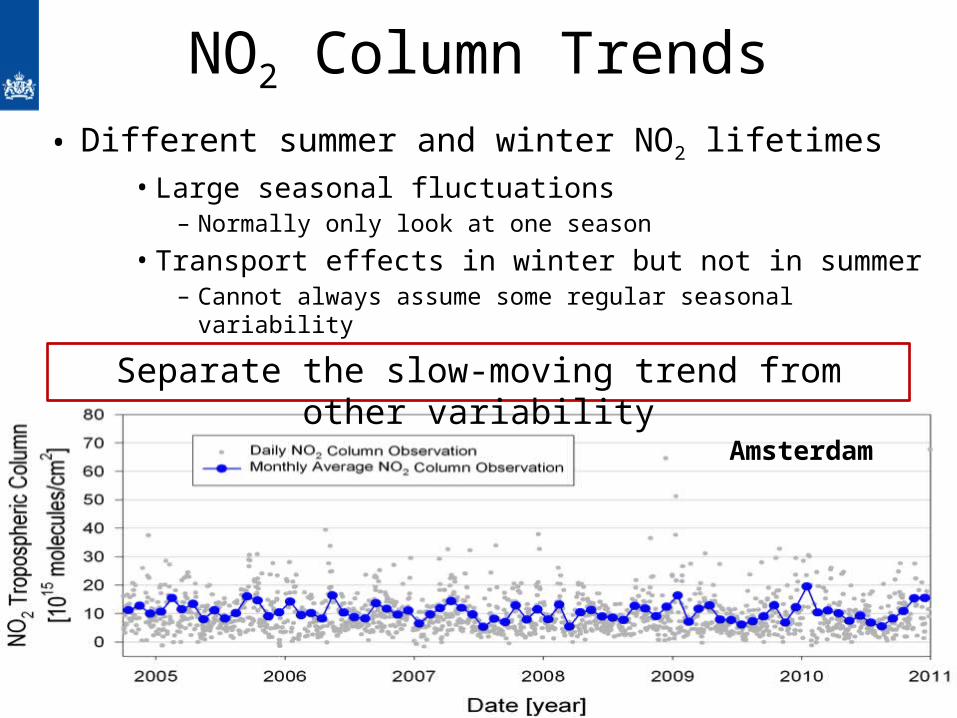
NO2 Column Trends
Amsterdam
• Different summer and winter NO2 lifetimes• Large seasonal fluctuations
– Normally only look at one season
• Transport effects in winter but not in summer– Cannot always assume some regular seasonal variability
Separate the slow-moving trend from other variability
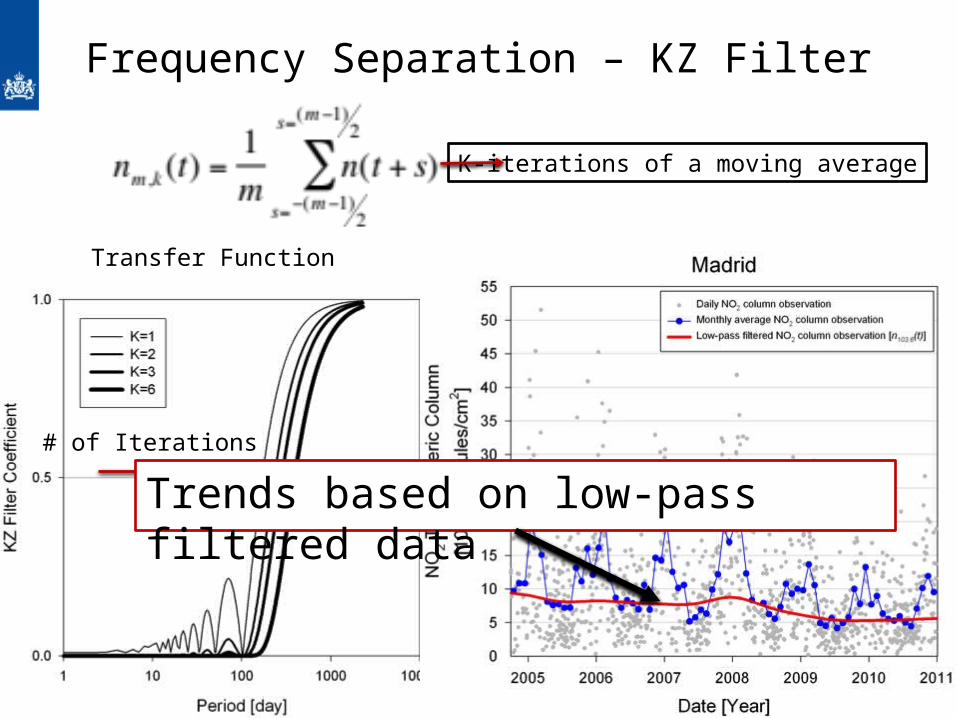
Frequency Separation – KZ Filter
# of Iterations
Transfer Function
Trends based on low-pass filtered data
K-iterations of a moving average
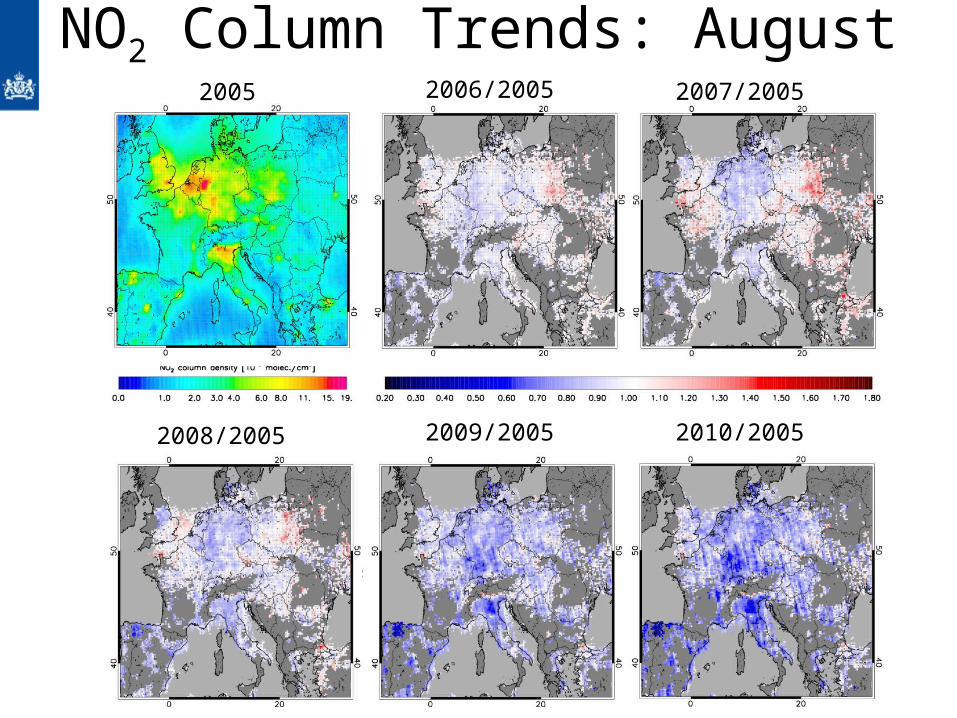
NO2 Column Trends: August
2008/2005 2009/2005 2010/2005
2005 2006/2005 2007/2005
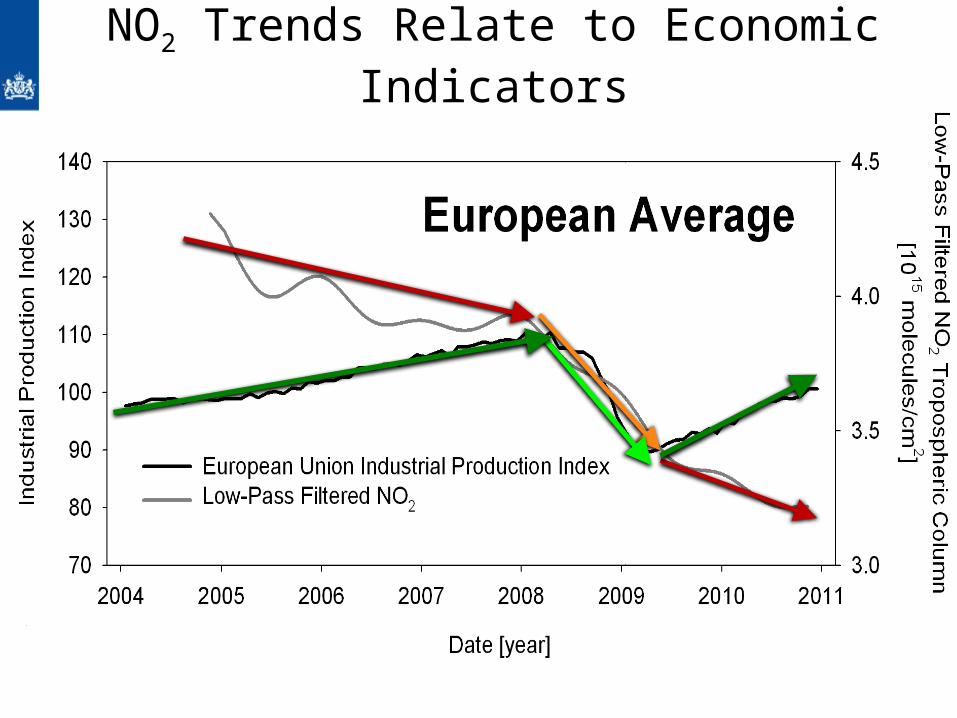
NO2 Trends Relate to Economic Indicators
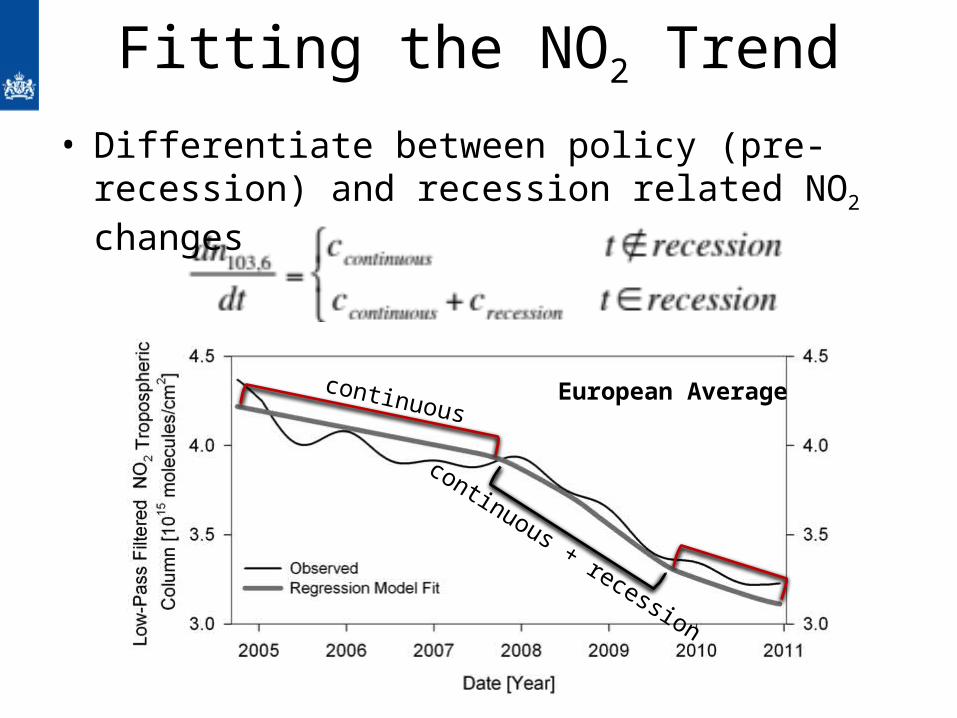
Fitting the NO2 Trend
• Differentiate between policy (pre-recession) and recession related NO2 changes
European Averagecontinuous
continuous + recession
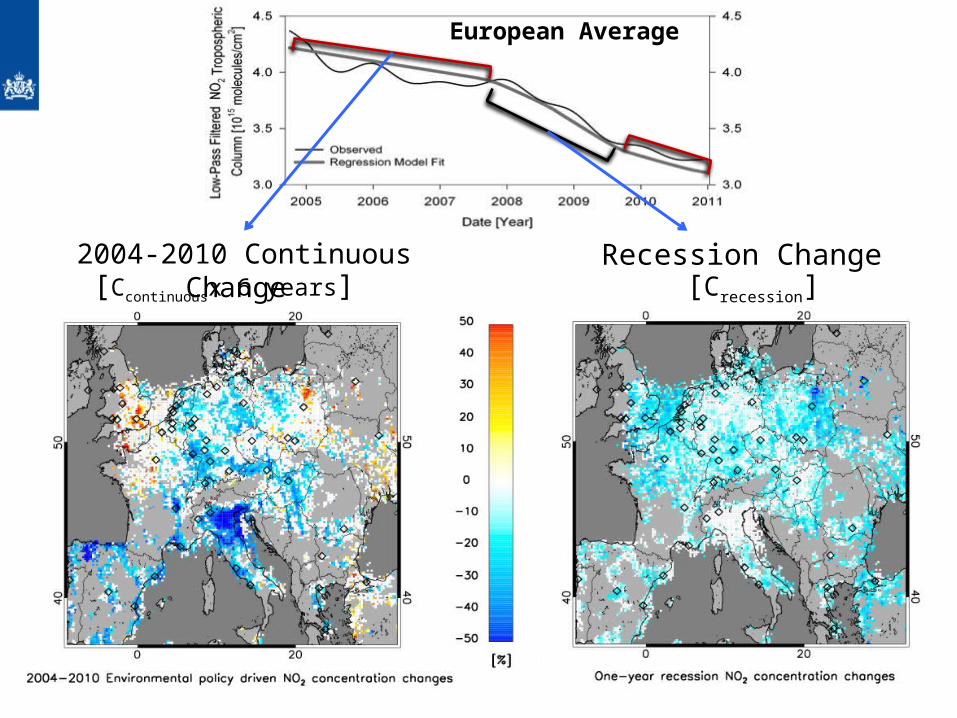
Recession Change
European Average
2004-2010 Continuous Change [Ccontinuousx 6 years] [Crecession]
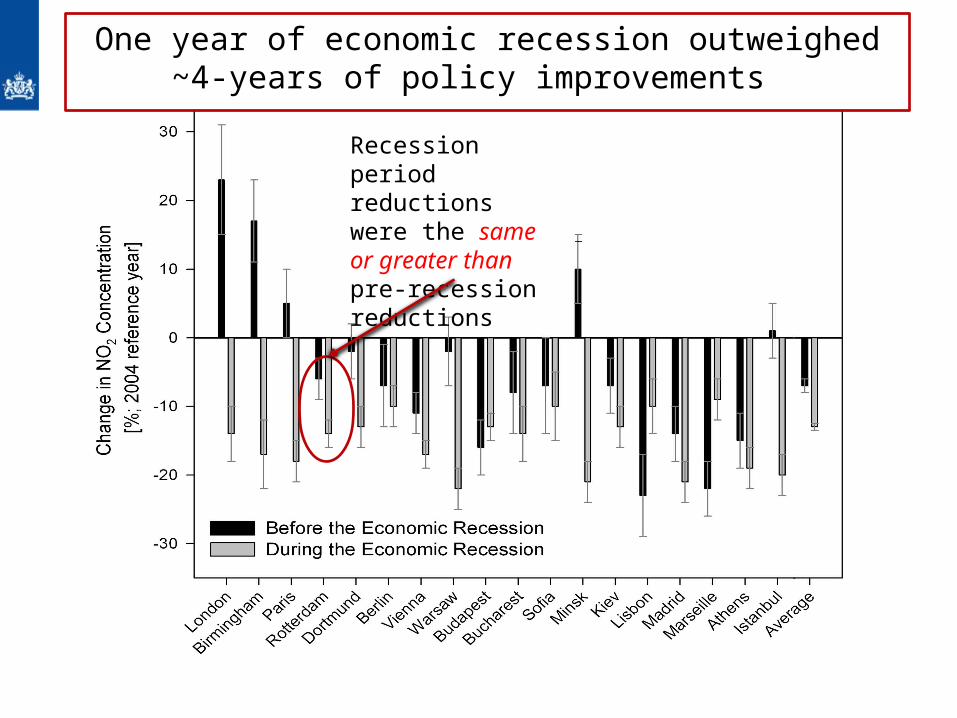
One year of economic recession outweighed ~4-years of policy improvements
Recession period reductions were the same or greater than pre-recession reductions
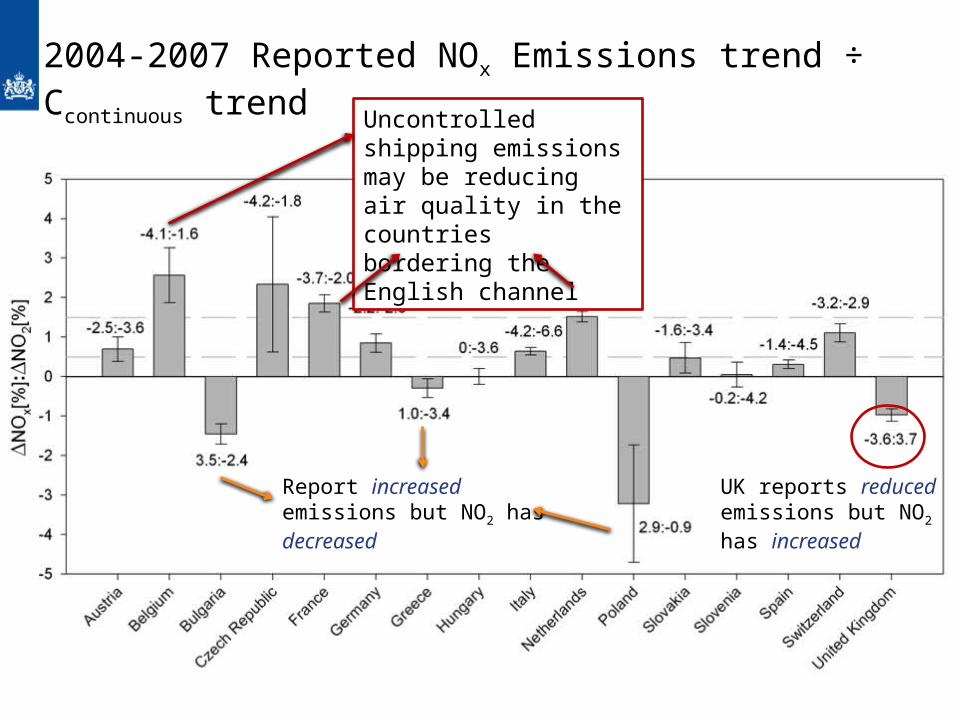
2004-2007 Reported NOx Emissions trend ÷ Ccontinuous trend
UK reports reduced emissions but NO2 has increased
Report increased emissions but NO2 has decreased
Uncontrolled shipping emissions may be reducing air quality in the countries bordering the English channel
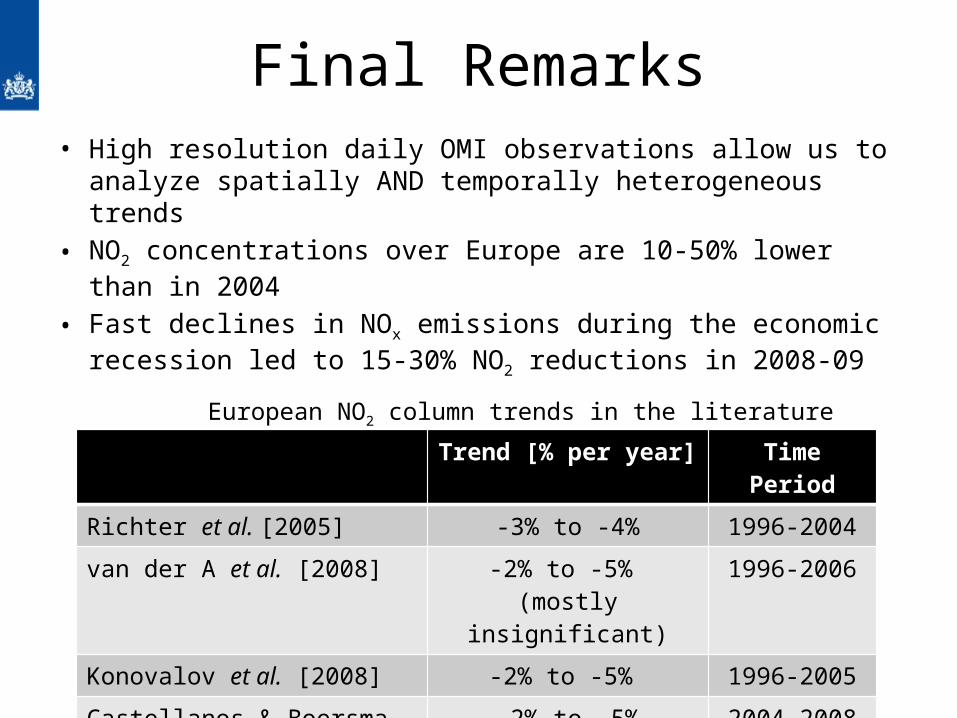
Final Remarks• High resolution daily OMI observations allow us to analyze
spatially AND temporally heterogeneous trends
• NO2 concentrations over Europe are 10-50% lower than in 2004
• Fast declines in NOx emissions during the economic recession led to 15-30% NO2 reductions in 2008-09
Trend [% per year] Time Period
Richter et al. [2005] -3% to -4% 1996-2004
van der A et al. [2008] -2% to -5% (mostly insignificant)
1996-2006
Konovalov et al. [2008] -2% to -5% 1996-2005
Castellanos & Boersma [2011] -2% to -5%-15 to -30%
2004-20082008-2009
European NO2 column trends in the literature


![[Presented at AGU-2004 AE23A-0833] R. Sonnenfeld, J ...kestrel.nmt.edu/~rsonnenf/atmospheric/Pubs/AGUPamphlet2.pdf · shaped damper 2.0, made of rip-stop nylon kept the sonde well](https://static.fdocument.org/doc/165x107/5e1161d85b33c5109571d354/presented-at-agu-2004-ae23a-0833-r-sonnenfeld-j-rsonnenfatmosphericpubsagupamphlet2pdf.jpg)
![Solving Difference Equations and Inverse Z Transformsiris.kaist.ac.kr/download/lec_7.pdf · Then use tables to invert the z-transform, e.g. agu[n] z—a Ex. Given a difference equation,](https://static.fdocument.org/doc/165x107/5fb4055b83eb6f2cfd31db29/solving-difference-equations-and-inverse-z-then-use-tables-to-invert-the-z-transform.jpg)