
Sergey I. Agafonov and Alexander I. Bobenko- Discrete Z^γ and Painlevé Equations
Upload
myrtle-bradfordCategory
view
221download
0
Recent results on MHD thermofluids for DCLL in the US
Sergey Smolentsev on behalf of the UCLA MHD group
2d EU-US DCLL WorkshopUniversity of California, Los Angeles
November 14-15, 2014

DCLL promises solution towards high-temperature (T~700C), high-efficiency (η>40%) blanket system. This is the main US choice of a breeding blanket for ITER TBM and DEMO
• Reduced-activation ferritic/martensitic (RAFM) steel is used as structural material
• High-temperature PbLi is used as breeder/coolant• Sandwich or SiC Flow Channel Insert (FCI) serves as electrical and
thermal insulator
• PbLi flows slowly (V ~ 10 cm/s) in large poloidal rectangular ducts (D ~ 20 cm) to remove the volumetric heat generated by neutrons and produce tritium, while a pressurized (~ to 8 MPa) He gas is used to remove the surface heat flux and to cool the ferritic First Wall and other blanket structures
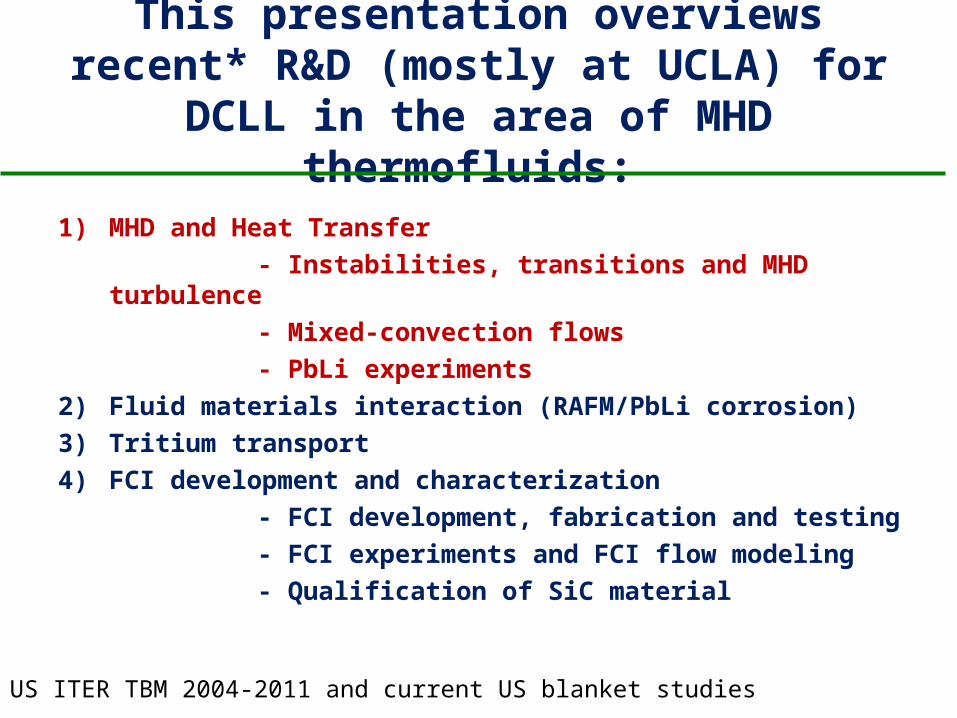
This presentation overviews recent* R&D (mostly at UCLA) for DCLL in the area of
MHD thermofluids:
1) MHD and Heat Transfer - Instabilities, transitions and MHD turbulence - Mixed-convection flows - PbLi experiments2) Fluid materials interaction (RAFM/PbLi corrosion)3) Tritium transport4) FCI development and characterization - FCI development, fabrication and testing - FCI experiments and FCI flow modeling - Qualification of SiC material
* US ITER TBM 2004-2011 and current US blanket studies
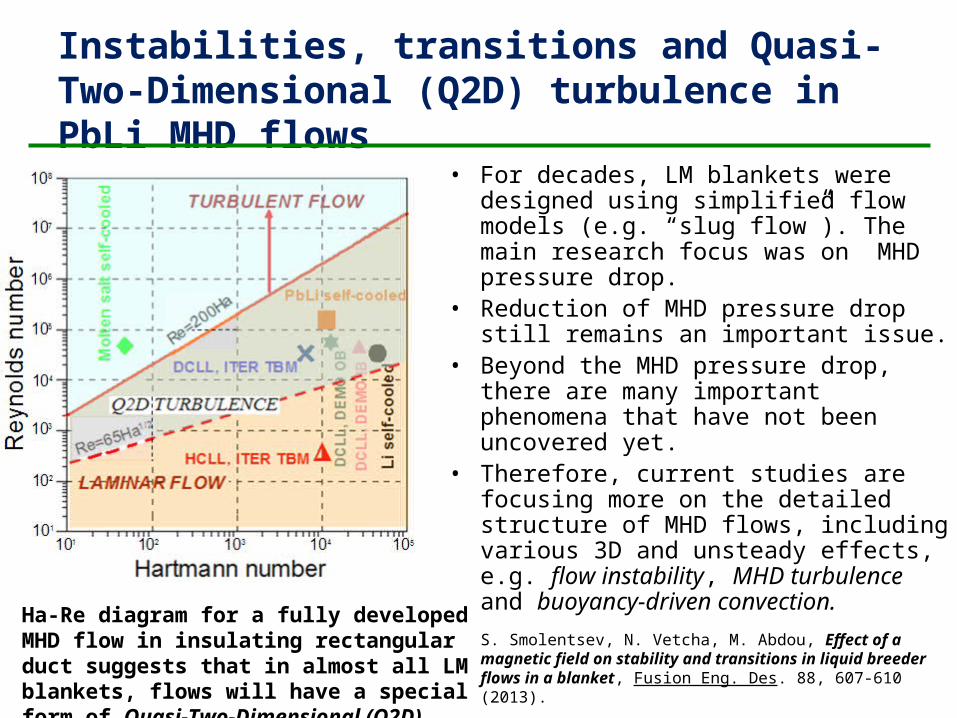
Instabilities, transitions and Quasi-Two-Dimensional (Q2D) turbulence in PbLi MHD flows
• For decades, LM blankets were designed using simplified flow models (e.g. “slug flow”). The main research focus was on MHD pressure drop.
• Reduction of MHD pressure drop still remains an important issue.
• Beyond the MHD pressure drop, there are many important phenomena that have not been uncovered yet.
• Therefore, current studies are focusing more on the detailed structure of MHD flows, including various 3D and unsteady effects, e.g. flow instability, MHD turbulence and buoyancy-driven convection.
Ha-Re diagram for a fully developed MHD flow in insulating rectangular duct suggests that in almost all LM blankets, flows will have a special form of Quasi-Two-Dimensional (Q2D) turbulence
S. Smolentsev, N. Vetcha, M. Abdou, Effect of a magnetic field on stability and transitions in liquid breeder flows in a blanket, Fusion Eng. Des. 88, 607-610 (2013).
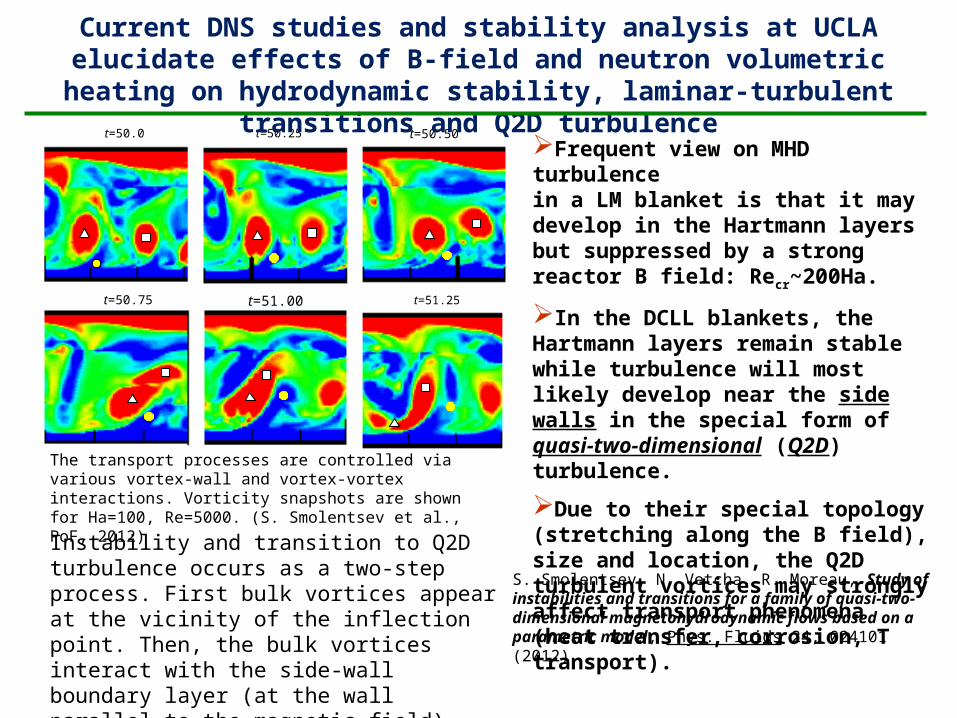
t=50.0 t=50.25 t=50.50
t=50.75 t=51.00 t=51.25
Frequent view on MHD turbulencein a LM blanket is that it may develop in the Hartmann layers but suppressed by a strong reactor B field: Recr~200Ha.
In the DCLL blankets, the Hartmann layers remain stable while turbulence will most likely develop near the side walls in the special form of quasi-two-dimensional (Q2D) turbulence.
Due to their special topology (stretching along the B field), size and location, the Q2D turbulent vortices may strongly affect transport phenomena (heat transfer, corrosion, T transport).
Current DNS studies and stability analysis at UCLA elucidate effects of B-field and neutron volumetric heating on hydrodynamic stability,
laminar-turbulent transitions and Q2D turbulence
The transport processes are controlled via various vortex-wall and vortex-vortex interactions. Vorticity snapshots are shown for Ha=100, Re=5000. (S. Smolentsev et al., PoF, 2012)
Instability and transition to Q2D turbulence occurs as a two-step process. First bulk vortices appear at the vicinity of the inflection point. Then, the bulk vortices interact with the side-wall boundary layer (at the wall parallel to the magnetic field) causing its destabilization and eventually turbulence.
S. Smolentsev, N. Vetcha, R. Moreau, Study of instabilities and transitions for a family of quasi-two-dimensional magnetohydrodynamic flows based on a parametric model, Phys. Fluids 24, 024101 (2012).

Our studies of vertical MHD flows with reactor-type volumetric heating suggest that in DCLL, Q2D
turbulence will appear either as “weak” or “strong”
• In poloidal flows, buoyancy forces are caused by radial temperature gradients due to exponentially varying volumetric heat. The buoyant flows superimpose on the forced flow. Such mixed-convection flows are foreseen to be hydrodynamically unstable and eventually turbulent.
• For DCLL, our DNS studies and stability analysis suggest two types of instability: (1) primary inflectional instability and (2) secondary instability due to vortex-wall interactions
• Two turbulence regimes have been identified. In “weak turbulence,” eddies remain localized near the inflection point. In “strong turbulence,” bulk eddies interact with the side-wall boundary layer causing its instability and formation of secondary vortices.
Vorticity snapshots in a turbulent mixed-convection flow at Re = 5000 and Gr = 108.Strong turbulence: (a) Ha = 50, and (b) Ha = 60. Weak turbulence: (c) Ha = 100, and (d) Ha = 120.
B
V
g
N. Vetcha, S. Smolentsev, M. Abdou, R. Moreau, Study of instabilities and quasi-two-dimensional turbulence in volumetrically heated MHD flows in a vertical rectangular duct, Phys. Fluids 25,024102 (2013).
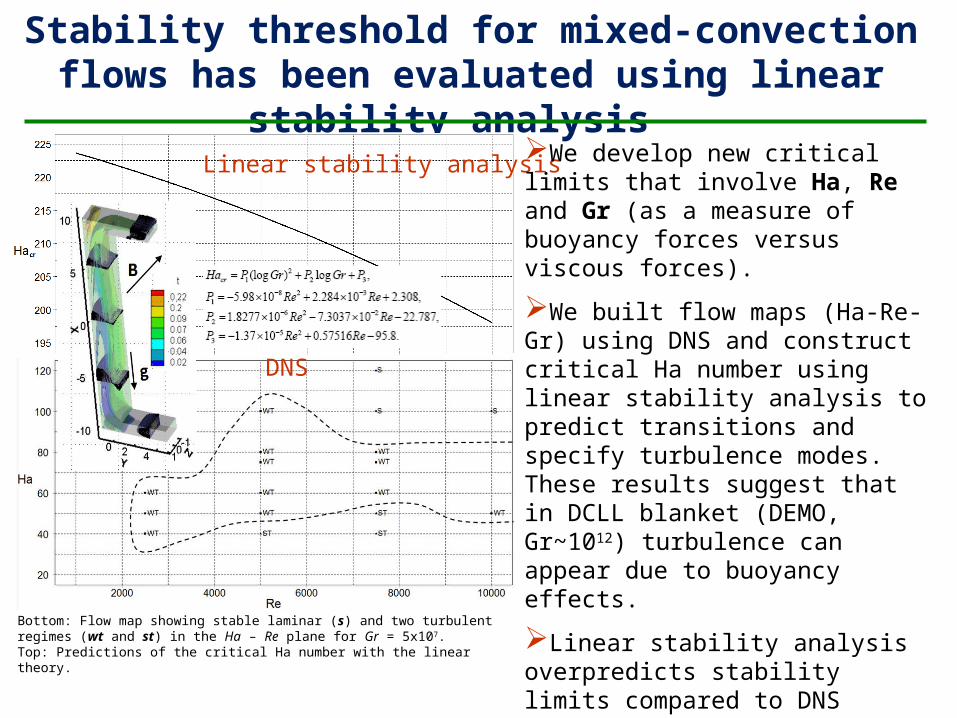
Stability threshold for mixed-convection flows has been evaluated using linear stability analysis
Bottom: Flow map showing stable laminar (s) and two turbulent regimes (wt and st) in the Ha – Re plane for Gr = 5x10⁷.Top: Predictions of the critical Ha number with the linear theory.
Linear stability analysis
DNS
We develop new critical limits that involve Ha, Re and Gr (as a measure of buoyancy forces versus viscous forces).
We built flow maps (Ha-Re-Gr) using DNS and construct critical Ha number using linear stability analysis to predict transitions and specify turbulence modes. These results suggest that in DCLL blanket (DEMO, Gr~1012) turbulence can appear due to buoyancy effects.
Linear stability analysis overpredicts stability limits compared to DNS studies. Need for energy stability analysis and experiments. Such experiments are being prepared at UCLA.
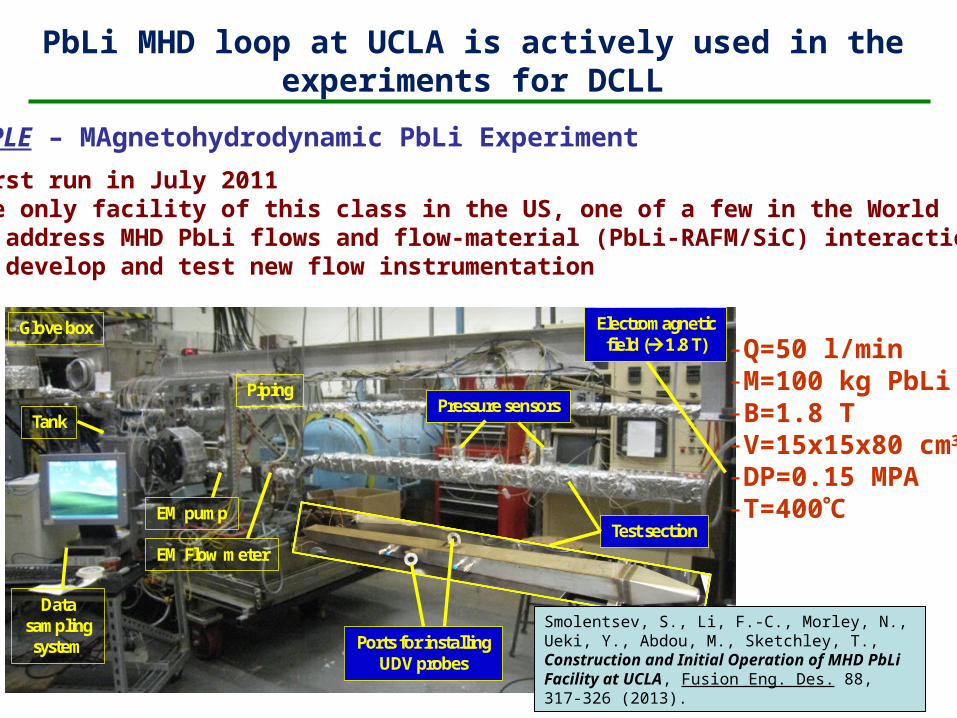
Glove box
Tank
EM pump
EM Flow meter
Data sampling system
Pressure sensors
Test section
Ports for installing UDV probes
Piping
Electromagnetic field (1.8 T)
MaPLE – MAgnetohydrodynamic PbLi Experiment
•First run in July 2011•The only facility of this class in the US, one of a few in the World•To address MHD PbLi flows and flow-material (PbLi-RAFM/SiC) interactions•To develop and test new flow instrumentation
PbLi MHD loop at UCLA is actively used in the experiments for DCLL
Smolentsev, S., Li, F.-C., Morley, N., Ueki, Y., Abdou, M., Sketchley, T., Construction and Initial Operation of MHD PbLi Facility at UCLA, Fusion Eng. Des. 88, 317-326 (2013).
-Q=50 l/min-M=100 kg PbLi-B=1.8 T-V=15x15x80 cm3
-DP=0.15 MPA-T=400C
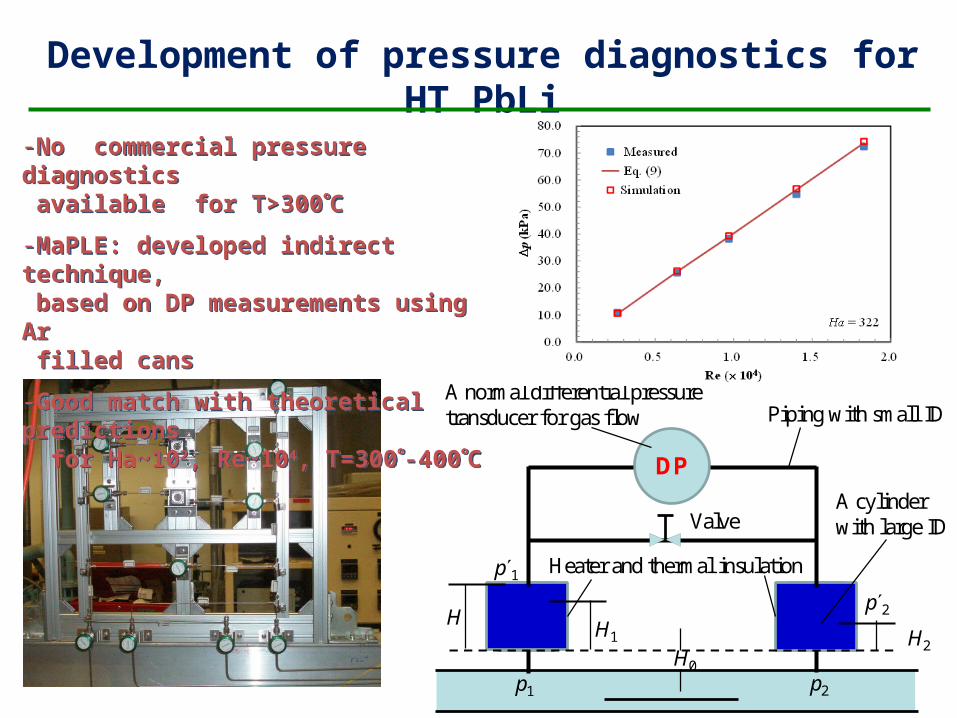
DP
p1 p2
Valve
Heater and thermal insulation
A cylinder with large ID
Piping with small ID
HH1 H2
p2
p1
A normal differential pressure transducer for gas flow
H0
Development of pressure diagnostics for HT PbLi
-No commercial pressure diagnostics available for T>300C
-MaPLE: developed indirect technique, based on DP measurements using Ar filled cans
-Good match with theoretical predictions for Ha~102, Re~104, T=300-400C
-No commercial pressure diagnostics available for T>300C
-MaPLE: developed indirect technique, based on DP measurements using Ar filled cans
-Good match with theoretical predictions for Ha~102, Re~104, T=300-400C
0.00
0.25
0.50
0.75
1.00
-1 -0.8 -0.6 -0.4 -0.2 0 0.2 0.4 0.6 0.8 1
B/B0
Axial distance from the center of BOB (m)
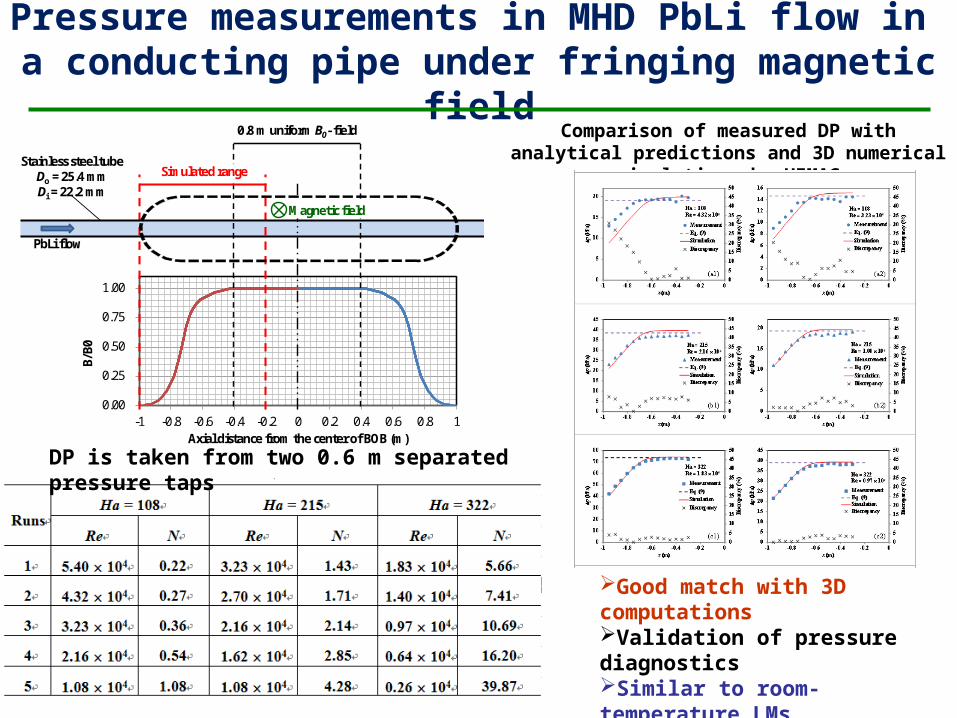
0.8 m uniform B0- field
Simulated range
Magnetic field
PbLi flow
Stainless steel tubeDo = 25.4 mmDi = 22.2 mm
Comparison of measured DP with analytical predictions and 3D numerical simulations by HIMAG
DP is taken from two 0.6 m separated pressure taps
Pressure measurements in MHD PbLi flow in a conducting pipe under fringing magnetic field
Good match with 3D computationsValidation of pressure diagnosticsSimilar to room-temperature LMs, PbLi can be used in bulk MHD experiments
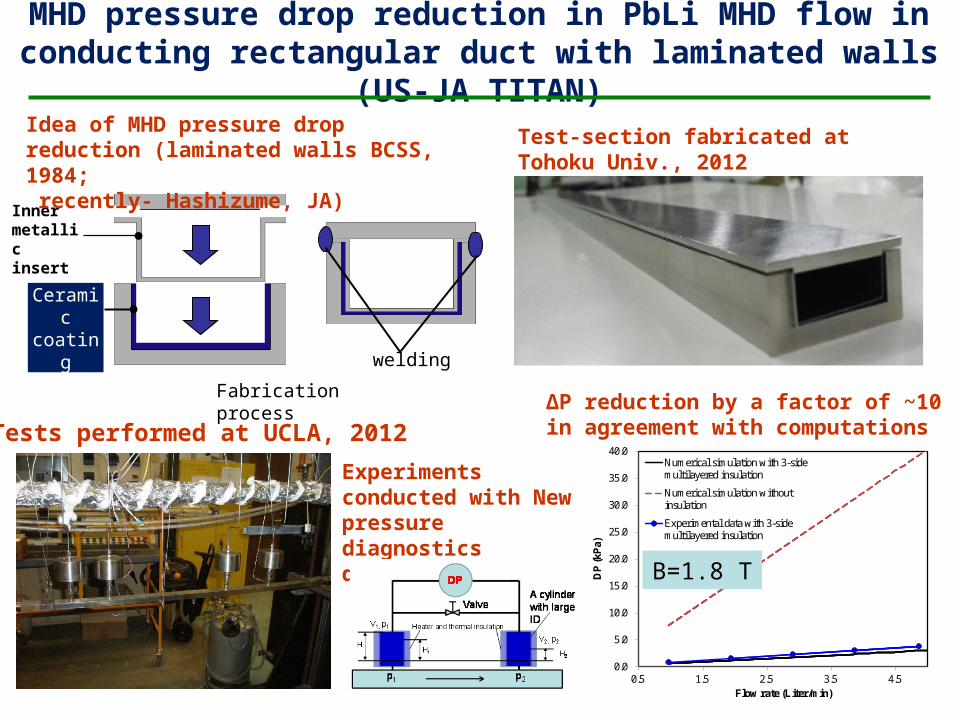
MHD pressure drop reduction in PbLi MHD flow in conducting rectangular duct with laminated walls (US-JA TITAN)
Fabrication process
Ceramic coating
welding
Innermetallic insert
Idea of MHD pressure drop reduction (laminated walls BCSS, 1984; recently- Hashizume, JA)
Test-section fabricated at Tohoku Univ., 2012
Tests performed at UCLA, 2012ΔP reduction by a factor of ~10 in agreement with computations
Experiments conducted with New pressurediagnostics developed at UCLA
0.0
5.0
10.0
15.0
20.0
25.0
30.0
35.0
40.0
0.5 1.5 2.5 3.5 4.5
DP
(kP
a)
Flow rate (Liter/min)
Numerical simulation with 3-sidemultilayered insulation
Numerical simulation withoutinsulation
Experimental data with 3-sidemultilayered insulation
B = 1.8 TB=1.8 T

More work on flow diagnostics for HT PbLi is planned in 2015 as a part of IPR-UCLA collaboration
• Even “standard” diagnostics may require significant modifications and extra testing for HT PbLi flows to take into account specific effects associated with the use of PbLi.
• Electric potential: SWP (surface welded pin) ~200, LTP (liquid touching pin) ~3, MPP (moving potential pin) ~10
• Temperature: Thermocouples of type E, K and N
• Flow-rate: Newly design Faraday flow-meter
• Pressure: HT absolute pressure transducers by Keller
• Velocity field: LEVI probes
A sketch of the rectangular duct test section with installed flow diagnostics (electric potential pins, thermocouples, pressure sensors and LEVI probes) with respect to the applied magnetic field of the BOB magnet.
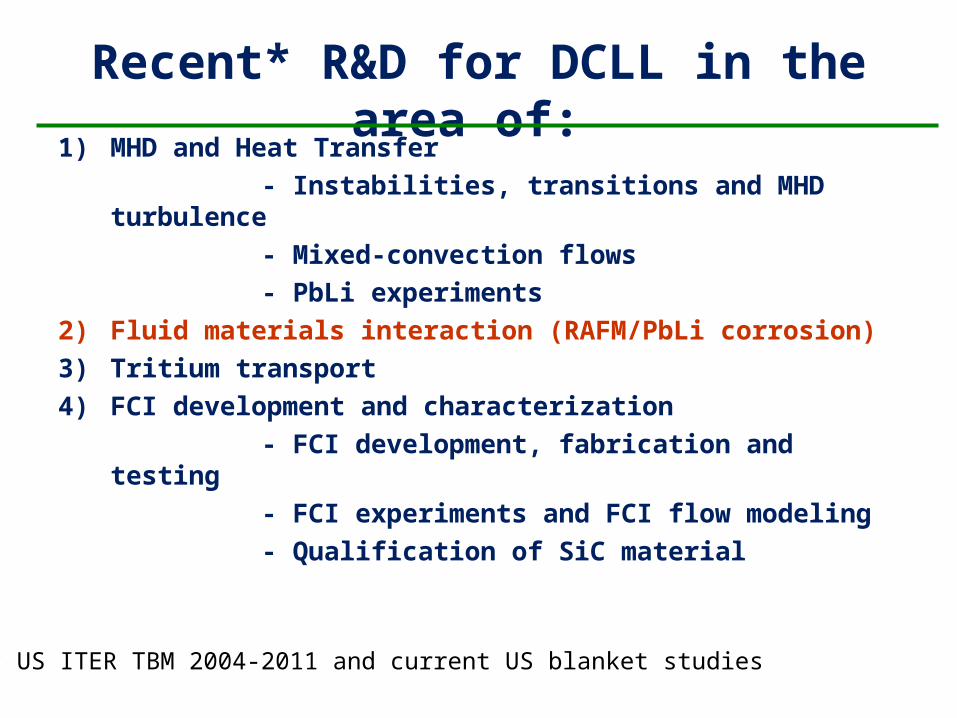
Recent* R&D for DCLL in the area of: 1) MHD and Heat Transfer - Instabilities, transitions and MHD turbulence - Mixed-convection flows - PbLi experiments2) Fluid materials interaction (RAFM/PbLi corrosion)3) Tritium transport4) FCI development and characterization - FCI development, fabrication and testing - FCI experiments and FCI flow modeling - Qualification of SiC material
* US ITER TBM 2004-2011 and current US blanket studies
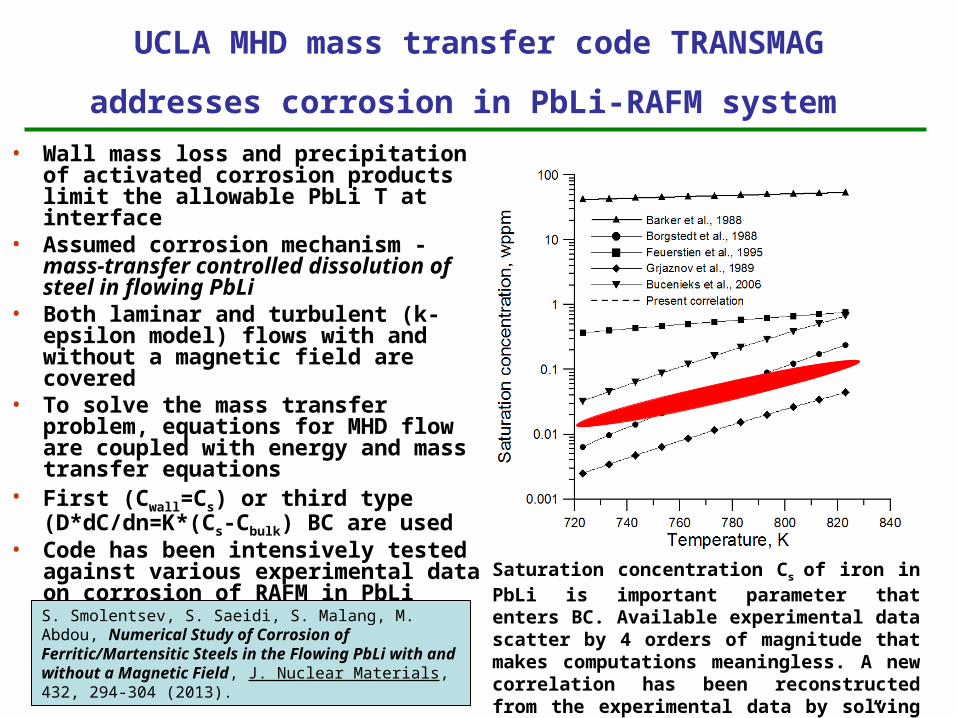
UCLA MHD mass transfer code TRANSMAG addresses
corrosion in PbLi-RAFM system • Wall mass loss and precipitation of
activated corrosion products limit the allowable PbLi T at interface
• Assumed corrosion mechanism - mass-transfer controlled dissolution of steel in flowing PbLi
• Both laminar and turbulent (k-epsilon model) flows with and without a magnetic field are covered
• To solve the mass transfer problem, equations for MHD flow are coupled with energy and mass transfer equations
• First (Cwall=Cs) or third type (D*dC/dn=K*(Cs-Cbulk) BC are used
• Code has been intensively tested against various experimental data on corrosion of RAFM in PbLi
S. Smolentsev, S. Saeidi, S. Malang, M. Abdou, Numerical Study of Corrosion of Ferritic/Martensitic Steels in the Flowing PbLi with and without a Magnetic Field, J. Nuclear Materials, 432, 294-304 (2013).
Saturation concentration Cs of iron in PbLi is important parameter that enters BC. Available experimental data scatter by 4 orders of magnitude that makes computations meaningless. A new correlation has been reconstructed from the experimental data by solving an “inverse mass transfer problem”.

Computations of corrosion of RAFM in PbLi in the presence of B-field suggest revisiting of corrosion analysis for DCLL to take into account
MHD effects • Riga experiment (2009):
corrosion on Hartmann walls is doubled due to the B-field effect. No experimental or modeling results for the side walls (parallel to B field).
• We analyze effects of B field on corrosion on both Hartmann and side walls using TRANSMAG code and new correlation for saturation concentration.
• Our predictions for the Hartmann walls are consistent with the Riga data. The side wall predictions show 2-3 times (!) higher corrosion rate compared to the Hartmann walls due to formation of velocity jets.
• We propose scaling laws for the mass loss.
Hartmann wall
Side wall
Magnetic field: 0-6 T (Ha=0-1325)Flow velocity: 1, 2, 3 cm/s (max Re=5580)Temperature: 400-550C
0~ pT q smML e U BMass loss (ML): side wall
Ha-wall
~ pT qmML e U
q,s ~0.5

Computations of corrosion for DCLL in the thin 2-mm gap using TRANSMAG
US DCLL (DEMO) OB blanket, 2006 : PbLi T_in/out=460/700C, He T_in/out=300/480C, NWL=2.13 MW/m2, B=4 T
-Most of corrosion occurs in the side-wall section of the gap
-Average wall thinning < 20 m/yr
-Maximum wall thinning ~ 35 m/yr
U< 1 mm/s
U~ 10 cm/s
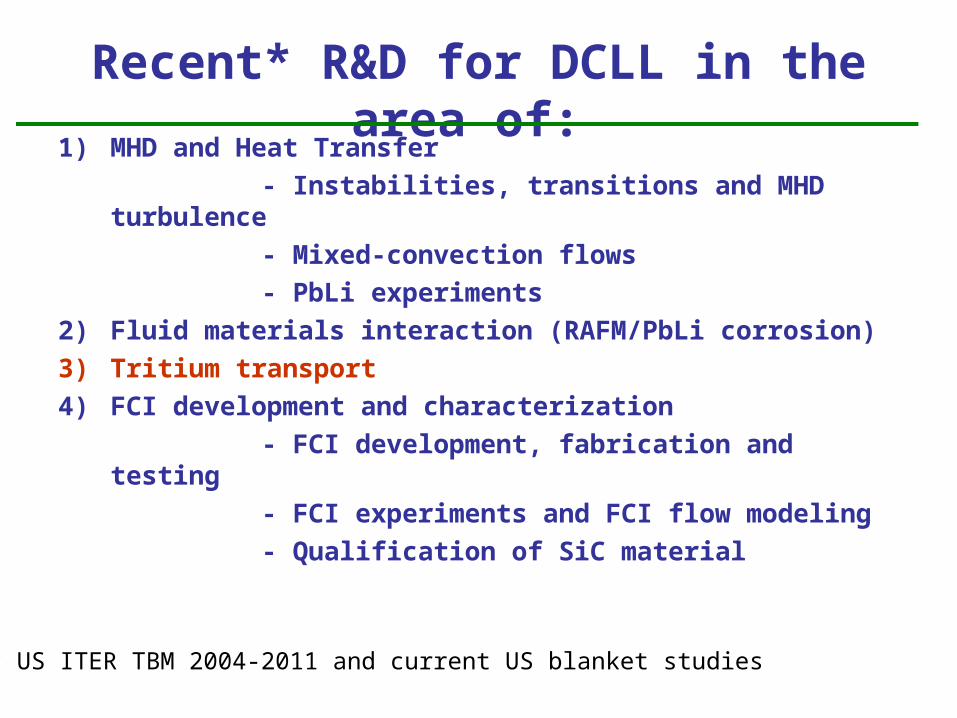
Recent* R&D for DCLL in the area of: 1) MHD and Heat Transfer - Instabilities, transitions and MHD turbulence - Mixed-convection flows - PbLi experiments2) Fluid materials interaction (RAFM/PbLi corrosion)3) Tritium transport4) FCI development and characterization - FCI development, fabrication and testing - FCI experiments and FCI flow modeling - Qualification of SiC material
* US ITER TBM 2004-2011 and current US blanket studies
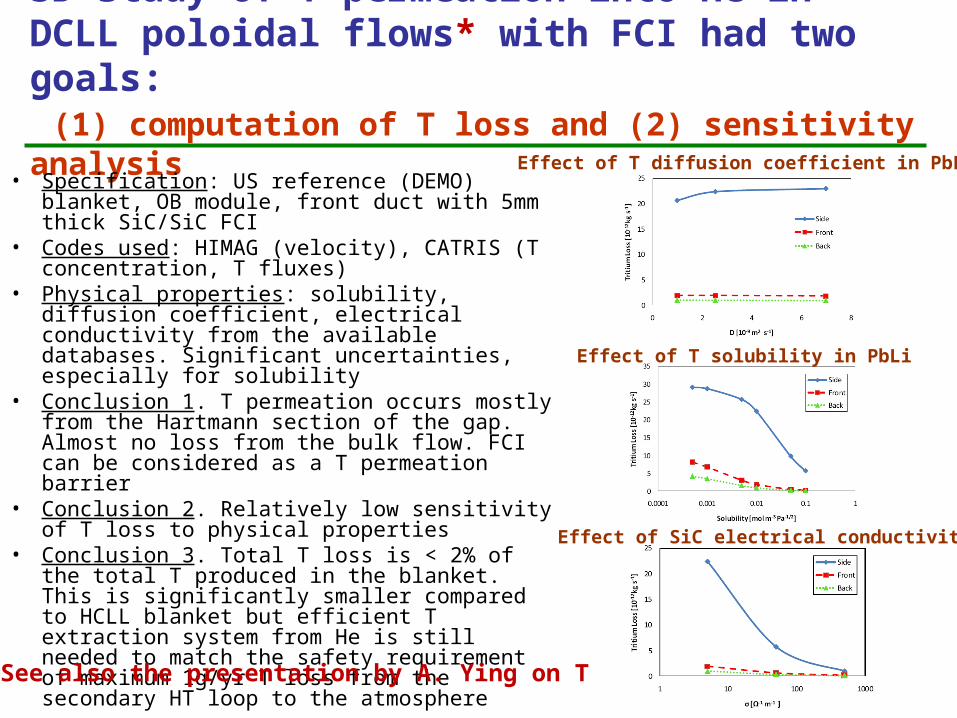
3D study of T permeation into He in DCLL poloidal flows* with FCI had two goals: (1) computation of T loss and (2) sensitivity analysis
• Specification: US reference (DEMO) blanket, OB module, front duct with 5mm thick SiC/SiC FCI
• Codes used: HIMAG (velocity), CATRIS (T concentration, T fluxes)
• Physical properties: solubility, diffusion coefficient, electrical conductivity from the available databases. Significant uncertainties, especially for solubility
• Conclusion 1. T permeation occurs mostly from the Hartmann section of the gap. Almost no loss from the bulk flow. FCI can be considered as a T permeation barrier
• Conclusion 2. Relatively low sensitivity of T loss to physical properties
• Conclusion 3. Total T loss is < 2% of the total T produced in the blanket. This is significantly smaller compared to HCLL blanket but efficient T extraction system from He is still needed to match the safety requirement of maximum 1g/yr T loss from the secondary HT loop to the atmosphere
Effect of T diffusion coefficient in PbLi
Effect of T solubility in PbLi
Effect of SiC electrical conductivity
*See also the presentation by A. Ying on T
Recent* R&D for DCLL in the area of: 1) MHD and Heat Transfer - Instabilities, transitions and MHD turbulence - Mixed-convection flows - PbLi experiments2) Fluid materials interaction (RAFM/PbLi corrosion)3) Tritium transport4) FCI development, characterization - FCI development, fabrication and testing - FCI experiments and FCI flow modeling - Qualification of SiC material
* US ITER TBM 2004-2011 and current US blanket studies
Requirements on FCI and FCI material
• Low electrical conductivity to keep the MHD pressure drop in the module < 2 MPa
• Low thermal conductivity to provide PbLi-RAFM interface temperature <470C and minimize heat losses into He
• Compatibility with PbLi at elevated temperatures more than 700C
• Retaining physical integrity and desirable properties during operation under long-time exposure to neutron irradiation and temperature gradients
• No cracking, no significant PbLi ingress to avoid degradation of insulating properties
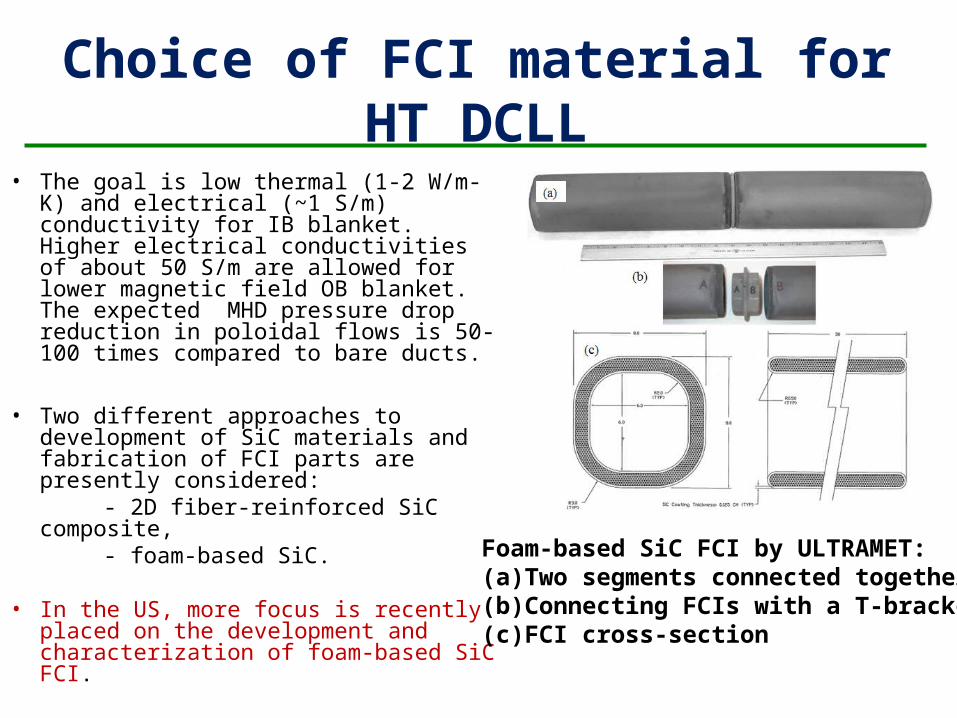
Choice of FCI material for HT DCLL
• The goal is low thermal (1-2 W/m-K) and electrical (~1 S/m) conductivity for IB blanket. Higher electrical conductivities of about 50 S/m are allowed for lower magnetic field OB blanket. The expected MHD pressure drop reduction in poloidal flows is 50-100 times compared to bare ducts.
• Two different approaches to development of SiC materials and fabrication of FCI parts are presently considered:
- 2D fiber-reinforced SiC composite, - foam-based SiC.
• In the US, more focus is recently placed on the development and characterization of foam-based SiC FCI.
Foam-based SiC FCI by ULTRAMET:(a) Two segments connected together(b) Connecting FCIs with a T-bracket(c) FCI cross-section

UCLA has performed several tests of foam-based SiC FCI samples by Ultramet in static and flowing PbLi conditions
• FCI samples filled with Silica or Carbon aerogel: 8 cm x 8 cm, L=12, 30 cm, tw=1 cm. Some samples are CVD coated.
• Static HT chamber with internal heating and external air cooling: P~0.1, 0.5, 1.0 MPa, T= 700C, 75 K/cm, 100 hrs.
• Dynamic testing in MaPLE: 300C, Pmax=0.1 Mpa, Umax~10 cm/s, ~ 10 months.
• In some cases PbLi ingress was observed. In particular, it was observed in dynamic testing. This may indicate to some fabrication issues.
• Brian Williams (Ultramet): “My conclusion was that if the aerogel is dense enough, it can prevent metal ingress but more optimization of the aerogel density is needed.”
A SiC sample before and after testing in static PbLi at 700C, 100 hrs, and 1 MPa
Static tests Dynamic tests