RCS CHARACTERIZATION OF STEALTH TARGET US- ING - PIER
10
Progress In Electromagnetics Research M, Vol. 27, 1–10, 2012 RCS CHARACTERIZATION OF STEALTH TARGET US- ING χ 2 DISTRIBUTION AND LOGNORMAL DISTRIBU- TION Weiqiang Shi * , Xiao-Wei Shi, and Le Xu National Laboratory of Science and Technology on Antennas and Microwaves, Xidian University, Xi’an 710071, China Abstract—The radar backscatter from complex targets, such as aircrafts and ships, tends to vary rapidly with aspect or time. To describe the radar cross section distribution characteristics of such targets, statistic terms are often used. In this paper, we first give a brief introduction of χ 2 distribution and lognormal distribution model. And complete form of lognormal distribution is proposed which can be used when ratio of mean to median is less than 1 as stealth targets. The significance of the parameters is discussed in detail aiming to find a characterization standard. As an example, the statistic characteristics of the radar cross section data of a stealth aircraft are analyzed with Swerling 1, 3 distribution, χ 2 distribution and lognormal distribution. The applicability of the distributions is shown with error-of-fit and test of goodness of fit. 1. INTRODUCTION RCS (Radar Cross Section) is an important evaluation criterion of aircraft’s stealth performance and radar detection technique. Radar target usually consists of multiple scatterers. The relative positions of the scatterers change rapidly. And the target body vibrates randomly in its motion. The envelope of the backscatter from complex target varies rapidly with aspect angle [1]. Fluctuation of RCS is random without regular pattern. Because it is difficult to predict the exact nature of RCS, statistical models [2] are used for RCS characterization. There are several RCS distribution models existing, including χ 2 distribution, Rice distribution and lognormal distribution model. The conventional lognormal distribution can be applied only when mean to Received 12 September 2012, Accepted 1 November 2012, Scheduled 6 November 2012 * Corresponding author: Wei-Qiang Shi (weiqiangshi [email protected]).
Transcript of RCS CHARACTERIZATION OF STEALTH TARGET US- ING - PIER
Progress In Electromagnetics Research M, Vol. 27, 1–10, 2012
RCS CHARACTERIZATION OF STEALTH TARGET US-ING χ2 DISTRIBUTION AND LOGNORMAL DISTRIBU-TION
Weiqiang Shi*, Xiao-Wei Shi, and Le Xu
National Laboratory of Science and Technology on Antennas andMicrowaves, Xidian University, Xi’an 710071, China
Abstract—The radar backscatter from complex targets, such asaircrafts and ships, tends to vary rapidly with aspect or time. Todescribe the radar cross section distribution characteristics of suchtargets, statistic terms are often used. In this paper, we first give abrief introduction of χ2 distribution and lognormal distribution model.And complete form of lognormal distribution is proposed which can beused when ratio of mean to median is less than 1 as stealth targets.The significance of the parameters is discussed in detail aiming to find acharacterization standard. As an example, the statistic characteristicsof the radar cross section data of a stealth aircraft are analyzed withSwerling 1, 3 distribution, χ2 distribution and lognormal distribution.The applicability of the distributions is shown with error-of-fit and testof goodness of fit.
1. INTRODUCTION
RCS (Radar Cross Section) is an important evaluation criterion ofaircraft’s stealth performance and radar detection technique. Radartarget usually consists of multiple scatterers. The relative positions ofthe scatterers change rapidly. And the target body vibrates randomlyin its motion. The envelope of the backscatter from complex targetvaries rapidly with aspect angle [1]. Fluctuation of RCS is randomwithout regular pattern. Because it is difficult to predict the exactnature of RCS, statistical models [2] are used for RCS characterization.
There are several RCS distribution models existing, including χ2
distribution, Rice distribution and lognormal distribution model. Theconventional lognormal distribution can be applied only when mean to
Received 12 September 2012, Accepted 1 November 2012, Scheduled 6 November 2012* Corresponding author: Wei-Qiang Shi (weiqiangshi [email protected]).
2 Shi, Shi, and Xu
median ratio of RCS data is greater than 1. We propose its completeform which can be used when ratio of mean to median is less than 1.Then the significance of distribution parameters is studied to obtain astandard of target characterization. After that an example of a stealthaircraft is given using Swerling 1, 3 distribution, χ2 distribution andlognormal distribution. And with the error-of-fit and fitting goodnesstest, the applicability of the distributions is discussed.
2. χ2 AND LOGNORMAL DISTRIBUTION MODEL
Among the existing RCS distribution models, χ2 distribution andlognormal distribution are worthwhile to promote. The complete formof lognormal distribution is proposed after a brief introduction of χ2
distribution and lognormal distribution.
2.1. χ2 Distribution Model
The PDF (Probability Distribution Function) of χ2 distribution [3, 4]is as Eq. (1).
p (σ) =k
(k − 1)!σ
(kσ
σ
)k−1
e−kσσ , σ > 0 (1)
In Eq. (1), σ is RCS variable and σ is mean value of RCS data. Theadvantage of χ2 distribution is that its variable parameter includes onlyk named double number of degrees of freedom. Parameter k can bepositive integer or non-integer. So its fitting to different distributionsis very good. When k equals 1, 2, N , 2N and ∞, χ2 distribution issimplified as the original five RCS distributions (i.e., Swerling 1–4 andMarcum distributions [5]).
2.2. Lognormal Distribution Model
The PDF of conventional lognormal distribution [6] is as Eq. (2).
p (σ) =1
σ√
4π ln ρe−(ln σ
σ0)2
4 ln ρ , σ > 0 (2)
ρ = σ/σ0 (3)
In Eq. (2), σ0 is the median value of RCS data, and ρ, the ratio of meanto median shown in Eq. (3), is the ratio of the mean value of the RCSdata to the median value. The advantage of lognormal distribution isthat its distribution curve has a good form which can be applied todifferent complex electrically large targets.
Progress In Electromagnetics Research M, Vol. 27, 2012 3
2.3. Complete Form of Lognormal Distribution
PDF of lognormal distribution shown in Eq. (2) is limited that ratioof mean to median must be greater than 1. For stealth targets, meanvalue of its RCS data decreases with median almost unchanged. Sothe ratio of mean to median tends to be smaller than conventionaltargets and could be less than 1. In this case lognormal distributionis no longer applicable, such as the RCS data in window 3 shown inSection 4.3 of which ratio of mean to median is 0.8055. The completeform of lognormal distribution is provided in Eq. (4).
p (σ) =
1σ√
4π ln ρe−(ln σ
σ0)2
4 ln ρ , σ > 0, ρ > 1
1σ√−4π ln ρ
e(ln σ
σ0)2
4 ln ρ , σ > 0, ρ < 1
(4)
3. PARAMETER ANALYSIS
In this section, the significance of the distribution parameters isstudied. How the distribution changes with its parameters is shownwith its probability curve plotted. Based on the analysis, we try tofind a characterization standard for different targets.
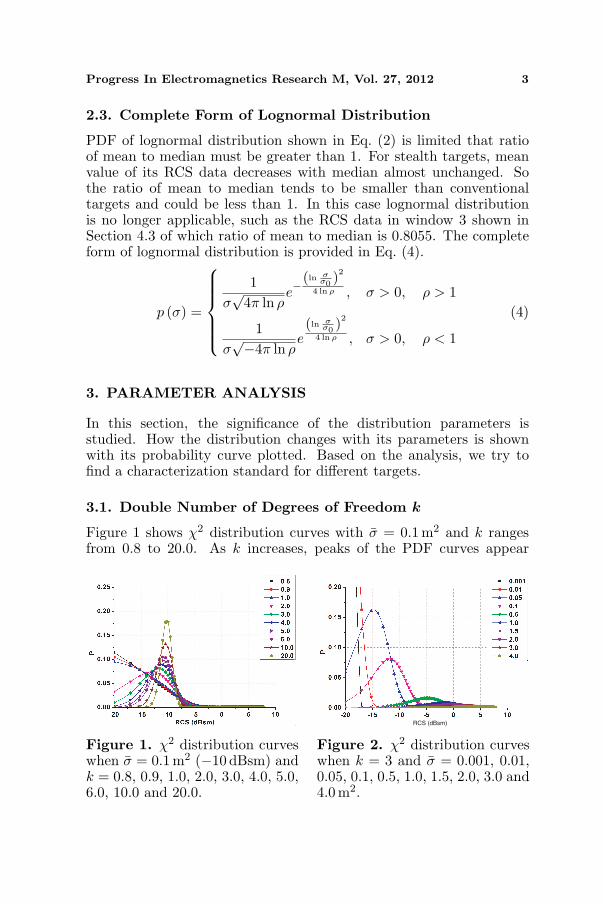
3.1. Double Number of Degrees of Freedom k
Figure 1 shows χ2 distribution curves with σ = 0.1m2 and k rangesfrom 0.8 to 20.0. As k increases, peaks of the PDF curves appear
Figure 1. χ2 distribution curveswhen σ = 0.1 m2 (−10 dBsm) andk = 0.8, 0.9, 1.0, 2.0, 3.0, 4.0, 5.0,6.0, 10.0 and 20.0.
RCS (dBsm)
Figure 2. χ2 distribution curveswhen k = 3 and σ = 0.001, 0.01,0.05, 0.1, 0.5, 1.0, 1.5, 2.0, 3.0 and4.0m2.
4 Shi, Shi, and Xu
around the mean value and become higher. Parameter k describes thecontribution of the main scatterer.
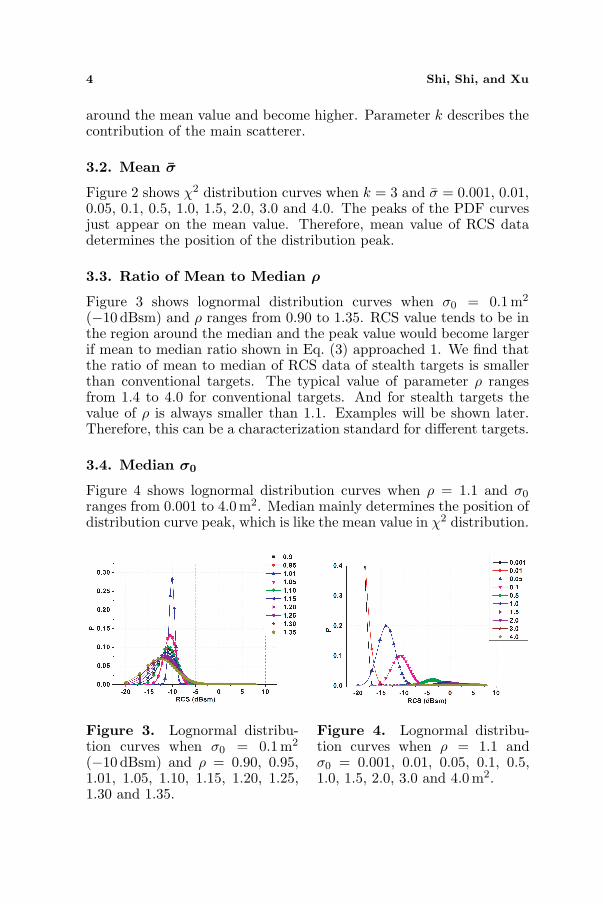
3.2. Mean σ
Figure 2 shows χ2 distribution curves when k = 3 and σ = 0.001, 0.01,0.05, 0.1, 0.5, 1.0, 1.5, 2.0, 3.0 and 4.0. The peaks of the PDF curvesjust appear on the mean value. Therefore, mean value of RCS datadetermines the position of the distribution peak.
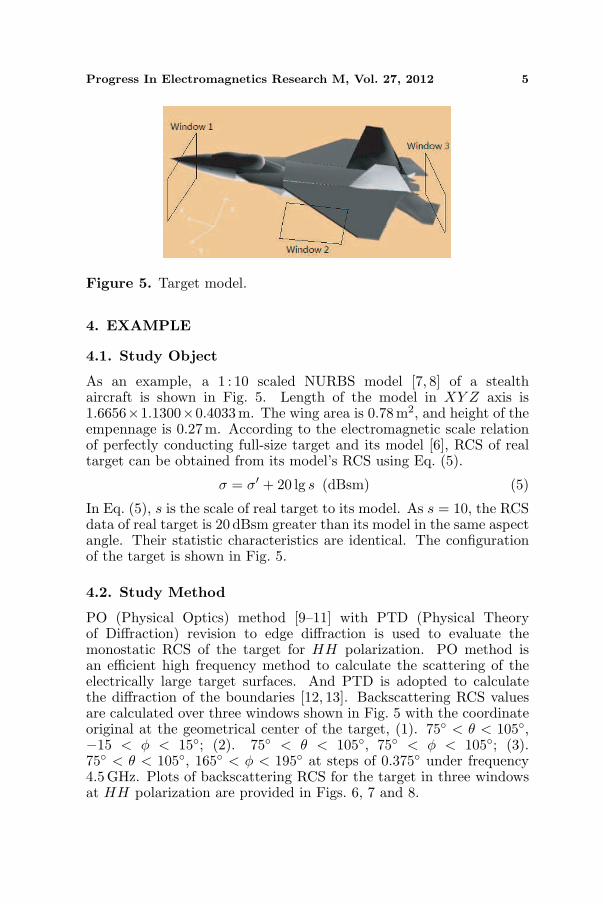
3.3. Ratio of Mean to Median ρ
Figure 3 shows lognormal distribution curves when σ0 = 0.1m2
(−10 dBsm) and ρ ranges from 0.90 to 1.35. RCS value tends to be inthe region around the median and the peak value would become largerif mean to median ratio shown in Eq. (3) approached 1. We find thatthe ratio of mean to median of RCS data of stealth targets is smallerthan conventional targets. The typical value of parameter ρ rangesfrom 1.4 to 4.0 for conventional targets. And for stealth targets thevalue of ρ is always smaller than 1.1. Examples will be shown later.Therefore, this can be a characterization standard for different targets.
3.4. Median σ0
Figure 4 shows lognormal distribution curves when ρ = 1.1 and σ0
ranges from 0.001 to 4.0m2. Median mainly determines the position ofdistribution curve peak, which is like the mean value in χ2 distribution.
Figure 3. Lognormal distribu-tion curves when σ0 = 0.1m2
(−10 dBsm) and ρ = 0.90, 0.95,1.01, 1.05, 1.10, 1.15, 1.20, 1.25,1.30 and 1.35.
Figure 4. Lognormal distribu-tion curves when ρ = 1.1 andσ0 = 0.001, 0.01, 0.05, 0.1, 0.5,1.0, 1.5, 2.0, 3.0 and 4.0 m2.
Progress In Electromagnetics Research M, Vol. 27, 2012 5
Figure 5. Target model.
4. EXAMPLE
4.1. Study Object
As an example, a 1 : 10 scaled NURBS model [7, 8] of a stealthaircraft is shown in Fig. 5. Length of the model in XY Z axis is1.6656×1.1300×0.4033m. The wing area is 0.78 m2, and height of theempennage is 0.27 m. According to the electromagnetic scale relationof perfectly conducting full-size target and its model [6], RCS of realtarget can be obtained from its model’s RCS using Eq. (5).
σ = σ′ + 20 lg s (dBsm) (5)
In Eq. (5), s is the scale of real target to its model. As s = 10, the RCSdata of real target is 20 dBsm greater than its model in the same aspectangle. Their statistic characteristics are identical. The configurationof the target is shown in Fig. 5.
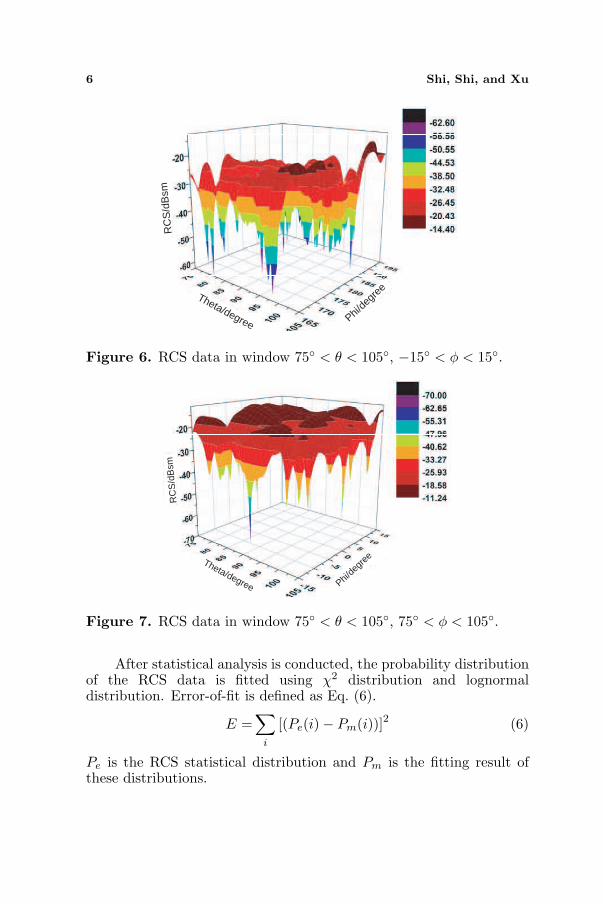
4.2. Study Method
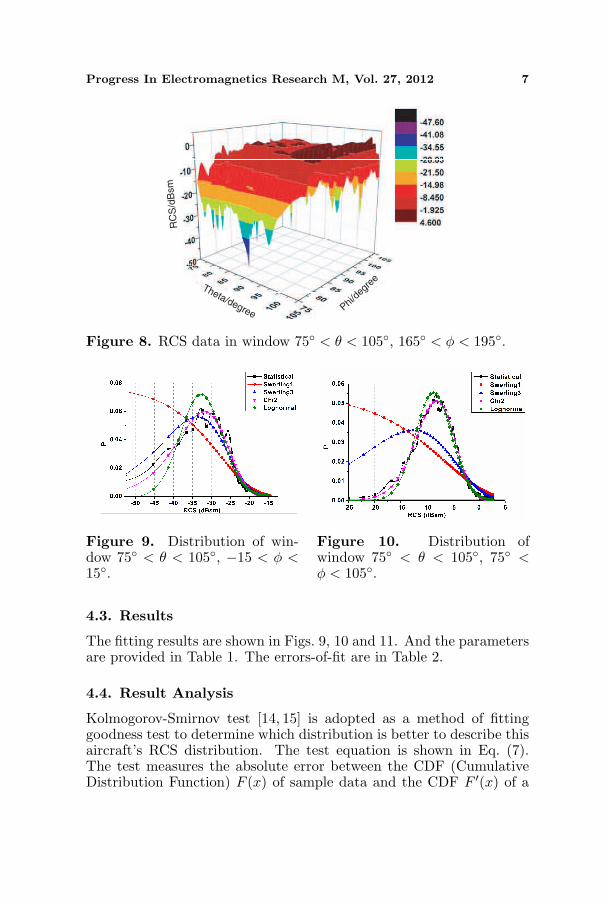
PO (Physical Optics) method [9–11] with PTD (Physical Theoryof Diffraction) revision to edge diffraction is used to evaluate themonostatic RCS of the target for HH polarization. PO method isan efficient high frequency method to calculate the scattering of theelectrically large target surfaces. And PTD is adopted to calculatethe diffraction of the boundaries [12, 13]. Backscattering RCS valuesare calculated over three windows shown in Fig. 5 with the coordinateoriginal at the geometrical center of the target, (1). 75◦ < θ < 105◦,−15 < φ < 15◦; (2). 75◦ < θ < 105◦, 75◦ < φ < 105◦; (3).75◦ < θ < 105◦, 165◦ < φ < 195◦ at steps of 0.375◦ under frequency4.5GHz. Plots of backscattering RCS for the target in three windowsat HH polarization are provided in Figs. 6, 7 and 8.
6 Shi, Shi, and Xu
Phi/de
greeTheta/degree
RC
S/d
Bsm
Figure 6. RCS data in window 75◦ < θ < 105◦, −15◦ < φ < 15◦.
RC
S/d
Bsm
Theta/degree Phi/de
gree
Figure 7. RCS data in window 75◦ < θ < 105◦, 75◦ < φ < 105◦.
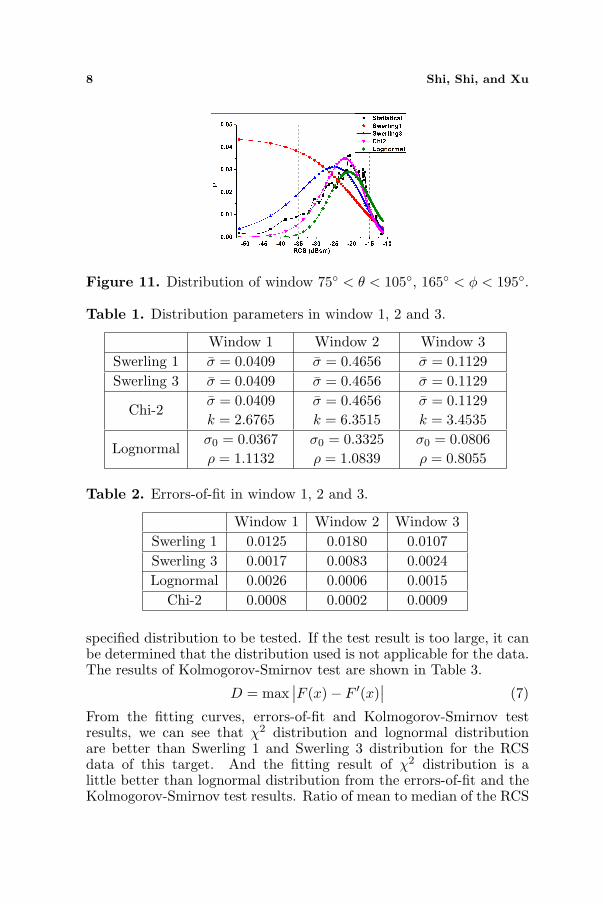
After statistical analysis is conducted, the probability distributionof the RCS data is fitted using χ2 distribution and lognormaldistribution. Error-of-fit is defined as Eq. (6).
E =∑
i
[(Pe(i)− Pm(i))]2 (6)
Pe is the RCS statistical distribution and Pm is the fitting result ofthese distributions.
Progress In Electromagnetics Research M, Vol. 27, 2012 7
Phi
/deg
ree
Theta/degree
RC
S/d
Bsm
Figure 8. RCS data in window 75◦ < θ < 105◦, 165◦ < φ < 195◦.
Figure 9. Distribution of win-dow 75◦ < θ < 105◦, −15 < φ <15◦.
Figure 10. Distribution ofwindow 75◦ < θ < 105◦, 75◦ <φ < 105◦.
4.3. Results
The fitting results are shown in Figs. 9, 10 and 11. And the parametersare provided in Table 1. The errors-of-fit are in Table 2.
4.4. Result Analysis
Kolmogorov-Smirnov test [14, 15] is adopted as a method of fittinggoodness test to determine which distribution is better to describe thisaircraft’s RCS distribution. The test equation is shown in Eq. (7).The test measures the absolute error between the CDF (CumulativeDistribution Function) F (x) of sample data and the CDF F ′(x) of a
8 Shi, Shi, and Xu
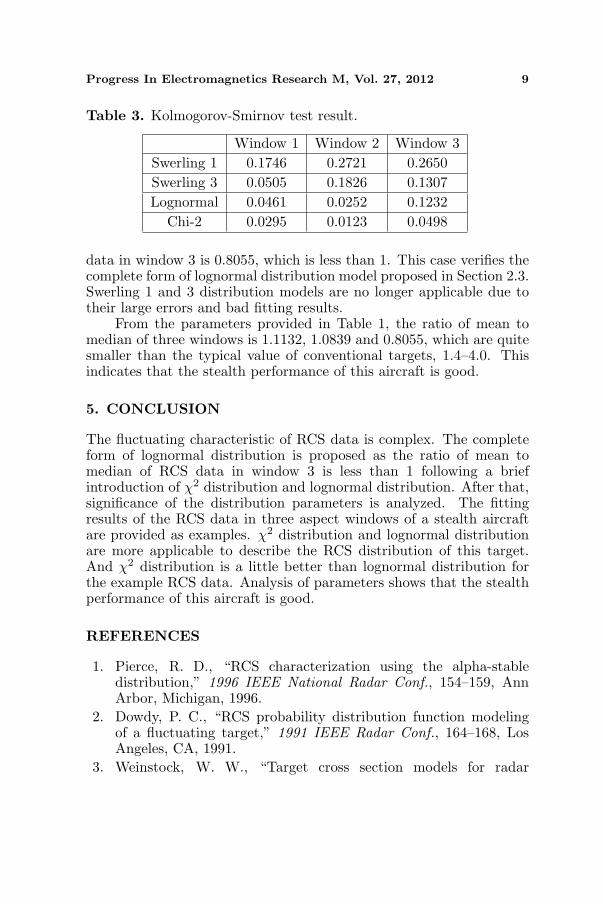
Figure 11. Distribution of window 75◦ < θ < 105◦, 165◦ < φ < 195◦.
Table 1. Distribution parameters in window 1, 2 and 3.
Window 1 Window 2 Window 3Swerling 1 σ = 0.0409 σ = 0.4656 σ = 0.1129Swerling 3 σ = 0.0409 σ = 0.4656 σ = 0.1129
Chi-2σ = 0.0409k = 2.6765
σ = 0.4656k = 6.3515
σ = 0.1129k = 3.4535
Lognormalσ0 = 0.0367ρ = 1.1132
σ0 = 0.3325ρ = 1.0839
σ0 = 0.0806ρ = 0.8055
Table 2. Errors-of-fit in window 1, 2 and 3.
Window 1 Window 2 Window 3Swerling 1 0.0125 0.0180 0.0107Swerling 3 0.0017 0.0083 0.0024Lognormal 0.0026 0.0006 0.0015
Chi-2 0.0008 0.0002 0.0009
specified distribution to be tested. If the test result is too large, it canbe determined that the distribution used is not applicable for the data.The results of Kolmogorov-Smirnov test are shown in Table 3.
D = max∣∣F (x)− F ′(x)
∣∣ (7)
From the fitting curves, errors-of-fit and Kolmogorov-Smirnov testresults, we can see that χ2 distribution and lognormal distributionare better than Swerling 1 and Swerling 3 distribution for the RCSdata of this target. And the fitting result of χ2 distribution is alittle better than lognormal distribution from the errors-of-fit and theKolmogorov-Smirnov test results. Ratio of mean to median of the RCS
Progress In Electromagnetics Research M, Vol. 27, 2012 9
Table 3. Kolmogorov-Smirnov test result.
Window 1 Window 2 Window 3Swerling 1 0.1746 0.2721 0.2650Swerling 3 0.0505 0.1826 0.1307Lognormal 0.0461 0.0252 0.1232
Chi-2 0.0295 0.0123 0.0498
data in window 3 is 0.8055, which is less than 1. This case verifies thecomplete form of lognormal distribution model proposed in Section 2.3.Swerling 1 and 3 distribution models are no longer applicable due totheir large errors and bad fitting results.
From the parameters provided in Table 1, the ratio of mean tomedian of three windows is 1.1132, 1.0839 and 0.8055, which are quitesmaller than the typical value of conventional targets, 1.4–4.0. Thisindicates that the stealth performance of this aircraft is good.
5. CONCLUSION
The fluctuating characteristic of RCS data is complex. The completeform of lognormal distribution is proposed as the ratio of mean tomedian of RCS data in window 3 is less than 1 following a briefintroduction of χ2 distribution and lognormal distribution. After that,significance of the distribution parameters is analyzed. The fittingresults of the RCS data in three aspect windows of a stealth aircraftare provided as examples. χ2 distribution and lognormal distributionare more applicable to describe the RCS distribution of this target.And χ2 distribution is a little better than lognormal distribution forthe example RCS data. Analysis of parameters shows that the stealthperformance of this aircraft is good.
REFERENCES
1. Pierce, R. D., “RCS characterization using the alpha-stabledistribution,” 1996 IEEE National Radar Conf., 154–159, AnnArbor, Michigan, 1996.
2. Dowdy, P. C., “RCS probability distribution function modelingof a fluctuating target,” 1991 IEEE Radar Conf., 164–168, LosAngeles, CA, 1991.
3. Weinstock, W. W., “Target cross section models for radar
10 Shi, Shi, and Xu
systems analysis,” Ph.D. Dissertation, University of Pennsylvania,Philadelphia, 1956.
4. Mayer, D. P. and H. A. Mayer, Radar Target Detection —Handbook of Theory and Practice, Academic Press, New York,1973.
5. Shnidman, D. A., “Expanded swerling target models,” IEEETrans. on Aerosp. Electron. Syst., Vol. 39, No. 3, 1059–1069, 2003.
6. Huang, P. K., H. C. Yin, and X. J. Xu, Radar Target Properties,20–120, Publishing House of Electronics Industry, Beijing, 2006(in Chinese).
7. Shi, F. Z., CAGD and NURBS, Higher Education Press, Beijing,2001 (in Chinese).
8. Zhao, Y., X.-W. Shi, and L. Xu, “Modeling with NURBS surfacesused for calculation of RCS,” Progress In ElectromagneticsResearch, Vol. 78, 49–59, 2008.
9. Wu, Y., L. Jiang, and W. C. Chew, “An efficient method forcomputing highly oscillatory physical optics integral,” Progress InElectromagnetics Research, Vol. 127, 211–257, 2012.
10. Chen, M., Y. Zhang, and C. H. Liang, “Calculation of thefield distribution near electrically large nurbs surfaces withphysical-optics method,” Journal of Electromagnetic Waves andApplications, Vol. 19, No. 11, 1511–1524, 2005.
11. Li, J. B., X. S. Wang, and L. H. Qu, “Calculation of physical opticsintegral over NURBS surface using a delaminating quadraturemethod,” IEEE Transactions on Antennas and Propagation,Vol. 60, No. 5, 2388–2397, 2012.
12. Hu, B., X.-W. Xu, M. He, and Y. Zheng, “More accuratehybrid PO-MoM analysis for an electrically large antenna-radomestructure,” Progress In Electromagnetics Research, Vol. 92, 255–265, 2009.
13. Hemon, R., P. Pouliguen, H. He, J. Saillard, and J.-F. Damiens,“Computation of EM field scattered by an open-ended cavity andby a cavity under radome using the iterative physical optics,”Progress In Electromagnetics Research, Vol. 80, 77–105, 2008.
14. Kononov, A. A., A. Wyholt, G. Sandberg, and L. M. H. Ulander,“Statistical analysis of VHF-band tree backscattering using forestground truth data and PO scattering model,” IEEE Transactionson Geoscience and Remote Sensing, Vol. 49, No. 8, 3035–3046,2011.
15. Teng, S. Z., Mathematical Statistics, Press of DUT, Dalian,Jul. 2002 (in Chinese).