R · Web viewFigure 3. These are the electron densities shown through the program of Coot. The blue...
20
X-Ray Crystallographic Analyses of the Antimicrobial Resistant Enzymes β -lactamases and Aminoglycoside Phosphotransferases Matthew Au Office of Science, Science Undergraduate Laboratory Internship (SULI) University of California: Merced Stanford Linear Accelerator Center (SLAC) Menlo Park, CA August 12, 2012 Prepared in partial fulfillment of the requirements of the Office of Science, Department of Energy’s Science Undergraduate Laboratory Internship under the direction of Clyde Smith in the Basic Sciences Division at the Stanford Linear Accelerator Center.
-
Upload
nguyennhan -
Category
Documents
-
view
216 -
download
0
Transcript of R · Web viewFigure 3. These are the electron densities shown through the program of Coot. The blue...
X-Ray Crystallographic Analyses of the Antimicrobial Resistant Enzymes β-lactamases and Aminoglycoside Phosphotransferases
Matthew Au
Office of Science, Science Undergraduate Laboratory Internship (SULI)
University of California: Merced
Stanford Linear Accelerator Center (SLAC)
Menlo Park, CA
August 12, 2012
Prepared in partial fulfillment of the requirements of the Office of Science, Department of
Energy’s Science Undergraduate Laboratory Internship under the direction of Clyde Smith in the
Basic Sciences Division at the Stanford Linear Accelerator Center.
Participant: Signature
Research Advisor: Signature
Table of Contents
Abstract 3
Introduction 4
Materials & Methods 6
Results 10
Discussion & Conclusion 12
Acknowledgements 13
References 14
2
Abstract
X-Ray Crystallographic Analyses of the Antimicrobial Resistant Enzymes β-lactamases and
Aminoglycoside Phosphotransferases. MATTHEW AU (University of California, Merced, CA
94116) CLYDE SMITH (Stanford Linear Accelerator Center, Menlo Park, CA 94025)
3
Introduction
Long before the discovery of antibiotics 80 years ago, bacteria have been using similar
molecules as a type of “chemical warfare” against other bacteria, and have also developed
defense mechanisms against the “weapons” used by enemy bacteria, primarily catalytic enzymes
capable of destroying or neutralizing the chemical “weapons” employed in these ancient battles.
The discovery of penicillin in 1928 was a breakthrough in the treatment of the easily-contracted
infectious diseases, only to be rendered useless a few years later by these defense mechanisms of
the ever-evolving bacteria. Since then, scientists and bacteria have been playing an endless game
of tag. This chase has produced thousands of different antibiotics, over half of which many
strains of bacteria have now developed resistance to. Apart from reducing the dosage of
antibiotics and similar small steps in an effort to win this battle, scientists must understand
antibiotic resistance at a molecular level by looking at the structures and mechanisms of enzymes
employed by resistant bacteria.
The first group of resistant enzymes, the β-lactamases, is responsible for fighting off
antibiotics such as the pioneering antibiotic penicillins, cephalosporins, carbapenems, and
monobactams [1]. Their given name refers to their ability to target the antibiotic’s four
memebered β-lactam ring, which grants it its antibiotic properties by preventing the bacterium
from forming cell walls. The β-lactamase enzymes are thought to have evolved from enzymes
responsible for the buildup of the bacterial cell wall. They bind the drugs and hydrolyze the ring,
dismantling the ring and making the drug incapable of killing bacteria. Under the umbrella of β-
lactamases, there lie four various molecular classes based on their amino acid sequence
identities: A, B, C, and D [2]. Class A, C, and D enzymes require an active-site of serine for
catalysis, whereas class B enzymes are metal dependent [3]. Class A β-lactamases are the most
4
abundant and diverse family of enzymes, which include this project’s main focus of the Guiana
Extended-Spectrum (GES) [2]. The first Guiana Extended-Spectrum was described in 2000,
GES-1, and later split into 8 other different types of GES enzymes. The GES-1 enzyme shows a
low level of carbapenemase activity compared to the other GES enzymes but however possesses
a potential to evolve into a stronger “carbapenem killer” [2][3]. The GES-1 enzyme will provide
the appropriate binding structure for our focus of the three carbapenem antibiotics: Meropenem,
Ertapenem, and Doripenem.
In addition to giving birth to the family of β-lactamases, bacteria produce the
antimicrobial resistant aminoglycoside-modifying enzymes. It is then branched out to three
major groups: aminoglycoside N-acetyltransferase (AAC), aminoglycoside O-adenyltransferase
(ANT), and aminoglycoside O-phosphotransferase (APH). From their names, each enzyme adds
its respective group (acetyl group, adenyl group, or phosphate group) to the aminoglycoside
antibiotics such as arbekacin, kanamycin, neomycin, streptomycin, gentamicin, and
paromomycin in order to deactivate them [5]. The aminoglycosides have mechanisms that
mutate the ribosomal target, reduce permeability and/or increased efflux of the drug, and
enzymatically deactivate the drug [6]. This project falls under the aminoglycoside 3’-
phosphotransferase family, more specifically the APH(2”) enzymes. Within this family, there
are other enzymes named APH(2”)-Ia, -Ib, -Ic, and -Id. However, scientists figured out these
enzymes only have a 28% - 32% amino acid sequence identity and their substrate profiles differ.
Therefore categorizing them into APH(2”)-Ia, -IIa, -IIIa, and –IVa, respectively [4]. The enzyme,
APH(2”)-IIa, confers resistance to a small subset of these aminoglycosides. These APH’s
phosphorylate by sending the medium, phosphate group, derived from ATP, to the antibiotic. A
mutant of this enzyme (R92H/D268N) has been discovered that exhibits newly-elevated
5
resistance towards two additional antibiotics (amikacin and isepamicin) compared to the wild-
type enzyme.
Materials & Methods
The protein crystallization process has been grown and completed for both the
aminoglycoside-3’ phosphotransferase [APH(2”)-IIA] and the GES-1 β-lactamase enzyme. The
methodologies for the crystal structure can be found in various research studies [3][4].
Data Collection and Processing
Once the protein was crystallized, X-ray crystallography gave us the necessary data,
pictures that were taken at and per second. The GES-1 carbapenems had around 500 to 600
pictures each, which was first processed through the program of HKL2000. HKL2000 aids in
solving the unit cell by using the “Index” and “Integrating” tab, which gives us our angles (a, b,
c, and β) in our cube-like crystal:
Figure 1. This is the typical model for the unit cell. Each letter represents an angle of the cell except for
x, y, and z, which are the axes labels.
It cross-references various models in a Bravais Lattice Table to find the best match; the lower the
percentage (≈ 0.00%), the better the fit is:
6
Figure 2. The Bravais Lattice Table of the Doripenem. The lowest percentage is shown in green; first
green is the reference. Primitive monoclinic space group fits for Doripenem.
The output file should be “Scaled” to a .sca format and converted to .mtz to find out the space
group.
CCP4i, the next program, contains the programs MolRep (Molecular Replacement) and
RefMac5 (Refinement Molecule) which brings the quantitative data into a more visual and
graphics-integrated model of the molecule with the assist of Coot. MolRep applies an already
known protein structure from the PDB (Protein Data Base) to the newly constructed GES-1
carbapenem and isepemicin aminoglycoside bound structures. The electron densities should
match up with amino acid side chains and the main chain. We manually check over 2000
specific bonds and molecules for any errors of the resistant enzymes first before adding on the
antibiotics in order to avoid inaccurate placements. A couple of factors are taken into
7
consideration while modifying and refining include isomer (same molecule but atoms are in
different positions) and determining if water/magnesium/chloride molecules are significant or
not. This is done at around 1.00 rmsd, sigma; the lower the sigma, the larger the electron density
cloud gets:
(a) (b) (c)
Figure 3. These are the electron densities shown through the program of Coot. The blue clouds represent
the actual electron density and the yellow lines are the enzyme structure. (a) represents the electron
density rmsd at 1.60; (b) represents the electron density rmsd at 1.00; (c) represents the electron density
rmsd at 0.40.
After a few rounds of refinement (matching the enzyme in the blue electron density as best as
possible), the R-free and R-work should drop around 0.2000 and almost equalize. The final and
most useful program is Phenix (Python-based Hierarchical Environment for Integrated
Xtallography), which acts as a fine-tune system to help you center everything in the blue electron
density within a reasonable distance. After the R-free and R-work are at a desired number, the
refinement is run again but anisotropically: without waters.
8
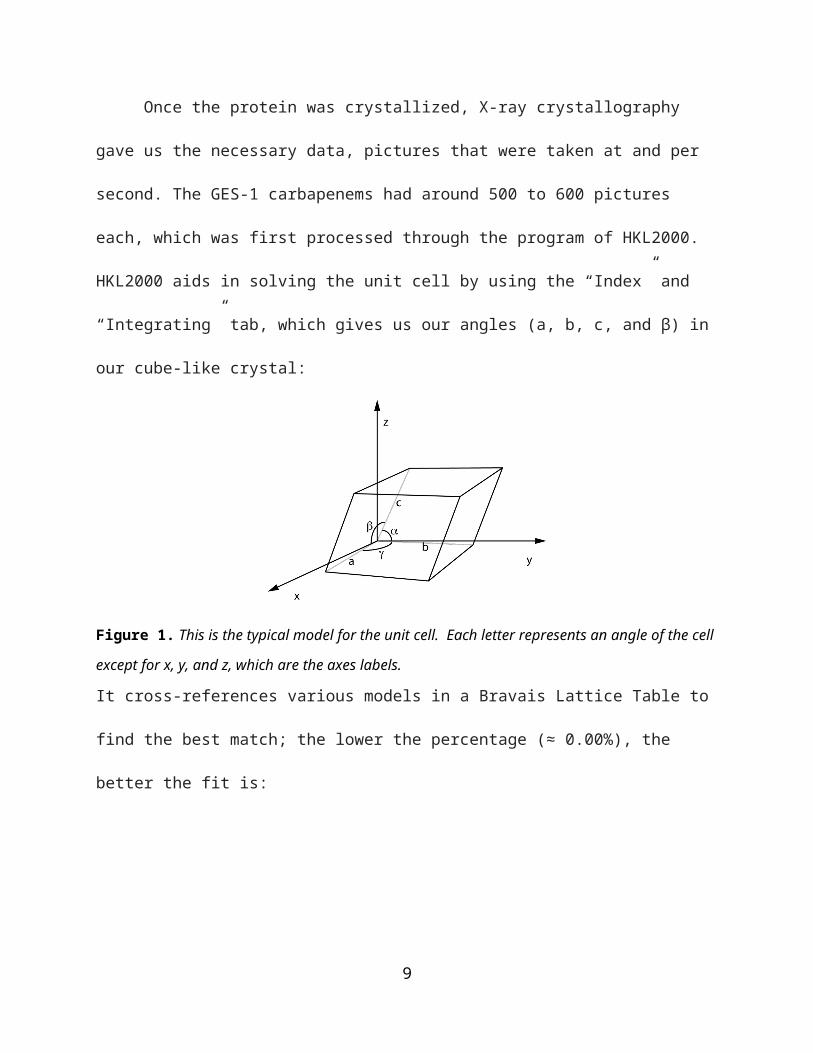
Figure 4. This is the overall results of the Phenix refinement program. It provides the Resolution, R-
work, R-free, RMS(bonds), RMS(angles), and Ramachandran which will be useful for our data.
Addition of the antibiotics
When comfortable with the enzyme that was built, HIC-Up provides the correct protein
data base for each of the antibiotics [7]. The structure is loaded along with a .cif file, which
allows the modifier to alter the bond angles and types. In case the drug is an isomer of the
provided electron density, ccp4i provides a monomer library sketcher that matches the correct
configuration. For the GES-1 carbapenems, the active site for where the inhibitor is bound is at
an oxygen on Serine 64 to the carbon C7 atom of the meropenem, doripenem, or the ertapenem.
9
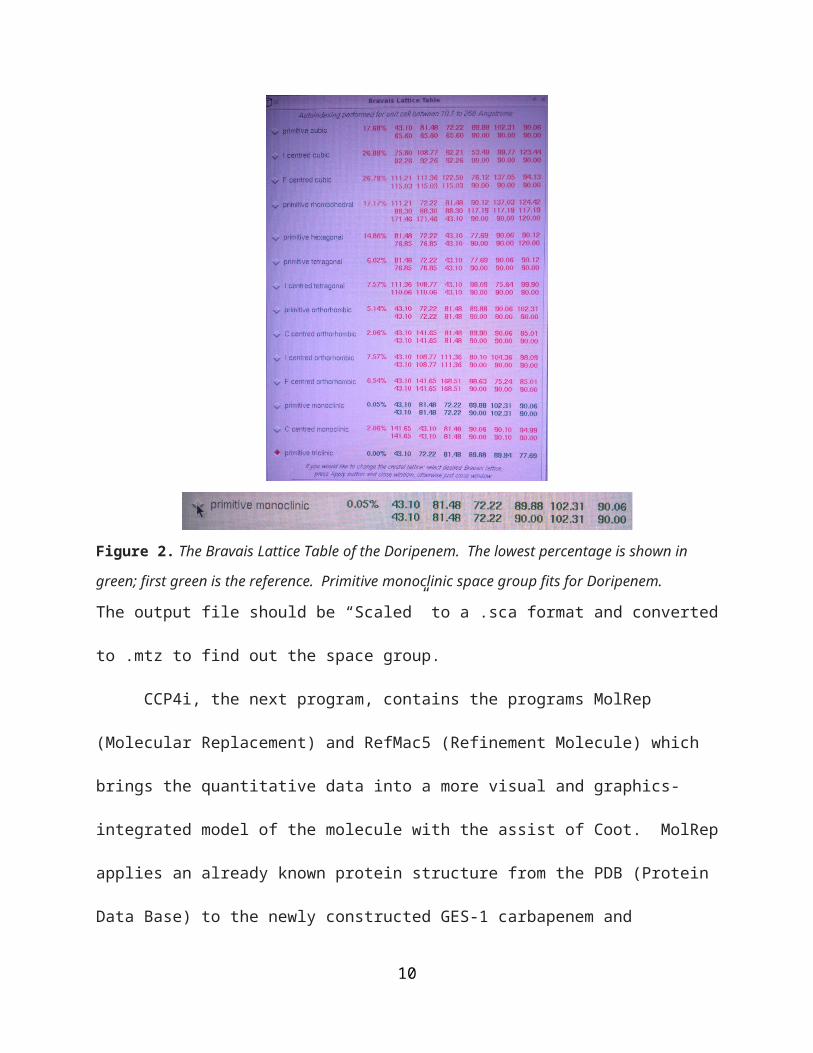
Figure 5. Addition of Ertapenem in yellow. Light blue line on the right represents SER64, the binding
site. The green electron density signifies a different conformation.
Results
GES-1 Carbapenems
Table 1. Data Collection Statistics for GES-1 Carbapenems
Doripenem Ertapenem Meropenem
Maximum resolution (dmin) (Å) 1.339 1.457 1.463
Unit cell dimensions
a (Å) 43.01 43.04 42.94
b (Å) 81.28 81.11 81.24
c (Å) 71.89 72.24 71.93
(°)
Space Group
102.25
P2 1
102.34
P2 1
102.0
P2 1
Observed reflections 507,305 1,190,305 879,901
Unique reflections to dmin 108,460 83,892 84,243
Rmerge a (%)
I/I 10.0 11.8 11.4
Completeness (%)
Redundancy 2.6 2.7 4.2a Rmerge = |I - <I>| / I x 100, where I = the observed intensity and <I> is the mean intensity.
10

Table 2. Structure Refinement Statistics for GES-1 Carbapenems
Doripenem Ertapenem Meropenem
Resolution range (Å) 28.5 – 1.3 30.7 – 1.4 29.2 – 1.4
Rwork (%) 0.1559 0.1721 0.1536
Rfree (%) 0.2019 0.2065 0.1876
Rall (%) b
rms deviation from ideality
- bonds (Å) 0.006 0.006 0.006
- angles (Å) 1.39 1.33 1.28
Ramachandran plot
- residues in favored regions(%) 98.3 98.3 98.3b Calculated using all reflections (working and free).
APH(2”)-IIa Mutant
Table 3. Data Collection Statistics for APH(2”)-IIa R92H/D268N mutant
R92H/D268N mutant
Maximum resolution (dmin) (Å) 1.219
Unit cell dimensions
a (Å) 97.63
b (Å) 103.93
c (Å) 70.70
β (°)
Space Group
102.99
C2
Observed reflections 3,339,714
Unique reflections to dmin 203,457
Rmerge a (%)
I/I 13.4
Completeness (%)
Redundancy 3.0
11
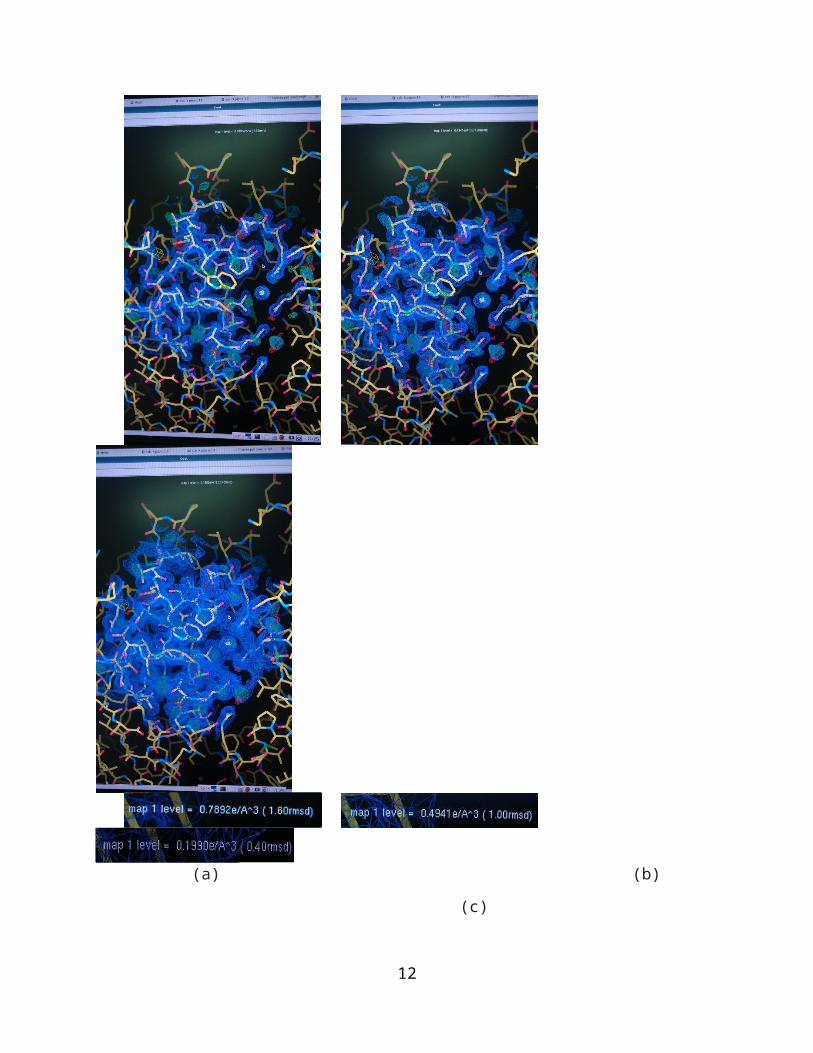
Table 4. Structure Refinement Statistics for APH(2”)-IIa R92H/D268N mutant
R92H/D268N mutant
Resolution range (Å) 20.0 – 1.89
Rwork (%) 0.1624
Rfree (%) 0.1939
Rall (%) b
rms deviation from ideality
- bonds (Å) 0.005
- angles (Å) 1.099
Ramachandran plot
- residues in favored regions 98.5 %
Discussion & Conclusion
12

Acknowledgements
This research was conducted at the Stanford Linear Accelerator Center. I would like to
express my gratitude to my mentor, Clyde Smith, for sharing his expertise, patience, and
attention during my short time here. Thank you also to the U.S. Department of Energy for the
unique opportunity of participating in the SULI program, one of the most useful learning
experiences I’ve ever been privileged to take part in.
References
[1] Fred C. Tenover, “Mechanisms of Antimicrobial Resistance in Bacteria”, The American Journal of Medicine, Vol. 119, (6A), S3-S10, Mar. 2006
[2] Jan Walther-Rasmussen, Niels Hoiby, “Class A carbapenemases”, Journal of Antimicrobial Chemotherapy, Vol. 60, 470-482, Jun. 2007
[3] C. A. Smith, M. Caccamo, K. A. Kantardjieff, and S. Vakulenko, “Structure of GES-1 at atomic resolution: insights into the evolution of carbapenemase activity in the class A extended-spectrum β-lactamases”, Acta Crystallographica D, Vol. 63, Part 9, pp 982-992, 2007
[4] Marta Toth, Hilary Frase, Joseph W. Chow, Clyde Smith, and Sergei B. Vakulenko, “Mutant APH(2”)-IIa Enzymes with Increased Activity against Amikacin and Isepamicin”, Antimicrobial Agents and Chemotherapy, Vol. 54, No.4, 1590-1595, Jan. 2010
[5] Gerard D Wright, “Aminoglycoside-modifying enzymes”, Antimicrobial Research Centre, 499- 503, 1999
[6] Paul G Young, Rupa Walanj, Vendula Lakshmi, Laura J. Byrnes, Peter Metcalf, Edward N. Baker, Sergei B. Vakulenko, and Clyde Smith, “The Crystal Structures of Substrate and Nucleotide Complexes of Enterococcus faecium Aminoglycoside-2” – Phosphotransferase-IIa [APH(2”)-IIa] Provide Insights into Substrate Selectivity in the APH(2”) Subfamily”, Journal of Bacteriology, Vol. 191, No. 13, 4133-4143, Apr. 2009
[7] Kleywegt, G.J. (2007). Crystallographic refinement of ligand complexes. Acta Cryst D63, 94-100
13