QSAR and docking studies of inhibition activity of 5,6...
18
Turk J Chem 35 (2011) , 481 – 498. c T ¨ UB ˙ ITAK doi:10.3906/kim-0901-33 QSAR and docking studies of inhibition activity of 5,6-dihydro 11-alkylbenzo[ α ]carbazole derivatives against estrogen receptor Tu˘ gba TAS ¸KIN 1 , Fatma SEV ˙ IN 2, ∗ 1 Gaziantep University, Faculty of Art and Science, Department of Chemistry, 27310 S ¸ehitkamil, Gaziantep-TURKEY 2 Hacettepe University, Faculty of Science, Department of Chemistry, 06800 Beytepe, Ankara-TURKEY e-mail: [email protected] Received: 22.01.2009 In the present study, QSAR and docking studies were applied to understand the nature of 5,6-dihydro 11-alkylbenzo[ α ]carbazole derivatives and to investigate the interactions of homolog series with binding sites on selected a-chains of human estrogen receptors (hER). The best QSAR model was selected, having the correlation coefficient r = 0.924, squared correlation coefficient r 2 = 0.854, standard deviation s = 0.357, and cross-validated squared correlation coefficient Q 2 = 0.755. The QSAR model indicated that the descriptors E-HOMO and heat of formation play an important role in human estrogen receptor inhibitor activities. A docking study was also utilized to visualize the interactions between the selected 2 compounds, 2 and 3, as estrogen inhibitors and human estrogen receptor. The results of the present study may be useful in the designing of more potent 5,6-dihydro 11-alkylbenzo[ α ]carbazole derivatives as estrogen receptor inhibitor agents. Key Words: QSAR, docking, estrogen receptor inhibitors, 5,6-dihydro 11-alkylbenzo[ α ]carbazole deriva- tives Introduction Benzodihydro[ α ]carbazole (BDHC) has been reported as a primary compound for the synthesis of various drugs and possesses important biological, pharmacological, and medicinal activities. 1−10 BDHC is associated ∗ Corresponding author 481
Transcript of QSAR and docking studies of inhibition activity of 5,6...
Turk J Chem
35 (2011) , 481 – 498.
c© TUBITAK
doi:10.3906/kim-0901-33
QSAR and docking studies of inhibition activity of
5,6-dihydro 11-alkylbenzo[α]carbazole derivatives
against estrogen receptor
Tugba TASKIN1, Fatma SEVIN2,∗
1Gaziantep University, Faculty of Art and Science, Department of Chemistry,27310 Sehitkamil, Gaziantep-TURKEY
2Hacettepe University, Faculty of Science, Department of Chemistry,06800 Beytepe, Ankara-TURKEY
e-mail: [email protected]
Received: 22.01.2009
In the present study, QSAR and docking studies were applied to understand the nature of 5,6-dihydro
11-alkylbenzo[α ]carbazole derivatives and to investigate the interactions of homolog series with binding sites
on selected a-chains of human estrogen receptors (hER). The best QSAR model was selected, having the
correlation coefficient r = 0.924, squared correlation coefficient r2 = 0.854, standard deviation s = 0.357, and
cross-validated squared correlation coefficient Q2 = 0.755. The QSAR model indicated that the descriptors
E-HOMO and heat of formation play an important role in human estrogen receptor inhibitor activities. A
docking study was also utilized to visualize the interactions between the selected 2 compounds, 2 and 3,
as estrogen inhibitors and human estrogen receptor. The results of the present study may be useful in the
designing of more potent 5,6-dihydro 11-alkylbenzo[α ]carbazole derivatives as estrogen receptor inhibitor
agents.
Key Words: QSAR, docking, estrogen receptor inhibitors, 5,6-dihydro 11-alkylbenzo[α ]carbazole deriva-
tives
Introduction
Benzodihydro[α ]carbazole (BDHC) has been reported as a primary compound for the synthesis of various
drugs and possesses important biological, pharmacological, and medicinal activities.1−10 BDHC is associated∗Corresponding author
481
QSAR and docking studies of inhibition activity of 5,6-dihydro..., T. TASKIN, F. SEVIN
with anticancer, antimicrobial, and antifungal activities.7,8 In most cases, biological activity is correlated withBDHC containing heteroatoms, which depends on the interaction potential with DNA.11,12 Furthermore, manyexperimental studies have indicated that the size, shape, and planarity of this structure are important criteriain such an interaction.13 Poliakoff et al. also observed that the biological effect is produced by chemicalmodification at the region of the compounds that contains an N-substituted indole part with a benzene ring.14
In the case of some indefinite actions in many experimental studies, computational studies such as QSAR15
and docking studies have been used to illuminate and elucidate the actions. In our previous study,16 5,6-dihydro-11H-benzo[a]carbazole with electron-withdrawing and electron-donating substituents (80 compounds)were performed only at the B3LYP/6-31G* level of DFT theory to investigate the chemical and biochemicalactivities of BDHC derivatives. Molecular electron density of BDHC derivatives were also investigated by usingthe Mulliken charges of these compounds.
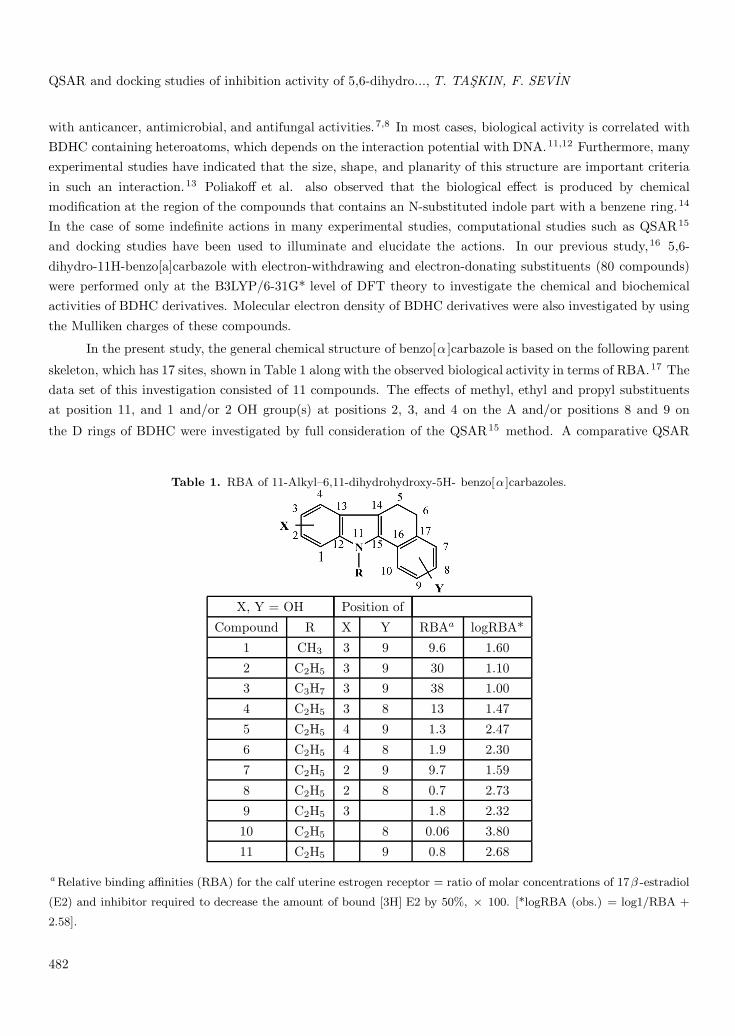
In the present study, the general chemical structure of benzo[α ]carbazole is based on the following parent
skeleton, which has 17 sites, shown in Table 1 along with the observed biological activity in terms of RBA.17 Thedata set of this investigation consisted of 11 compounds. The effects of methyl, ethyl and propyl substituentsat position 11, and 1 and/or 2 OH group(s) at positions 2, 3, and 4 on the A and/or positions 8 and 9 on
the D rings of BDHC were investigated by full consideration of the QSAR15 method. A comparative QSAR
Table 1. RBA of 11-Alkyl–6,11-dihydrohydroxy-5H- benzo[α ]carbazoles.
X, Y = OH Position of
Compound R X Y RBAa logRBA*
1 CH3 3 9 9.6 1.60
2 C2H5 3 9 30 1.103 C3H7 3 9 38 1.00
4 C2H5 3 8 13 1.47
5 C2H5 4 9 1.3 2.47
6 C2H5 4 8 1.9 2.30
7 C2H5 2 9 9.7 1.59
8 C2H5 2 8 0.7 2.73
9 C2H5 3 1.8 2.32
10 C2H5 8 0.06 3.80
11 C2H5 9 0.8 2.68
a Relative binding affinities (RBA) for the calf uterine estrogen receptor = ratio of molar concentrations of 17β -estradiol
(E2) and inhibitor required to decrease the amount of bound [3H] E2 by 50%, × 100. [*logRBA (obs.) = log1/RBA +
2.58].
482
QSAR and docking studies of inhibition activity of 5,6-dihydro..., T. TASKIN, F. SEVIN
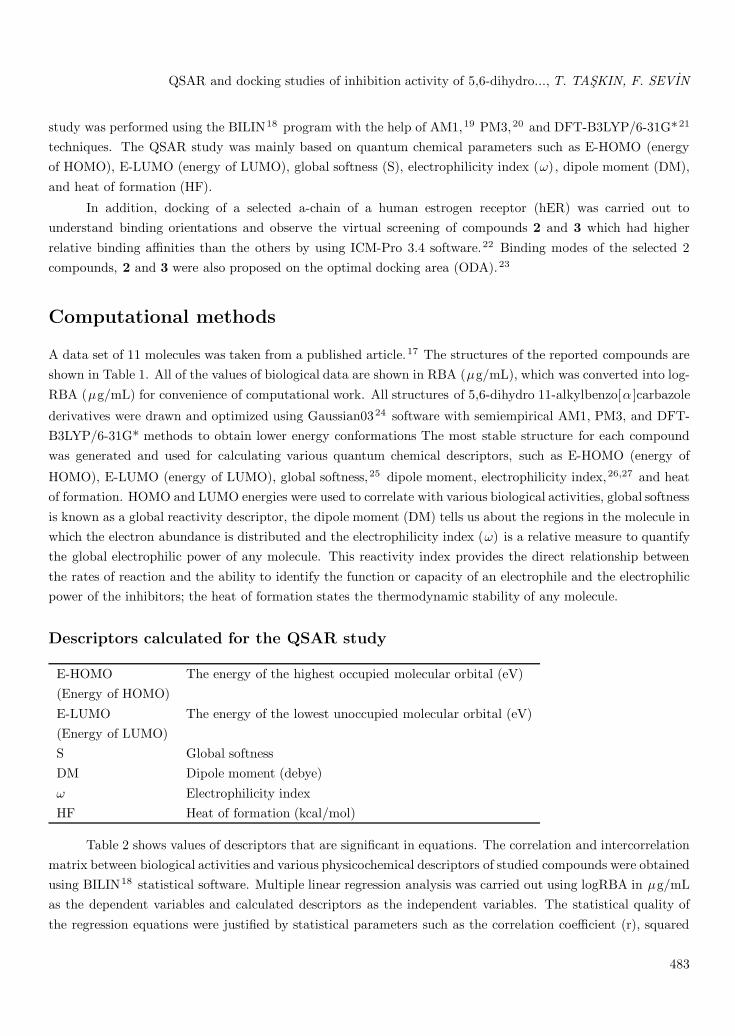
study was performed using the BILIN18 program with the help of AM1,19 PM3,20 and DFT-B3LYP/6-31G*21
techniques. The QSAR study was mainly based on quantum chemical parameters such as E-HOMO (energyof HOMO), E-LUMO (energy of LUMO), global softness (S), electrophilicity index (ω), dipole moment (DM),and heat of formation (HF).
In addition, docking of a selected a-chain of a human estrogen receptor (hER) was carried out tounderstand binding orientations and observe the virtual screening of compounds 2 and 3 which had higherrelative binding affinities than the others by using ICM-Pro 3.4 software.22 Binding modes of the selected 2compounds, 2 and 3 were also proposed on the optimal docking area (ODA).23
Computational methods
A data set of 11 molecules was taken from a published article.17 The structures of the reported compounds areshown in Table 1. All of the values of biological data are shown in RBA (μg/mL), which was converted into log-RBA (μg/mL) for convenience of computational work. All structures of 5,6-dihydro 11-alkylbenzo[α ]carbazole
derivatives were drawn and optimized using Gaussian0324 software with semiempirical AM1, PM3, and DFT-B3LYP/6-31G* methods to obtain lower energy conformations The most stable structure for each compoundwas generated and used for calculating various quantum chemical descriptors, such as E-HOMO (energy of
HOMO), E-LUMO (energy of LUMO), global softness,25 dipole moment, electrophilicity index,26,27 and heatof formation. HOMO and LUMO energies were used to correlate with various biological activities, global softnessis known as a global reactivity descriptor, the dipole moment (DM) tells us about the regions in the molecule inwhich the electron abundance is distributed and the electrophilicity index (ω) is a relative measure to quantifythe global electrophilic power of any molecule. This reactivity index provides the direct relationship betweenthe rates of reaction and the ability to identify the function or capacity of an electrophile and the electrophilicpower of the inhibitors; the heat of formation states the thermodynamic stability of any molecule.
Descriptors calculated for the QSAR study
E-HOMO The energy of the highest occupied molecular orbital (eV)(Energy of HOMO)E-LUMO The energy of the lowest unoccupied molecular orbital (eV)(Energy of LUMO)S Global softnessDM Dipole moment (debye)ω Electrophilicity indexHF Heat of formation (kcal/mol)
Table 2 shows values of descriptors that are significant in equations. The correlation and intercorrelationmatrix between biological activities and various physicochemical descriptors of studied compounds were obtainedusing BILIN18 statistical software. Multiple linear regression analysis was carried out using logRBA in μg/mLas the dependent variables and calculated descriptors as the independent variables. The statistical quality ofthe regression equations were justified by statistical parameters such as the correlation coefficient (r), squared
483
QSAR and docking studies of inhibition activity of 5,6-dihydro..., T. TASKIN, F. SEVIN
correlation coefficient (r2), standard error of estimate (s), F-test value (ratio between the variances of observedand calculated activities, F), Probability factor related to F ratio (P) and t value. In addition, the predictive
powers of the equations were validated by the leave-one-out (LOO) cross-validation method.28 The cross-
validated squared correlation coefficient (Q2) was considered for the validation of these models.
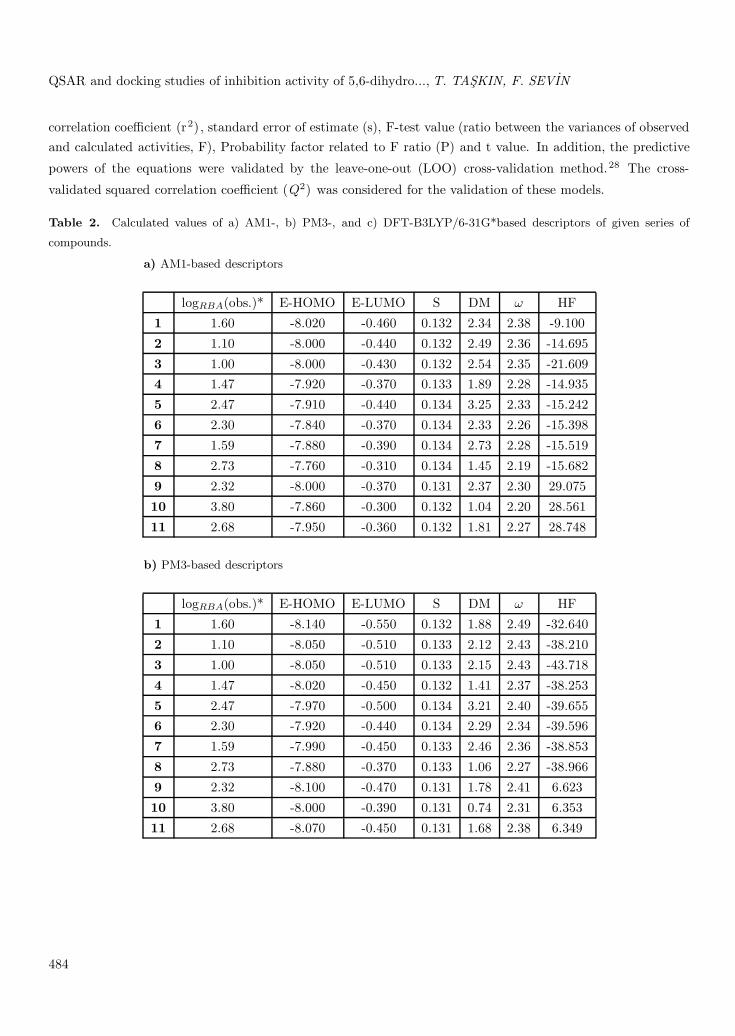
Table 2. Calculated values of a) AM1-, b) PM3-, and c) DFT-B3LYP/6-31G*based descriptors of given series of
compounds.
a) AM1-based descriptors
logRBA(obs.)* E-HOMO E-LUMO S DM ω HF
1 1.60 -8.020 -0.460 0.132 2.34 2.38 -9.100
2 1.10 -8.000 -0.440 0.132 2.49 2.36 -14.695
3 1.00 -8.000 -0.430 0.132 2.54 2.35 -21.6094 1.47 -7.920 -0.370 0.133 1.89 2.28 -14.935
5 2.47 -7.910 -0.440 0.134 3.25 2.33 -15.242
6 2.30 -7.840 -0.370 0.134 2.33 2.26 -15.398
7 1.59 -7.880 -0.390 0.134 2.73 2.28 -15.519
8 2.73 -7.760 -0.310 0.134 1.45 2.19 -15.682
9 2.32 -8.000 -0.370 0.131 2.37 2.30 29.075
10 3.80 -7.860 -0.300 0.132 1.04 2.20 28.561
11 2.68 -7.950 -0.360 0.132 1.81 2.27 28.748
b) PM3-based descriptors
logRBA(obs.)* E-HOMO E-LUMO S DM ω HF
1 1.60 -8.140 -0.550 0.132 1.88 2.49 -32.640
2 1.10 -8.050 -0.510 0.133 2.12 2.43 -38.210
3 1.00 -8.050 -0.510 0.133 2.15 2.43 -43.718
4 1.47 -8.020 -0.450 0.132 1.41 2.37 -38.253
5 2.47 -7.970 -0.500 0.134 3.21 2.40 -39.6556 2.30 -7.920 -0.440 0.134 2.29 2.34 -39.596
7 1.59 -7.990 -0.450 0.133 2.46 2.36 -38.853
8 2.73 -7.880 -0.370 0.133 1.06 2.27 -38.966
9 2.32 -8.100 -0.470 0.131 1.78 2.41 6.623
10 3.80 -8.000 -0.390 0.131 0.74 2.31 6.353
11 2.68 -8.070 -0.450 0.131 1.68 2.38 6.349
484
QSAR and docking studies of inhibition activity of 5,6-dihydro..., T. TASKIN, F. SEVIN
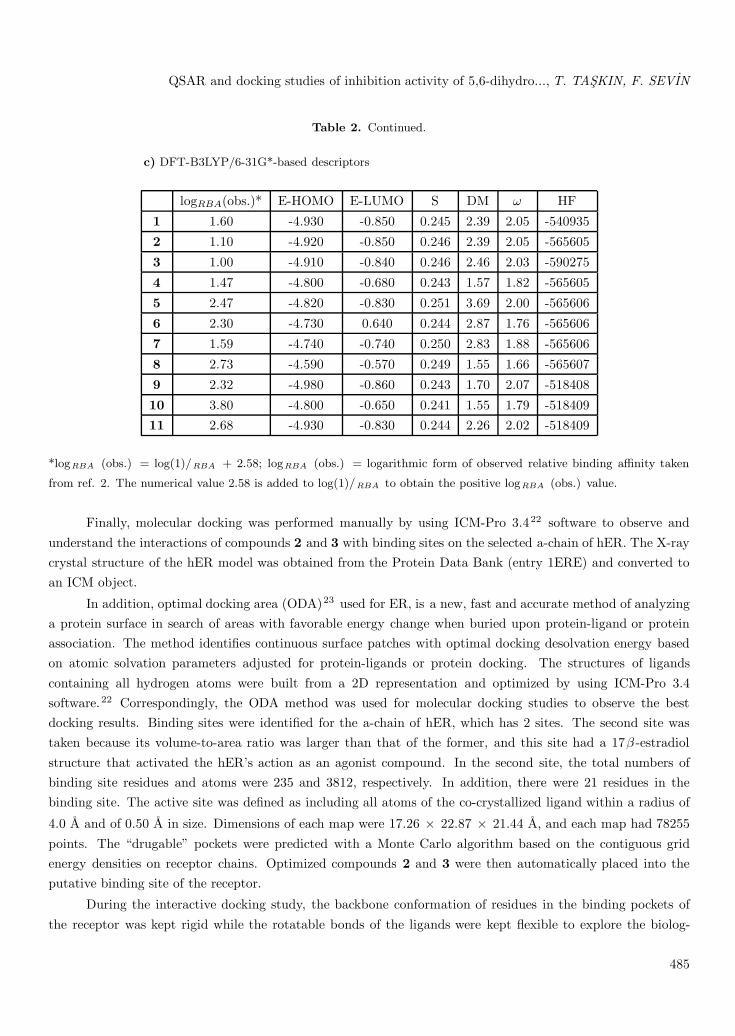
Table 2. Continued.
c) DFT-B3LYP/6-31G*-based descriptors
logRBA(obs.)* E-HOMO E-LUMO S DM ω HF
1 1.60 -4.930 -0.850 0.245 2.39 2.05 -540935
2 1.10 -4.920 -0.850 0.246 2.39 2.05 -565605
3 1.00 -4.910 -0.840 0.246 2.46 2.03 -590275
4 1.47 -4.800 -0.680 0.243 1.57 1.82 -565605
5 2.47 -4.820 -0.830 0.251 3.69 2.00 -565606
6 2.30 -4.730 0.640 0.244 2.87 1.76 -565606
7 1.59 -4.740 -0.740 0.250 2.83 1.88 -565606
8 2.73 -4.590 -0.570 0.249 1.55 1.66 -565607
9 2.32 -4.980 -0.860 0.243 1.70 2.07 -518408
10 3.80 -4.800 -0.650 0.241 1.55 1.79 -51840911 2.68 -4.930 -0.830 0.244 2.26 2.02 -518409
*logRBA (obs.) = log(1)/RBA + 2.58; logRBA (obs.) = logarithmic form of observed relative binding affinity taken
from ref. 2. The numerical value 2.58 is added to log(1)/RBA to obtain the positive logRBA (obs.) value.
Finally, molecular docking was performed manually by using ICM-Pro 3.422 software to observe andunderstand the interactions of compounds 2 and 3 with binding sites on the selected a-chain of hER. The X-raycrystal structure of the hER model was obtained from the Protein Data Bank (entry 1ERE) and converted toan ICM object.
In addition, optimal docking area (ODA)23 used for ER, is a new, fast and accurate method of analyzinga protein surface in search of areas with favorable energy change when buried upon protein-ligand or proteinassociation. The method identifies continuous surface patches with optimal docking desolvation energy basedon atomic solvation parameters adjusted for protein-ligands or protein docking. The structures of ligandscontaining all hydrogen atoms were built from a 2D representation and optimized by using ICM-Pro 3.4software.22 Correspondingly, the ODA method was used for molecular docking studies to observe the bestdocking results. Binding sites were identified for the a-chain of hER, which has 2 sites. The second site wastaken because its volume-to-area ratio was larger than that of the former, and this site had a 17β -estradiolstructure that activated the hER’s action as an agonist compound. In the second site, the total numbers ofbinding site residues and atoms were 235 and 3812, respectively. In addition, there were 21 residues in thebinding site. The active site was defined as including all atoms of the co-crystallized ligand within a radius of
4.0 A and of 0.50 A in size. Dimensions of each map were 17.26 × 22.87 × 21.44 A, and each map had 78255points. The “drugable” pockets were predicted with a Monte Carlo algorithm based on the contiguous gridenergy densities on receptor chains. Optimized compounds 2 and 3 were then automatically placed into theputative binding site of the receptor.
During the interactive docking study, the backbone conformation of residues in the binding pockets ofthe receptor was kept rigid while the rotatable bonds of the ligands were kept flexible to explore the biolog-
485
QSAR and docking studies of inhibition activity of 5,6-dihydro..., T. TASKIN, F. SEVIN
ically most active conformation. Docking studies were performed and only the energetically favorable com-plexes/conformations were analyzed. On the basis of the ligand orientation, the possible complex/conformationfor each ligand (2 and 3) was selected as the best fit and the results were added to the molecular spreadsheet.The docking results for 2 and 3 were calculated with interactive docking which docked ligand-protein complexesby using ICM-Pro 3.4 software.22 The multiple conformations accumulated during the docking of the ligandswere visualized and browsed in the ICM program base for a QSAR study focused on the composition of regions2-4 and 8-9, as shown in Table 1.
Results and discussion
Quantitative Structure Activity Relationship (QSAR)
The acceptability of the regression model was judged by examining the correlation coefficient (r), squared corre-
lation coefficient (r2), standard deviation (s), Fisher’s value (F), cross-validated squared correlation coefficient
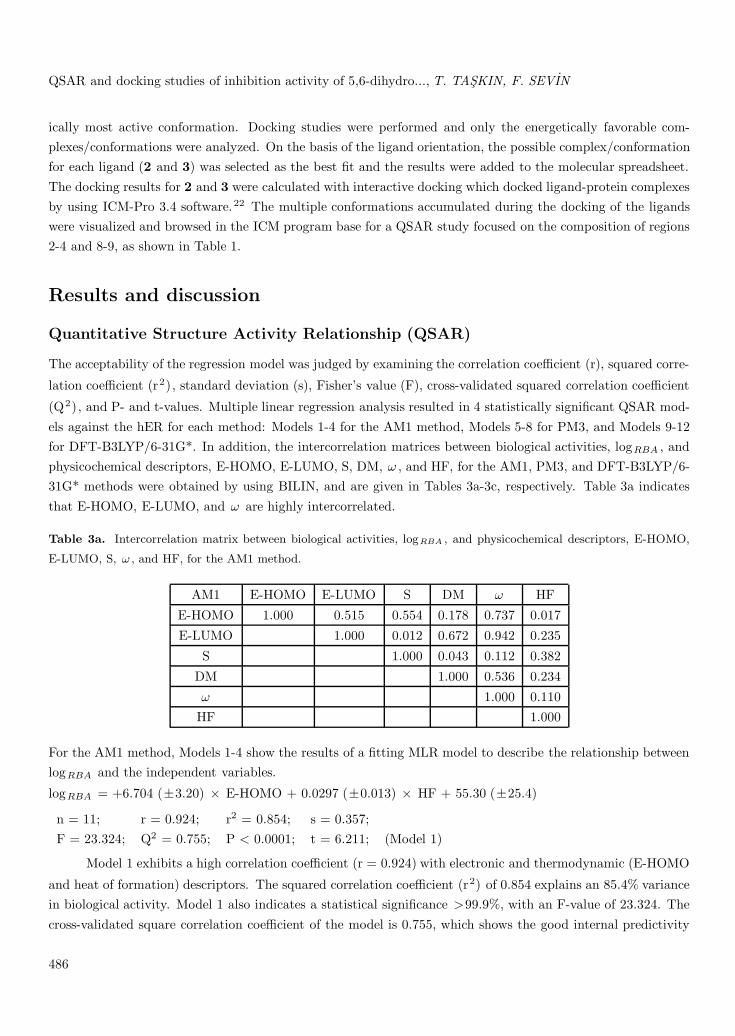
(Q2), and P- and t-values. Multiple linear regression analysis resulted in 4 statistically significant QSAR mod-els against the hER for each method: Models 1-4 for the AM1 method, Models 5-8 for PM3, and Models 9-12for DFT-B3LYP/6-31G*. In addition, the intercorrelation matrices between biological activities, logRBA , andphysicochemical descriptors, E-HOMO, E-LUMO, S, DM, ω , and HF, for the AM1, PM3, and DFT-B3LYP/6-31G* methods were obtained by using BILIN, and are given in Tables 3a-3c, respectively. Table 3a indicatesthat E-HOMO, E-LUMO, and ω are highly intercorrelated.
Table 3a. Intercorrelation matrix between biological activities, logRBA , and physicochemical descriptors, E-HOMO,
E-LUMO, S, ω , and HF, for the AM1 method.
AM1 E-HOMO E-LUMO S DM ω HF
E-HOMO 1.000 0.515 0.554 0.178 0.737 0.017
E-LUMO 1.000 0.012 0.672 0.942 0.235
S 1.000 0.043 0.112 0.382
DM 1.000 0.536 0.234
ω 1.000 0.110HF 1.000
For the AM1 method, Models 1-4 show the results of a fitting MLR model to describe the relationship betweenlogRBA and the independent variables.
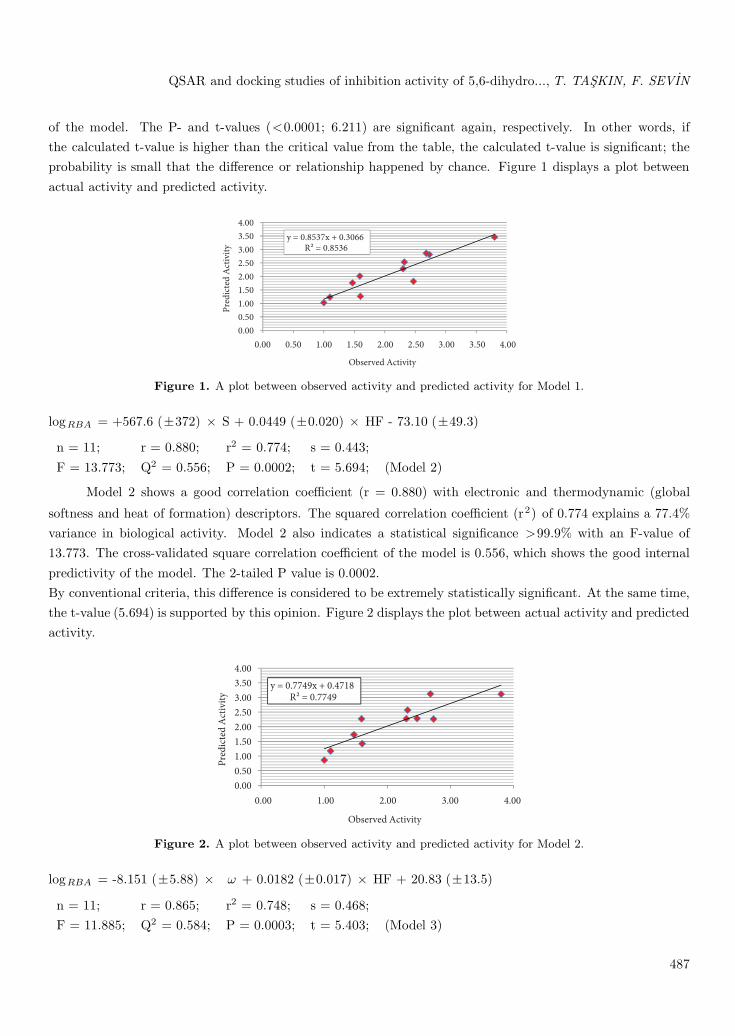
logRBA = +6.704 (±3.20) × E-HOMO + 0.0297 (±0.013) × HF + 55.30 (±25.4)
n = 11; r = 0.924; r2 = 0.854; s = 0.357;F = 23.324; Q2 = 0.755; P < 0.0001; t = 6.211; (Model 1)
Model 1 exhibits a high correlation coefficient (r = 0.924) with electronic and thermodynamic (E-HOMO
and heat of formation) descriptors. The squared correlation coefficient (r2) of 0.854 explains an 85.4% variancein biological activity. Model 1 also indicates a statistical significance >99.9%, with an F-value of 23.324. Thecross-validated square correlation coefficient of the model is 0.755, which shows the good internal predictivity
486
QSAR and docking studies of inhibition activity of 5,6-dihydro..., T. TASKIN, F. SEVIN
of the model. The P- and t-values (<0.0001; 6.211) are significant again, respectively. In other words, ifthe calculated t-value is higher than the critical value from the table, the calculated t-value is significant; theprobability is small that the difference or relationship happened by chance. Figure 1 displays a plot betweenactual activity and predicted activity.
y = 0.8537x + 0.3066R² = 0.8536
0.000.501.001.502.002.503.003.504.00
0.00 0.50 1.00 1.50 2.00 2.50 3.00 3.50 4.00
Pred
icte
d A
ctiv
ity
Observed Activity
Figure 1. A plot between observed activity and predicted activity for Model 1.
logRBA = +567.6 (±372) × S + 0.0449 (±0.020) × HF - 73.10 (±49.3)
n = 11; r = 0.880; r2 = 0.774; s = 0.443;F = 13.773; Q2 = 0.556; P = 0.0002; t = 5.694; (Model 2)
Model 2 shows a good correlation coefficient (r = 0.880) with electronic and thermodynamic (global
softness and heat of formation) descriptors. The squared correlation coefficient (r2) of 0.774 explains a 77.4%variance in biological activity. Model 2 also indicates a statistical significance >99.9% with an F-value of13.773. The cross-validated square correlation coefficient of the model is 0.556, which shows the good internalpredictivity of the model. The 2-tailed P value is 0.0002.By conventional criteria, this difference is considered to be extremely statistically significant. At the same time,the t-value (5.694) is supported by this opinion. Figure 2 displays the plot between actual activity and predictedactivity.
y = 0.7749x + 0.4718R² = 0.7749
0.000.501.001.502.002.503.003.504.00
0.00 1.00 2.00 3.00 4.00
Pred
icte
d A
ctiv
ity
Observed Activity
Figure 2. A plot between observed activity and predicted activity for Model 2.
logRBA = -8.151 (±5.88) × ω + 0.0182 (±0.017) × HF + 20.83 (±13.5)
n = 11; r = 0.865; r2 = 0.748; s = 0.468;F = 11.885; Q2 = 0.584; P = 0.0003; t = 5.403; (Model 3)
487
QSAR and docking studies of inhibition activity of 5,6-dihydro..., T. TASKIN, F. SEVIN
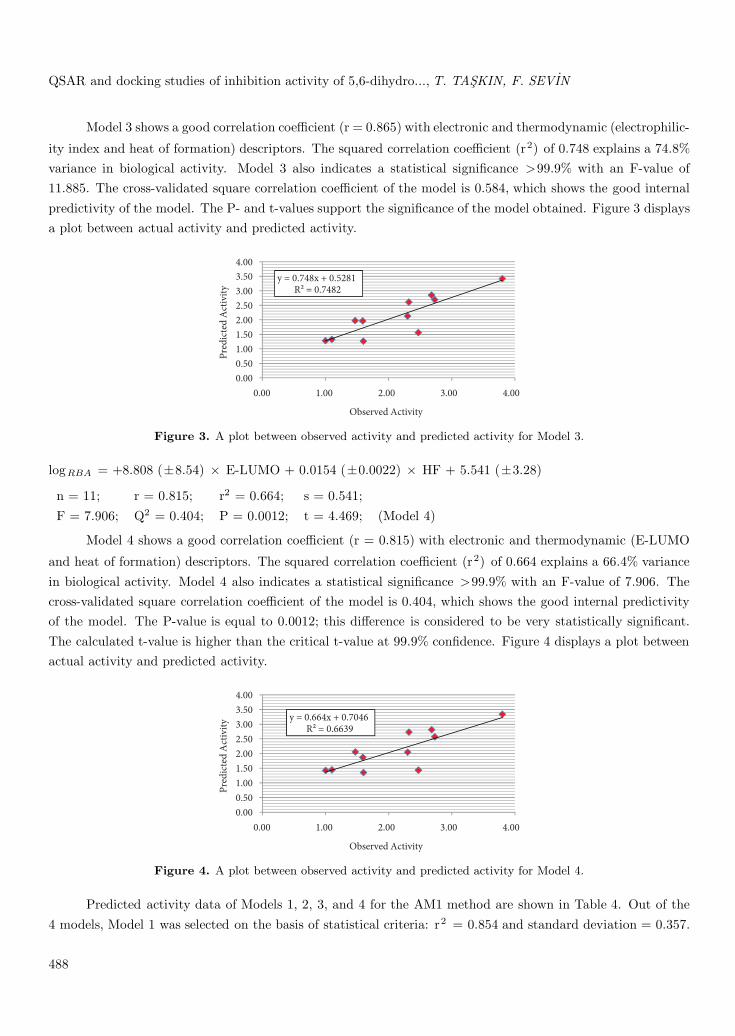
Model 3 shows a good correlation coefficient (r = 0.865) with electronic and thermodynamic (electrophilic-
ity index and heat of formation) descriptors. The squared correlation coefficient (r2) of 0.748 explains a 74.8%variance in biological activity. Model 3 also indicates a statistical significance >99.9% with an F-value of11.885. The cross-validated square correlation coefficient of the model is 0.584, which shows the good internalpredictivity of the model. The P- and t-values support the significance of the model obtained. Figure 3 displaysa plot between actual activity and predicted activity.
y = 0.748x + 0.5281R² = 0.7482
0.000.501.001.502.002.503.003.504.00
0.00 1.00 2.00 3.00 4.00
Pred
icte
d A
ctiv
ity
Observed Activity
Figure 3. A plot between observed activity and predicted activity for Model 3.
logRBA = +8.808 (±8.54) × E-LUMO + 0.0154 (±0.0022) × HF + 5.541 (±3.28)
n = 11; r = 0.815; r2 = 0.664; s = 0.541;F = 7.906; Q2 = 0.404; P = 0.0012; t = 4.469; (Model 4)
Model 4 shows a good correlation coefficient (r = 0.815) with electronic and thermodynamic (E-LUMO
and heat of formation) descriptors. The squared correlation coefficient (r2) of 0.664 explains a 66.4% variancein biological activity. Model 4 also indicates a statistical significance >99.9% with an F-value of 7.906. Thecross-validated square correlation coefficient of the model is 0.404, which shows the good internal predictivityof the model. The P-value is equal to 0.0012; this difference is considered to be very statistically significant.The calculated t-value is higher than the critical t-value at 99.9% confidence. Figure 4 displays a plot betweenactual activity and predicted activity.
y = 0.664x + 0.7046R² = 0.6639
0.000.501.001.502.002.503.003.504.00
0.00 1.00 2.00 3.00 4.00
Pred
icte
d A
ctiv
ity
Observed Activity
Figure 4. A plot between observed activity and predicted activity for Model 4.
Predicted activity data of Models 1, 2, 3, and 4 for the AM1 method are shown in Table 4. Out of the4 models, Model 1 was selected on the basis of statistical criteria: r2 = 0.854 and standard deviation = 0.357.
488
QSAR and docking studies of inhibition activity of 5,6-dihydro..., T. TASKIN, F. SEVIN
Model 1 shows high statistical significance, >99.9%, with F = 23.324. The internal predictivity of the modelwas assessed by the cross-validated squared correlation coefficient (Q2 = 0.755), which showed good correlationbetween predicted activity and actual activity (Figure 1). The P- and t-values were less than 0.0001 and equal
to 6.211, respectively, which are significant. The cross-validated squared correlation coefficient (Q2) valuesreflect the accuracy of the models.
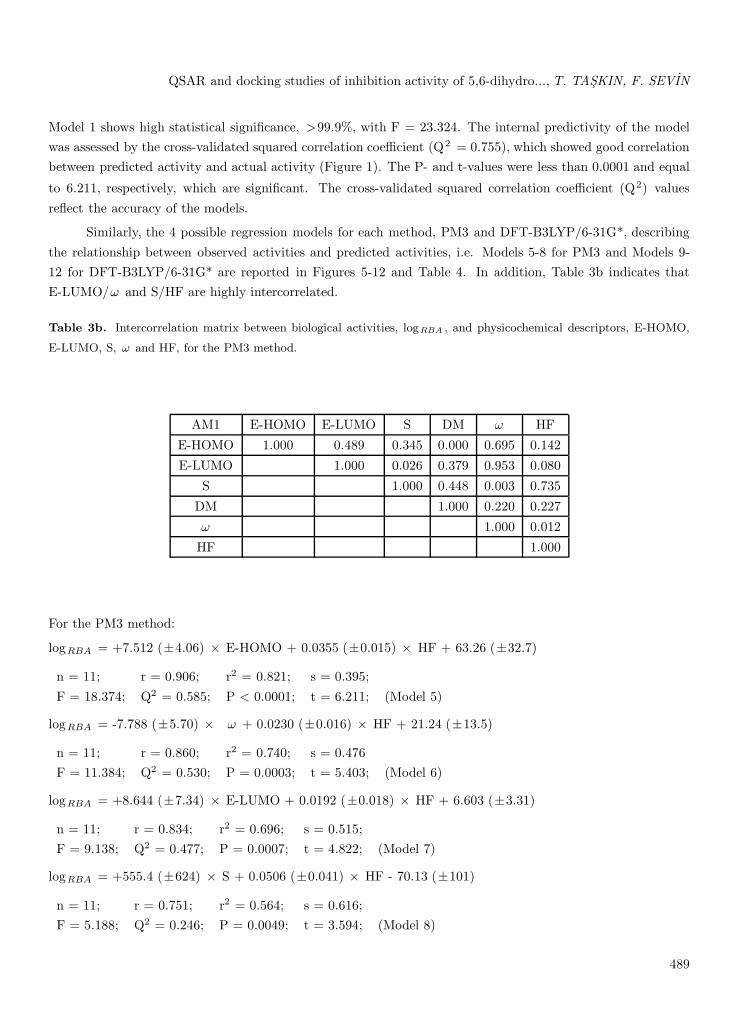
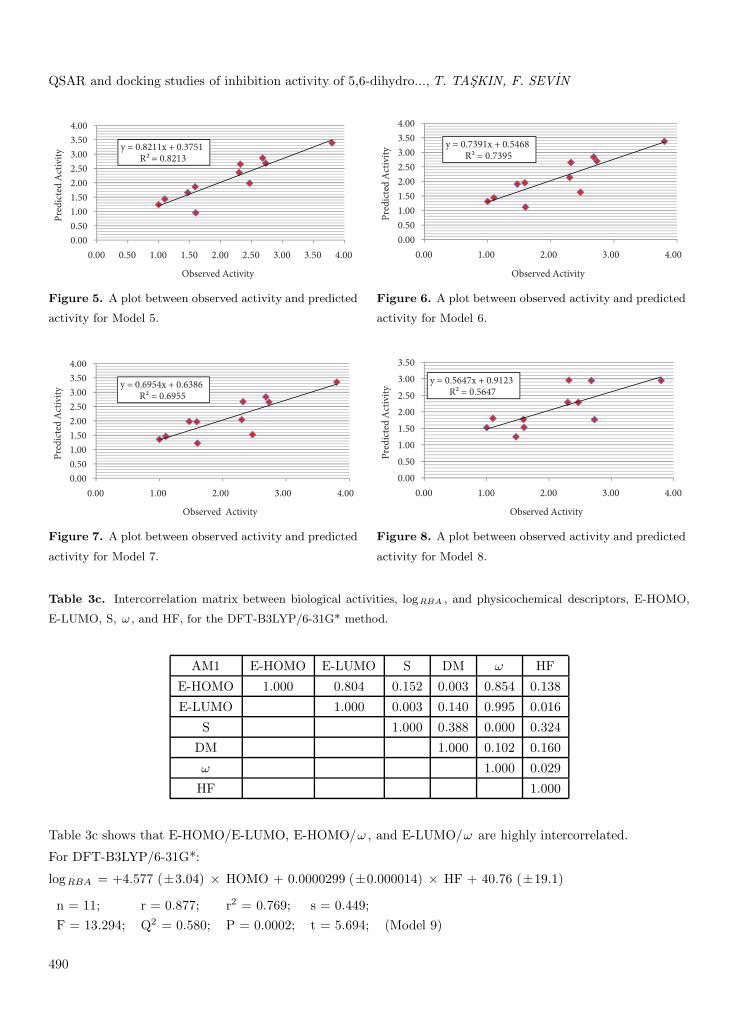
Similarly, the 4 possible regression models for each method, PM3 and DFT-B3LYP/6-31G*, describingthe relationship between observed activities and predicted activities, i.e. Models 5-8 for PM3 and Models 9-12 for DFT-B3LYP/6-31G* are reported in Figures 5-12 and Table 4. In addition, Table 3b indicates thatE-LUMO/ω and S/HF are highly intercorrelated.
Table 3b. Intercorrelation matrix between biological activities, logRBA , and physicochemical descriptors, E-HOMO,
E-LUMO, S, ω and HF, for the PM3 method.
AM1 E-HOMO E-LUMO S DM ω HF
E-HOMO 1.000 0.489 0.345 0.000 0.695 0.142
E-LUMO 1.000 0.026 0.379 0.953 0.080
S 1.000 0.448 0.003 0.735
DM 1.000 0.220 0.227
ω 1.000 0.012
HF 1.000
For the PM3 method:
logRBA = +7.512 (±4.06) × E-HOMO + 0.0355 (±0.015) × HF + 63.26 (±32.7)
n = 11; r = 0.906; r2 = 0.821; s = 0.395;F = 18.374; Q2 = 0.585; P < 0.0001; t = 6.211; (Model 5)
logRBA = -7.788 (±5.70) × ω + 0.0230 (±0.016) × HF + 21.24 (±13.5)
n = 11; r = 0.860; r2 = 0.740; s = 0.476F = 11.384; Q2 = 0.530; P = 0.0003; t = 5.403; (Model 6)
logRBA = +8.644 (±7.34) × E-LUMO + 0.0192 (±0.018) × HF + 6.603 (±3.31)
n = 11; r = 0.834; r2 = 0.696; s = 0.515;F = 9.138; Q2 = 0.477; P = 0.0007; t = 4.822; (Model 7)
logRBA = +555.4 (±624) × S + 0.0506 (±0.041) × HF - 70.13 (±101)
n = 11; r = 0.751; r2 = 0.564; s = 0.616;F = 5.188; Q2 = 0.246; P = 0.0049; t = 3.594; (Model 8)
489
QSAR and docking studies of inhibition activity of 5,6-dihydro..., T. TASKIN, F. SEVIN
y = 0.8211x + 0.3751R² = 0.8213
0.000.501.001.502.002.503.003.504.00
0.00 0.50 1.00 1.50 2.00 2.50 3.00 3.50 4.00
Pred
icte
d A
ctiv
ity
Observed Activity
y = 0.7391x + 0.5468R² = 0.7395
0.000.501.001.502.002.503.003.504.00
0.00 1.00 2.00 3.00 4.00
Pred
icte
d A
ctiv
ity
Observed Activity
Figure 5. A plot between observed activity and predicted
activity for Model 5.
Figure 6. A plot between observed activity and predicted
activity for Model 6.
y = 0.6954x + 0.6386R² = 0.6955
0.000.501.001.502.002.503.003.504.00
0.00 1.00 2.00 3.00 4.00
Pred
icte
d A
ctiv
ity
Observed Activity
y = 0.5647x + 0.9123R² = 0.5647
0.000.501.001.502.002.503.003.50
0.00 1.00 2.00 3.00 4.00
Pred
icte
d A
ctiv
ity
Observed Activity
Figure 7. A plot between observed activity and predicted
activity for Model 7.
Figure 8. A plot between observed activity and predicted
activity for Model 8.
Table 3c. Intercorrelation matrix between biological activities, logRBA , and physicochemical descriptors, E-HOMO,
E-LUMO, S, ω , and HF, for the DFT-B3LYP/6-31G* method.
AM1 E-HOMO E-LUMO S DM ω HF
E-HOMO 1.000 0.804 0.152 0.003 0.854 0.138
E-LUMO 1.000 0.003 0.140 0.995 0.016
S 1.000 0.388 0.000 0.324
DM 1.000 0.102 0.160
ω 1.000 0.029
HF 1.000
Table 3c shows that E-HOMO/E-LUMO, E-HOMO/ω , and E-LUMO/ω are highly intercorrelated.
For DFT-B3LYP/6-31G*:
logRBA = +4.577 (±3.04) × HOMO + 0.0000299 (±0.000014) × HF + 40.76 (±19.1)
n = 11; r = 0.877; r2 = 0.769; s = 0.449;F = 13.294; Q2 = 0.580; P = 0.0002; t = 5.694; (Model 9)
490
QSAR and docking studies of inhibition activity of 5,6-dihydro..., T. TASKIN, F. SEVIN
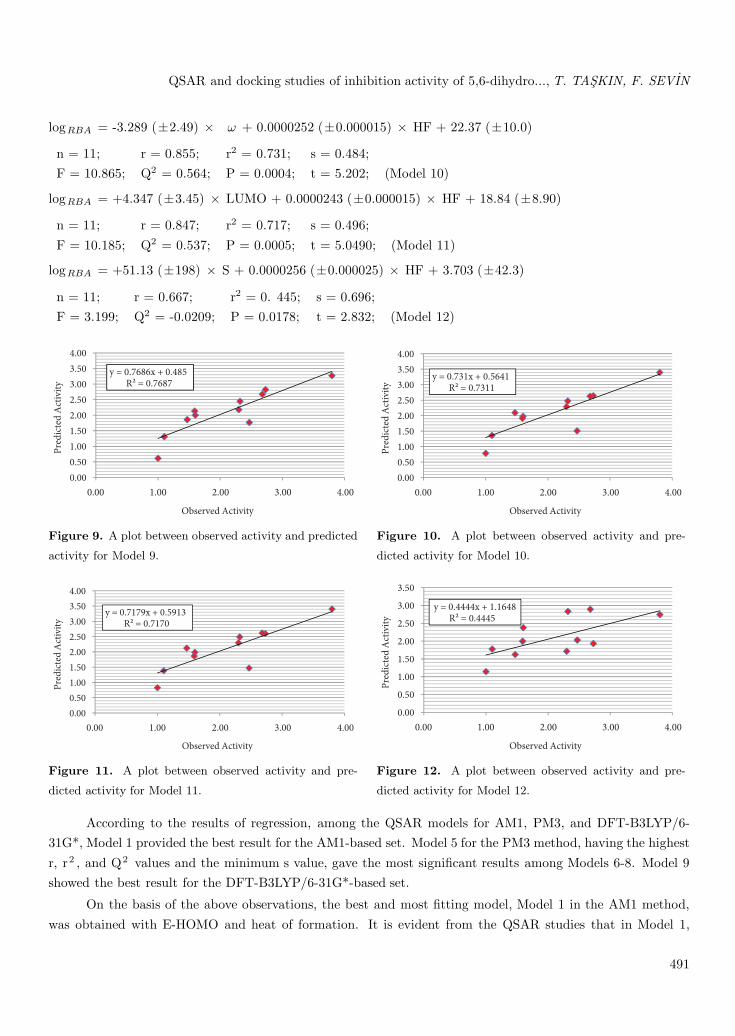
logRBA = -3.289 (±2.49) × ω + 0.0000252 (±0.000015) × HF + 22.37 (±10.0)
n = 11; r = 0.855; r2 = 0.731; s = 0.484;F = 10.865; Q2 = 0.564; P = 0.0004; t = 5.202; (Model 10)
logRBA = +4.347 (±3.45) × LUMO + 0.0000243 (±0.000015) × HF + 18.84 (±8.90)
n = 11; r = 0.847; r2 = 0.717; s = 0.496;F = 10.185; Q2 = 0.537; P = 0.0005; t = 5.0490; (Model 11)
logRBA = +51.13 (±198) × S + 0.0000256 (±0.000025) × HF + 3.703 (±42.3)
n = 11; r = 0.667; r2 = 0. 445; s = 0.696;F = 3.199; Q2 = -0.0209; P = 0.0178; t = 2.832; (Model 12)
y = 0.7686x + 0.485R² = 0.7687
0.000.501.001.502.002.503.003.504.00
0.00 1.00 2.00 3.00 4.00
Pred
icte
d A
ctiv
ity
Observed Activity
y = 0.731x + 0.5641R² = 0.7311
0.000.501.001.502.002.503.003.504.00
0.00 1.00 2.00 3.00 4.00
Pred
icte
d A
ctiv
ity
Observed Activity
Figure 9. A plot between observed activity and predicted
activity for Model 9.
Figure 10. A plot between observed activity and pre-
dicted activity for Model 10.
y = 0.7179x + 0.5913R² = 0.7170
0.000.501.001.502.002.503.003.504.00
0.00 1.00 2.00 3.00 4.00
Pred
icte
d A
ctiv
ity
Observed Activity
y = 0.4444x + 1.1648R² = 0.4445
0.00
0.50
1.00
1.50
2.00
2.50
3.00
3.50
0.00 1.00 2.00 3.00 4.00
Pred
icte
d A
ctiv
ity
Observed Activity
Figure 11. A plot between observed activity and pre-
dicted activity for Model 11.
Figure 12. A plot between observed activity and pre-
dicted activity for Model 12.
According to the results of regression, among the QSAR models for AM1, PM3, and DFT-B3LYP/6-31G*, Model 1 provided the best result for the AM1-based set. Model 5 for the PM3 method, having the highestr, r2 , and Q2 values and the minimum s value, gave the most significant results among Models 6-8. Model 9showed the best result for the DFT-B3LYP/6-31G*-based set.
On the basis of the above observations, the best and most fitting model, Model 1 in the AM1 method,was obtained with E-HOMO and heat of formation. It is evident from the QSAR studies that in Model 1,
491
QSAR and docking studies of inhibition activity of 5,6-dihydro..., T. TASKIN, F. SEVIN
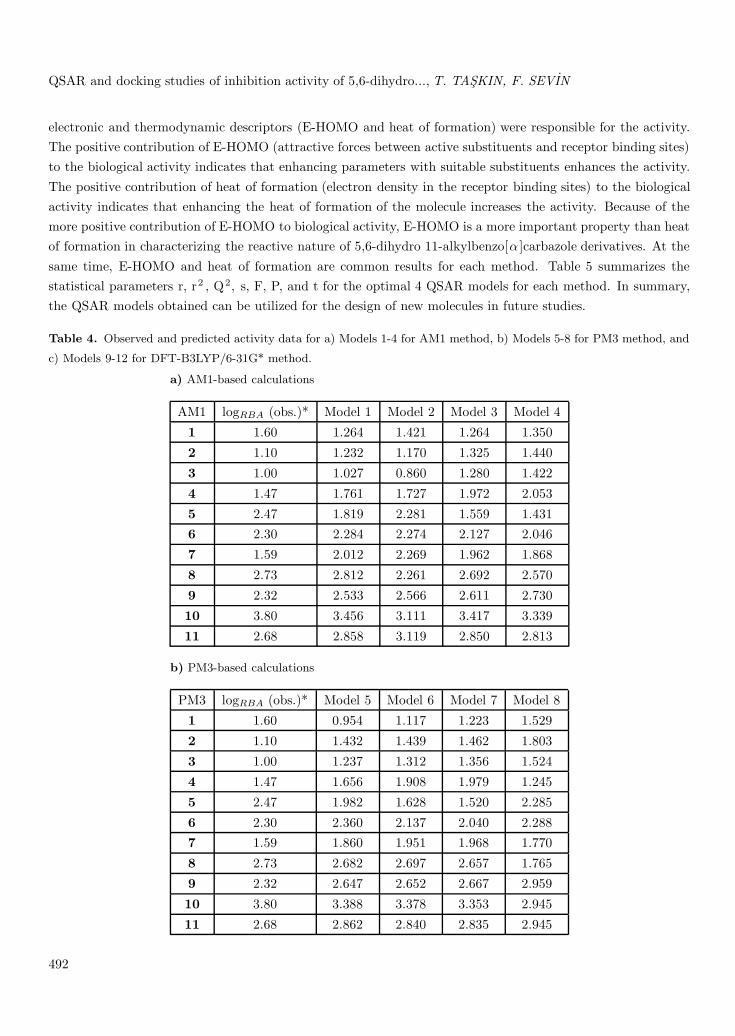
electronic and thermodynamic descriptors (E-HOMO and heat of formation) were responsible for the activity.The positive contribution of E-HOMO (attractive forces between active substituents and receptor binding sites)to the biological activity indicates that enhancing parameters with suitable substituents enhances the activity.The positive contribution of heat of formation (electron density in the receptor binding sites) to the biologicalactivity indicates that enhancing the heat of formation of the molecule increases the activity. Because of themore positive contribution of E-HOMO to biological activity, E-HOMO is a more important property than heatof formation in characterizing the reactive nature of 5,6-dihydro 11-alkylbenzo[α ]carbazole derivatives. At thesame time, E-HOMO and heat of formation are common results for each method. Table 5 summarizes thestatistical parameters r, r2 , Q2, s, F, P, and t for the optimal 4 QSAR models for each method. In summary,the QSAR models obtained can be utilized for the design of new molecules in future studies.
Table 4. Observed and predicted activity data for a) Models 1-4 for AM1 method, b) Models 5-8 for PM3 method, and
c) Models 9-12 for DFT-B3LYP/6-31G* method.
a) AM1-based calculations
AM1 logRBA (obs.)* Model 1 Model 2 Model 3 Model 4
1 1.60 1.264 1.421 1.264 1.350
2 1.10 1.232 1.170 1.325 1.440
3 1.00 1.027 0.860 1.280 1.422
4 1.47 1.761 1.727 1.972 2.053
5 2.47 1.819 2.281 1.559 1.4316 2.30 2.284 2.274 2.127 2.046
7 1.59 2.012 2.269 1.962 1.868
8 2.73 2.812 2.261 2.692 2.570
9 2.32 2.533 2.566 2.611 2.730
10 3.80 3.456 3.111 3.417 3.339
11 2.68 2.858 3.119 2.850 2.813
b) PM3-based calculations
PM3 logRBA (obs.)* Model 5 Model 6 Model 7 Model 8
1 1.60 0.954 1.117 1.223 1.529
2 1.10 1.432 1.439 1.462 1.803
3 1.00 1.237 1.312 1.356 1.524
4 1.47 1.656 1.908 1.979 1.245
5 2.47 1.982 1.628 1.520 2.285
6 2.30 2.360 2.137 2.040 2.2887 1.59 1.860 1.951 1.968 1.770
8 2.73 2.682 2.697 2.657 1.765
9 2.32 2.647 2.652 2.667 2.959
10 3.80 3.388 3.378 3.353 2.945
11 2.68 2.862 2.840 2.835 2.945
492
QSAR and docking studies of inhibition activity of 5,6-dihydro..., T. TASKIN, F. SEVIN
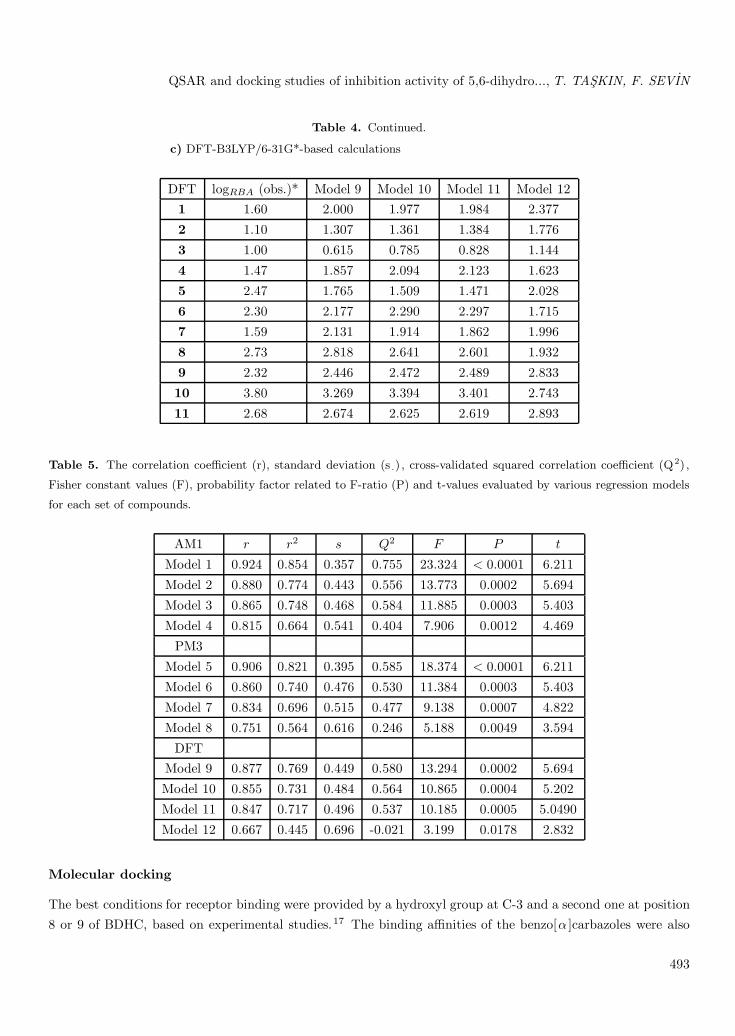
Table 4. Continued.
c) DFT-B3LYP/6-31G*-based calculations
DFT logRBA (obs.)* Model 9 Model 10 Model 11 Model 121 1.60 2.000 1.977 1.984 2.377
2 1.10 1.307 1.361 1.384 1.776
3 1.00 0.615 0.785 0.828 1.144
4 1.47 1.857 2.094 2.123 1.623
5 2.47 1.765 1.509 1.471 2.028
6 2.30 2.177 2.290 2.297 1.715
7 1.59 2.131 1.914 1.862 1.996
8 2.73 2.818 2.641 2.601 1.932
9 2.32 2.446 2.472 2.489 2.833
10 3.80 3.269 3.394 3.401 2.743
11 2.68 2.674 2.625 2.619 2.893
Table 5. The correlation coefficient (r), standard deviation (s .) , cross-validated squared correlation coefficient (Q2) ,
Fisher constant values (F), probability factor related to F-ratio (P) and t-values evaluated by various regression models
for each set of compounds.
AM1 r r2 s Q2 F P t
Model 1 0.924 0.854 0.357 0.755 23.324 < 0.0001 6.211
Model 2 0.880 0.774 0.443 0.556 13.773 0.0002 5.694
Model 3 0.865 0.748 0.468 0.584 11.885 0.0003 5.403
Model 4 0.815 0.664 0.541 0.404 7.906 0.0012 4.469
PM3
Model 5 0.906 0.821 0.395 0.585 18.374 < 0.0001 6.211
Model 6 0.860 0.740 0.476 0.530 11.384 0.0003 5.403
Model 7 0.834 0.696 0.515 0.477 9.138 0.0007 4.822
Model 8 0.751 0.564 0.616 0.246 5.188 0.0049 3.594
DFTModel 9 0.877 0.769 0.449 0.580 13.294 0.0002 5.694
Model 10 0.855 0.731 0.484 0.564 10.865 0.0004 5.202
Model 11 0.847 0.717 0.496 0.537 10.185 0.0005 5.0490
Model 12 0.667 0.445 0.696 -0.021 3.199 0.0178 2.832
Molecular docking
The best conditions for receptor binding were provided by a hydroxyl group at C-3 and a second one at position8 or 9 of BDHC, based on experimental studies.17 The binding affinities of the benzo[α ]carbazoles were also
493
QSAR and docking studies of inhibition activity of 5,6-dihydro..., T. TASKIN, F. SEVIN
somewhat lower than those of the dihydro derivatives. These results prompted us to elucidate and visualizethis experimental research by using the molecular docking method. The X-ray structure of the ligand bindingdomain of the human estrogen receptor complexed with 17β -estradiol was used as a template for the modeling.As expected, the receptor affinity decreased considerably if one hydroxyl group was missing. The moleculardocking of the human estrogen receptors was performed by using molecular modeling of compounds 2 and 3,which have high relative binding affinity values.17 In this way, the orientation of compounds 2 and 3 in thea-chain’s binding site of hER can be predicted and elucidated.
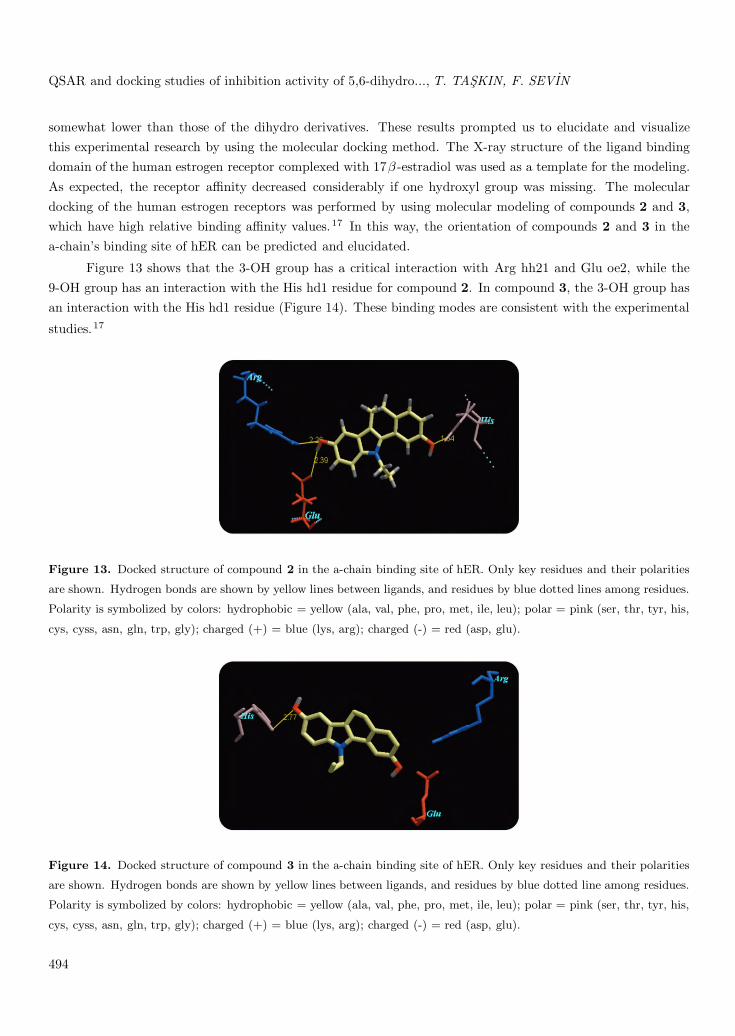
Figure 13 shows that the 3-OH group has a critical interaction with Arg hh21 and Glu oe2, while the9-OH group has an interaction with the His hd1 residue for compound 2. In compound 3, the 3-OH group hasan interaction with the His hd1 residue (Figure 14). These binding modes are consistent with the experimental
studies.17
Figure 13. Docked structure of compound 2 in the a-chain binding site of hER. Only key residues and their polarities
are shown. Hydrogen bonds are shown by yellow lines between ligands, and residues by blue dotted lines among residues.
Polarity is symbolized by colors: hydrophobic = yellow (ala, val, phe, pro, met, ile, leu); polar = pink (ser, thr, tyr, his,
cys, cyss, asn, gln, trp, gly); charged (+) = blue (lys, arg); charged (-) = red (asp, glu).
Figure 14. Docked structure of compound 3 in the a-chain binding site of hER. Only key residues and their polarities
are shown. Hydrogen bonds are shown by yellow lines between ligands, and residues by blue dotted line among residues.
Polarity is symbolized by colors: hydrophobic = yellow (ala, val, phe, pro, met, ile, leu); polar = pink (ser, thr, tyr, his,
cys, cyss, asn, gln, trp, gly); charged (+) = blue (lys, arg); charged (-) = red (asp, glu).
494
QSAR and docking studies of inhibition activity of 5,6-dihydro..., T. TASKIN, F. SEVIN
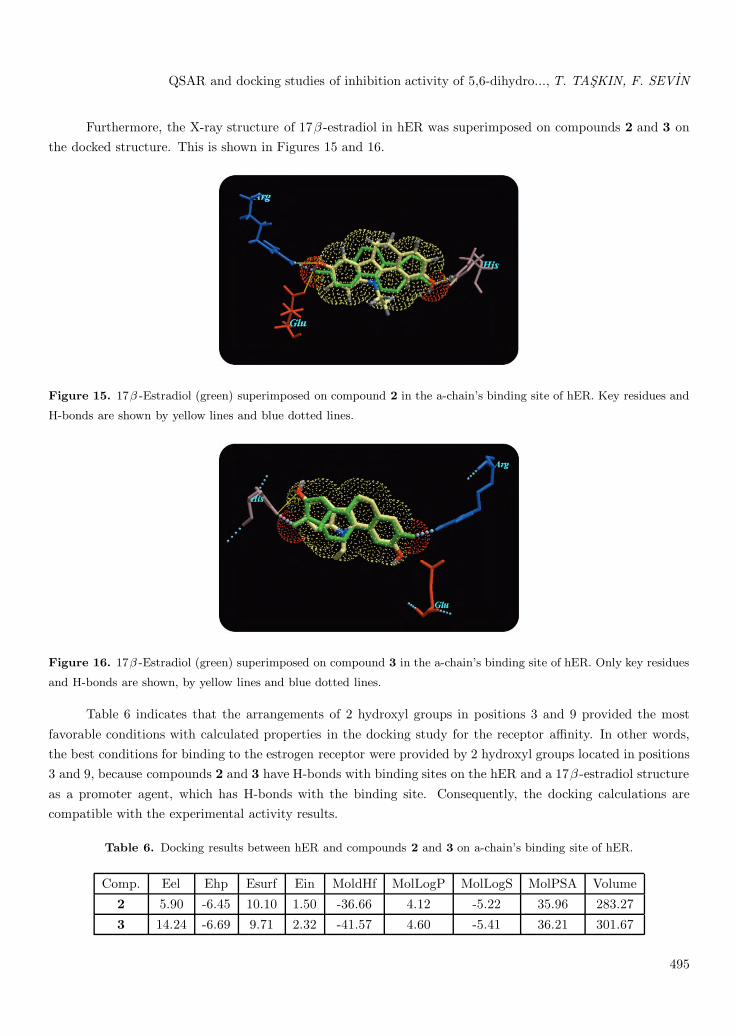
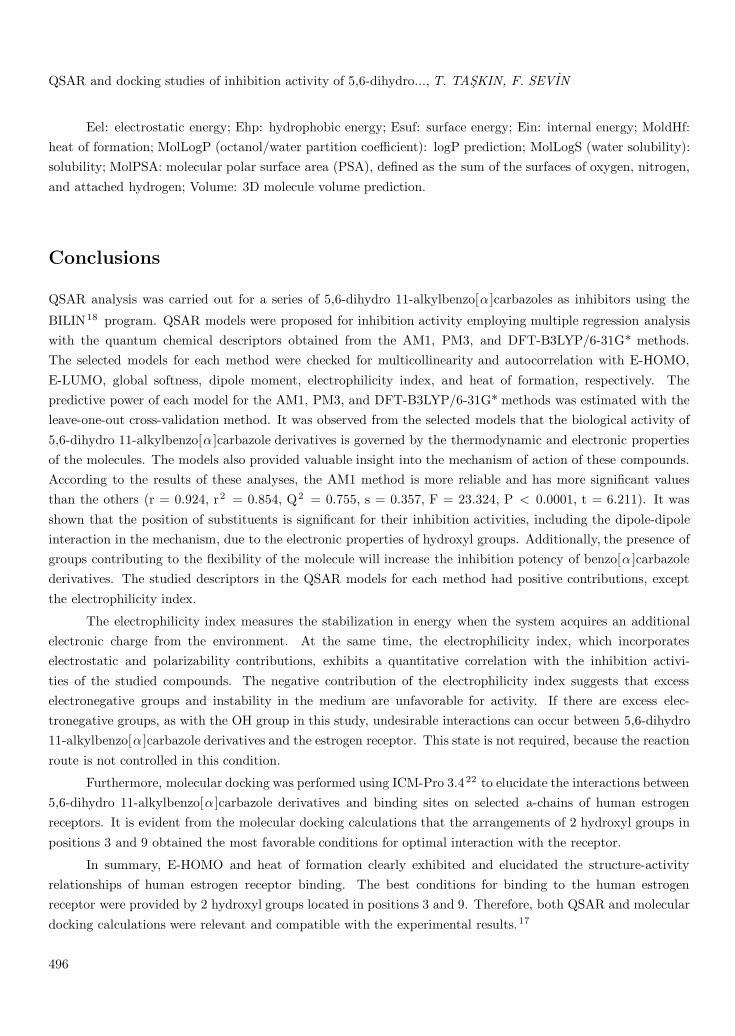
Furthermore, the X-ray structure of 17β -estradiol in hER was superimposed on compounds 2 and 3 onthe docked structure. This is shown in Figures 15 and 16.
Figure 15. 17β -Estradiol (green) superimposed on compound 2 in the a-chain’s binding site of hER. Key residues and
H-bonds are shown by yellow lines and blue dotted lines.
Figure 16. 17β -Estradiol (green) superimposed on compound 3 in the a-chain’s binding site of hER. Only key residues
and H-bonds are shown, by yellow lines and blue dotted lines.
Table 6 indicates that the arrangements of 2 hydroxyl groups in positions 3 and 9 provided the mostfavorable conditions with calculated properties in the docking study for the receptor affinity. In other words,the best conditions for binding to the estrogen receptor were provided by 2 hydroxyl groups located in positions3 and 9, because compounds 2 and 3 have H-bonds with binding sites on the hER and a 17β -estradiol structureas a promoter agent, which has H-bonds with the binding site. Consequently, the docking calculations arecompatible with the experimental activity results.
Table 6. Docking results between hER and compounds 2 and 3 on a-chain’s binding site of hER.
Comp. Eel Ehp Esurf Ein MoldHf MolLogP MolLogS MolPSA Volume
2 5.90 -6.45 10.10 1.50 -36.66 4.12 -5.22 35.96 283.27
3 14.24 -6.69 9.71 2.32 -41.57 4.60 -5.41 36.21 301.67
495
QSAR and docking studies of inhibition activity of 5,6-dihydro..., T. TASKIN, F. SEVIN
Eel: electrostatic energy; Ehp: hydrophobic energy; Esuf: surface energy; Ein: internal energy; MoldHf:heat of formation; MolLogP (octanol/water partition coefficient): logP prediction; MolLogS (water solubility):solubility; MolPSA: molecular polar surface area (PSA), defined as the sum of the surfaces of oxygen, nitrogen,and attached hydrogen; Volume: 3D molecule volume prediction.
Conclusions
QSAR analysis was carried out for a series of 5,6-dihydro 11-alkylbenzo[α ]carbazoles as inhibitors using the
BILIN18 program. QSAR models were proposed for inhibition activity employing multiple regression analysiswith the quantum chemical descriptors obtained from the AM1, PM3, and DFT-B3LYP/6-31G* methods.The selected models for each method were checked for multicollinearity and autocorrelation with E-HOMO,E-LUMO, global softness, dipole moment, electrophilicity index, and heat of formation, respectively. Thepredictive power of each model for the AM1, PM3, and DFT-B3LYP/6-31G* methods was estimated with theleave-one-out cross-validation method. It was observed from the selected models that the biological activity of5,6-dihydro 11-alkylbenzo[α ]carbazole derivatives is governed by the thermodynamic and electronic propertiesof the molecules. The models also provided valuable insight into the mechanism of action of these compounds.According to the results of these analyses, the AM1 method is more reliable and has more significant valuesthan the others (r = 0.924, r2 = 0.854, Q2 = 0.755, s = 0.357, F = 23.324, P < 0.0001, t = 6.211). It wasshown that the position of substituents is significant for their inhibition activities, including the dipole-dipoleinteraction in the mechanism, due to the electronic properties of hydroxyl groups. Additionally, the presence ofgroups contributing to the flexibility of the molecule will increase the inhibition potency of benzo[α ]carbazolederivatives. The studied descriptors in the QSAR models for each method had positive contributions, exceptthe electrophilicity index.
The electrophilicity index measures the stabilization in energy when the system acquires an additionalelectronic charge from the environment. At the same time, the electrophilicity index, which incorporateselectrostatic and polarizability contributions, exhibits a quantitative correlation with the inhibition activi-ties of the studied compounds. The negative contribution of the electrophilicity index suggests that excesselectronegative groups and instability in the medium are unfavorable for activity. If there are excess elec-tronegative groups, as with the OH group in this study, undesirable interactions can occur between 5,6-dihydro11-alkylbenzo[α ]carbazole derivatives and the estrogen receptor. This state is not required, because the reactionroute is not controlled in this condition.
Furthermore, molecular docking was performed using ICM-Pro 3.422 to elucidate the interactions between5,6-dihydro 11-alkylbenzo[α ]carbazole derivatives and binding sites on selected a-chains of human estrogenreceptors. It is evident from the molecular docking calculations that the arrangements of 2 hydroxyl groups inpositions 3 and 9 obtained the most favorable conditions for optimal interaction with the receptor.
In summary, E-HOMO and heat of formation clearly exhibited and elucidated the structure-activityrelationships of human estrogen receptor binding. The best conditions for binding to the human estrogenreceptor were provided by 2 hydroxyl groups located in positions 3 and 9. Therefore, both QSAR and moleculardocking calculations were relevant and compatible with the experimental results.17
496
QSAR and docking studies of inhibition activity of 5,6-dihydro..., T. TASKIN, F. SEVIN
References
1. von Angerer, E.; Prekajac, J.; Strohmeier, J. J. Med. Chem. 1984, 27, 1439-1447.
2. von Angerer, E.; Prekajac, J. J. Med. Chem. 1986, 29, 380-386.
3. Katritzky, W. J. Heterocyc. Chem. 1988, 25, 671-675.
4. Pappa, H.; Segall, A.; Pizzorno, M. T.; Radice, M.; Amoroso, A.; Gutkind, G. Il Farmaco 1994, 49, 333-336.
5. Segall, A.; Pappa, H.; Casaubon, R.; Martin, G.; Bergoc, R.; Pizzorno, M. T. Eur. J. Med. Chem. 1995, 30,
165-169.
6. Macchia, M.; Manera, C.; Nencetti, S.; Rossello, A.; Brocalli, G.; Limonta, D. Il Farmaco 1996, 51, 75-78.
7. Segall, A.; Pappa, H.; Pizzorno, M. T.; Radice, M.; Amoroso, A.; Gutkind, G. Il Farmaco 1996, 51, 513-516.
8. Amoroso, A.; Radice, M.; Segall, A.; Rodero, L.; Hochenfellner, F.; Pizzorno, M. T.; Moretton, J.; Garrido, D.;
Gutkind, G. Pharmazie 2000, 55, 151-152.
9. Segall, A.; Pizzorno, M. T. Pharmazie 2000, 55, 766- 767.
10. Martin, G.; Cocca, C.; Rivera, E.; Cricco, G.; Segall, A.; Pappa, H.; Casaubon, R.; Caro, R.; Pizzorno, M. T.;
Bergoc, R. J. Exp. Ther. Oncol. 2002, 2, 77-84.
11. LePecq, J. B.; Dat-Xoung, N.; Gosse, C.; Paoletti, C. Proc. Natl. Acad. Sci. 1974, 71, 5078.
12. Pelaprat, D.; Oberlin, R.; Le Guen, I.; Roques, B. P.; LePecq, J. B. J. Med. Chem. 1980, 23, 1330.
13. (a) Martin, G.; Cocca, C.; Rivera, E.; Cricco, G.; Caro, R.; Segall, A.; Pappa, H.; Casaubon, R.; Pizzorno, M. T.;
Bergoc, R. M. J. Exp.Ther. Oncol. 2002, 2, 77-84. (b) Dantas, S. O.; Lavarda, F. C.; Galvao, D. S.; Laks, B. J.
Mol. Struc. Theochem. 1992, 253, 319. (c) Dantas, S. O.; Galvao, D. S. J. Mol. Struc. Theochem. 1992, 43, 257.
14. Poliakoff, N.; Albonico, S. M.; Alvarez, M.; Pecca, J. G.; Vernengo, M. J. J. Med. Chem. 1973, 16, 1411.
15. Pahsa, F. A.; Srivastava, H. K.; Singh, P. P. Int. J. Quantum Chem. 2005, 104, 87-100.
16. Taskin, T.; Sevin, F. J. Mol. Struct.: THEOCHEM 2007, 803, 61-66.
17. Angerer, E.; Prekajac, J. J. Med. Chem. 1986, 3, 29.
18. BILIN, Donnersbergstrasse 9, D–67256 Weisenheim am Sand, Germany, 2005.
19. Dewar, M. J. S.; Zoebisch, E. G.; Healy, E. F.; Stewart, J. J. P. J. Am. Chem. Soc. 1985, 107, 3902.
20. Stewart, J. J. P. J. Comp. Chem. 1989, 10, 209.
21. (a) Parr, R. G.; Yang, W. Density Functional Theory of Atoms and Molecules, Oxford University Press, New York,
1989. (b) Kohn, W.; Becke, A. D.; Parr, R. G. J. Phys. Chem. 1996, 100, 12974.
22. Demo ICM-Pro version 3.4.8, Molsoft LLC, 3366 North Torrey Pines Court, Suite 300, La Jolla, CA 92037, USA.
23. Fernandez-Recio, J.; Totrov, M.; Skorodumov, C.; Abagyan, R. Proteins: Structure, Function, and Bioinformatics
2005, 58, 134-143.
24. Frisch, M. J.; Trucks, G. W.; Schlegel, H. B.; Scuseria, G. E.; Robb, M. A.; Cheeseman, J. R.; Montgomery, J.
A. Jr; Vreven, T.; Kudin, K. N.; Burant, J. C; Millam, J. M.; Iyengar, S. S.; Tomasi, J.; Barone, V.; Mennucci
B.; Cossi M.; Scalmani G.; Rega, N.; Petersson, G. A.; Nakatsuji, H.; Hada, M.; Ehara, M.; Toyota, K.; Fukuda,
R.; Hasegawa, J.; Ishida, M.; Nakajima, T.; Honda, Y.; Kitao, O.; Nakai, H.; Klene, M.; Li, X.; Knox, J. E.;
Hratchian, H. P.; Cross, J. B.; Adamo, C.; Jaramillo, J.; Gomperts, R.; Stratmann, R. E.; Yazyev, O.; Austin, A.
J.; Cammi, R.; Pomelli, C. J.; Ochterski, W.; Ayala, P. Y.; Morokuma, K.; Voth, G. A.; Salvador, P.; Dannenberg,
497
QSAR and docking studies of inhibition activity of 5,6-dihydro..., T. TASKIN, F. SEVIN
J. J.; Zakrzewski, V. G.; Dapprich, S.; Daniels, A. D.; Strain M. C.; Farkas, O.; Malick, D. K.; Rabuck, A. D.;
Raghavachari, K.; Foresman, J. B.; Ortiz, J. V.; Cui, Q.; Baboul, A. G.; Clifford, S.; Cioslowski, J.; Stefanov, B.
B.; Liu, G.; Liashenko, A.; Piskorz, P.; Komaromi, I.; Martin, R. L.; Fox, D. J.; Keith, T.; Al-Laham, M. A.; Peng,
C. Y.; Nanayakkara, A.; Challacombe, M.; Gill, P. M. W.; Johnson, B.; Chen, W.; Wong, M. W.; Gonzalez, C.;
Pople, J. A. Gaussian03, Revision B.01 Gaussian Inc., Pittsburgh, PA, 2003.
25. Chattaraj, P. K.; Nath, S.; Maiti, B. Reactivity Descriptors. In: Tollenaere, J.; Bultinck, P.; Winter H.D.; Lange-
naeker, W., Editors; Computational Medicinal Chemistry and Drug Discovery, Marcel Dekker, New York, 2003,
pp. 295-322, Chapter 11.
26. Parr, R. G.; Szentpaly, L. V.; Liu, S. J. Am. Chem. Soc. 1999, 121, 1922.
27. Maynard, A. T.; Huang, M.; Rice, W. G.; Covell, D. G. Proc. Natl. Acad. Sci. USA 95, 1998, 11578-11583
28. Srikanth, K.; Debnath, B.; Jha, T. Bioorg. Med. Chem. 2002, 10, 1841-1854.
498