PV Wind in the Power of Voltage...
18
Assessment of PV and Wind Microgeneration’s Impact in the Power Quality of Low and Medium Voltage Distribution Networks Paulo Bonifácio Luis Rodrigues, Susana Viana and Ana Estanqueiro
Transcript of PV Wind in the Power of Voltage...
Assessment of PV and Wind Microgeneration’s Impact in the Power Quality of Low and Medium Voltage Distribution Networks
Paulo Bonifácio Luis Rodrigues, Susana Viana and Ana Estanqueiro
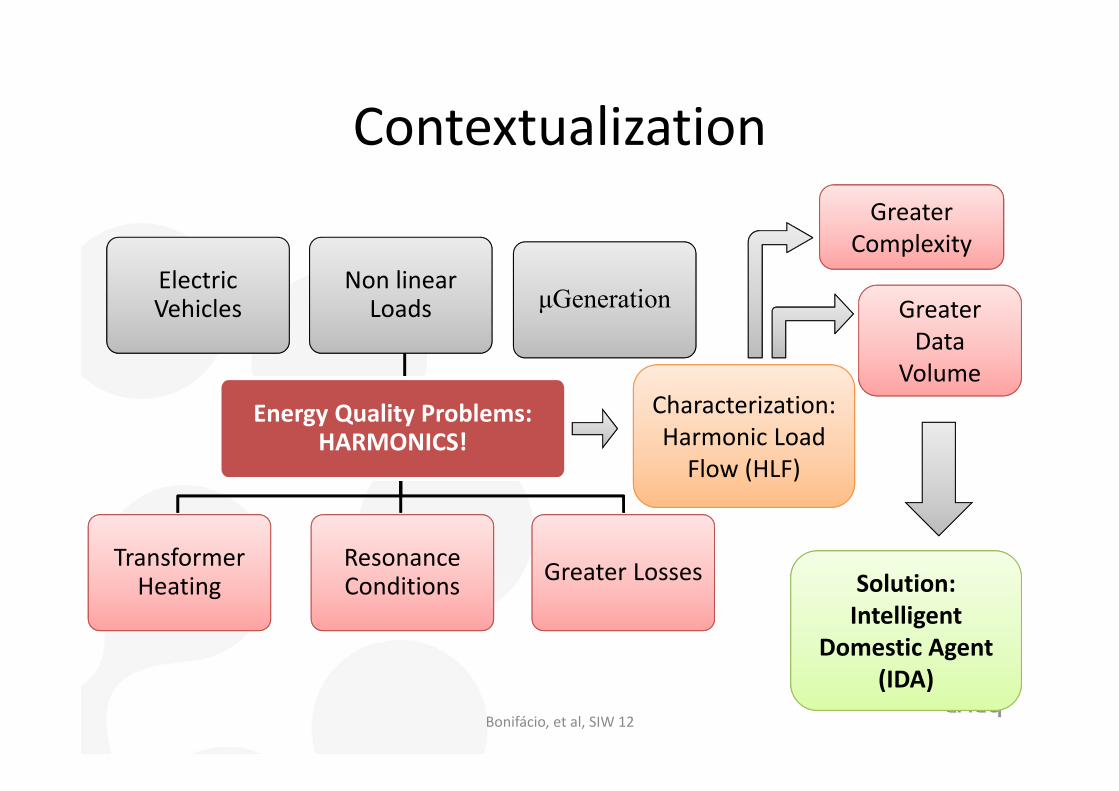
Contextualization
ElectricVehicles
Non linear Loads
Energy Quality Problems: HARMONICS!
Transformer Heating
Resonance Conditions Greater Losses
μGeneration
Characterization:Harmonic Load Flow (HLF)
GreaterData
Volume
Greater Complexity
Solution: Intelligent
Domestic Agent (IDA)
Bonifácio, et al, SIW 12
Objectives – REIVE Project:
• Analyse the Impact of Microgeneration and Electric Vehicles integration in the low voltage grid and in Power :
– Access Total Harmonic Distortion (THD).– Evaluate Neutral currents.– LNEG: Access flicker levels and dynamic voltageprofile in local distribution network.
Bonifácio, et al, SIW 12
Developed Work• Development of a Harmonic Load Flow Tool (TEH) for 3‐phase
Balanced networks – Matlab.• Development of a Modular Reconfigurable Consumer Model –
IDA. • Creation of a Power Quality Assessment Tool:
• Low Voltage 3‐phase networks.• Balanced and Unbalanced• 1 & 3‐phase consumers.• Implementation in Matlab/Simulink.
Bonifácio, et al, SIW 12
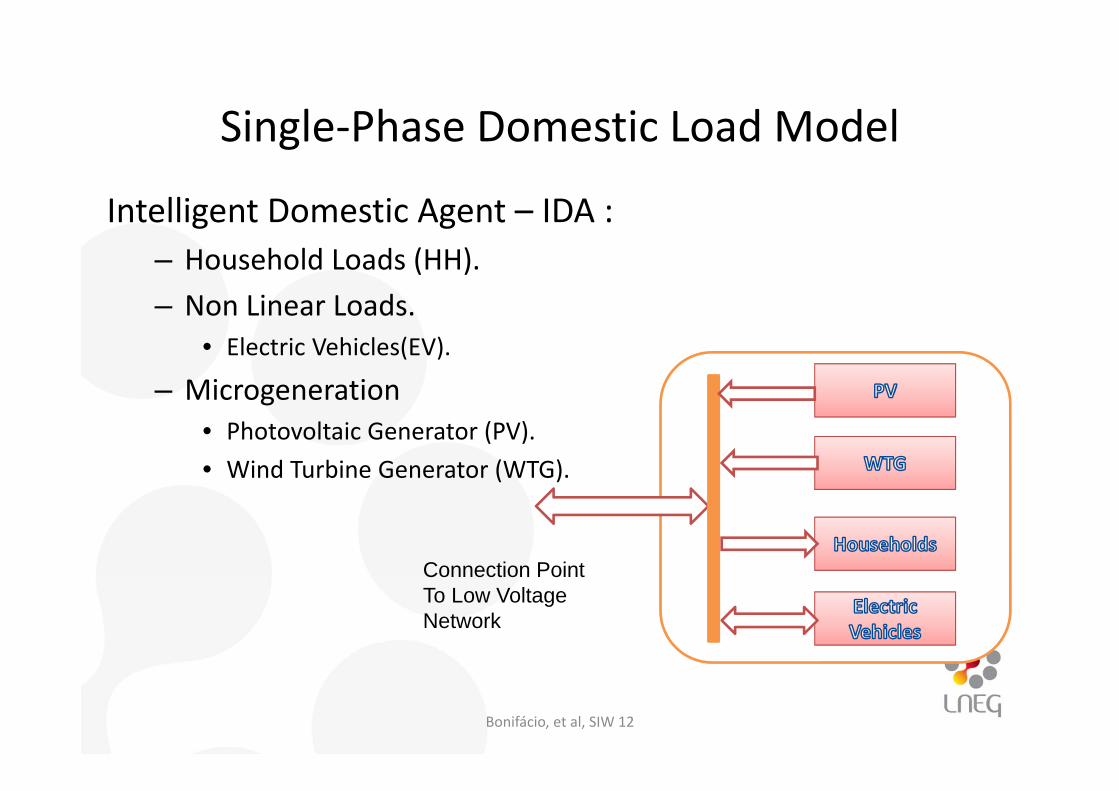
Single‐Phase Domestic Load Model
Intelligent Domestic Agent – IDA :– Household Loads (HH).– Non Linear Loads.
• Electric Vehicles(EV).
– Microgeneration• Photovoltaic Generator (PV).• Wind Turbine Generator (WTG).
Connection PointTo Low VoltageNetwork
Bonifácio, et al, SIW 12
IDA ‐ Components
• I – Current Injection/Consumption Models• Fundamental and Harmonic currents represented through ideal current sources.
• Individual Input/output current spectrum for each Power Converter connected to the grid.
• II – Physical Models• Modelling of the behaviour of the components with fluctuations of renewable resources.
Bonifácio, et al, SIW 12
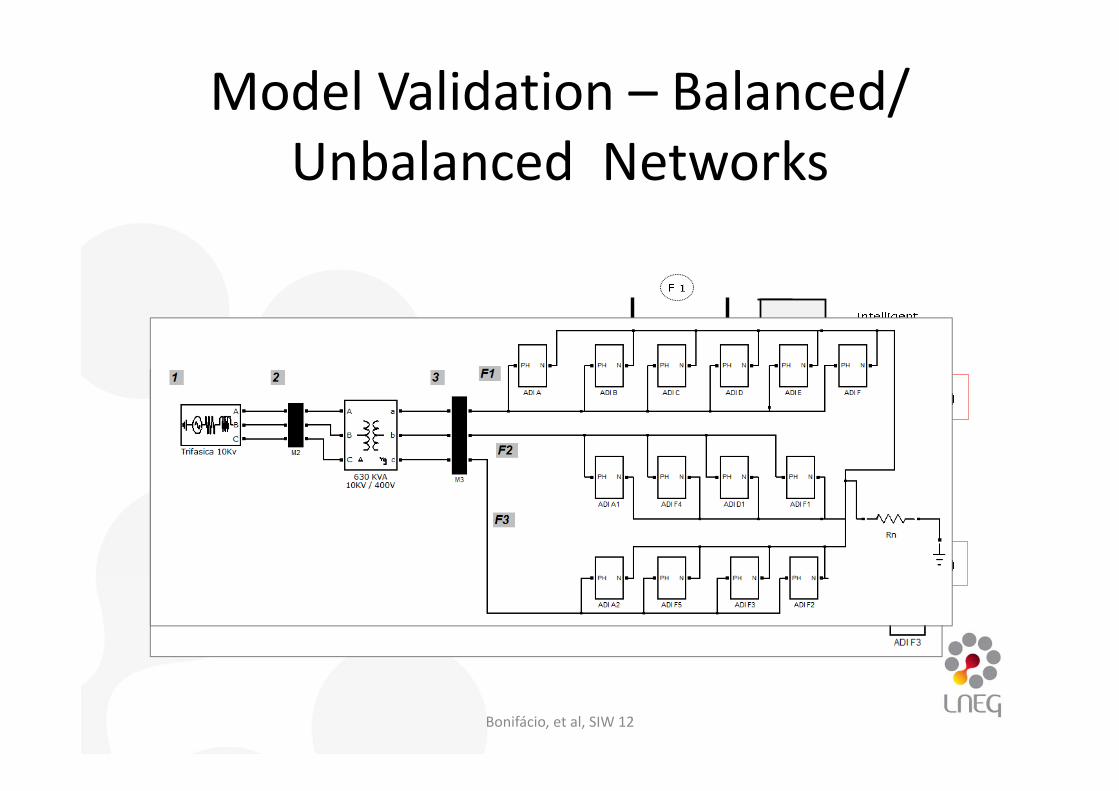
Model Validation – Balanced/ Unbalanced Networks
Bonifácio, et al, SIW 12
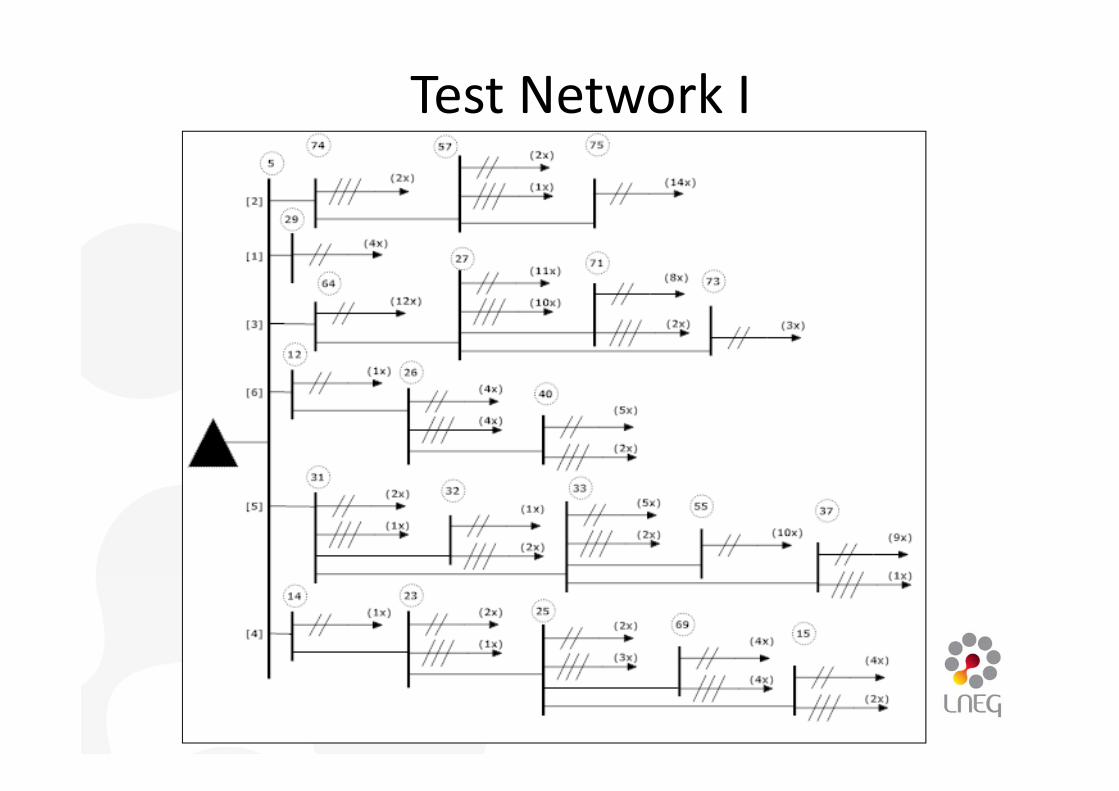
Test Network I
REIVE ‐ Tarefas 2 e 3
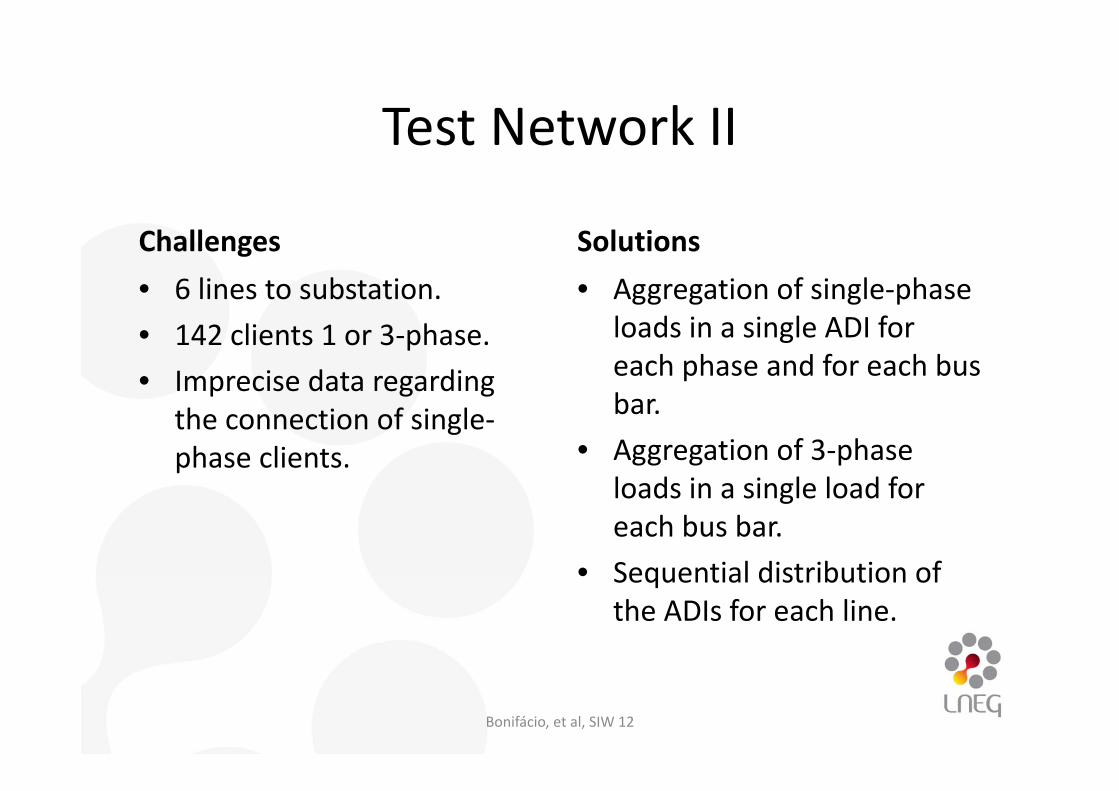
Test Network II
Challenges• 6 lines to substation.• 142 clients 1 or 3‐phase.• Imprecise data regarding
the connection of single‐phase clients.
Solutions• Aggregation of single‐phase
loads in a single ADI for each phase and for each bus bar.
• Aggregation of 3‐phase loads in a single load for each bus bar.
• Sequential distribution of the ADIs for each line.
Bonifácio, et al, SIW 12
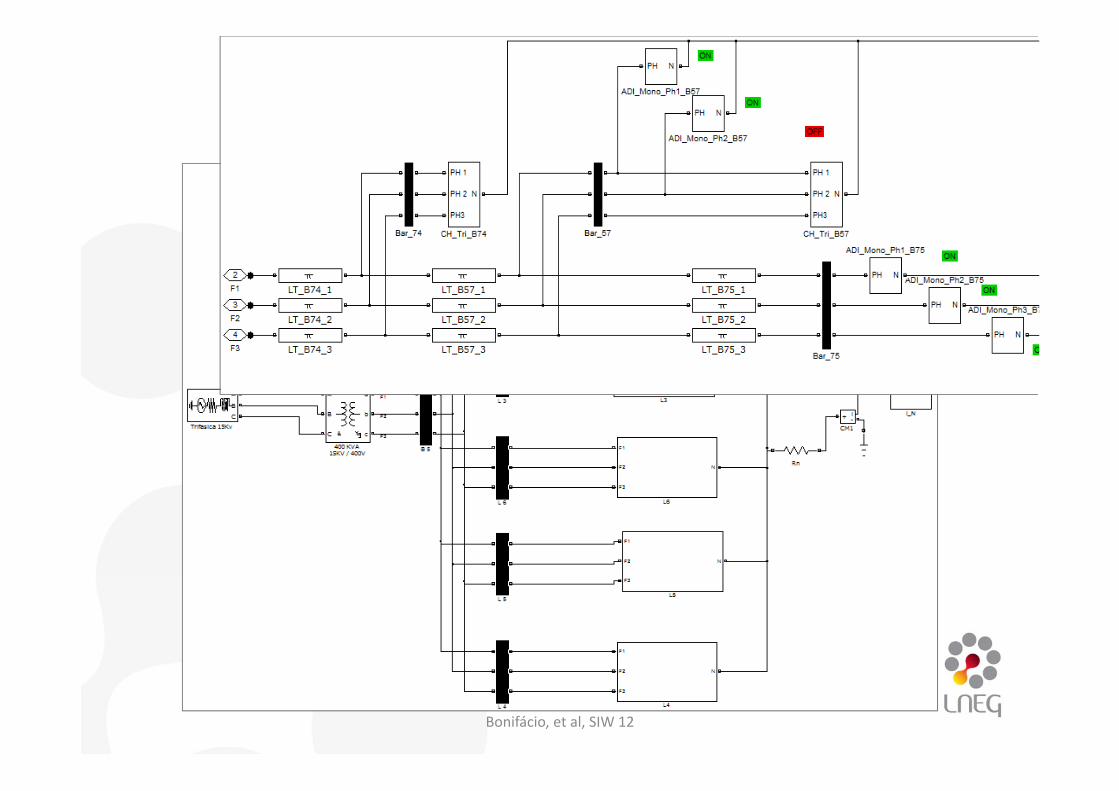
Network Model ‐ I
Bonifácio, et al, SIW 12
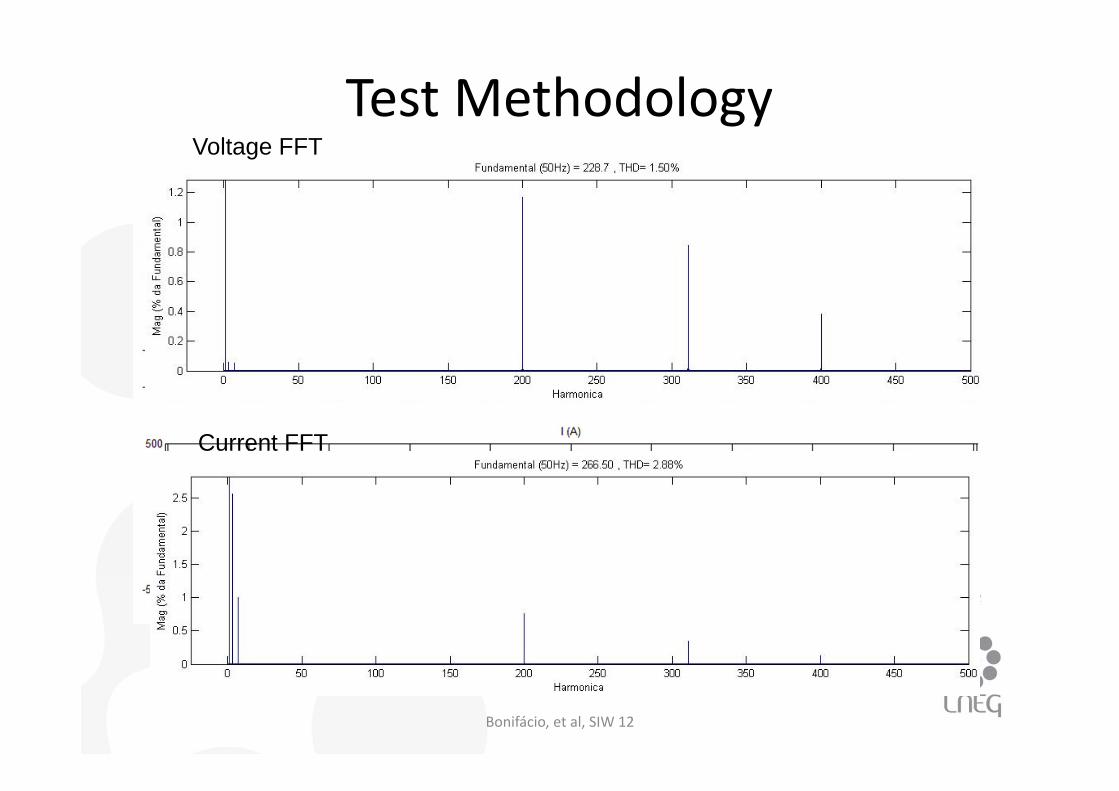
Test Methodology
Bonifácio, et al, SIW 12
Voltage FFT
Current FFT
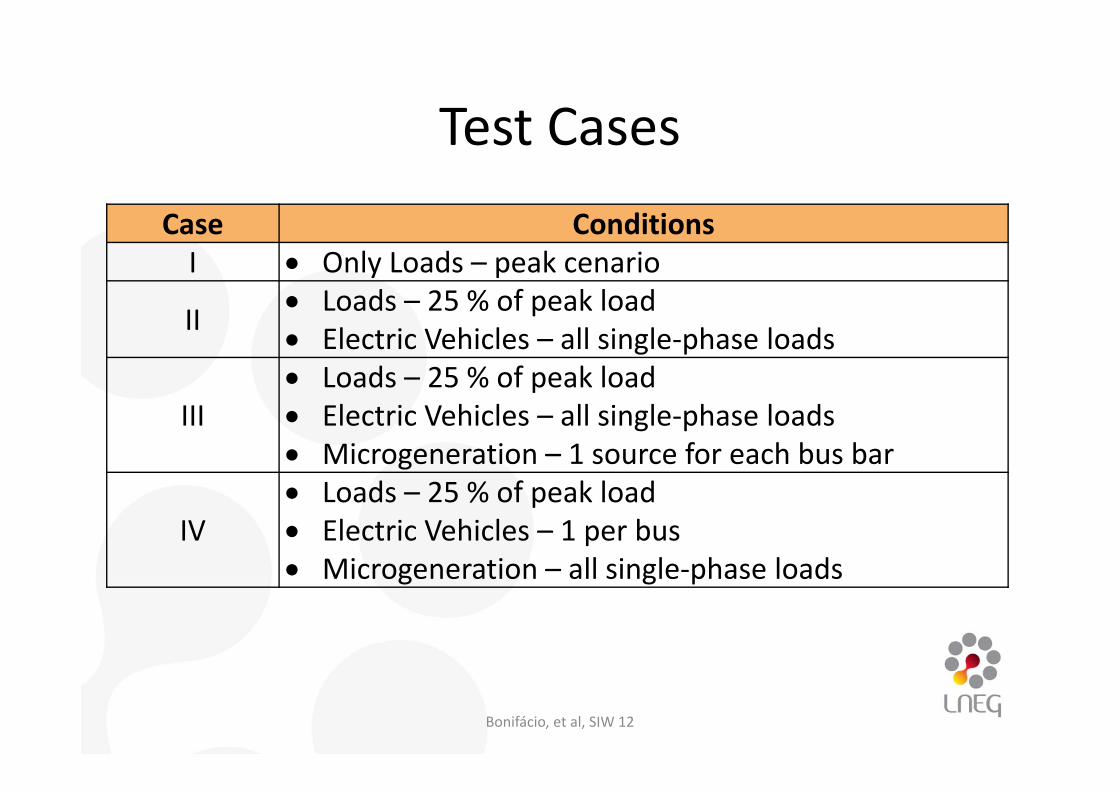
Test CasesCase ConditionsI • Only Loads – peak cenario
II • Loads – 25 % of peak load• Electric Vehicles – all single‐phase loads
III• Loads – 25 % of peak load• Electric Vehicles – all single‐phase loads• Microgeneration – 1 source for each bus bar
IV• Loads – 25 % of peak load• Electric Vehicles – 1 per bus• Microgeneration – all single‐phase loads
Bonifácio, et al, SIW 12
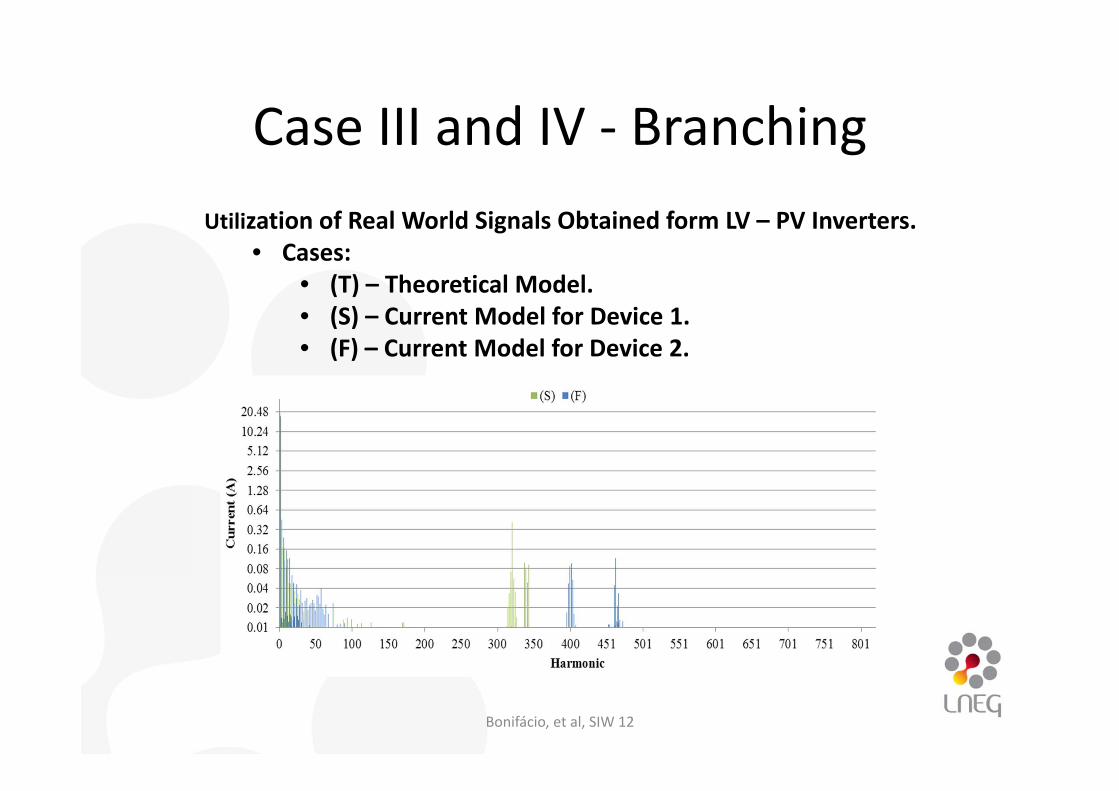
Case III and IV ‐ Branching
Bonifácio, et al, SIW 12
Utilization of Real World Signals Obtained form LV – PV Inverters.• Cases:
• (T) – Theoretical Model.• (S) – Current Model for Device 1. • (F) – Current Model for Device 2.
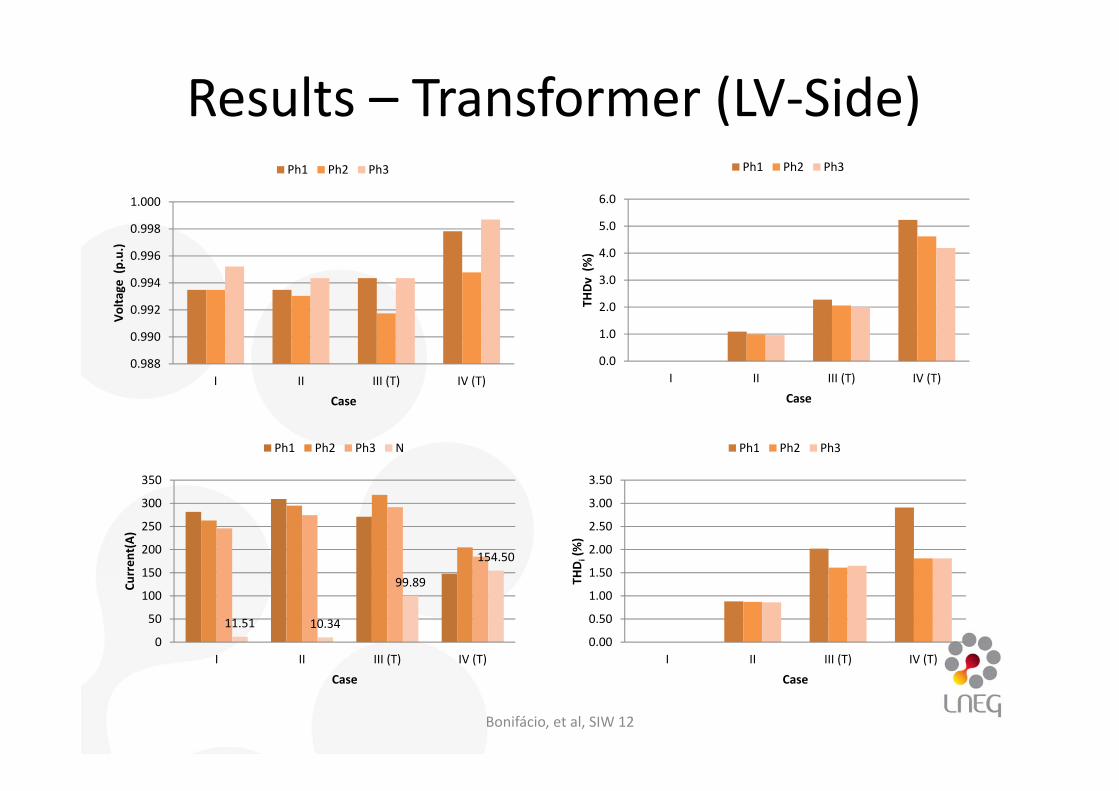
Results – Transformer (LV‐Side)
Bonifácio, et al, SIW 12
0.988
0.990
0.992
0.994
0.996
0.998
1.000
I II III (T) IV (T)
Volta
ge (p.u.)
Case
Ph1 Ph2 Ph3
0.0
1.0
2.0
3.0
4.0
5.0
6.0
I II III (T) IV (T)
THDv (%
)
Case
Ph1 Ph2 Ph3
11.51 10.34
99.89
154.50
0
50
100
150
200
250
300
350
I II III (T) IV (T)
Curren
t(A)
Case
Ph1 Ph2 Ph3 N
0.00
0.50
1.00
1.50
2.00
2.50
3.00
3.50
I II III (T) IV (T)
THDi(%)
Case
Ph1 Ph2 Ph3
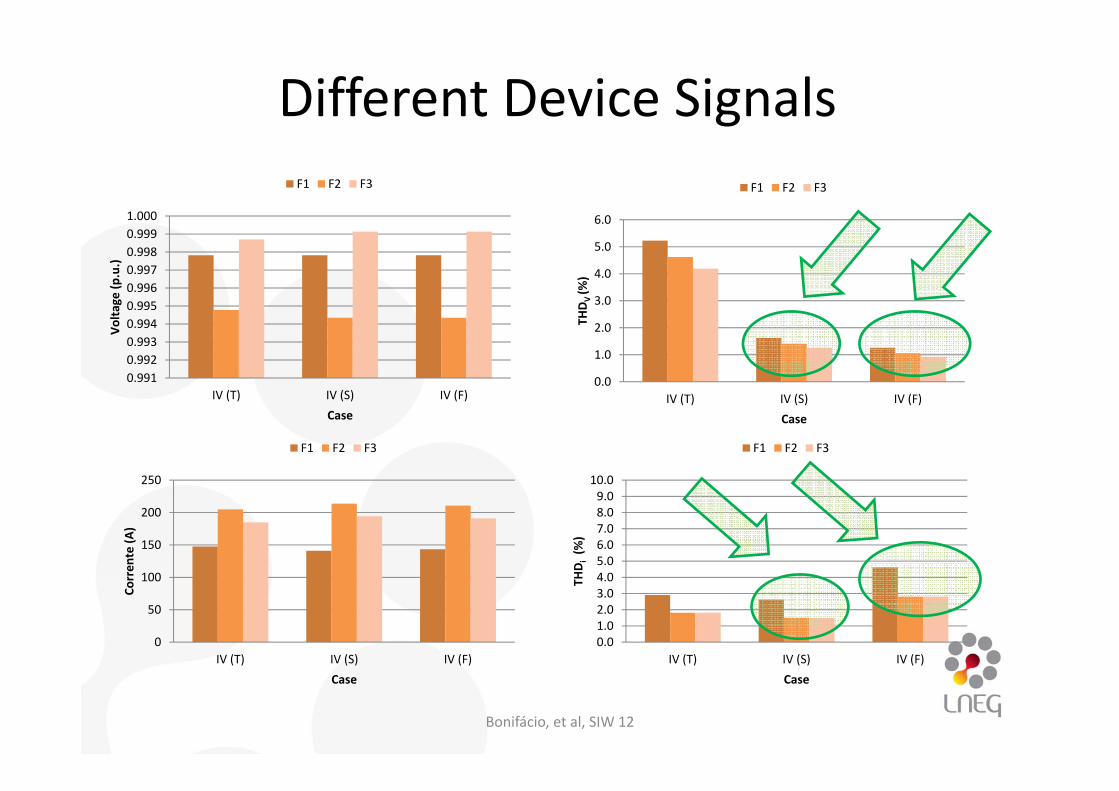
Different Device Signals
Bonifácio, et al, SIW 12
0.9910.9920.9930.9940.9950.9960.9970.9980.9991.000
IV (T) IV (S) IV (F)
Volta
ge (p
.u.)
Case
F1 F2 F3
0.0
1.0
2.0
3.0
4.0
5.0
6.0
IV (T) IV (S) IV (F)
THDV (%
)
Case
F1 F2 F3
0
50
100
150
200
250
IV (T) IV (S) IV (F)
Corren
te (A
)
Case
F1 F2 F3
0.01.02.03.04.05.06.07.08.09.0
10.0
IV (T) IV (S) IV (F)
THDi(%
)
Case
F1 F2 F3
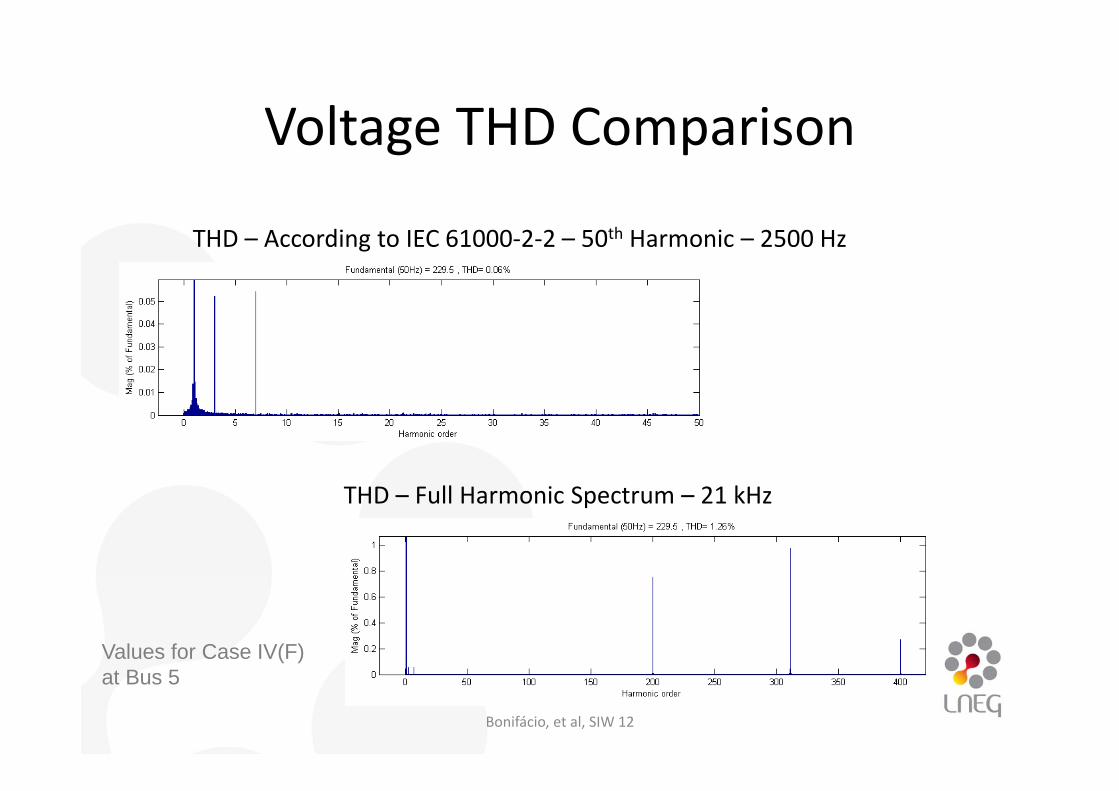
Voltage THD Comparison
Bonifácio, et al, SIW 12
THD – According to IEC 61000‐2‐2 – 50th Harmonic – 2500 Hz
THD – Full Harmonic Spectrum – 21 kHz
Values for Case IV(F)at Bus 5
Conclusions
• Voltage and Current Total Harmonic DistortionValues are conforming to IEC 61000‐3‐2,EN50160 standards.
• Results present a significant contribution aspre‐normative recommendation inconsidering high frequency harmonicsacquired from real device measurements(f>40).
Bonifácio, et al, SIW 12
Thanks For Your Time