Protectionism or Strengthening Competitiveness: The Case ...
14
University of Piraeus SPOUDAI Journal of Economics and Business Σπουδαί http://spoudai.unipi.gr Protectionism or Strengthening Competitiveness: The Case of the United States of America Angelos Kotios a , Spyros Roukanas b , Emmanouil Karakostas c a Rector, University of Piraeus, Professor, Dept. of International and European Studies, University of Piraeus, Greece, [email protected] b Assistant Professor, Dept. of International and European Studies, University of Piraeus, Greece, Email: [email protected] c Ph.D. Candidate, Dept. of International and European Studies, University of Piraeus, Greece, Email: [email protected] Abstract In recent years international trade growth has been slow. Although international trade is considered to have various benefits, such as access to international markets, rapid economic growth, higher competition, and improved investment climate, there is a growing tendency to justify protectionism, especially by the United States of America. The rise of protectionism is part of a growing social and political response to the phenomenon of economic globalization. The United States have strongly supported protectionism as a means of preserving jobs and reducing income inequality. The purpose of this article is to examine whether the protectionism currently adopted by the United States is beneficial to economic growth. Moreover, we examine whether strengthening the competitiveness of the US economy in order to boost the country's exports constitutes a way to avoid a global shift towards protectionism by the sovereign states of the international economic system. The United States wants to reconsider trade agreements, particularly with countries that run trade deficits, including China, Japan, South Korea, and Germany. We will examine the reasons why the United States is seeking protectionist measures. The methodology adopted is the theory of competitive advantage. JEL classification: F13, F14, F23 Keywords: Theory of Competitive Advantage, Competitiveness, Protectionism, USA 1. Introduction Economic growth is the prime economic objective of every state. The international economic environment today is currently faced with a number of challenges. World trade is moving slowly after the onset of the international economic crisis and there is no prospect of a return to the rapid trade growth rates seen in the years prior to the 2008 crisis. In particular, the 21 SPOUDAI Journal of Economics and Business, Vol. 69 (2019), Issue 3, pp. 21-34
Transcript of Protectionism or Strengthening Competitiveness: The Case ...
University
of Piraeus
SPOUDAI
Journal of Economics and Business
Σπουδαί http://spoudai.unipi.gr
Protectionism or Strengthening Competitiveness:
The Case of the United States of America
Angelos Kotios
a, Spyros Roukanas
b, Emmanouil Karakostas
c
aRector, University of Piraeus, Professor, Dept. of International and European Studies,
University of Piraeus, Greece, [email protected] bAssistant Professor, Dept. of International and European Studies, University of Piraeus, Greece,
Email: [email protected] cPh.D. Candidate, Dept. of International and European Studies, University of Piraeus, Greece,
Email: [email protected]
Abstract
In recent years international trade growth has been slow. Although international trade is considered to
have various benefits, such as access to international markets, rapid economic growth, higher
competition, and improved investment climate, there is a growing tendency to justify protectionism,
especially by the United States of America. The rise of protectionism is part of a growing social and
political response to the phenomenon of economic globalization. The United States have strongly
supported protectionism as a means of preserving jobs and reducing income inequality. The purpose
of this article is to examine whether the protectionism currently adopted by the United States is
beneficial to economic growth. Moreover, we examine whether strengthening the competitiveness of
the US economy in order to boost the country's exports constitutes a way to avoid a global shift
towards protectionism by the sovereign states of the international economic system. The United States
wants to reconsider trade agreements, particularly with countries that run trade deficits, including
China, Japan, South Korea, and Germany. We will examine the reasons why the United States is
seeking protectionist measures. The methodology adopted is the theory of competitive advantage.
JEL classification: F13, F14, F23
Keywords: Theory of Competitive Advantage, Competitiveness, Protectionism, USA
1. Introduction
Economic growth is the prime economic objective of every state. The international economic
environment today is currently faced with a number of challenges. World trade is moving
slowly after the onset of the international economic crisis and there is no prospect of a return
to the rapid trade growth rates seen in the years prior to the 2008 crisis. In particular, the
21
SPOUDAI Journal of Economics and Business, Vol. 69 (2019), Issue 3, pp. 21-34
global slowdown in world trade over the recent years may be due to factors such as the
slowdown in trade opening, structural changes in Chinese trade, and the weakness of trade-
related components of aggregate demand (Lewis & Monarch, 2016).
The purpose of this study is to determine the appropriate economic policy that the United
States of America should pursue in order to be able to compete in the international economic
environment in terms of trade. GDP growth is an important economic objective for every
country. The US today faces the dilemma whether to pursue protective trade policies or boost
US competitiveness. In particular, the US government intends to restrict access to the US
market and the aim, of the protective measures envisaged is to secure jobs and incomes in the
United States (Petersen et al., 2017). Protectionism is a phenomenon of international trade
and concerns the trade policy of a state which, through customs duties, quotas and other
commercial policy measures, tries to improve its current account balance causing ripple
effects in the international economic environment.
This paper will try to show that boosting competitiveness is the best way to achieve GDP
growth, because of the competitive advantage of the US. The structure of the present study is
the following: first, a review of the literature on Porter’s Diamond Model, followed by a
theoretical overview of the US competitive advantage and its determination; the US
macroeconomic indicators for the period 2007-2016; and finally the correlation between the
rate of imports and exports and the US per capita income for the period 2007-2016.
This research was based on Porter’s theory of competitive advantage of Porter - Competitive
Advantage of Nations and its finding of a correlation, and - Pearson's Correlation - to
understand the relationship between free trade and the increase of per capita income. Finally,
the analysis of the results was used as a basis for answering the research question.
2. Literature Review
Porter’s Diamond Model has been applied in order to measure the competitiveness of several
countries. Herciu (2013), using Porter’s competitive advantage and the 12 pillars of
international competitiveness used by World Economic Forum to measure international
competitiveness, has found that Romania has competitive advantages in regard to strength of
investor protection, gross national savings as % of GDP, general government debt,
enrollment in tertiary education, number of procedures for starting a business, redundancy
costs, weeks of salary, and domestic and foreign markets. Jasimuddin (2001), using Porter’s
Diamond Model, has shown that the oil sector has helped Saudi Arabia gain and maintain its
competitiveness, and Saudi industrial strengths in gas, chemicals, machinery, and banking are
important contributing factors to the nation's success, but the combination of the strengths
and opportunities and the overall socioeconomic system is what has ultimately contributed to
Saudi Arabia's success. Stone and Ranchhod (2006) have applied a quantitative approach in
order to determine the relative global competitive advantage of the UK, the US and BRIC
nations.
They found that the UK has the highest competitive advantage, the US lags behind the UK in
all factors except supporting industries, but has a similar distortion to the UK, Brazil is a
competitive emerging nation although it has some way to go in its development, some factor-
related conditions prevent Russia from being the global power it once was, India ranks lowest
among all nations studied in related/supporting industries and second to bottom in factor-
related conditions and finally China will become the next developed nation of the BRICS
group. According to some authors, Porter’s Diamond Model lack of some critical aspects
such as national culture, as Van Den Bosch and Van Prooijen (1992) point out.
22
A. Kotios, S. Roukanas, E. Karakostas, SPOUDAI Journal, Vol. 69 (2019), Issue 3, pp. 21-34
Furthermore, Gray (1991), points out the theoretical error of Michael Porter’s Diamond of
not examining the correlation between the role of price rivalry and the exchange rate
fluctuations in shaping international trade. As Daly (1993) mentions, it would be more
sufficient to combine macro variables related to competitiveness (such as wage rates, interest
rates, exchange rates and unit labour costs,), with the micro factors relating to the four
elements of the diamond emphasized in the Porter model. Yetton et. al (1992) argue that
Porter’s Diamond Model is a theory about the competitive advantage of firms and industries
within nations and does not say how new successful firms emerge. Dunning (1992), argues
that Porter underestimates the role of multinational enterprises in the global economy and
their role as a third exogenous factor, along with opportunity and the government. Grant
(1991), points to the lack of clear definitions of the determinants of economic development at
the national level.
Finally, Narula (1993) mentions that Porter's model does not recognize the role of technology
in the development process, as he mentions that economic growth is a function of the rate of
innovation and the national technological advantage, and is affected by the international
trading and investment activities of firms.
3. Competitive Advantage
3.1 Theory of Competitive Advantage
The theory of competitive advantage is based on four categories of country characteristics
that provide the basic prerequisites for determining a nation's competitive advantage (Porter,
1990). The first category comprises the factors of production. While traditional trade theories
define factors of production as land, labor and capital (including human capital), Michael
Porter distinguishes the following categories: human resources, natural resources, knowledge
resources, and capital and infrastructure.
The second factor is the competitive environment. Business strategies and structures are
heavily dependent on the national environment, and there are significant differences in
business segments in different countries that determine how businesses compete. He believes
that domestic rivalries require businesses to be competitive, improve quality, and be
innovative. A third factor is the relevant and supporting industries. The sum of supporting
industries represents an environment in which learning, innovation and functional
productivity can thrive (Davies & Ellis, 2000). The last factor is demand conditions.
Porter focuses more on differences in demand than on similarities that explain the
international competitiveness of countries. According to him, it is not only the magnitude of
demand, in the domestic environment, but also the complexity of buyers in the country of
origin. The composition of domestic demand shapes the way in which companies interpret,
and respond, to the needs of buyers. This forces home-country companies to continually
innovate and upgrade their competitive positions to meet high standards in terms of product
quality, features, and service requirements. Smit (2010) states that the advantages for each
country are not the same as its comparative advantages.
The advantages for each country emphasize its position as a source of international
competitive advantage for businesses, while the comparative advantage highlights the
sectoral composition of trade between countries. For example, if a country exports products
of a particular industry, this does not necessarily mean that the country has a competitive
advantage in that industry.
23
A. Kotios, S. Roukanas, E. Karakostas, SPOUDAI Journal, Vol. 69 (2019), Issue 3, pp. 21-34
3.2 Theoretical Overview of the US Competitive Advantage
To be able to analyze the competitive advantage of the United States, we must look
separately at the dynamics of the United States has in regard to key aspects of the competitive
advantage theory.
Conditions of Production Coordinators (Human resources, knowledge resources): US public
capital markets are fundamentally sound, and remain the preferred option for the US and for
many foreign companies (EY, 2017). Investors abroad sold US$51.3 billion of US assets in
September 2017, while foreigners purchased US$80.9 billion of US debt, including state and
corporate bonds. Capital flows to the United States averaged US$ 21,508.73 billion from
1978 to 2017 (Trading Economics, 2017). The private sector represents the majority of
Project Research and Development executed in the United States, (for example 71% in 2009)
(NSB, 2012). In the United States, businesses funded about 61% of total US research and
development in 2013 (NSB, 2016). Total employment increased by 156,000 in August 2017,
and the unemployment rate slightly changed to 4.4%, according to data from the US Bureau
of Labor Statistics (BLS, 2017).
Competitive environment (Competitive national environment): In the United States of
America, the enforcement of antitrust legislation has become increasingly aggressive in
recent years (Covington, 2017). In the year 2016 there were 1,832 proposed mergers and
acquisitions to be reviewed under the HSR-Antitrust Improvement Act, an increase of 4.5%
as compared to 2015 (OECD, 2017a). The Robinson-Patman Act is a federal antitrust statute
that forbids companies from engaging in specified practices involving discriminatory pricing
and product promotion in connection with products sold to merchants for resale. Moreover,
on January 13, 2016, the Federal Trade Commission (FTC) issued a report on drug patent
settlements. The report summarized data on patent settlements and showed that potential
―pay-for-delay‖ deals decreased substantially in the first year since the Supreme Court’s Act
(OECD, 2017b).
Supporting Industries (External economies of supportive industry groups): Supply chain
industries make up a large and significant part of the US economy (43% of US workers) and
2.5 million businesses in 2012 (43% of all employers) (Delgado & Mills, 2016). In total,
―copyright‖ intensive industries directly and indirectly support 45.5 million jobs, around 30%
of all employees (Antonipillai, et al., 2016). According to the United States Department of
Commerce (2015), the Hollings Manufacturing Extension Partnership at the Department of
Commerce is a network of 60 centres and 1,200 manufacturing experts across the country.
Demand conditions (The composition of domestic demand): The domestic demand of the
United States economy is governed by stringent, safe and consumer-friendly consumer
protection standards and laws. In particular, the Federal Trade Commission (FTC) is
entrusted with protecting consumers and promoting competition (UNCTAD, 2016). A case in
point is the US$10 billion settlement order for the owners of certain Audi and VW cars to be
compensated for the vehicles they bought (FTC, 2016). Because of the financial crisis of
2007 and its consequences (such as commercial banks, insurers, government-sponsored
enterprises, and investment banks either having failed or requiring hundreds of billions in
federal support to continue functioning) the Dodd-Frank Wall Street Reform and Consumer
Protection Act was passed. The main purpose of these acts is to make changes to bank
regulation in order to make bank failures less likely in the future, including prohibitions on
certain forms of risky trading (Webel, 2017).
24
A. Kotios, S. Roukanas, E. Karakostas, SPOUDAI Journal, Vol. 69 (2019), Issue 3, pp. 21-34
4. The Economy of the US
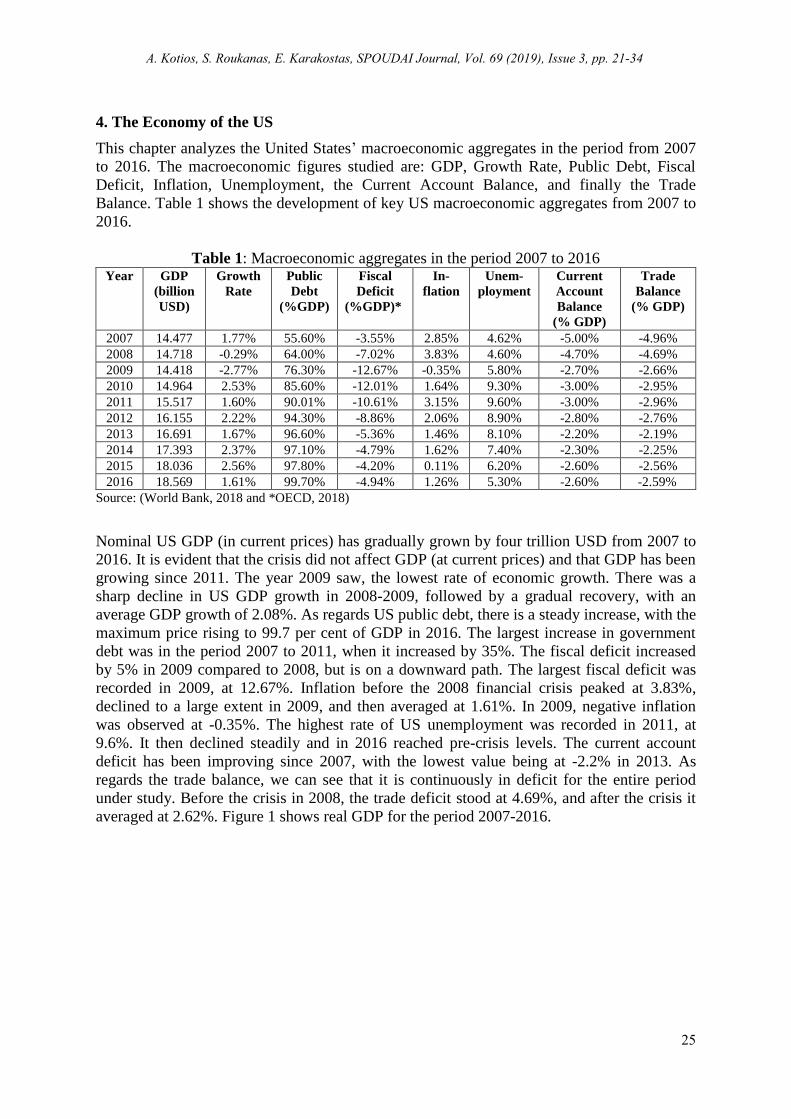
This chapter analyzes the United States’ macroeconomic aggregates in the period from 2007
to 2016. The macroeconomic figures studied are: GDP, Growth Rate, Public Debt, Fiscal
Deficit, Inflation, Unemployment, the Current Account Balance, and finally the Trade
Balance. Table 1 shows the development of key US macroeconomic aggregates from 2007 to
2016.
Table 1: Macroeconomic aggregates in the period 2007 to 2016 Year GDP
(billion
USD)
Growth
Rate
Public
Debt
(%GDP)
Fiscal
Deficit
(%GDP)*
In-
flation
Unem-
ployment
Current
Account
Balance
(% GDP)
Trade
Balance
(% GDP)
2007 14.477 1.77% 55.60% -3.55% 2.85% 4.62% -5.00% -4.96%
2008 14.718 -0.29% 64.00% -7.02% 3.83% 4.60% -4.70% -4.69%
2009 14.418 -2.77% 76.30% -12.67% -0.35% 5.80% -2.70% -2.66%
2010 14.964 2.53% 85.60% -12.01% 1.64% 9.30% -3.00% -2.95%
2011 15.517 1.60% 90.01% -10.61% 3.15% 9.60% -3.00% -2.96%
2012 16.155 2.22% 94.30% -8.86% 2.06% 8.90% -2.80% -2.76%
2013 16.691 1.67% 96.60% -5.36% 1.46% 8.10% -2.20% -2.19%
2014 17.393 2.37% 97.10% -4.79% 1.62% 7.40% -2.30% -2.25%
2015 18.036 2.56% 97.80% -4.20% 0.11% 6.20% -2.60% -2.56%
2016 18.569 1.61% 99.70% -4.94% 1.26% 5.30% -2.60% -2.59%
Source: (World Bank, 2018 and *OECD, 2018)
Nominal US GDP (in current prices) has gradually grown by four trillion USD from 2007 to
2016. It is evident that the crisis did not affect GDP (at current prices) and that GDP has been
growing since 2011. The year 2009 saw, the lowest rate of economic growth. There was a
sharp decline in US GDP growth in 2008-2009, followed by a gradual recovery, with an
average GDP growth of 2.08%. As regards US public debt, there is a steady increase, with the
maximum price rising to 99.7 per cent of GDP in 2016. The largest increase in government
debt was in the period 2007 to 2011, when it increased by 35%. The fiscal deficit increased
by 5% in 2009 compared to 2008, but is on a downward path. The largest fiscal deficit was
recorded in 2009, at 12.67%. Inflation before the 2008 financial crisis peaked at 3.83%,
declined to a large extent in 2009, and then averaged at 1.61%. In 2009, negative inflation
was observed at -0.35%. The highest rate of US unemployment was recorded in 2011, at
9.6%. It then declined steadily and in 2016 reached pre-crisis levels. The current account
deficit has been improving since 2007, with the lowest value being at -2.2% in 2013. As
regards the trade balance, we can see that it is continuously in deficit for the entire period
under study. Before the crisis in 2008, the trade deficit stood at 4.69%, and after the crisis it
averaged at 2.62%. Figure 1 shows real GDP for the period 2007-2016.
25
A. Kotios, S. Roukanas, E. Karakostas, SPOUDAI Journal, Vol. 69 (2019), Issue 3, pp. 21-34
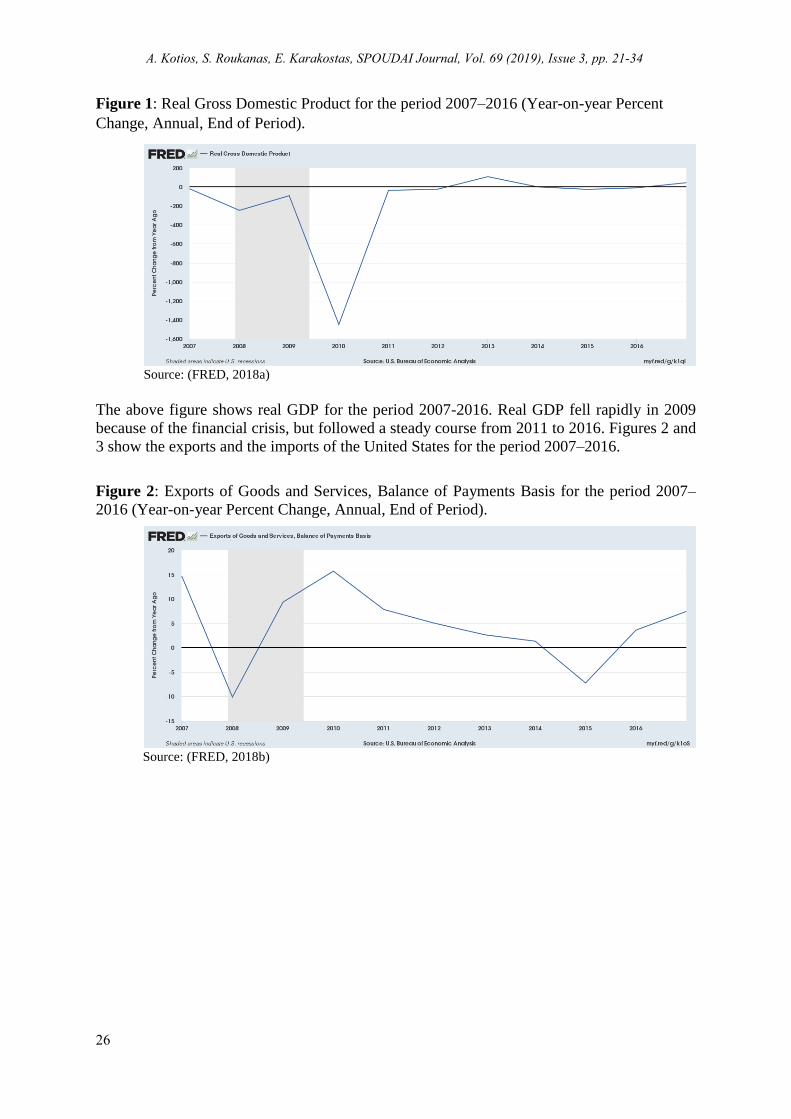
Figure 1: Real Gross Domestic Product for the period 2007–2016 (Year-on-year Percent
Change, Annual, End of Period).
Source: (FRED, 2018a)
The above figure shows real GDP for the period 2007-2016. Real GDP fell rapidly in 2009
because of the financial crisis, but followed a steady course from 2011 to 2016. Figures 2 and
3 show the exports and the imports of the United States for the period 2007–2016.
Figure 2: Exports of Goods and Services, Balance of Payments Basis for the period 2007–
2016 (Year-on-year Percent Change, Annual, End of Period).
Source: (FRED, 2018b)
26
A. Kotios, S. Roukanas, E. Karakostas, SPOUDAI Journal, Vol. 69 (2019), Issue 3, pp. 21-34
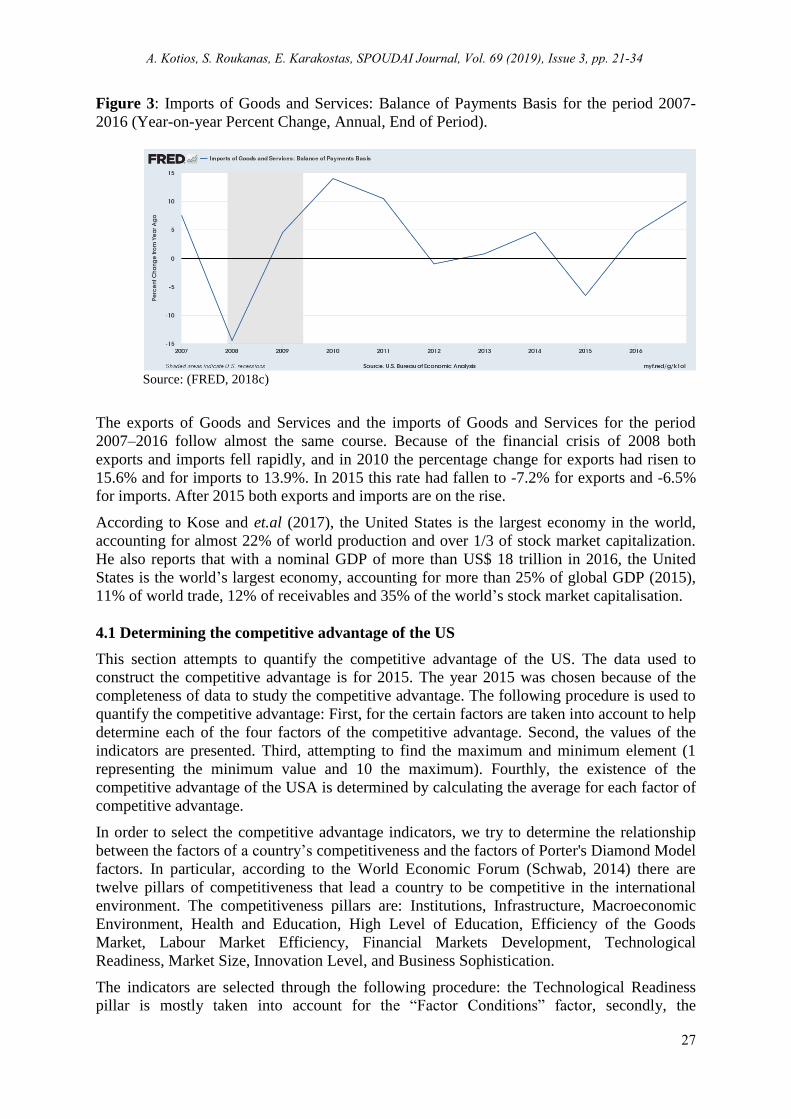
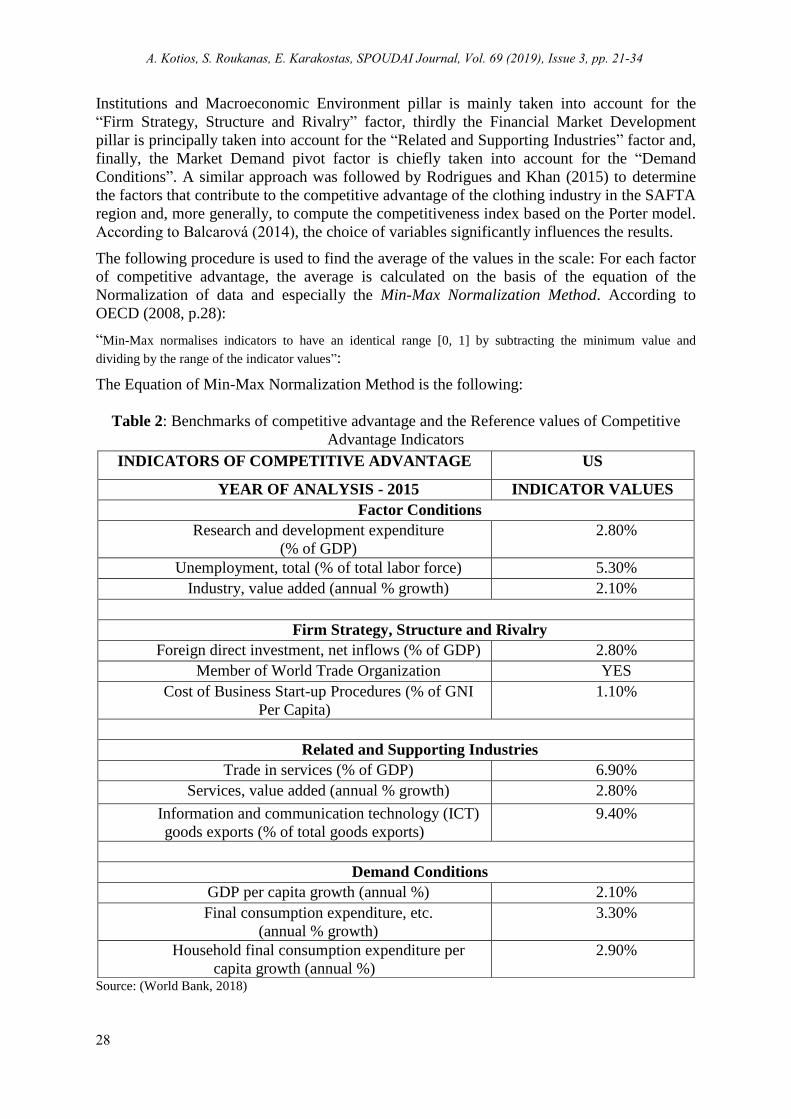
Figure 3: Imports of Goods and Services: Balance of Payments Basis for the period 2007-
2016 (Year-on-year Percent Change, Annual, End of Period).
Source: (FRED, 2018c)
The exports of Goods and Services and the imports of Goods and Services for the period
2007–2016 follow almost the same course. Because of the financial crisis of 2008 both
exports and imports fell rapidly, and in 2010 the percentage change for exports had risen to
15.6% and for imports to 13.9%. In 2015 this rate had fallen to -7.2% for exports and -6.5%
for imports. After 2015 both exports and imports are on the rise.
According to Kose and et.al (2017), the United States is the largest economy in the world,
accounting for almost 22% of world production and over 1/3 of stock market capitalization.
He also reports that with a nominal GDP of more than US$ 18 trillion in 2016, the United
States is the world’s largest economy, accounting for more than 25% of global GDP (2015),
11% of world trade, 12% of receivables and 35% of the world’s stock market capitalisation.
4.1 Determining the competitive advantage of the US
This section attempts to quantify the competitive advantage of the US. The data used to
construct the competitive advantage is for 2015. The year 2015 was chosen because of the
completeness of data to study the competitive advantage. The following procedure is used to
quantify the competitive advantage: First, for the certain factors are taken into account to help
determine each of the four factors of the competitive advantage. Second, the values of the
indicators are presented. Third, attempting to find the maximum and minimum element (1
representing the minimum value and 10 the maximum). Fourthly, the existence of the
competitive advantage of the USA is determined by calculating the average for each factor of
competitive advantage.
In order to select the competitive advantage indicators, we try to determine the relationship
between the factors of a country’s competitiveness and the factors of Porter's Diamond Model
factors. In particular, according to the World Economic Forum (Schwab, 2014) there are
twelve pillars of competitiveness that lead a country to be competitive in the international
environment. The competitiveness pillars are: Institutions, Infrastructure, Macroeconomic
Environment, Health and Education, High Level of Education, Efficiency of the Goods
Market, Labour Market Efficiency, Financial Markets Development, Technological
Readiness, Market Size, Innovation Level, and Business Sophistication.
The indicators are selected through the following procedure: the Technological Readiness
pillar is mostly taken into account for the ―Factor Conditions‖ factor, secondly, the
27
A. Kotios, S. Roukanas, E. Karakostas, SPOUDAI Journal, Vol. 69 (2019), Issue 3, pp. 21-34
Institutions and Macroeconomic Environment pillar is mainly taken into account for the
―Firm Strategy, Structure and Rivalry‖ factor, thirdly the Financial Market Development
pillar is principally taken into account for the ―Related and Supporting Industries‖ factor and,
finally, the Market Demand pivot factor is chiefly taken into account for the ―Demand
Conditions‖. A similar approach was followed by Rodrigues and Khan (2015) to determine
the factors that contribute to the competitive advantage of the clothing industry in the SAFTA
region and, more generally, to compute the competitiveness index based on the Porter model.
According to Balcarová (2014), the choice of variables significantly influences the results.
The following procedure is used to find the average of the values in the scale: For each factor
of competitive advantage, the average is calculated on the basis of the equation of the
Normalization of data and especially the Min-Max Normalization Method. According to
OECD (2008, p.28):
―Min-Max normalises indicators to have an identical range [0, 1] by subtracting the minimum value and
dividing by the range of the indicator values‖:
The Equation of Min-Max Normalization Method is the following:
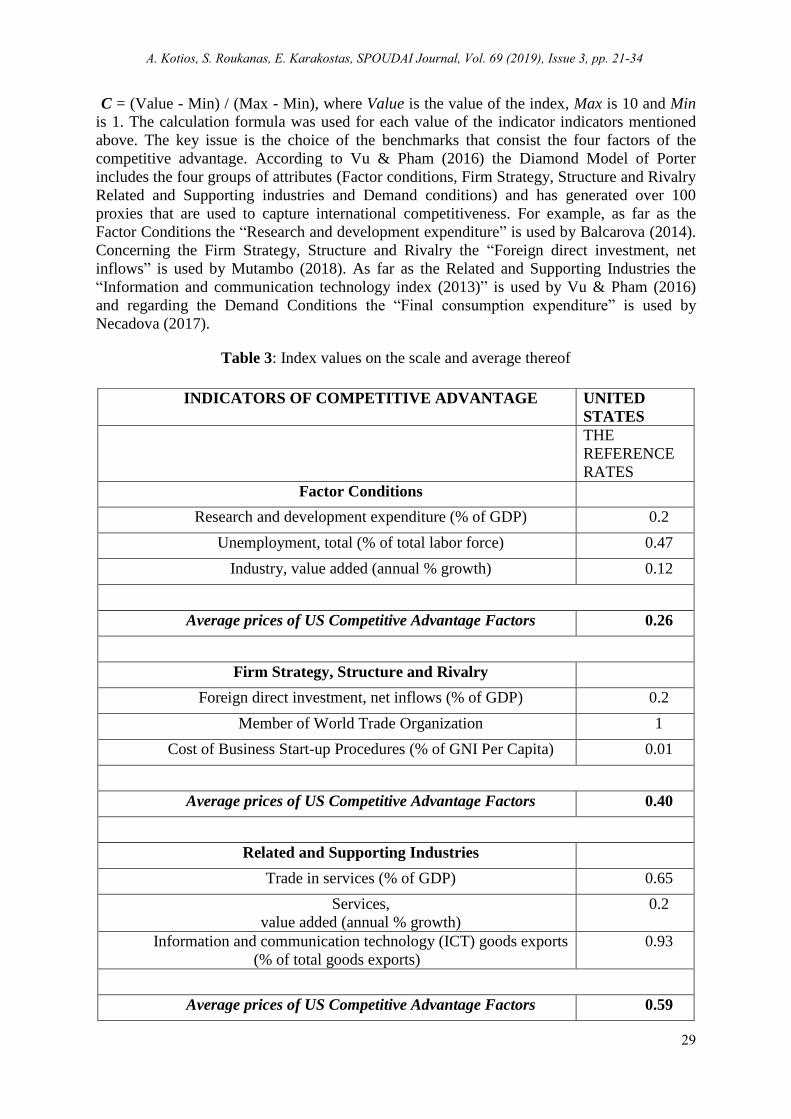
Table 2: Benchmarks of competitive advantage and the Reference values of Competitive
Advantage Indicators
Source: (World Bank, 2018)
INDICATORS OF COMPETITIVE ADVANTAGE US
YEAR OF ANALYSIS - 2015 INDICATOR VALUES
Factor Conditions
Research and development expenditure
(% of GDP)
2.80%
Unemployment, total (% of total labor force) 5.30%
Industry, value added (annual % growth) 2.10%
Firm Strategy, Structure and Rivalry
Foreign direct investment, net inflows (% of GDP) 2.80%
Member of World Trade Organization YES
Cost of Business Start-up Procedures (% of GNI
Per Capita)
1.10%
Related and Supporting Industries
Trade in services (% of GDP) 6.90%
Services, value added (annual % growth) 2.80%
Information and communication technology (ICT)
goods exports (% of total goods exports)
9.40%
Demand Conditions
GDP per capita growth (annual %) 2.10%
Final consumption expenditure, etc.
(annual % growth)
3.30%
Household final consumption expenditure per
capita growth (annual %)
2.90%
28
A. Kotios, S. Roukanas, E. Karakostas, SPOUDAI Journal, Vol. 69 (2019), Issue 3, pp. 21-34
C = (Value - Min) / (Max - Min), where Value is the value of the index, Max is 10 and Min
is 1. The calculation formula was used for each value of the indicator indicators mentioned
above. The key issue is the choice of the benchmarks that consist the four factors of the
competitive advantage. According to Vu & Pham (2016) the Diamond Model of Porter
includes the four groups of attributes (Factor conditions, Firm Strategy, Structure and Rivalry
Related and Supporting industries and Demand conditions) and has generated over 100
proxies that are used to capture international competitiveness. For example, as far as the
Factor Conditions the ―Research and development expenditure‖ is used by Balcarova (2014).
Concerning the Firm Strategy, Structure and Rivalry the ―Foreign direct investment, net
inflows‖ is used by Mutambo (2018). As far as the Related and Supporting Industries the
―Information and communication technology index (2013)‖ is used by Vu & Pham (2016)
and regarding the Demand Conditions the ―Final consumption expenditure‖ is used by
Necadova (2017).
Table 3: Index values on the scale and average thereof
INDICATORS OF COMPETITIVE ADVANTAGE UNITED
STATES
THE
REFERENCE
RATES
Factor Conditions
Research and development expenditure (% of GDP) 0.2
Unemployment, total (% of total labor force) 0.47
Industry, value added (annual % growth) 0.12
Average prices of US Competitive Advantage Factors 0.26
Firm Strategy, Structure and Rivalry
Foreign direct investment, net inflows (% of GDP) 0.2
Member of World Trade Organization 1
Cost of Business Start-up Procedures (% of GNI Per Capita) 0.01
Average prices of US Competitive Advantage Factors 0.40
Related and Supporting Industries
Trade in services (% of GDP) 0.65
Services,
value added (annual % growth)
0.2
Information and communication technology (ICT) goods exports
(% of total goods exports)
0.93
Average prices of US Competitive Advantage Factors 0.59
29
A. Kotios, S. Roukanas, E. Karakostas, SPOUDAI Journal, Vol. 69 (2019), Issue 3, pp. 21-34
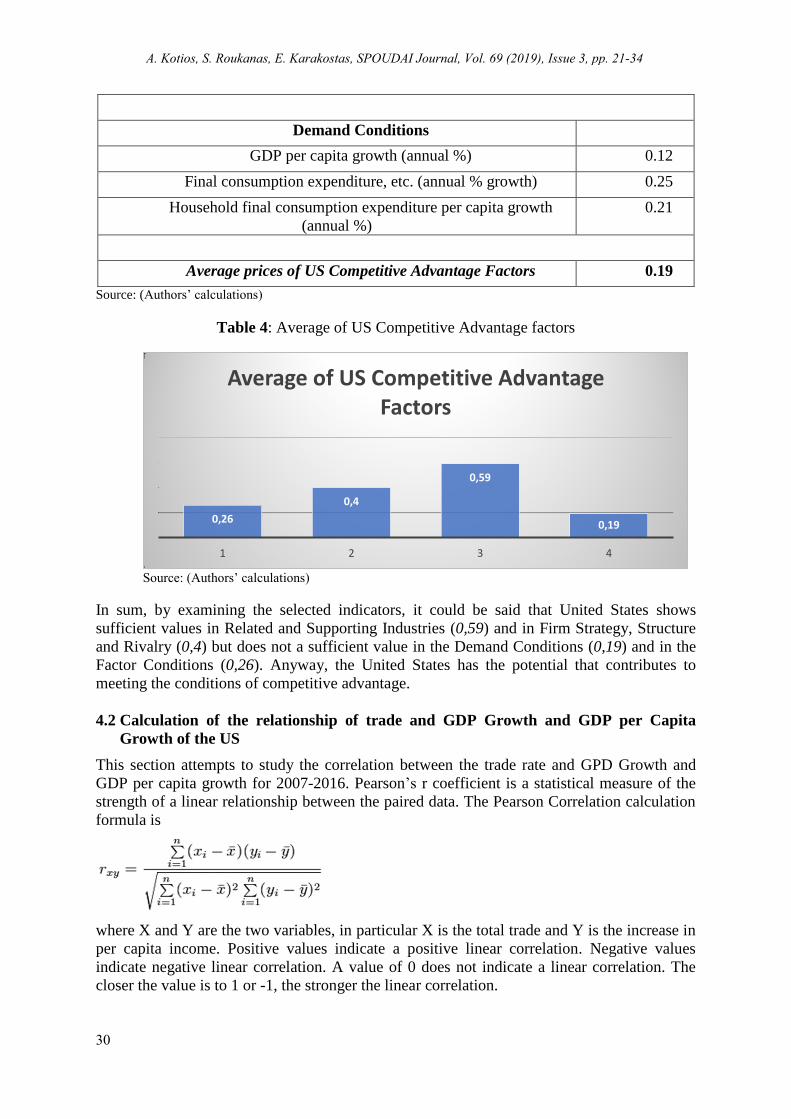
Source: (Authors’ calculations)
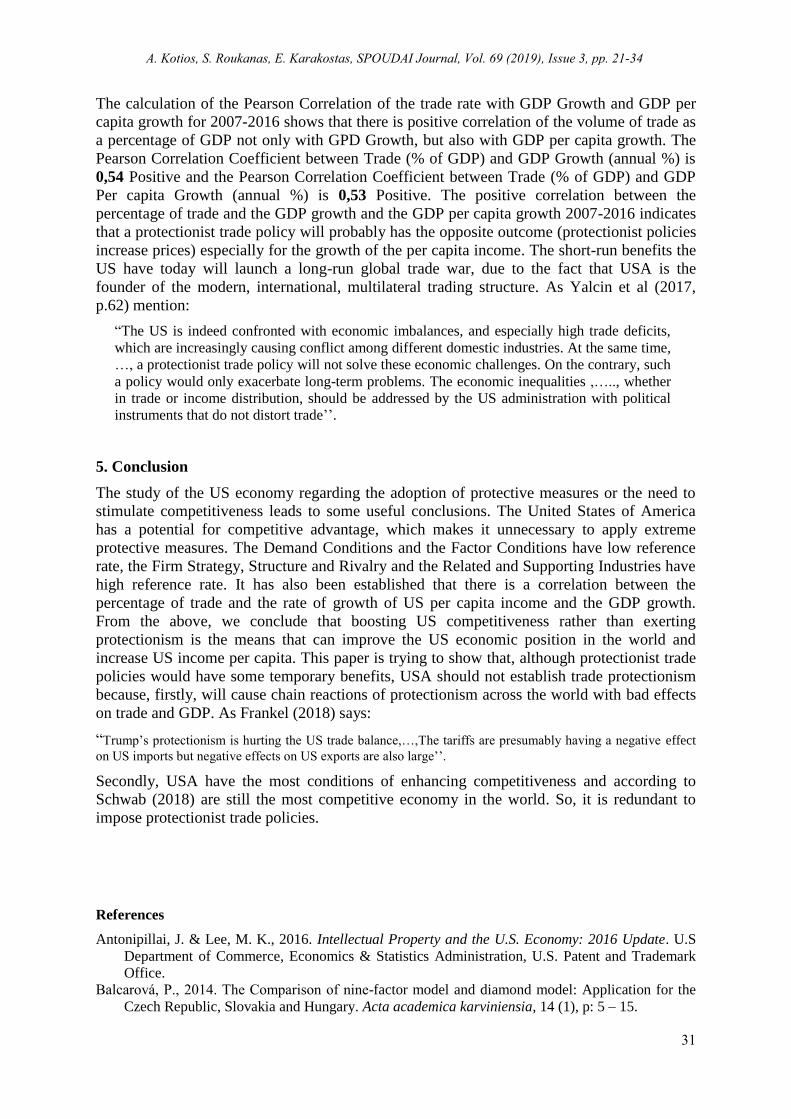
Table 4: Average of US Competitive Advantage factors
Source: (Authors’ calculations)
In sum, by examining the selected indicators, it could be said that United States shows
sufficient values in Related and Supporting Industries (0,59) and in Firm Strategy, Structure
and Rivalry (0,4) but does not a sufficient value in the Demand Conditions (0,19) and in the
Factor Conditions (0,26). Anyway, the United States has the potential that contributes to
meeting the conditions of competitive advantage.
4.2 Calculation of the relationship of trade and GDP Growth and GDP per Capita
Growth of the US
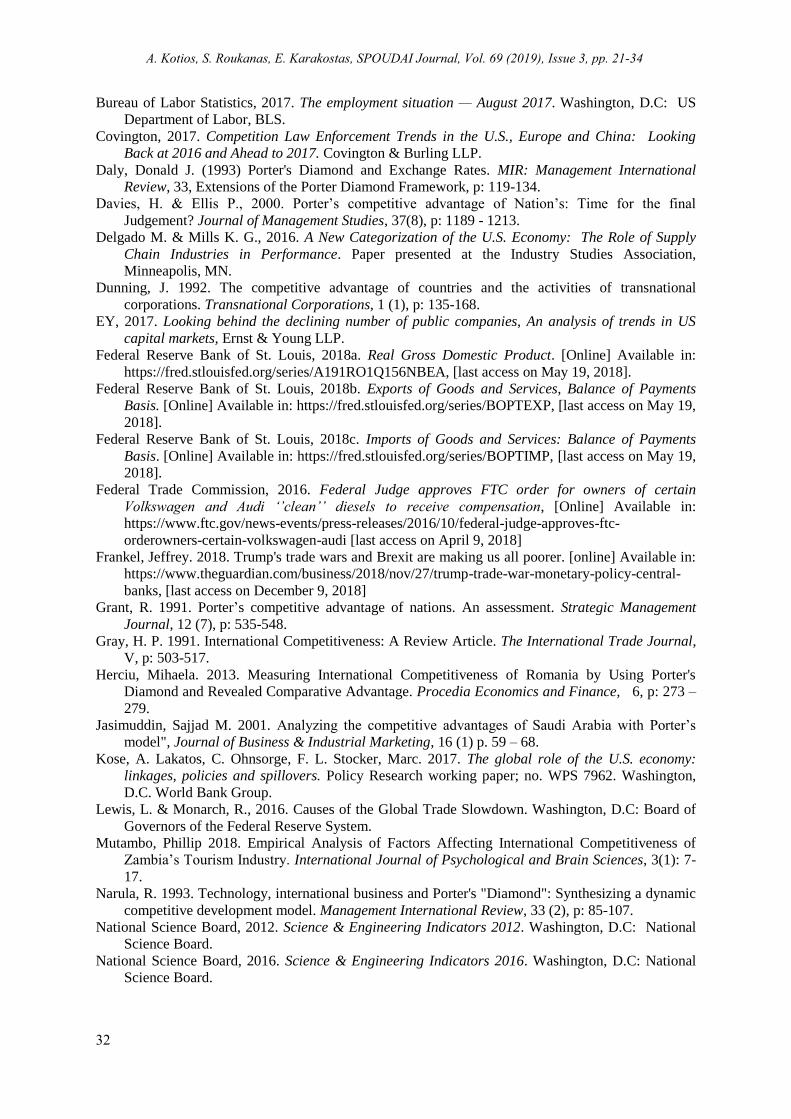
This section attempts to study the correlation between the trade rate and GPD Growth and
GDP per capita growth for 2007-2016. Pearson’s r coefficient is a statistical measure of the
strength of a linear relationship between the paired data. The Pearson Correlation calculation
formula is
where X and Y are the two variables, in particular X is the total trade and Y is the increase in
per capita income. Positive values indicate a positive linear correlation. Negative values
indicate negative linear correlation. A value of 0 does not indicate a linear correlation. The
closer the value is to 1 or -1, the stronger the linear correlation.
0,26
0,4
0,59
0,19
1 2 3 4
Average of US Competitive Advantage Factors
Demand Conditions
GDP per capita growth (annual %) 0.12
Final consumption expenditure, etc. (annual % growth) 0.25
Household final consumption expenditure per capita growth
(annual %)
0.21
Average prices of US Competitive Advantage Factors 0.19
30
A. Kotios, S. Roukanas, E. Karakostas, SPOUDAI Journal, Vol. 69 (2019), Issue 3, pp. 21-34
The calculation of the Pearson Correlation of the trade rate with GDP Growth and GDP per
capita growth for 2007-2016 shows that there is positive correlation of the volume of trade as
a percentage of GDP not only with GPD Growth, but also with GDP per capita growth. The
Pearson Correlation Coefficient between Trade (% of GDP) and GDP Growth (annual %) is
0,54 Positive and the Pearson Correlation Coefficient between Trade (% of GDP) and GDP
Per capita Growth (annual %) is 0,53 Positive. The positive correlation between the
percentage of trade and the GDP growth and the GDP per capita growth 2007-2016 indicates
that a protectionist trade policy will probably has the opposite outcome (protectionist policies
increase prices) especially for the growth of the per capita income. The short-run benefits the
US have today will launch a long-run global trade war, due to the fact that USA is the
founder of the modern, international, multilateral trading structure. As Yalcin et al (2017,
p.62) mention:
―The US is indeed confronted with economic imbalances, and especially high trade deficits,
which are increasingly causing conflict among different domestic industries. At the same time,
…, a protectionist trade policy will not solve these economic challenges. On the contrary, such
a policy would only exacerbate long-term problems. The economic inequalities ,….., whether
in trade or income distribution, should be addressed by the US administration with political
instruments that do not distort trade’’.
5. Conclusion
The study of the US economy regarding the adoption of protective measures or the need to
stimulate competitiveness leads to some useful conclusions. The United States of America
has a potential for competitive advantage, which makes it unnecessary to apply extreme
protective measures. The Demand Conditions and the Factor Conditions have low reference
rate, the Firm Strategy, Structure and Rivalry and the Related and Supporting Industries have
high reference rate. It has also been established that there is a correlation between the
percentage of trade and the rate of growth of US per capita income and the GDP growth.
From the above, we conclude that boosting US competitiveness rather than exerting
protectionism is the means that can improve the US economic position in the world and
increase US income per capita. This paper is trying to show that, although protectionist trade
policies would have some temporary benefits, USA should not establish trade protectionism
because, firstly, will cause chain reactions of protectionism across the world with bad effects
on trade and GDP. As Frankel (2018) says:
―Trump’s protectionism is hurting the US trade balance,…,The tariffs are presumably having a negative effect
on US imports but negative effects on US exports are also large’’.
Secondly, USA have the most conditions of enhancing competitiveness and according to
Schwab (2018) are still the most competitive economy in the world. So, it is redundant to
impose protectionist trade policies.
References
Antonipillai, J. & Lee, M. K., 2016. Intellectual Property and the U.S. Economy: 2016 Update. U.S
Department of Commerce, Economics & Statistics Administration, U.S. Patent and Trademark
Office.
Balcarová, P., 2014. The Comparison of nine-factor model and diamond model: Application for the
Czech Republic, Slovakia and Hungary. Acta academica karviniensia, 14 (1), p: 5 – 15.
31
A. Kotios, S. Roukanas, E. Karakostas, SPOUDAI Journal, Vol. 69 (2019), Issue 3, pp. 21-34
Bureau of Labor Statistics, 2017. The employment situation — August 2017. Washington, D.C: US
Department of Labor, BLS.
Covington, 2017. Competition Law Enforcement Trends in the U.S., Europe and China: Looking
Back at 2016 and Ahead to 2017. Covington & Burling LLP.
Daly, Donald J. (1993) Porter's Diamond and Exchange Rates. MIR: Management International
Review, 33, Extensions of the Porter Diamond Framework, p: 119-134.
Davies, H. & Ellis P., 2000. Porter’s competitive advantage of Nation’s: Time for the final
Judgement? Journal of Management Studies, 37(8), p: 1189 - 1213.
Delgado M. & Mills K. G., 2016. A New Categorization of the U.S. Economy: The Role of Supply
Chain Industries in Performance. Paper presented at the Industry Studies Association,
Minneapolis, MN.
Dunning, J. 1992. The competitive advantage of countries and the activities of transnational
corporations. Transnational Corporations, 1 (1), p: 135-168.
EY, 2017. Looking behind the declining number of public companies, An analysis of trends in US
capital markets, Ernst & Young LLP.
Federal Reserve Bank of St. Louis, 2018a. Real Gross Domestic Product. [Online] Available in:
https://fred.stlouisfed.org/series/A191RO1Q156NBEA, [last access on May 19, 2018].
Federal Reserve Bank of St. Louis, 2018b. Exports of Goods and Services, Balance of Payments
Basis. [Online] Available in: https://fred.stlouisfed.org/series/BOPTEXP, [last access on May 19,
2018].
Federal Reserve Bank of St. Louis, 2018c. Imports of Goods and Services: Balance of Payments
Basis. [Online] Available in: https://fred.stlouisfed.org/series/BOPTIMP, [last access on May 19,
2018].
Federal Trade Commission, 2016. Federal Judge approves FTC order for owners of certain
Volkswagen and Audi ‘’clean’’ diesels to receive compensation, [Online] Available in:
https://www.ftc.gov/news-events/press-releases/2016/10/federal-judge-approves-ftc-
orderowners-certain-volkswagen-audi [last access on April 9, 2018]
Frankel, Jeffrey. 2018. Trump's trade wars and Brexit are making us all poorer. [online] Available in:
https://www.theguardian.com/business/2018/nov/27/trump-trade-war-monetary-policy-central-
banks, [last access on December 9, 2018]
Grant, R. 1991. Porter’s competitive advantage of nations. An assessment. Strategic Management
Journal, 12 (7), p: 535-548.
Gray, H. P. 1991. International Competitiveness: A Review Article. The International Trade Journal,
V, p: 503-517.
Herciu, Mihaela. 2013. Measuring International Competitiveness of Romania by Using Porter's
Diamond and Revealed Comparative Advantage. Procedia Economics and Finance, 6, p: 273 –
279.
Jasimuddin, Sajjad M. 2001. Analyzing the competitive advantages of Saudi Arabia with Porter’s
model", Journal of Business & Industrial Marketing, 16 (1) p. 59 – 68.
Kose, A. Lakatos, C. Ohnsorge, F. L. Stocker, Marc. 2017. The global role of the U.S. economy:
linkages, policies and spillovers. Policy Research working paper; no. WPS 7962. Washington,
D.C. World Bank Group.
Lewis, L. & Monarch, R., 2016. Causes of the Global Trade Slowdown. Washington, D.C: Board of
Governors of the Federal Reserve System.
Mutambo, Phillip 2018. Empirical Analysis of Factors Affecting International Competitiveness of
Zambia’s Tourism Industry. International Journal of Psychological and Brain Sciences, 3(1): 7-
17.
Narula, R. 1993. Technology, international business and Porter's "Diamond": Synthesizing a dynamic
competitive development model. Management International Review, 33 (2), p: 85-107.
National Science Board, 2012. Science & Engineering Indicators 2012. Washington, D.C: National
Science Board.
National Science Board, 2016. Science & Engineering Indicators 2016. Washington, D.C: National
Science Board.
32
A. Kotios, S. Roukanas, E. Karakostas, SPOUDAI Journal, Vol. 69 (2019), Issue 3, pp. 21-34
Nečadová, Marta, 2017. Suitability of porter’s sd model and the 9f model for evaluation of national
competitiveness of visegrad group countries and Germany. The 11th International Days of
Statistics and Economics, Prague, September 14-16, 2017.
Organization for Economic Co-operation and Development, 2017a. Annual Report on Competition
Policy Developments in the United States, OECD.
Organization for Economic Co-operation and Development, 2017b. Annual Report on Competition
Policy Developments in the United States. Directorate for Financial and Enterprise Affairs,
Competition Committee, DAF/COMP/AR(2017)18, Organization for Economic Co-operation
and Development.
Organization for Economic Co-operation and Development, 2018. General government deficit
(indicator), [Online] Available in: https://data.oecd.org/gga/general-government-deficit.htm, [last
access on May 19, 2018].
Organization For Economic Co-Operation And Development. 2008 Handbook on Constructing
Composite Indicators methodology and user guide. OECD, France.
Petersen, Τ. Schoof, U. Yalcin, E. Felbermayr, G. & Steininger M., 2017. Global Impact of a
Protectionist U.S. Trade Policy. GED Focus Paper, Germany: Bertelsmann Stiftung.
Porter, M. E., 1990. The competitive advantage of Nations. Harvard Business Review, 68 (2), p: 73 –
93.
Rodrigues, G. & Khan, Z., 2015. Competitiveness of clothing industry based on Porter's diamond
model: SAFTA countries. United States: Proceedings of Academics World International
Conference, International Institute of Engineers and Researchers, pp. 18-23.
Schwab, K., 2014. The global Competitiveness Report 2014 – 2015. World Economic Forum.
Schwab, Klaus. 2018 The Global Competitiveness Report 2018. World Economic Forum,
Switzerland.
Smit, A. J., 2010. The competitive advantage of nations: is Porter’s Diamond Framework a new
theory that explains the international competitiveness of countries? Southern African Business
Review, 14 (1), p: 105 – 130.
Stone, Howard B.J. and Ranchhod, Ashok. 2006. Competitive advantage of a nation in the global
arena: a quantitative advancement to Porter’s diamond applied to the UK, USA and BRIC
nations. Strategic Change, 15, p: 283 – 294.
Trading Economics, 2017. United States Net Treasury International Capital Flows. [Online],
Available in: https://tradingeconomics.com/united-states/capital-flows [last access on April 9,
2018]
United Nations Conference on Trade and Development, 2016. Manual on Consumer Protection.
UNCTAD.
United States Department of Commerce 2015. Supply Chain Innovation: Strengthening America’s
Small Manufacturers. The Executive Office of the President and the U.S. Department of
Commerce, March 2015.
Van Den Bosch, Frans A.J. and Van Prooijen, Arno A. 1992. The competitive advantage of European
nations: The impact of national culture — a missing element in porter's analysis? European
Management Journal, 10, (2) p: 173-177.
Vu, Huong Thanh. & Pham, Lam Cat. 2016. A dynamic approach to assess international
competitiveness of Vietnam’s garment and textile industry. Springer Plus. 5:203 DOI
10.1186/s40064-016-1912-3.
Webel, Baird. 2017. The Dodd-Frank Wall Street Reform and Consumer Protection Act: Background
and Summary. Congressional Research Service.
World Bank, 2018. Data Bank, World Development Indicators. World Bank Group, [Online],
Available in: www.databank.worldbank.org, [last access on May 19, 2018].
Yalcin, E. Felbermayr, G. and Steininger M. 2017. Global Impact of a Protectionist U.S. Trade
Policy. ifo Institute, Study on Behalf of the Bertelsmann Foundation.
Yetton, P., J. Craig, J. Davis and F. Hilmer. 1992 Are diamonds a country’s best friend? A critique of
Porter’s theory of national competition as applied to Canada, New Zealand and Australia,
Australian Journal of Management, 17, (1) 89-119.
33
A. Kotios, S. Roukanas, E. Karakostas, SPOUDAI Journal, Vol. 69 (2019), Issue 3, pp. 21-34
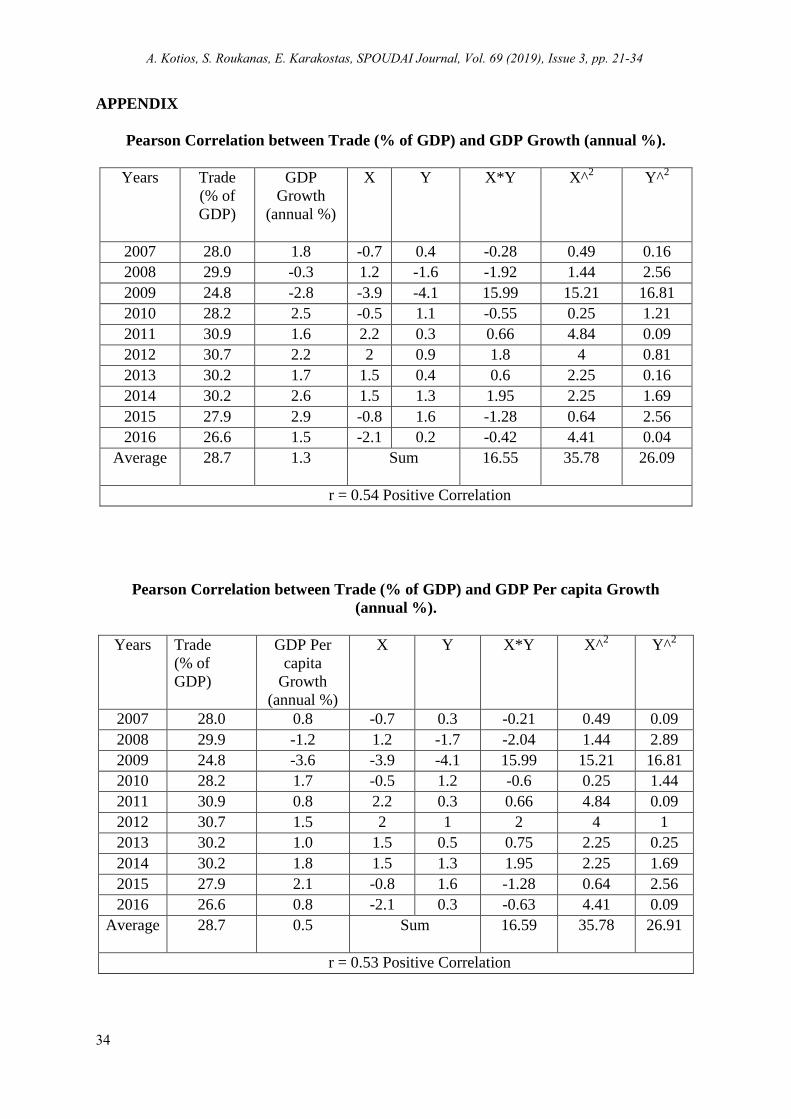
APPENDIX
Pearson Correlation between Trade (% of GDP) and GDP Growth (annual %).
Years Trade
(% of
GDP)
GDP
Growth
(annual %)
X Y X*Y X^2
Y^2
2007 28.0 1.8 -0.7 0.4 -0.28 0.49 0.16
2008 29.9 -0.3 1.2 -1.6 -1.92 1.44 2.56
2009 24.8 -2.8 -3.9 -4.1 15.99 15.21 16.81
2010 28.2 2.5 -0.5 1.1 -0.55 0.25 1.21
2011 30.9 1.6 2.2 0.3 0.66 4.84 0.09
2012 30.7 2.2 2 0.9 1.8 4 0.81
2013 30.2 1.7 1.5 0.4 0.6 2.25 0.16
2014 30.2 2.6 1.5 1.3 1.95 2.25 1.69
2015 27.9 2.9 -0.8 1.6 -1.28 0.64 2.56
2016 26.6 1.5 -2.1 0.2 -0.42 4.41 0.04
Average 28.7 1.3 Sum
16.55 35.78 26.09
r = 0.54 Positive Correlation
Pearson Correlation between Trade (% of GDP) and GDP Per capita Growth
(annual %).
Years Trade
(% of
GDP)
GDP Per
capita
Growth
(annual %)
X Y X*Y X^2
Y^2
2007 28.0 0.8 -0.7 0.3 -0.21 0.49 0.09
2008 29.9 -1.2 1.2 -1.7 -2.04 1.44 2.89
2009 24.8 -3.6 -3.9 -4.1 15.99 15.21 16.81
2010 28.2 1.7 -0.5 1.2 -0.6 0.25 1.44
2011 30.9 0.8 2.2 0.3 0.66 4.84 0.09
2012 30.7 1.5 2 1 2 4 1
2013 30.2 1.0 1.5 0.5 0.75 2.25 0.25
2014 30.2 1.8 1.5 1.3 1.95 2.25 1.69
2015 27.9 2.1 -0.8 1.6 -1.28 0.64 2.56
2016 26.6 0.8 -2.1 0.3 -0.63 4.41 0.09
Average 28.7 0.5 Sum
16.59 35.78 26.91
r = 0.53 Positive Correlation
34
A. Kotios, S. Roukanas, E. Karakostas, SPOUDAI Journal, Vol. 69 (2019), Issue 3, pp. 21-34