PROTECTFP6-036425 PROTECT recommendations – application in practice.
18
FP6-036425 FP6-036425 PROTECT PROTECT PROTECT recommendations – application in practice
-
Upload
shanon-todd -
Category
Documents
-
view
224 -
download
1
Transcript of PROTECTFP6-036425 PROTECT recommendations – application in practice.
FP6-036425FP6-036425PROTECT PROTECT
PROTECT recommendations –
application in practice
FP6-036425FP6-036425PROTECT PROTECT
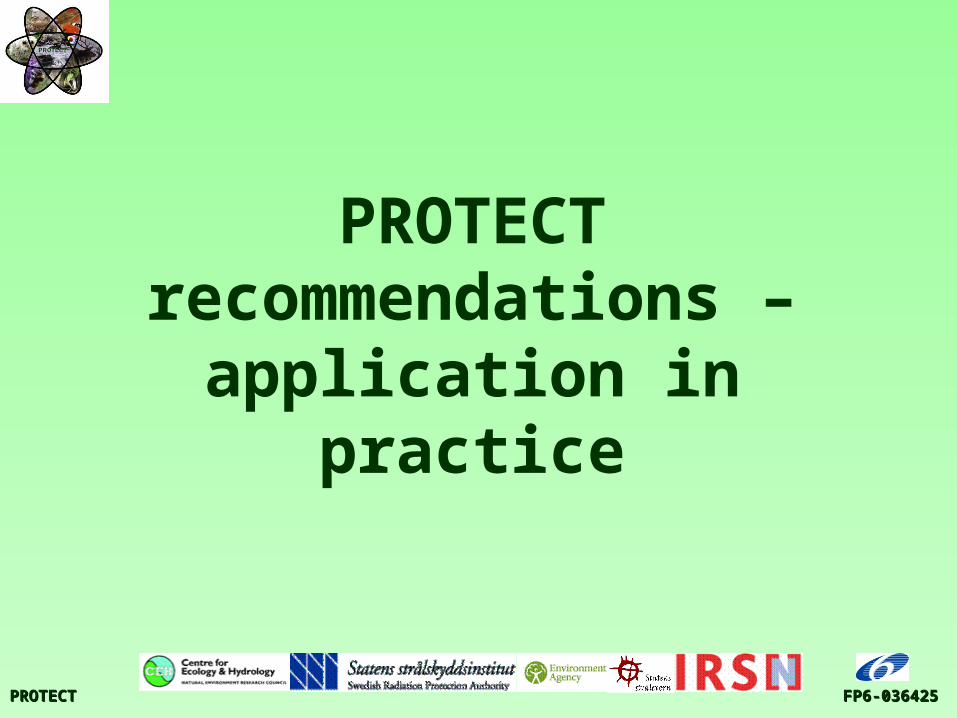
Outline
• Overview of approaches to assessment/available assessment tools
• Uncertainty/variability in model predictions
• Put the PROTECT benchmark values into context of results of existing environmental assessments
• Optimisation
• Revisit concepts
• Introduce breakouts
IAEA EMRAS Biota IAEA EMRAS Biota Working GroupWorking Group
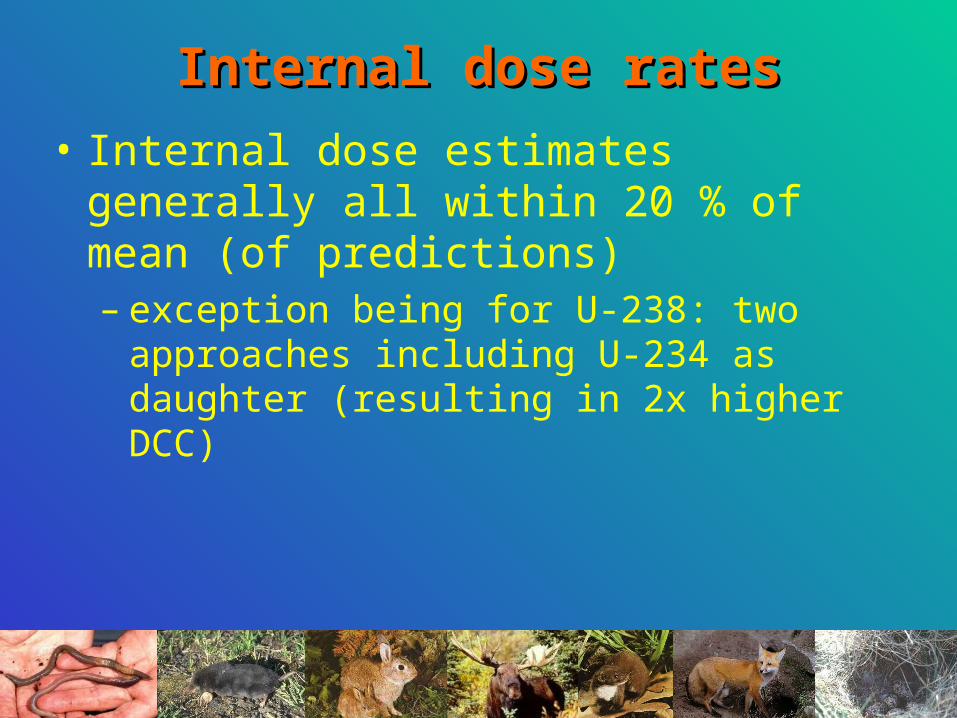
Internal dose ratesInternal dose rates
• Internal dose estimates generally all within 20 % of mean (of predictions)– exception being for U-238: two approaches
including U-234 as daughter (resulting in 2x higher DCC)
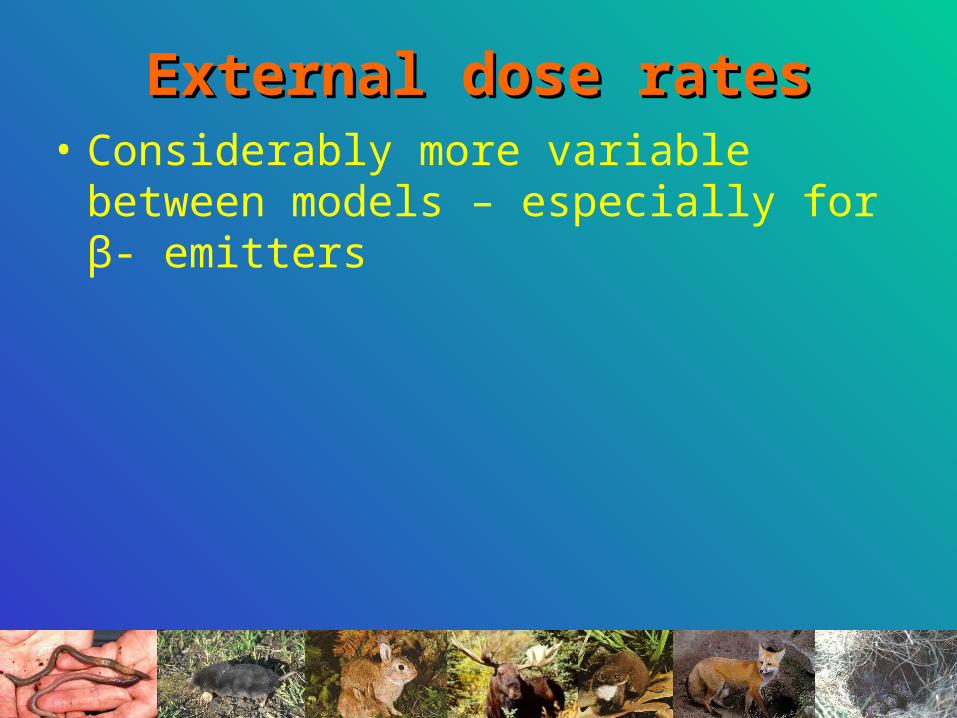
External dose ratesExternal dose rates• Considerably more variable between models –
especially for β- emitters
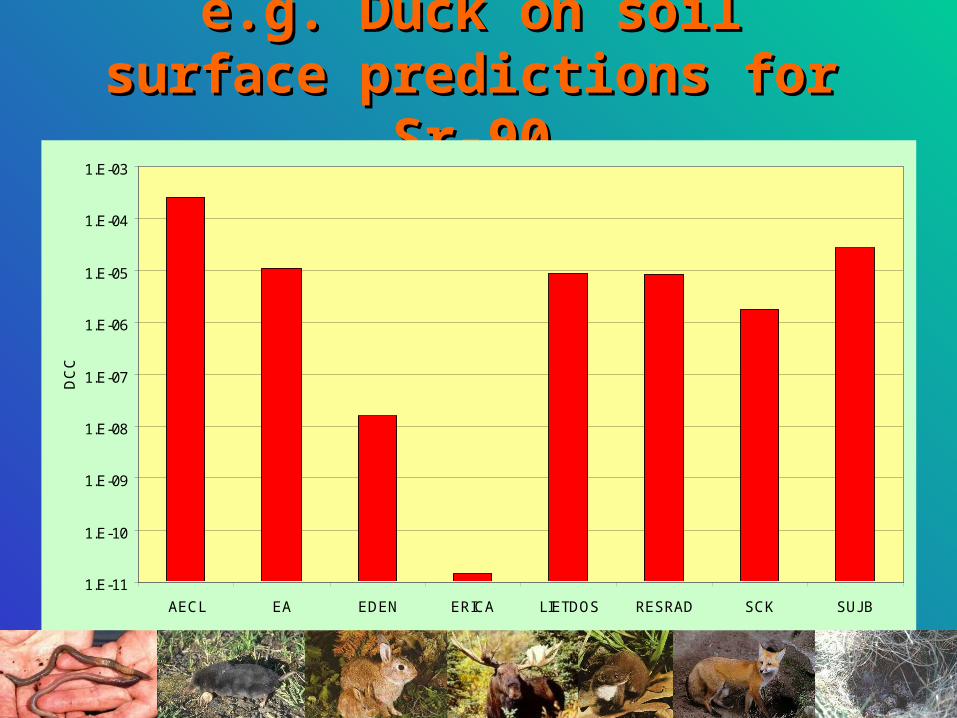
e.g. Duck on soil surface e.g. Duck on soil surface predictions for Sr-90predictions for Sr-90
1.E-11
1.E-10
1.E-09
1.E-08
1.E-07
1.E-06
1.E-05
1.E-04
1.E-03
AECL EA EDEN ERICA LIETDOS RESRAD SCK SUJB
DC
C
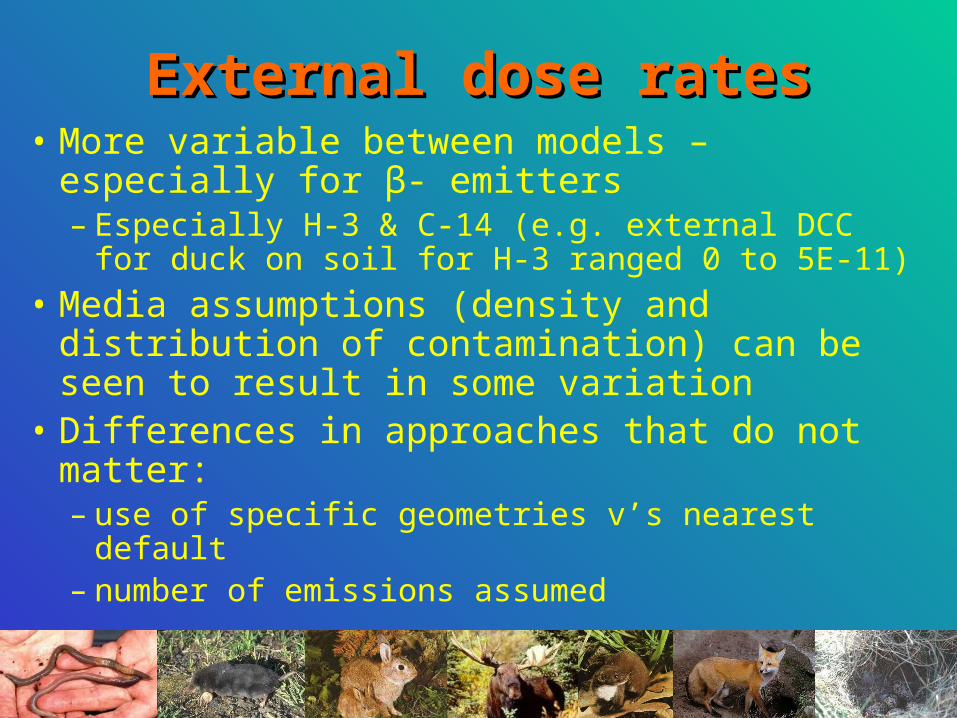
External dose ratesExternal dose rates• More variable between models – especially for β-
emitters– Especially H-3 & C-14 (e.g. external DCC for duck on
soil for H-3 ranged 0 to 5E-11)
• Media assumptions (density and distribution of contamination) can be seen to result in some variation
• Differences in approaches that do not matter:– use of specific geometries v’s nearest default– number of emissions assumed
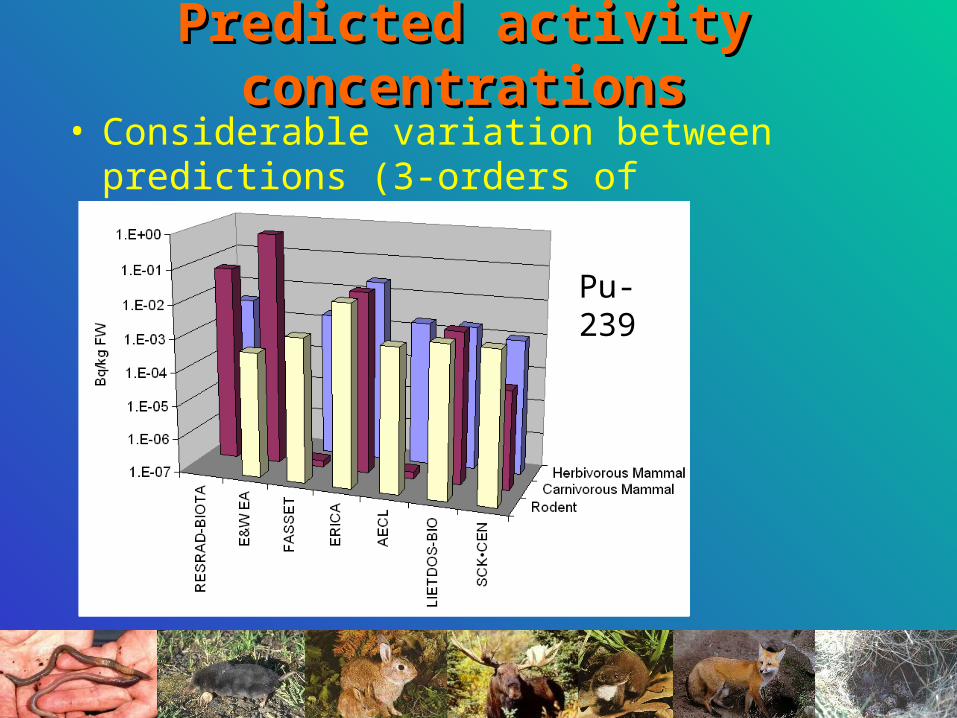
Predicted activity concentrationsPredicted activity concentrations• Considerable variation between predictions (3-
orders of magnitude being common)
Pu-239
Predicted activity concentrationsPredicted activity concentrations• Some variation can be understood, e.g.:
– Missing value guidance approach often give comparatively high estimates (often for little studied organisms)
– Site specific (and national) data– Some approaches include reindeer data in derivation
of CRs leading to high predictions for mammals (especially Po-210)
• Tc-99 predictions had least variation– Very few data and all using similar approach
FP6-036425FP6-036425PROTECT PROTECT
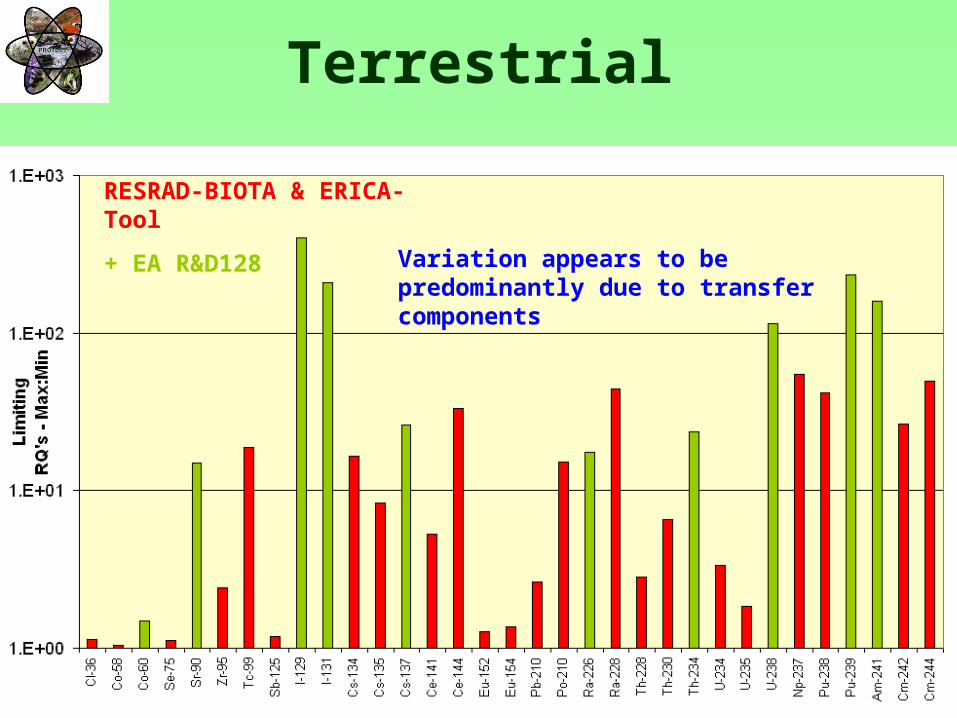
PROTECT WP2 comparison of screening Tier predictions
• Comparison of initial screening tier against the same screening level (for example USDOE values adopted)– Limiting RQs compared
FP6-036425FP6-036425PROTECT PROTECT
Terrestrial
RESRAD-BIOTA & ERICA-Tool
+ EA R&D128Variation appears to be predominantly due to transfer components
FP6-036425FP6-036425PROTECT PROTECT
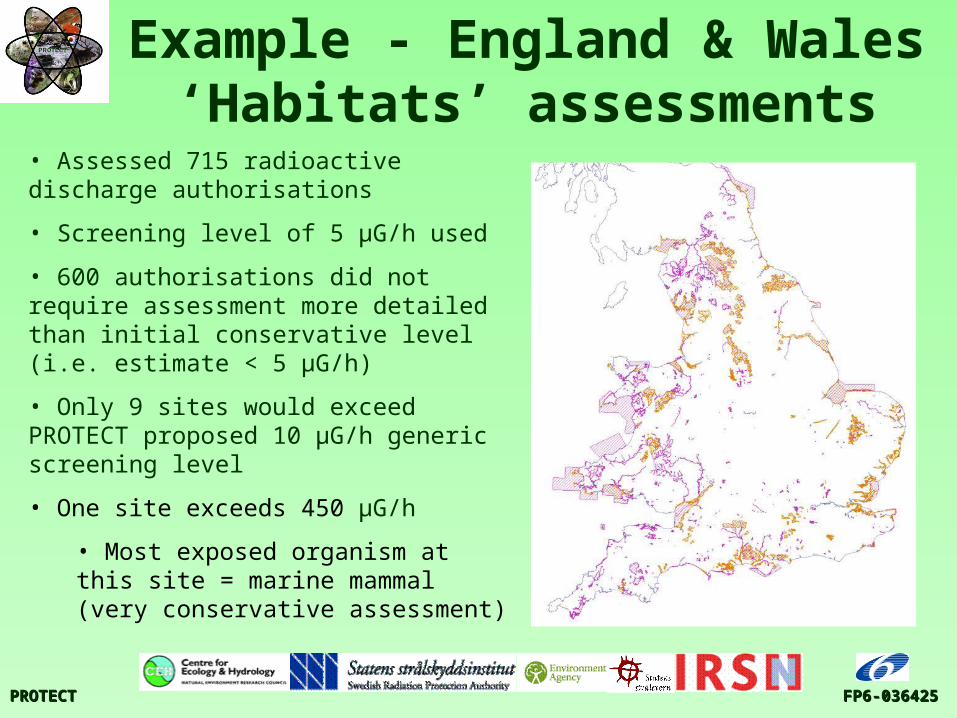
Example - England & Wales ‘Habitats’ assessments
• Assessed 715 radioactive discharge authorisations
• Screening level of 5 µG/h used
• 600 authorisations did not require assessment more detailed than initial conservative level (i.e. estimate < 5 µG/h)
• Only 9 sites would exceed PROTECT proposed 10 µG/h generic screening level
• One site exceeds 450 µG/h
• Most exposed organism at this site = marine mammal (very conservative assessment)
FP6-036425FP6-036425PROTECT PROTECT
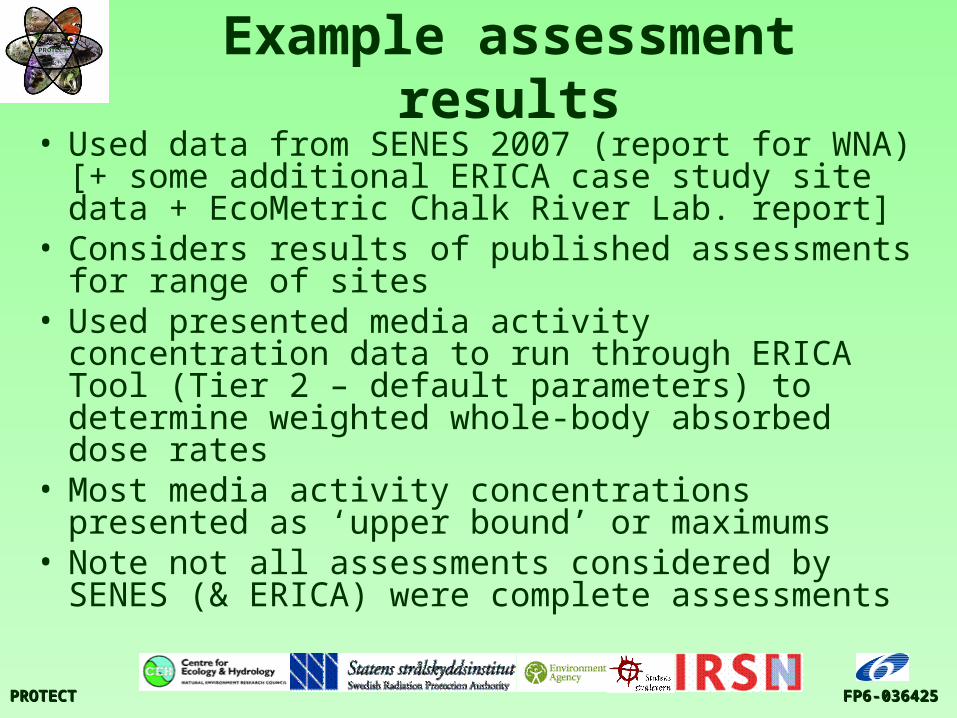
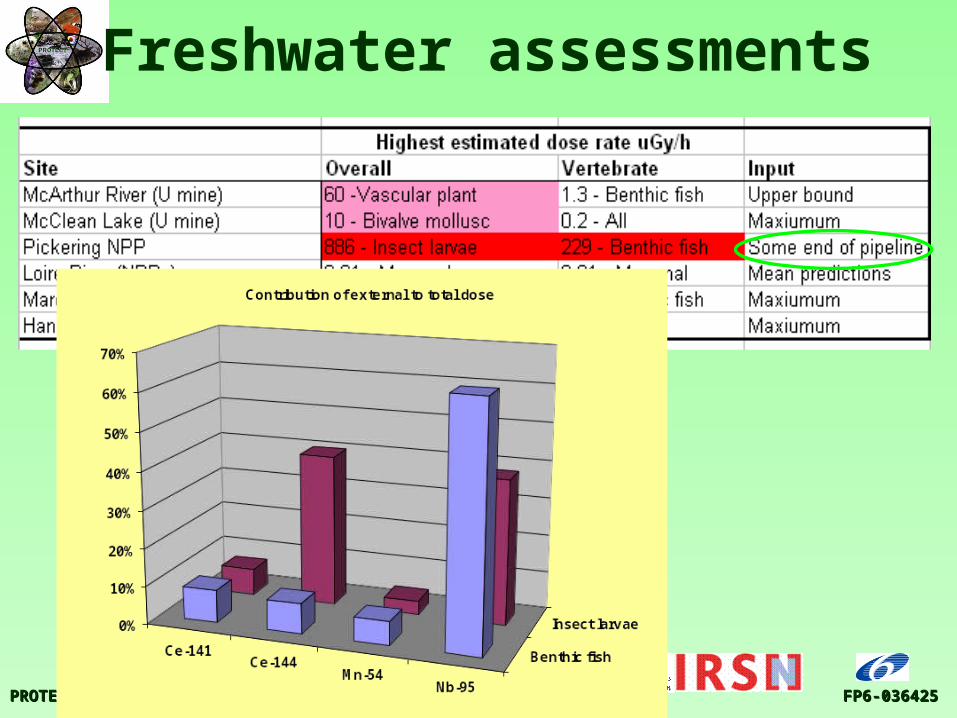
Example assessment results• Used data from SENES 2007 (report for WNA) [+
some additional ERICA case study site data + EcoMetric Chalk River Lab. report]
• Considers results of published assessments for range of sites
• Used presented media activity concentration data to run through ERICA Tool (Tier 2 – default parameters) to determine weighted whole-body absorbed dose rates
• Most media activity concentrations presented as ‘upper bound’ or maximums
• Note not all assessments considered by SENES (& ERICA) were complete assessments
FP6-036425FP6-036425PROTECT PROTECT
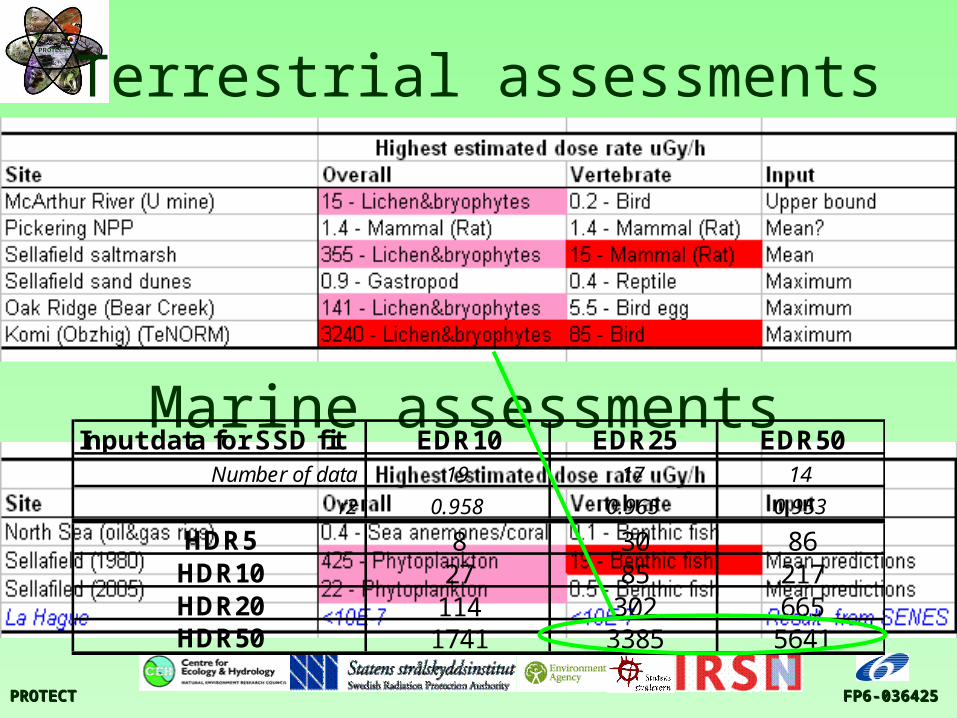
Terrestrial assessments
Marine assessmentsInput data for SSD fit EDR10 EDR25 EDR50
Number of data 19 17 14
r2 0.958 0.965 0.953
HDR5 8 30 86HDR10 27 85 217HDR20 114 302 665HDR50 1741 3385 5641
FP6-036425FP6-036425PROTECT PROTECT
Freshwater assessments
FP6-036425FP6-036425PROTECT PROTECT
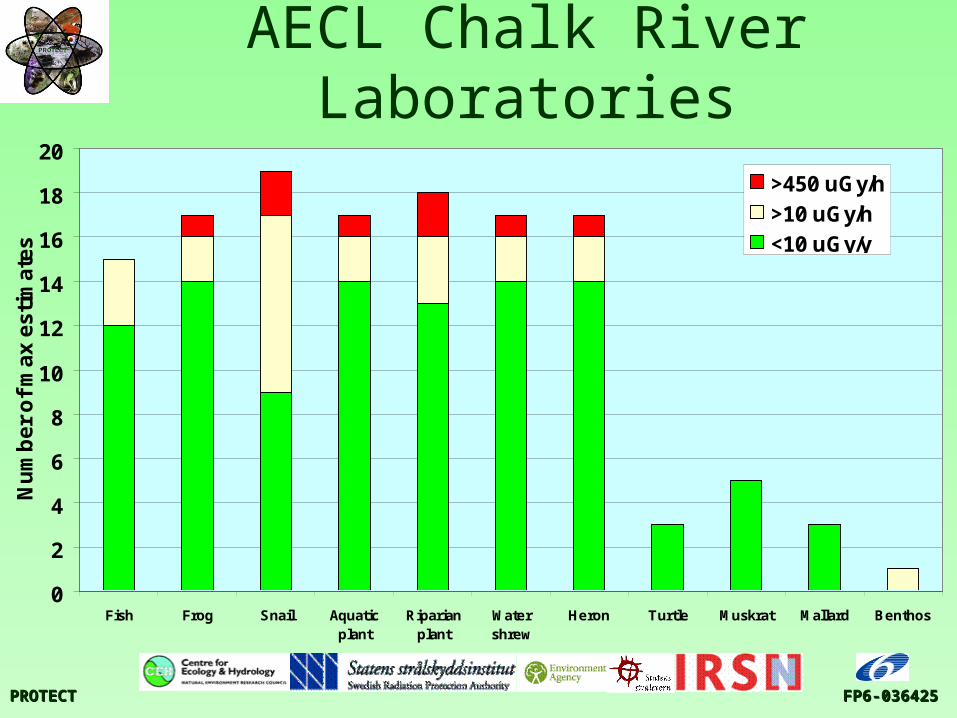
AECL Chalk River Laboratories
0
2
4
6
8
10
12
14
16
18
20
Fish Frog Snail Aquaticplant
Riparianplant
Watershrew
Heron Turtle Muskrat Mallard Benthos
Nu
mb
er
of
ma
x e
sti
ma
tes
>450 uGy/h
>10 uGy/h
<10 uGy/y
FP6-036425FP6-036425PROTECT PROTECT
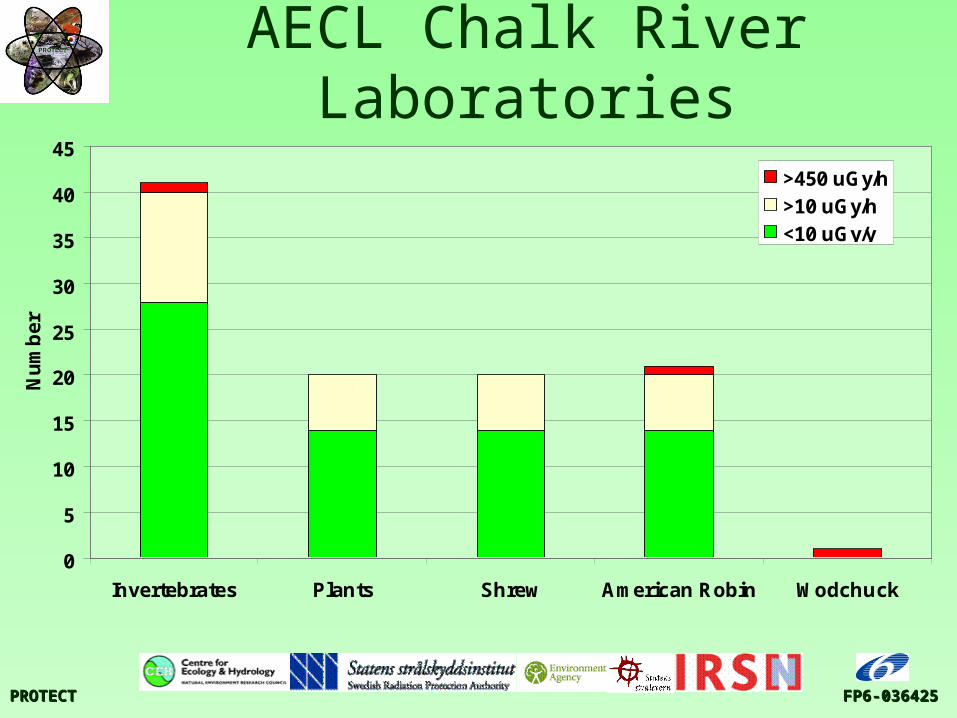
AECL Chalk River Laboratories
0
5
10
15
20
25
30
35
40
45
Invertebrates Plants Shrew American Robin Wodchuck
Nu
mb
er
>450 uGy/h>10 uGy/h<10 uGy/y
FP6-036425FP6-036425PROTECT PROTECT
Summary• Generic screening value (10 µGy/h) is likely
to identify sites of negligible risk (EA Habitats assessments)
• The ‘taxonomic’ screening level for ‘non-vertebrates’ (450 µGy/h) attempts to account for radiosensitivity – in example assessments appears to be fit for purpose– Identifying sites requiring more refined
assessment


![Let’s practice sound [ei] Let’s practice sound [ei] lake gate cake table.](https://static.fdocument.org/doc/165x107/56649ea95503460f94bad14b/lets-practice-sound-ei-lets-practice-sound-ei-lake-gate-cake-table.jpg)