Process optimization and characterization of carvedilol ... · within 15 min and enhanced...
9
132 Korean J. Chem. Eng., 32(1), 132-140 (2015) DOI: 10.1007/s11814-014-0192-2 INVITED REVIEW PAPER pISSN: 0256-1115 eISSN: 1975-7220 INVITED REVIEW PAPER † To whom correspondence should be addressed. E-mail: [email protected] Copyright by The Korean Institute of Chemical Engineers. Process optimization and characterization of carvedilol solid dispersion with hydroxypropyl-β-cyclodextrin and tartaric acid Yuvaraja K. † , Sanjoy Kumar Das, and Jasmina Khanam Department of Pharmaceutical Technology, Jadavpur University, Kolkata, West Bengal, India (Received 8 January 2014 • accepted 9 July 2014) Abstract-The present investigation concerns the experimental design in preparing a solid dispersion of ionized carvedilol with hydroxypropyl-β-cyclodextrin (HPβCD), tartaric acid (TA) by adopting ‘kneading technique’. Simplex lattice design has been chosen to develop model equations that correlate the process variables such as HPβCD (mg), TA (mg), and kneading time (min) with the response variables, such as solubility (mg/mL) and drug release (%) from the solid dispersion. Software-generated ANOVA results confirmed the sufficiency of model equations. Results pre- dicted by model equations are in good agreement with that of experimental results. Optimized formulation with vari- ables ‘CV: HPβCD: TA-kneading time’ (200 mg: 689.6 mg: 227.6 mg-45 min) showed complete drug release (~99%) within 15 min and enhanced solubility of 1.89 mg/mL. The instrumental analysis (DSC, XRD& FTIR) of the opti- mized solid dispersion suggests a transformation of crystallinity of drug to amorphous form, due to its complexation with HPβCD. Hence, this combination of drug and carriers suggests an improvement of carvedilol bioavailability. Keywords: Simplex Lattice Design, Ionized Carvedilol-hydroxypropyl-β-cyclodextrin-tartaric Acid Complex, Dissolu- tion Rate, Solubility INTRODUCTION With progressive research for the formulation development of a newer drug delivery system, it has become apparent to assess the effects of factors (independent variables) on the responses (depen- dent variables). Statistical process control and experimental design are two very powerful tools for improving and optimizing a pro- cess. Applying this technique to product development improves the yield, reduces variability, and reduces development time as well as the overall cost. It is necessary first to identify the controlling factors and desired responses [1]. Present investigation deals with the experimental design to find the best conditions for enhancing aqueous solubility of drug. Throughput screening of a new drug moiety incurs huge invest- ment, out of which many are discontinued because of poor bio- availability. One of the primary reasons for poor bioavailability is low aqueous solubility of drugs, which are categorized under Bio- pharmaceutical Classification System (BCS) class II [2]. Formula- tion scientists have been practicing many methods to enhance the solubility of sparingly soluble drugs by adopting many methods, such as pro-drugs [3], salt formation [4], and formulation meth- ods, such as particle size reduction [5], co-crystal formation [6], inclusion complexes using cyclodextrins [7] lipid formulations [8], and solid form changes, such as nanocrystals [9] and amorphous dispersions of API and polymers [10]. Of this, solid dispersion tech- nique is most extensively used [11]. In present work, we chose carvedilol as model drug. Carvedilol is a nonselective beta, α 1 -adreno receptor antagonist and vasodila- tor. It has 25-30% of oral bioavailability because of low aqueous solubility. Improving its aqueous solubility/dissolution by a suitable method may overcome the bioavailability problem. There are a few methods used to prepare a solid dispersion, out of which ‘knead- ing’ is the simplest one. The present study involves ionization of drug and its complexation with cyclodextrin in presence of hydroxyl acids. Ionization process is used to increase the apparent intrinsic solubility of drug in test medium. Hydroxyl acids (citric acid and tartaric acid) are changing the pH of microenvironment; this facil- itates drug solubility and dissolution rate, even at the high pH level, and enhances the complexation efficiency of cyclodextrins [12]. CDs have the ability to enhance solubility, chemical stability and bioavailability of poorly water soluble drugs [13]. Low complex- ation efficiency is major problem associated with cyclodextrins; so a large amount of CDs is required to solubilize a small amount of lipophilic drug. Nowadays, derivatives of cyclodextrins are found most effective [14]. Hydroxypropyl- β-cyclodextrin (HPβCD), which is a hydroxyl alkyl derivative of βCD, was developed and widely studied in the field of drug encapsulation because of its inclusion ability along with high water solubility [15]. To enhance solubility of drug, a method needs to be developed with an aim to produce solid dispersion with a minimum amount of the carrier. To analyze and optimize the process parameters it is necessary to understand their effects on the response variables. With the least number of experiments model equations are developed by the re- sponse surface methodology (RSM), which is an experimental design used for optimization. There are various designs such as central composite design; Box-Behnken design and Simplex design [16]. Generally, simplex designs are used to study the effects of mixture components on response variables. Two components and one im-
Transcript of Process optimization and characterization of carvedilol ... · within 15 min and enhanced...

132
Korean J. Chem. Eng., 32(1), 132-140 (2015)DOI: 10.1007/s11814-014-0192-2
INVITED REVIEW PAPER
pISSN: 0256-1115eISSN: 1975-7220
INVITED REVIEW PAPER
†To whom correspondence should be addressed.E-mail: [email protected] by The Korean Institute of Chemical Engineers.
Process optimization and characterization of carvedilol solid dispersionwith hydroxypropyl-β-cyclodextrin and tartaric acid
Yuvaraja K.†, Sanjoy Kumar Das, and Jasmina Khanam
Department of Pharmaceutical Technology, Jadavpur University, Kolkata, West Bengal, India(Received 8 January 2014 • accepted 9 July 2014)
Abstract−The present investigation concerns the experimental design in preparing a solid dispersion of ionizedcarvedilol with hydroxypropyl-β-cyclodextrin (HPβCD), tartaric acid (TA) by adopting ‘kneading technique’. Simplexlattice design has been chosen to develop model equations that correlate the process variables such as HPβCD (mg),TA (mg), and kneading time (min) with the response variables, such as solubility (mg/mL) and drug release (%) fromthe solid dispersion. Software-generated ANOVA results confirmed the sufficiency of model equations. Results pre-dicted by model equations are in good agreement with that of experimental results. Optimized formulation with vari-ables ‘CV: HPβCD: TA-kneading time’ (200 mg: 689.6 mg: 227.6 mg-45 min) showed complete drug release (~99%)within 15 min and enhanced solubility of 1.89 mg/mL. The instrumental analysis (DSC, XRD& FTIR) of the opti-mized solid dispersion suggests a transformation of crystallinity of drug to amorphous form, due to its complexationwith HPβCD. Hence, this combination of drug and carriers suggests an improvement of carvedilol bioavailability.
Keywords: Simplex Lattice Design, Ionized Carvedilol-hydroxypropyl-β-cyclodextrin-tartaric Acid Complex, Dissolu-tion Rate, Solubility
INTRODUCTION
With progressive research for the formulation development of anewer drug delivery system, it has become apparent to assess theeffects of factors (independent variables) on the responses (depen-dent variables). Statistical process control and experimental designare two very powerful tools for improving and optimizing a pro-cess. Applying this technique to product development improvesthe yield, reduces variability, and reduces development time as wellas the overall cost. It is necessary first to identify the controllingfactors and desired responses [1]. Present investigation deals withthe experimental design to find the best conditions for enhancingaqueous solubility of drug.
Throughput screening of a new drug moiety incurs huge invest-ment, out of which many are discontinued because of poor bio-availability. One of the primary reasons for poor bioavailability islow aqueous solubility of drugs, which are categorized under Bio-pharmaceutical Classification System (BCS) class II [2]. Formula-tion scientists have been practicing many methods to enhance thesolubility of sparingly soluble drugs by adopting many methods,such as pro-drugs [3], salt formation [4], and formulation meth-ods, such as particle size reduction [5], co-crystal formation [6],inclusion complexes using cyclodextrins [7] lipid formulations [8],and solid form changes, such as nanocrystals [9] and amorphousdispersions of API and polymers [10]. Of this, solid dispersion tech-nique is most extensively used [11].
In present work, we chose carvedilol as model drug. Carvedilol
is a nonselective beta, α1-adreno receptor antagonist and vasodila-tor. It has 25-30% of oral bioavailability because of low aqueoussolubility. Improving its aqueous solubility/dissolution by a suitablemethod may overcome the bioavailability problem. There are a fewmethods used to prepare a solid dispersion, out of which ‘knead-ing’ is the simplest one. The present study involves ionization ofdrug and its complexation with cyclodextrin in presence of hydroxylacids. Ionization process is used to increase the apparent intrinsicsolubility of drug in test medium. Hydroxyl acids (citric acid andtartaric acid) are changing the pH of microenvironment; this facil-itates drug solubility and dissolution rate, even at the high pH level,and enhances the complexation efficiency of cyclodextrins [12].
CDs have the ability to enhance solubility, chemical stability andbioavailability of poorly water soluble drugs [13]. Low complex-ation efficiency is major problem associated with cyclodextrins; soa large amount of CDs is required to solubilize a small amount oflipophilic drug. Nowadays, derivatives of cyclodextrins are foundmost effective [14]. Hydroxypropyl-β-cyclodextrin (HPβCD), whichis a hydroxyl alkyl derivative of βCD, was developed and widelystudied in the field of drug encapsulation because of its inclusionability along with high water solubility [15]. To enhance solubilityof drug, a method needs to be developed with an aim to producesolid dispersion with a minimum amount of the carrier.
To analyze and optimize the process parameters it is necessaryto understand their effects on the response variables. With the leastnumber of experiments model equations are developed by the re-sponse surface methodology (RSM), which is an experimental designused for optimization. There are various designs such as centralcomposite design; Box-Behnken design and Simplex design [16].Generally, simplex designs are used to study the effects of mixturecomponents on response variables. Two components and one im-
Process optimization and characterization of carvedilol solid dispersion with hydroxypropyl-β-cyclodextrin and tartaric acid 133
Korean J. Chem. Eng.(Vol. 32, No. 1)
portant process variable are chosen as variables in the present inves-tigation.
The objective of the present work is to optimize a method forpreparing the solid dispersion of carvedilol-HPβCD by Simplexlattice design, to check permeation of CV in a solid dispersion,and to carry out instrumental analysis of the product to check theinteraction of drug with cyclodextrin.
EXPERIMENTAL
1. MaterialsCarvedilol (CV) was provided by SUN Pharmaceutical Ltd., India
as a gift sample; Hydroxypropyl-β-cyclodextrin (HPβCD) was pro-vided by Roqutte Pharma, India as a gift sample. Tartaric acid (TA),and all other reagents and solvents used are of analytical grade.2. Simplex Lattice Design
Simplex lattice design was used to optimize the factor levels toachieve the desired response. In this design, three factors were eval-uated by changing their levels simultaneously. To gain indepth infor-mation of the experimental region and to evaluate the curvature,this study was conducted in a total of 14 experimental runs in accor-dance with three pure components (corners of the triangle) andthree two-component blends (mid-points of the edges). In addi-tion to these six mixtures, the software specified the three-compo-nent ‘centroid’ blend (one-third of each) and three check-blends,bringing the total of unique combinations to ten, of which four com-binations were suggested to be replicated to provide a measure ofpure error for estimating potential lack of fit. Interaction effectsamong the factors resolved by the design allow a mid-level valueas a combination of factors [17]. Simplex design is generally used
to study the effects of mixture components on response variables;in the present study, two factors were the composition of chemicals(HPBCD and TA) and the third one was a process variable (knead-ing period). The quadratic second-order model was fitted to thefollowing equation, Eq. (1).
Y=β1A+β2B+β3C+β12AB+β13AC+β23BC (1)
where, Y is the measured response (dependent variable) associatedwith each factor-level combination; responses (R1 and R2) expressedin terms of solubility (mg/mL) and drug release (%) in 5 min; β1,β2, β3, β12, β13 and β23 are the regression coefficients. Independentvariables studied were A, B, and C are HPβCD (mg), tartaric acid(mg) and kneading time (min) respectively. In Table1, levels of inde-pendent variables and design matrix and responses are shown. Re-sponses were experimental data obtained following the design matrix.The design matrix was developed by Design Expert Software trialVersion 7.0.0 (STAT-EASE Inc., Minneapolis, USA).3. Preparation of Ionized Carvedilol - HPβCD-TA TernaryComplex
To check the effect of ionization on solubility, an accurately weighedamount of (200 mg) of CV was taken in a mortar-pestle, and excessamount of acetic acid was added to it. The mixture was groundthoroughly and kneaded up to 45 min. The paste was dried at roomtemperature overnight and then solid mass was dried at 88 oC undervacuum up to 72 h [12]. The dried mass was pulverized and sievedthrough a 120 mesh sieve. It was then stored in desiccators at 25 oCuntil further use. The dry powder containing ionized drug (200 mg)was used to prepare solid dispersions with a specified amount ofHPβCD-TA as per the experimental design showed in Table 1. Thismixture was moistened with a small volume of ethanol-water solu-
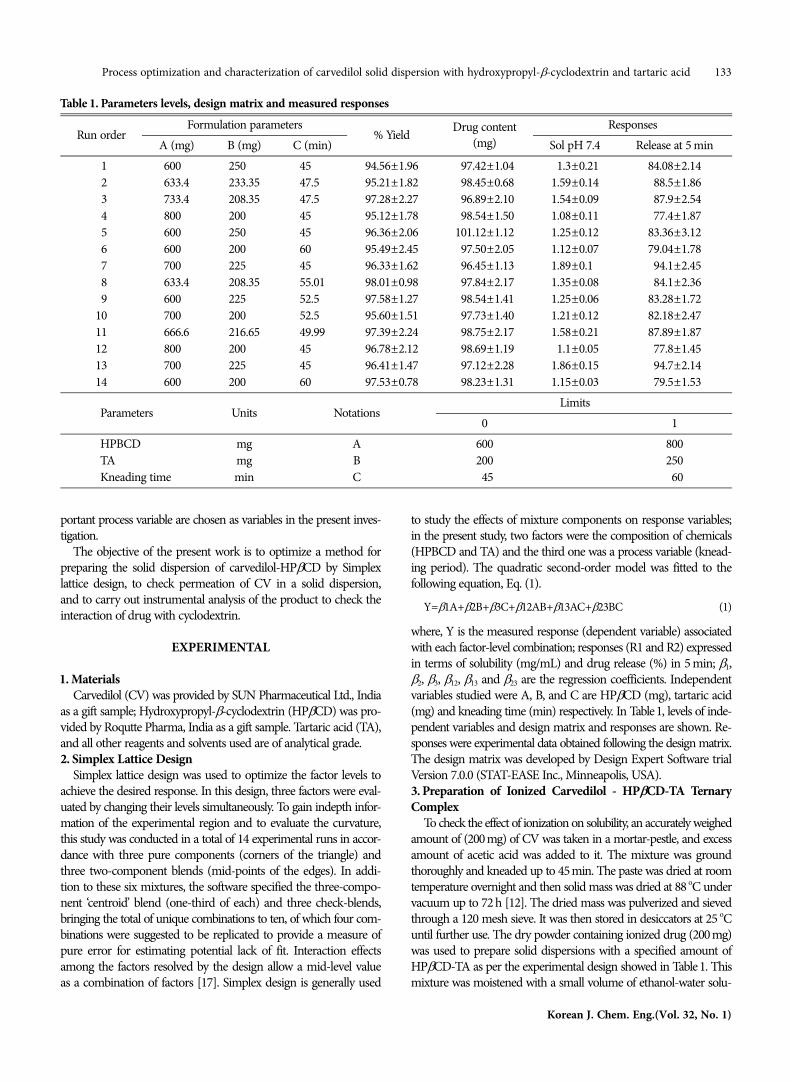
Table 1. Parameters levels, design matrix and measured responses
Run orderFormulation parameters
% Yield Drug content(mg)
ResponsesA (mg) B (mg) C (min) Sol pH 7.4 Release at 5 min
01 600.0 250.00 45.00 94.56±1.96 097.42±1.04 01.3±0.21 84.08±2.1402 633.4 233.35 47.50 95.21±1.82 098.45±0.68 1.59±0.14 088.5±1.8603 733.4 208.35 47.50 97.28±2.27 096.89±2.10 1.54±0.09 087.9±2.5404 800.0 200.00 45.00 95.12±1.78 098.54±1.50 1.08±0.11 077.4±1.8705 600.0 250.00 45.00 96.36±2.06 101.12±1.12 1.25±0.12 83.36±3.1206 600.0 200.00 60.00 95.49±2.45 097.50±2.05 1.12±0.07 79.04±1.7807 700.0 225.00 45.00 96.33±1.62 096.45±1.13 1.89±0.10 094.1±2.4508 633.4 208.35 55.01 98.01±0.98 097.84±2.17 1.35±0.08 084.1±2.3609 600.0 225.00 52.50 97.58±1.27 098.54±1.41 1.25±0.06 83.28±1.7210 700.0 200.00 52.50 95.60±1.51 097.73±1.40 1.21±0.12 82.18±2.4711 666.6 216.65 49.99 97.39±2.24 098.75±2.17 1.58±0.21 87.89±1.8712 800.0 200.00 45.00 96.78±2.12 098.69±1.19 01.1±0.05 077.8±1.4513 700.0 225.00 45.00 96.41±1.47 097.12±2.28 1.86±0.15 094.7±2.1414 600.0 200.00 60.00 97.53±0.78 098.23±1.31 1.15±0.03 079.5±1.53
Parameters Units NotationsLimits
0 1HPBCD mg A 600 800TA mg B 200 250Kneading time min C 045 060

134 Y. K. et al.
January, 2015
tion (15 : 85 v/v) [18]. The mixture was ground thoroughly in amortar-pestle, and kneaded to a pasty mass by the addition of sol-vent drop wise up to the time as mention in Table 1. The paste wasdried at room temperature overnight. The dried mass was pulver-ized and sieved through a 120 mesh sieve. It was then stored indesiccators at 25 oC for further use.4. Determination of Yield (%) and Drug Content (%)
Prepared solid dispersion (drug-carrier complex) was collectedand weighed accurately and the yield (%) of solid dispersion wascalculated by the following, Eq. (2).
(2)
A sample of 10 mg of CV solid dispersion was weighed and dis-solved in 5 ml of methanol and diluted up to 95 ml with doubledistilled water in a volumetric flask and then necessary dilutionwas made. The content of drug was determined by UV Spectro-photometric method.5. Determination of Saturation Solubility
To determine saturation solubility, an excess amount of samplewas added to 10 mL of phosphate buffer (pH 7.4). The volumet-ric flasks fitted with glass stoppers were placed in a water bath at aconstant temperature of 37±0.5 oC and shaken for 24 h to attainequilibrium. Next, the content of the vessel was centrifuged. Thesupernatant solutions were filtered through a Whatman filter paper(pore size 11µm) and then suitably diluted. Absorbance was re-corded at 241nm by UV-spectrophotometer (Analab UV-180, India).Each test was repeated three times.6. In Vitro Dissolution Studies
Dissolution studies of prepared samples were performed using aUSP type II (TDT 06P Electro lab, India) dissolution test apparatus.Accurately weighed pure drug and SD (20 mg equivalent amountof CV) was placed in a dissolution paddle containing 900 mL ofphosphate buffer (pH 7.4), which was fixed at 37±0.5 oC and stir-ring speed of 50 rpm. Samples were collected periodically from dis-solution medium, and same quantity of fresh medium was replacedafter each withdrawal. Each withdrawal sample was filtered throughWhatman filter paper (pore size 11µm), and its concentration wasdetermined by UV Spectrophotometric method. Each test was re-peated three times.
The response variable’s data (solubility and dissolution) were sub-jected to statistical analysis and significant models along with re-sponse surfaces were obtained. The models were validated by check-point formulations and % error was calculated.7. Ex Vivo Absorption Study in a Goat-intestine Segment
Ex vivo absorption study was carried out to compare the per-meation rate of CV-solid dispersion with that of pure drug. Thisstudy was performed following the method of Karasov and Dia-mond [19]. Small intestine of already slaughtered male goat wascollected from the local market. An intestinal segment (6 cm length,0.75 cm inner diameter of lumen) was cut and washed thoroughlywith warm Krebs-Ringer phosphate buffer (KRPB) solution [20].After tying up one end of this segment, the inner cavity of sac/lumenwas filled with a solution of phosphate buffer (pH 7.4) containingsolid dispersion (20 mg equivalent amount of CV). The other endwas closed. The two ends of the sac were then fixed between the
two ends of a “disintegration tester” and immersed in 900 mL solu-tion (PB pH 7.4, 37±0.5 oC, 75 rpm) kept in the basket. Drug waspermeated through the mucosal layer from mucosal compartmentto the outside medium (serosal compartment). Samples were with-drawn from serosal compartment at preselected time intervals of15min and fresh medium was replaced after each withdrawal. With-drawn samples were analyzed by UV spectrophotometer at 241 nm.After several hours (5 h for pure CV and 2.5 h for optimized for-mulation) the segment was removed from the medium and theliquid remaining in the intestinal sac was collected from one endof the segment. The whole intestinal segment was triturated withthe help of mortar and pestle and then homogenized in phosphatebuffer pH 7.4. Thus, drug that remained in the liquid of intestinalsac and mucosal layer was determined to check the mass balanceof CV. The whole experiment was repeated in triplicate (n=3) usingthe fresh medium as well as fresh intestinal segment each time.8. Solid-state Characterizations of Optimized Solid Dispersionby Instrumental Analysis (FTIR, XRD, DSC)
These analyses give support to detect any type of interactionbetween drug and carriers.
Fourier transform infrared (FTIR) spectroscopy of solid disper-sions samples was performed using Shimadzu Co., Kyoto, Japancombined with Quick Snap sampling modules by the KBr disc methodover wave number range of 4,000-400 cm−1. Pure polymer, drug(CV), and drug/polymer physical mixtures were run as controls.10 mg of sample was taken for this study.
XRD study was conducted on the samples (pure drug, pure car-rier substances and selected formulation) to check its crystallinecharacteristics using a Rigaku Miniflex diffractometer (Rigaku Co.,Ltd., Japan) with a Kb filter, Cu radiation, a voltage of 30 kV and a15 mA current. Each sample (25 mg) in the X-ray holder was con-tinuously spun and scanned at a rate of 1o/min over a 2 θ range of10-70o, and the results were processed by a pre-loaded computerprogram.
DSC measurements were performed on samples by using a dif-ferential scanning calorimeter (Pyris diamond TG/DTA; P, Per-kins Elmer Instruments) with a thermal analyzer. Under nitrogenflow of 150mL/min, approximately 5.83mg of CV, carrier substancesand SDs with respective carriers were placed in a sealed aluminumpan, and heated at a scanning rate of 10 oC/min over the tempera-ture range of 30o to 300 oC.
RESULTS AND DISCUSSION
1. Development of Mathematical ModelsFrom the trial batch investigation, we observed that solid dis-
persion with the following combinations (ionized CV: HPβCD :TA - 200 : 600 : 150) shows better solubility and dissolution rate.Thus, we considered further to optimize the processing variablesin the application of multivariate analysis. The solid dispersionswere prepared using kneading method according to the design matrixas shown in Table 1. The amount of HPβCD (mg), tartaric acid(mg) and kneading time (min) were selected as independent vari-ables; solubility (mg/mL) and drug release (%) in 5min were selectedas dependent variables. Response data (Table 1) were fitted in exper-imental design and analyzed by DOE software, design expert v7.
Yield %( ) =
weight of soliddispersionTotal weight of carrierand drug--------------------------------------------------------------------------- 100×
Process optimization and characterization of carvedilol solid dispersion with hydroxypropyl-β-cyclodextrin and tartaric acid 135
Korean J. Chem. Eng.(Vol. 32, No. 1)
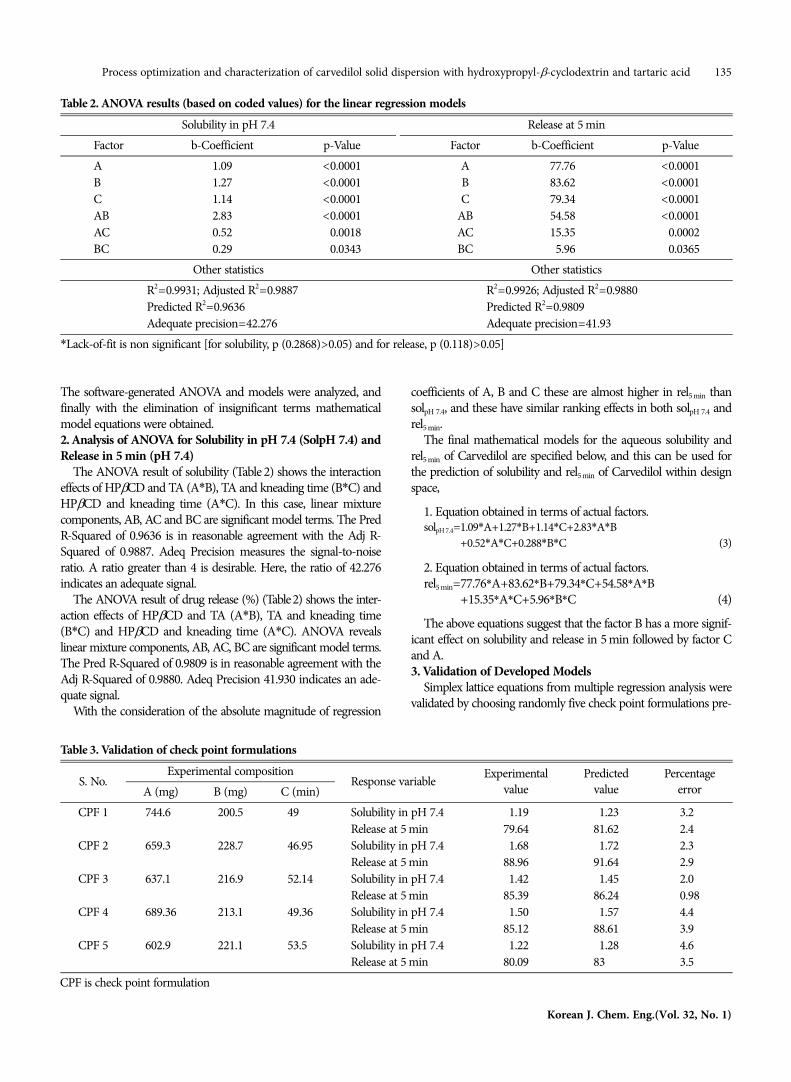
The software-generated ANOVA and models were analyzed, andfinally with the elimination of insignificant terms mathematicalmodel equations were obtained.2. Analysis of ANOVA for Solubility in pH 7.4 (SolpH 7.4) andRelease in 5 min (pH 7.4)
The ANOVA result of solubility (Table 2) shows the interactioneffects of HPβCD and TA (A*B), TA and kneading time (B*C) andHPβCD and kneading time (A*C). In this case, linear mixturecomponents, AB, AC and BC are significant model terms. The PredR-Squared of 0.9636 is in reasonable agreement with the Adj R-Squared of 0.9887. Adeq Precision measures the signal-to-noiseratio. A ratio greater than 4 is desirable. Here, the ratio of 42.276indicates an adequate signal.
The ANOVA result of drug release (%) (Table2) shows the inter-action effects of HPβCD and TA (A*B), TA and kneading time(B*C) and HPβCD and kneading time (A*C). ANOVA revealslinear mixture components, AB, AC, BC are significant model terms.The Pred R-Squared of 0.9809 is in reasonable agreement with theAdj R-Squared of 0.9880. Adeq Precision 41.930 indicates an ade-quate signal.
With the consideration of the absolute magnitude of regression
coefficients of A, B and C these are almost higher in rel5 min thansolpH 7.4, and these have similar ranking effects in both solpH 7.4 andrel5 min.
The final mathematical models for the aqueous solubility andrel5 min of Carvedilol are specified below, and this can be used forthe prediction of solubility and rel5 min of Carvedilol within designspace,
1. Equation obtained in terms of actual factors.solpH 7.4=1.09*A+1.27*B+1.14*C+2.83*A*BsolpH 7.4=+0.52*A*C+0.288*B*C (3)
2. Equation obtained in terms of actual factors.rel5 min=77.76*A+83.62*B+79.34*C+54.58*A*Brel5 min=+15.35*A*C+5.96*B*C (4)
The above equations suggest that the factor B has a more signif-icant effect on solubility and release in 5 min followed by factor Cand A.3. Validation of Developed Models
Simplex lattice equations from multiple regression analysis werevalidated by choosing randomly five check point formulations pre-
Table 2. ANOVA results (based on coded values) for the linear regression modelsSolubility in pH 7.4 Release at 5 min
Factor b-Coefficient p-Value Factor b-Coefficient p-ValueA 1.09 <0.0001 A 77.76 <0.0001B 1.27 <0.0001 B 83.62 <0.0001C 1.14 <0.0001 C 79.34 <0.0001AB 2.83 <0.0001 AB 54.58 <0.0001AC 0.52 <0.0018 AC 15.35 <0.0002BC 0.29 <0.0343 BC 05.96 <0.0365
Other statistics Other statisticsR2=0.9931; Adjusted R2=0.9887 R2=0.9926; Adjusted R2=0.9880Predicted R2=0.9636 Predicted R2=0.9809Adequate precision=42.276 Adequate precision=41.93
*Lack-of-fit is non significant [for solubility, p (0.2868)>0.05) and for release, p (0.118)>0.05]
Table 3. Validation of check point formulations
S. No.Experimental composition
Response variable Experimentalvalue
Predictedvalue
PercentageerrorA (mg) B (mg) C (min)
CPF 1 744.60 200.5 49.00 Solubility in pH 7.4 01.19 01.23 3.20Release at 5 min 79.64 81.62 2.40
CPF 2 659.30 228.7 46.95 Solubility in pH 7.4 01.68 01.72 2.30Release at 5 min 88.96 91.64 2.90
CPF 3 637.10 216.9 52.14 Solubility in pH 7.4 01.42 01.45 2.00Release at 5 min 85.39 86.24 0.98
CPF 4 689.36 213.1 49.36 Solubility in pH 7.4 01.50 01.57 4.40Release at 5 min 85.12 88.61 3.90
CPF 5 602.90 221.1 53.50 Solubility in pH 7.4 01.22 01.28 4.60Release at 5 min 80.09 83.00 3.50
CPF is check point formulation

136 Y. K. et al.
January, 2015
pared with the same conditions within the experimental ranges.For each response, the average of three experimental data is pre-sented as the actual result. The percentage error/deviation betweenan actual result of these checkpoint formulations and respectivepredicted values are presented in Table 3. Release profiles of vari-ous solid dispersions as per design matrix and check point formu-lations are depicted in Fig. 1.
Low percentage error between the actual and the predicted val-ues was observed, indicating that the developed models could yielda precise result.4. Effect of Process Parameters on the Responses
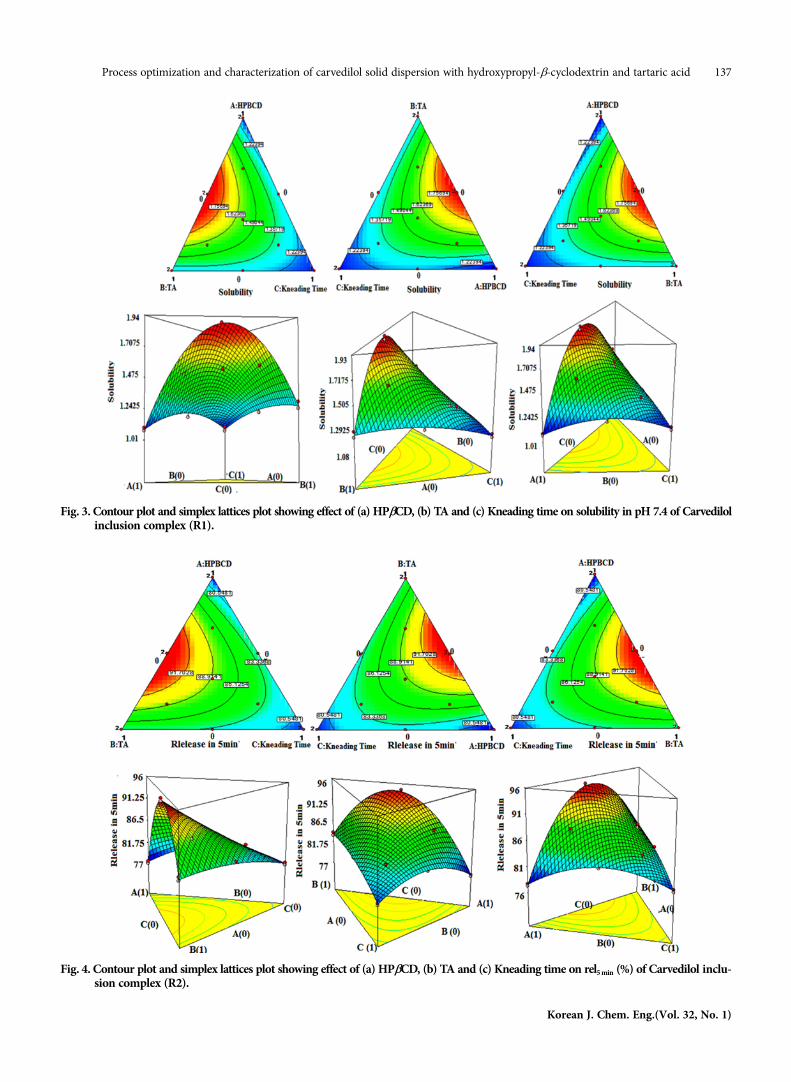
A perturbation plot (Fig. 2) depicts the effect of all the factors atthe center point in the design space. The result indicates that thesolubility and dissolution of carvedilol increase with increase inconcentration of HPβCD until reaching its center value. The solu-bility then starts to decrease as HPβCD concentration increasesbeyond the center limit, and this can be attributed to the forma-tion of insoluble complex at higher HPβCD concentration; knead-ing did not show any effect on solubility and dissolution rate. Incase of TA, it showed a linear increment in both the responses.
The solubility and dissolution of carvedilol solid dispersion wasinvestigated in pH 7.4 phosphate buffer. Figs. 3 and 4 illustrate the
effect of process parameters on solubility and dissolution rate; thereport clearly shows that TA had a prominent effect on the solubil-ity and dissolution rate of drug than HPβCD and kneading time,because TA creates an acidic environment around the drug mole-cule, which facilitates better solubility of drug even at a high pH(7.4) and enhances the complexation efficiency of cyclodextrin[21]. Increasing the kneading did not show any effect on solubil-ity and dissolution rate.
Increasing the concentration of cyclodextrin, drug solubility wasenhanced up to a certain extent; after that it deviated negatively.Since high concentration of cyclodextrin increased viscosity, it causeda low rate of dissolution and solubility of drug in the intra-parti-cles zone [22].5. Optimization by Desirability Function
An optimized solid dispersion was made by choosing the maxi-mum response, which was based on the constraints of the phys-iochemical parameters.
Upon analyzing various response variables and comprehensiveevaluation of the feasibility of search and exhaustive grid search,the formulation composition of carvedilol=200 mg; HPβCD=689.6mg; TA=227.6 mg; kneading time=45 min (Table 4) was found tofulfill the requisites of an optimum formulation. The optimized for-
Fig. 1. Dissolution profiles of carvedilol inclusion complex prepared as per the experimental design.
Fig. 2. Perturbation plot showing the effect of all factors on (a) solubility and (b) release in 5 min.
Process optimization and characterization of carvedilol solid dispersion with hydroxypropyl-β-cyclodextrin and tartaric acid 137
Korean J. Chem. Eng.(Vol. 32, No. 1)
Fig. 3. Contour plot and simplex lattices plot showing effect of (a) HPβCD, (b) TA and (c) Kneading time on solubility in pH 7.4 of Carvedilolinclusion complex (R1).
Fig. 4. Contour plot and simplex lattices plot showing effect of (a) HPβCD, (b) TA and (c) Kneading time on rel5 min (%) of Carvedilol inclu-sion complex (R2).

138 Y. K. et al.
January, 2015
mulation has an aqueous solubility of 1.89 mg/mL and release at 5min of 94.49%, which was very high when compared with pure drugsolubility (0.0301 mg/mL) and in vitro release % at 5 min (3.29%).6. Ex Vivo Absorption Study in a Goat-intestine Segment
The extent of in vivo absorption can be predicted on the basisof permeability and solubility of drug [23]. Intestine of a slaugh-tered animal was used to perform ex-vivo absorption study, whichis less expensive, fast and is not subjected to permission from Ani-mals Ethical Committee. It was observed that 86.57% drug from asolid dispersion was permeated into the serosal compartment throughthe intestinal membrane in 2.50 h study; some amount of CV re-mained in the liquid of mucosal compartment (11-12%) and lesseramount was absorbed within the intestinal mucosal membrane(1.71%). Results of the optimized formulation and pure drug areshown in Fig.4. In mass balance calculation, ~99% of CV was foundaccountable (Table 5). We observed that 72.45% of pure drug per-meated into the serosal compartment, 21.47% remained within theintestinal mucosal compartment, and 5.78% remained within a muco-sal membrane. In mass balance calculation, 99-100% of CV wasfound accountable; permeability coefficient of drug in a solid dis-persion and pure drug is presented in Table 5. Results of optimizedformulation and pure drug are shown in Fig. 5; it indicated thatcarvedilol in solid dispersion form showed more permeability thanthat of pure drug.7. FTIR Spectroscopic Analysis
The solid-state interaction between the carrier and drug can beexplained by FTIR spectroscopy. The pure carvedilol, carriers andtheir solid dispersion are characterized in Fig. 6.
The FTIR spectrum (Fig. 6(a)) of CV exhibits characteristic peaksat 3,344 cm−1 corresponding to the N-H stretching vibration of thesecondary amine, three intense absorption bands 2,922, and 2,835.3cm−1 corresponding to C-H aliphatic stretching, and 1,101cm−1 cor-responding to C-O stretching. In addition other sharp bands appearat 1,500-1,400 cm−1 (C-C aromatic stretching) and 1,255 cm−1 (C-N
stretching) [24]. In Fig. 6(b) the ionized CV spectrum shows thesame type of characteristic peak; it indicates no changes occurredwith carvedilol after ionization.
The FTIR spectrum of TA (Fig.6(c)) clearly exhibits bands around3,399 cm−1, 3,330 cm−1, 1,713 cm−1 and 937 cm−1, corresponding tothe O-H stretching, C=O stretching due to carboxylic acid groupand O-H bending, respectively.
The spectrum of HPβCD (Fig. 6(d)) shows prominent absorp-tion bands at 3,385 cm−1 (O-H stretching vibrations), 2,929 cm−1
(C-H stretching vibrations), 1,641 cm−1 (C-C stretching vibration -aromatic ring) and 1,159, 1,032 cm−1 (C-H, C-O stretching vibra-tion) [25].
In a physical mixture (Fig. 6(e)) (CV: HPβCD: TA), functionalgroups of CV were dominantly exposed, though its intensity was
Table 4. The criterion for numerical optimizationParameter Goal Lower limit Upper limit Lower weight Upper weight ImportanceHPβCD Is in range 0 1 1 1 3TA Is in range 0 1 1 1 3Kneading time Is in range 0 1 1 1 3R1-Sol (mg/mL) Maximize 1.08 1.89 1 1 3R2-Rel at 5 (min) Maximize 77.4 94.7 1 1 3
Batch optimized formulationNumber A-HPβCD (mg) B-TA (mg) C-Kneading time (min) R1-Sol (mg/mL) R2-Rels at 5 (min) Desirability
1 689.6 227.6 45 1.89 94.49 0.994
Table 5. Study of mass balance of pure carvedilol and optimized formulation in ex vivo absorption experiment
Formulation% of Drug in pH 7.4
Serosalcompartment
Mucosalcompartment
Intestinalmembrane
Total recoveryof CV
Permeation coefficient(µg/cm2/h)
Pure Carvedilol 72.45±1.46 21.47± 5.78±0.67 99.70 194.08Optimized formulation 86.57±1.82 11.23± 1.71±0.73 99.51 460.78
Fig. 5. Permeation study of carvedilol and optimized formulationin pH 7.4.
Process optimization and characterization of carvedilol solid dispersion with hydroxypropyl-β-cyclodextrin and tartaric acid 139
Korean J. Chem. Eng.(Vol. 32, No. 1)
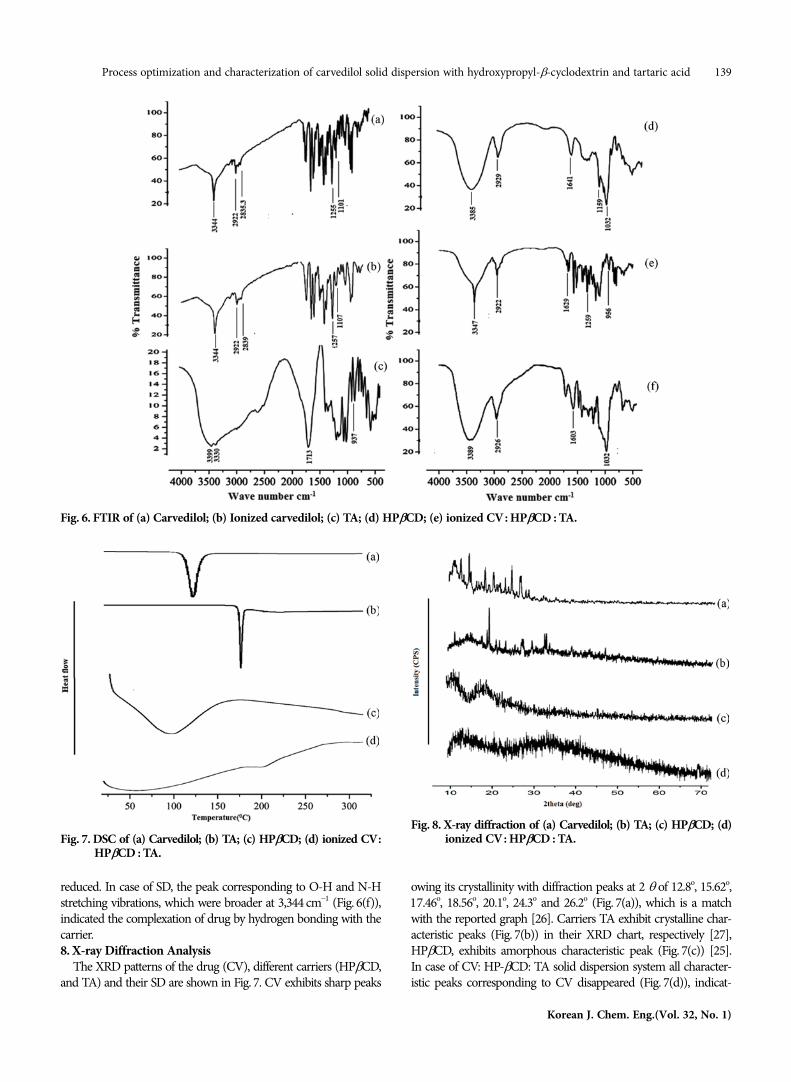
reduced. In case of SD, the peak corresponding to O-H and N-Hstretching vibrations, which were broader at 3,344 cm−1 (Fig. 6(f)),indicated the complexation of drug by hydrogen bonding with thecarrier.8. X-ray Diffraction Analysis
The XRD patterns of the drug (CV), different carriers (HPβCD,and TA) and their SD are shown in Fig. 7. CV exhibits sharp peaks
owing its crystallinity with diffraction peaks at 2 θ of 12.8o, 15.62o,17.46o, 18.56o, 20.1o, 24.3o and 26.2o (Fig. 7(a)), which is a matchwith the reported graph [26]. Carriers TA exhibit crystalline char-acteristic peaks (Fig. 7(b)) in their XRD chart, respectively [27],HPβCD, exhibits amorphous characteristic peak (Fig. 7(c)) [25].In case of CV: HP-βCD: TA solid dispersion system all character-istic peaks corresponding to CV disappeared (Fig. 7(d)), indicat-
Fig. 6. FTIR of (a) Carvedilol; (b) Ionized carvedilol; (c) TA; (d) HPβCD; (e) ionized CV: HPβCD : TA.
Fig. 7. DSC of (a) Carvedilol; (b) TA; (c) HPβCD; (d) ionized CV:HPβCD : TA.
Fig. 8. X-ray diffraction of (a) Carvedilol; (b) TA; (c) HPβCD; (d)ionized CV: HPβCD : TA.

140 Y. K. et al.
January, 2015
ing that CV was complexed with carrier to some extent.9. Differential Scanning Calorimetric Analysis
The DSC curves in Fig. 8 reveal the solid-state interaction of CVwith the carrier’s HPbCD and TA. The thermogram of CV andTA exhibits sharp endothermic peak at 118 oC and 172 oC, respec-tively (Fig. 8(a), (b)), owing to its melting point, which complieswith that of reported data [28]. The physicochemical propertiessuch as melting, boiling or sublimation points generally shift to adifferent temperature or disappear within the temperature rangewhen pure molecules interact with other substances.
In Fig. 8(c) HPbCD shows a very broad endothermic peak at92 oC, which could be attributed to the release of water moleculesfrom the hydrophilic cavity [25].
DSC thermograms of solid dispersion systems, (CV: HPβCD :TA) (Fig. 8(d)) reveal the disappearance of endothermic peak ofCV. It might be due to its homogeneous dispersion within the car-rier and amorphization, and it suggests the formation of an inclu-sion complex. Many investigators reported earlier on the disap-pearance of melting peak of crystalline drug in solid dispersion asevidenced in its thermogram.
CONCLUSION
We investigated the effects of process variables (i.e., an amountof HPβCD (A), TA (B), and kneading time (C)) on solubility anddissolution rate of carvedilol in pH 7.4 using simplex lattice design.Results of multiple regression analysis indicated that an intermedi-ate level of A, high level of B and low level of C make an optimizedsolid dispersion product (CV-200, HPβCD-689.6, TA-227.6, knead-ing time - 45), which shows enhanced solubility and in vitro disso-lution rate. Solubility enhancement factor of optimized formulationwith respect to that of pure drug was found as 63 times higher. Op-timized formulation was more permeable than that of pure drugthrough goat intestinal membrane.
ACKNOWLEDGEMENTS
The authors express gratitude to M/s. Sun Pharmaceutical Ltd.,India and M/s. Roquette Pharmaceutical Ltd., Mumbai, India, fortheir generous gifts of carvedilol and cyclodextrins respectively.The authors are thankful to the Department of PharmaceuticalTechnology, Jadavpur University, Kolkata, India for providing theinfra structural facilities.
NOMENCLATURE
CV : carvedilolβCD :β-cyclodextrin HPβCD : hydroxypropyl-β-cyclodextrinPVP K-30 : polyvinyl pyrrolidone K-30PLX-407 : poloxamer-407TA : tartaric acidCD : cyclodextrinmin : minutesFTIR : fourier transform infrared
DSC : differential scanning calorimetricXRD : powder X-ray diffractionKBr : potassium bromidecu : copper
REFERENCES
1. R. C. Nagarwal, A. Srinatha and J. K. Pandit, AAPS PharmSciTech.,10, 977 (2009).
2. D. T. Friesen, M. Crew, W. J. Curatolo, J. A. S. Nightingale, R.Shanker and D. T. Smithey, Mol. Pharm., 5, 1003 (2008).
3. V. J. Stella and K. W. N. Addae, Adv. Drug Deliv. Rev., 59, 677(2007).
4. A. T. M. Serajuddin, Adv. Drug Deliv. Rev., 59, 603 (2007).5. H. G. Brittain, J. Pharm. Sci., 91, 1573 (2002).6. M. Li, A. Davies, N. Malek, N. Qiao, W. Schlindwein and G. Trap-
pitt, Int. J. Pharm., 419, 1 (2011).7. T. Loftsson, C. Amiel, P. Jansook, K. L. Larsen, M. Messner, M. D.
Moya-Ortega, T. T. Nielsen, H. H. Sigurdsson and V. Wintgens, J.Inclus. Phenom. Macro. Chem., 69, 377 (2011).
8. M. A. Rahman, R. Harwansh, A. Hussain, S. Hussain and M. A.Mirza, Curr. Drug Deliv., 8, 330 (2011).
9. C. M. Keck, S. Gohla and R. H. Muller, Eur. J. Pharm. Biopharm.,78, 1 (2011).
10. J. K. Lee, K. B. Kim and M. H. Lee, Intermetallics, 18, 2019 (2010).11. A. T. M. Serajuddin, J. Pharm. Sci., 10, 1058 (1999).12. T. Loftsson, M. Masson, N. Schipper and H. H. Sigurdsson, Phar-
mazie, 59, 25 (2004).13. M. P. Buera, P. A. P. Cevallos and B. E. Elizalde, J. Food Eng., 99, 70
(2010).14. D. Duchene and D. Wouessidjewe, Drug Dev. Ind. Pharm., 16, 2487
(1990).15. W. Misiuk and M. Zalewska, Carbohydr. Polym., 77, 482 (2009).16. G. A. Lewis, D. Mathieu and R. P. T. Luu, Pharmaceutical experi-
mental design, CRC Press, New York.17. James Goodnight., JMP 10 Design of Experiments Guide, SAS
Publishing, Cary, 177 (2012).18. V. Pokharkar, S. Dhar, A. Khanna, L. Mandpe and V. Venkatpur-
war, Acta Pharm., 59, 121 (2009).19. W. H. Karasov and J. M. Diamond, J. Comp. Physiol. [B], 152, 105
(1983).20. R. Bouer, L. Barthe, G. Houin, C. Philibert, C. Tournaire and J.
Woodley, Fundam Clin Pharmacol., 13, 494 (1999).21. P. Mura, G. Bramanti, M. T. Faucci and A. Manderioli, J. Incl. Phe-
nom. Macroc. Chem., 39, 131 (2001).22. J. J. T. Labanderia, M. T. E. Diaz, M. Kata and J. L. V. Jato, Eur. J.
Pharm. Sci., 1, 291 (1994).23. M. J. Ginski, J. E. Polli and R. Taneja, Int. J. Pharm., 177, 117 (1999).24. A. Paradkar, A. A. Ambike, B. K. Jadhav and K. R. Mahadik, Int. J.
Pharm., 271, 281 (2004).25. J. Wang, Y. Cao, B. Sun and C. Wang, Food Chem., 124, 1069 (2011).26. R. N. Shamma and M. Basha, Powder Technol., 237, 406 (2013).27. E. Pincu and V. Meltzer, Cent. Eur. J. Chem., 10, 1584 (2012).28. A. Paradkar, A. A. Ambike, K. R. Mahadik, L. P. Mandpe, M. N.
Padamwar and V. B. Pokharkar, Powder Technol., 167, 20 (2006).