PROCESS CAPABILITY - SNS Courseware · Process is not a capable process since Cp
29
1 PROCESS CAPABILITY Muhammad Asif
Transcript of PROCESS CAPABILITY - SNS Courseware · Process is not a capable process since Cp
1
PROCESS CAPABILITY
Muhammad Asif
2
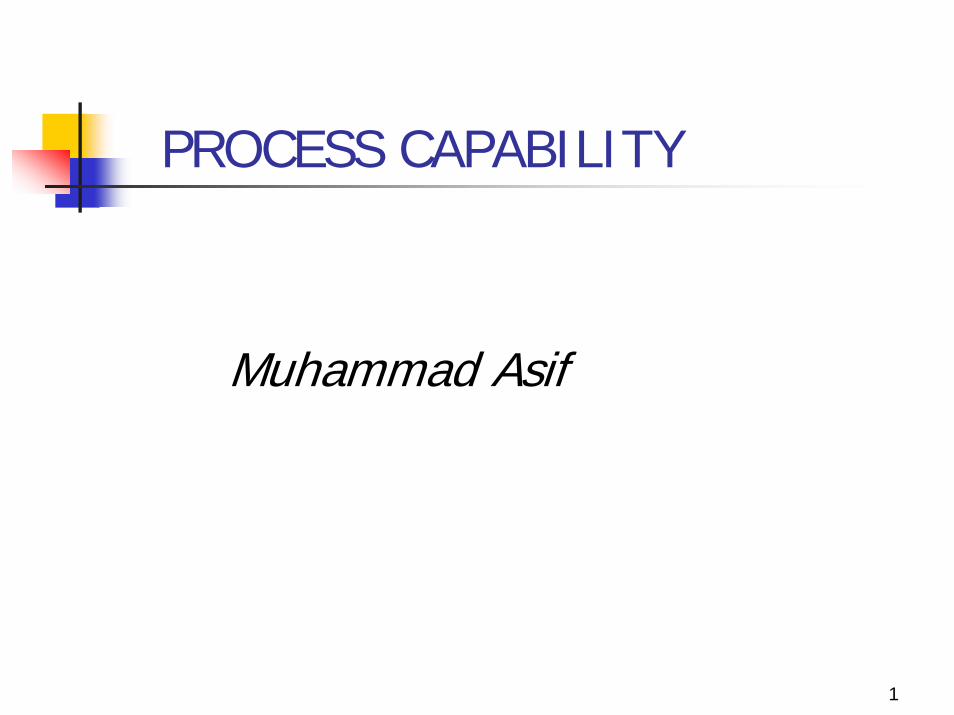
The Normal Distribution
99.73 %
95.46 %
µ µ+1σ µ+2σ µ+3σµ-1σµ-2σµ-3σ
At 3-sigma away from process mean expect 99.73% of observations fall within these limits. At +2σ expect 95.46%
X
+1 S.D, 68% of population+2 S.D, 95% of population+3
S.D, 99.7% of population
3
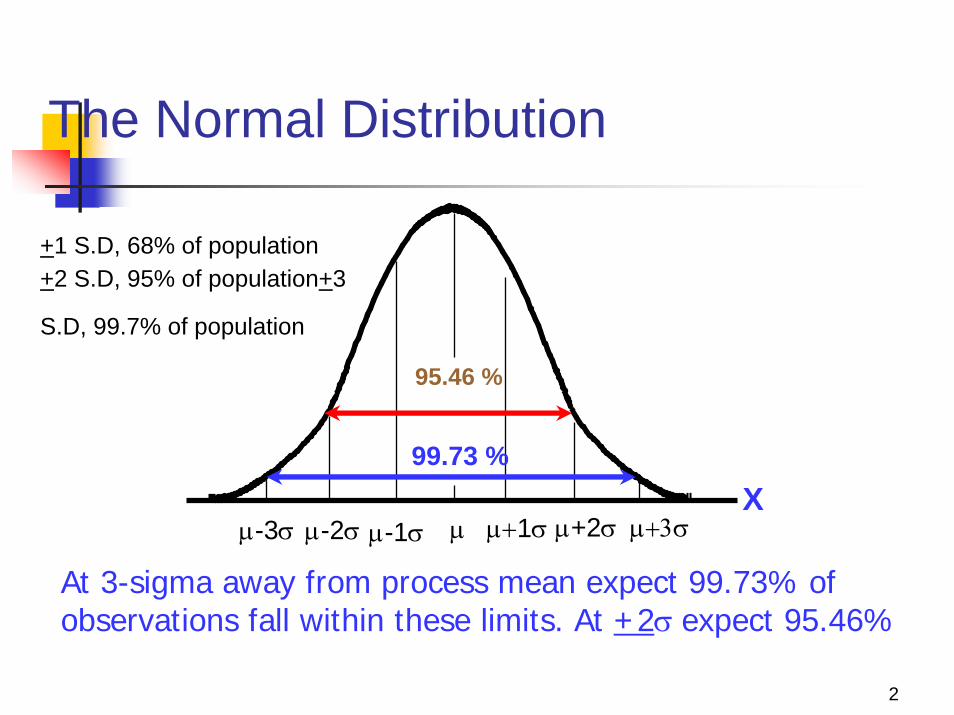
Z-D
ISTR
IBU
TIO
N T
ABLE
4
Process Capability
The ability of a process to meet product design/technical specifications
Conducted only when the process is normally distributed
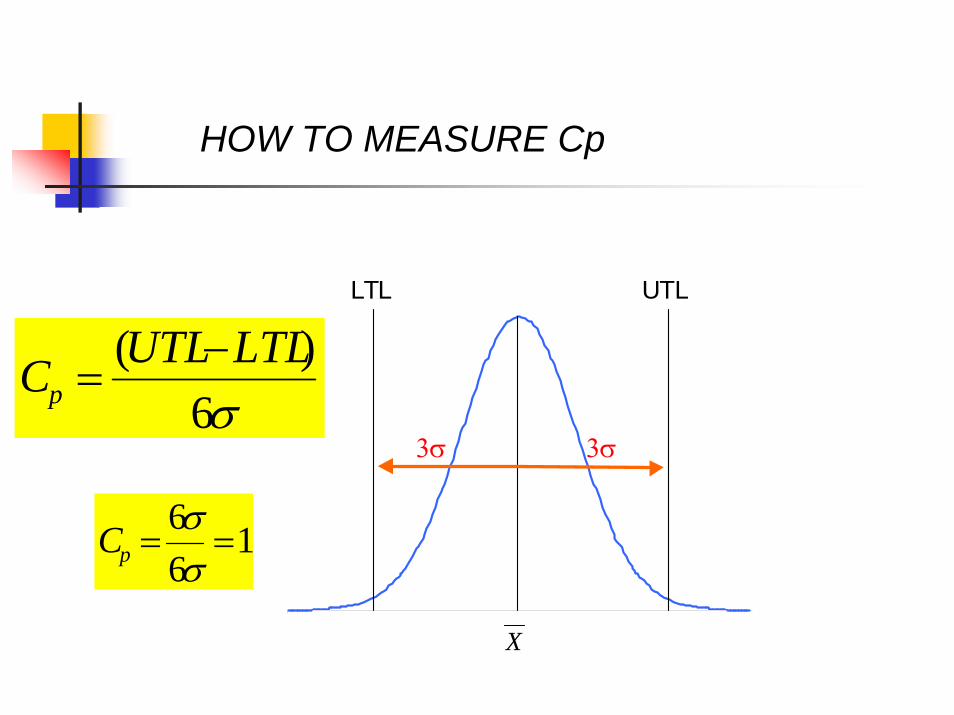
HOW TO MEASURE Cp
-4
3σ3σ
LTL UTL
σ6)( LTLUTLCp
−=
X
166
==σσ
pC
6
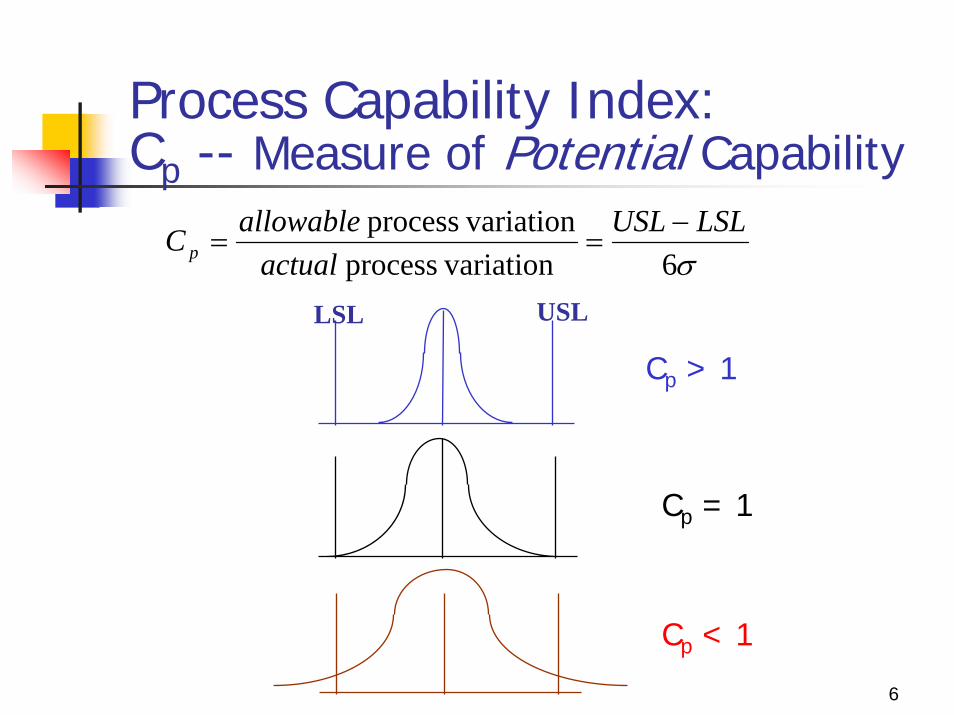
Process Capability Index:Cp -- Measure of Potential Capability
σ6 variationprocess variationprocess LSLUSL
actualallowableC p
−==
Cp > 1
LSL USL
Cp = 1
Cp < 1
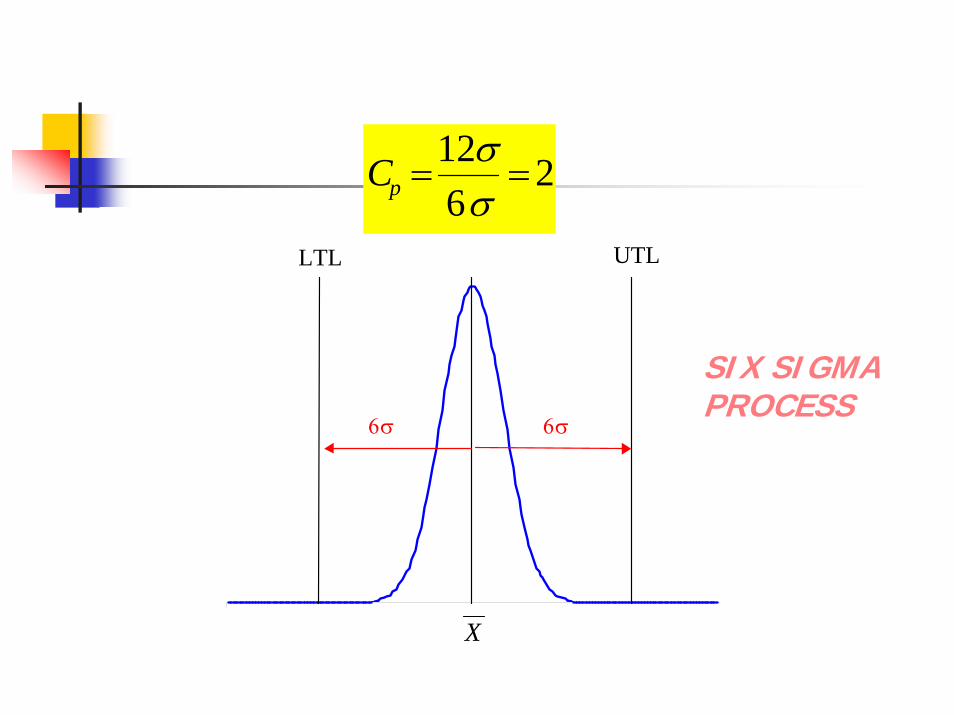
2612
==σσ
pC
-4
6σ6σ
LTL UTL
X
SIX SIGMA PROCESS
8
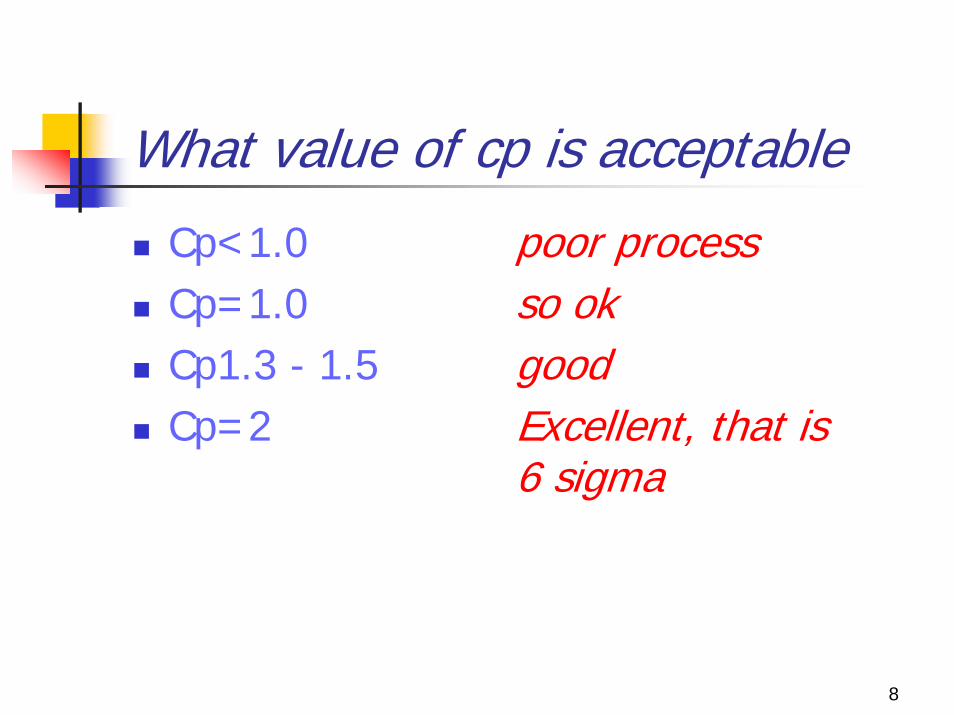
What value of cp is acceptable
Cp<1.0 poor processCp=1.0 so okCp1.3 - 1.5 goodCp=2 Excellent, that is
6 sigma
9
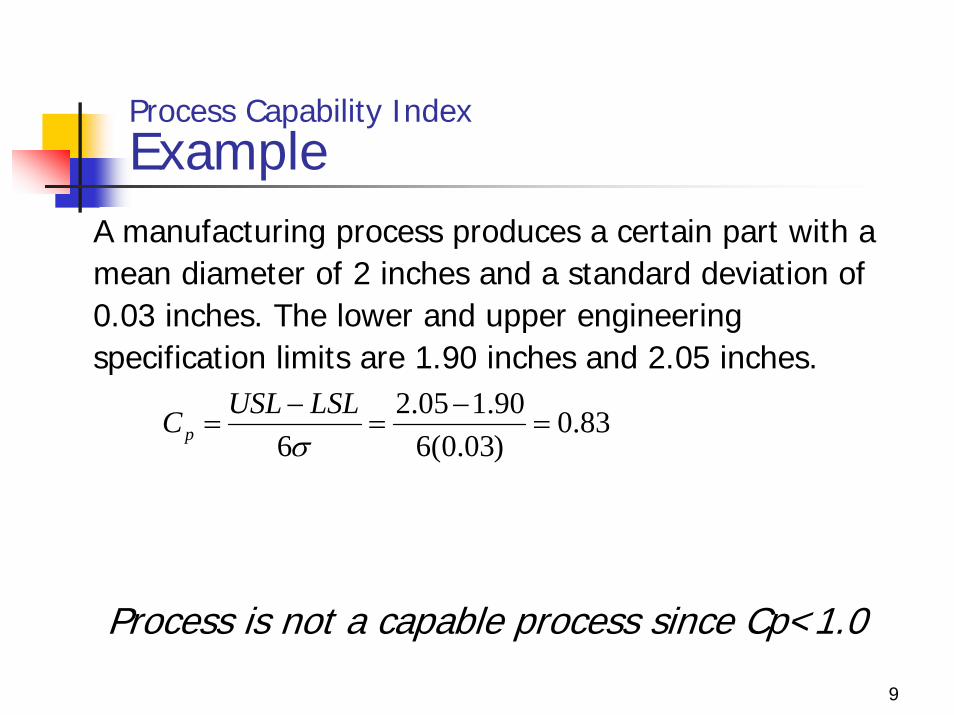
Process Capability IndexExample
A manufacturing process produces a certain part with a mean diameter of 2 inches and a standard deviation of 0.03 inches. The lower and upper engineering specification limits are 1.90 inches and 2.05 inches.
83.0)03.0(690.105.2
6=
−=
−=
σLSLUSLCp
Process is not a capable process since Cp<1.0
10
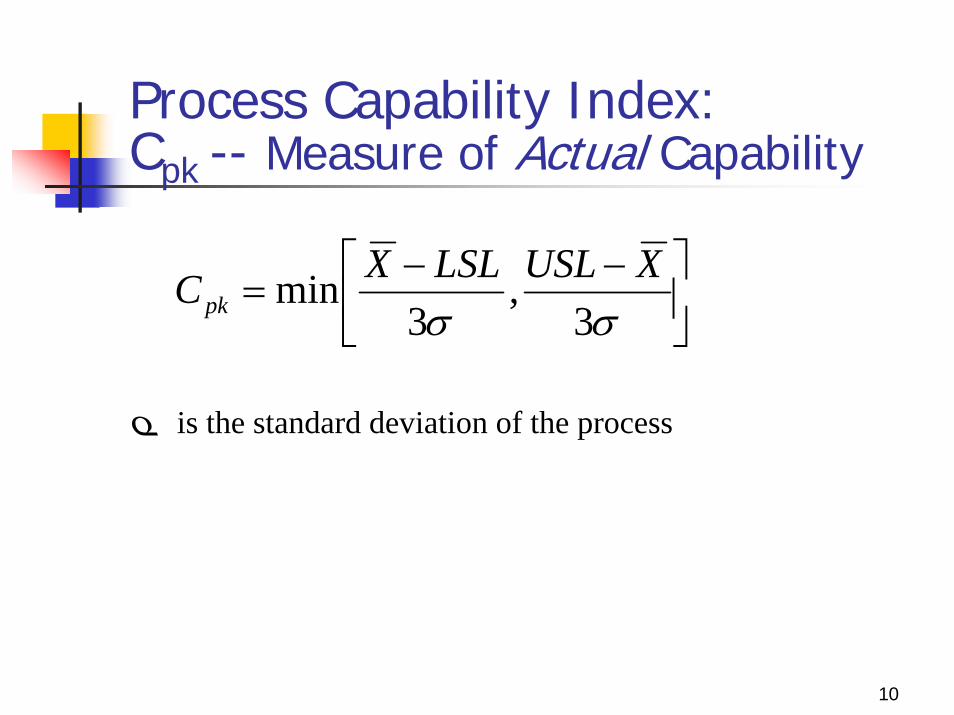
Process Capability Index:Cpk -- Measure of Actual Capability
⎥⎦
⎤⎢⎣
⎡ −−=
σσ 3,
3min XUSLLSLXCpk
σ is the standard deviation of the process
11
WHY Cpk IS NEEDED?
IS Cp NOT ENOUGH?
12
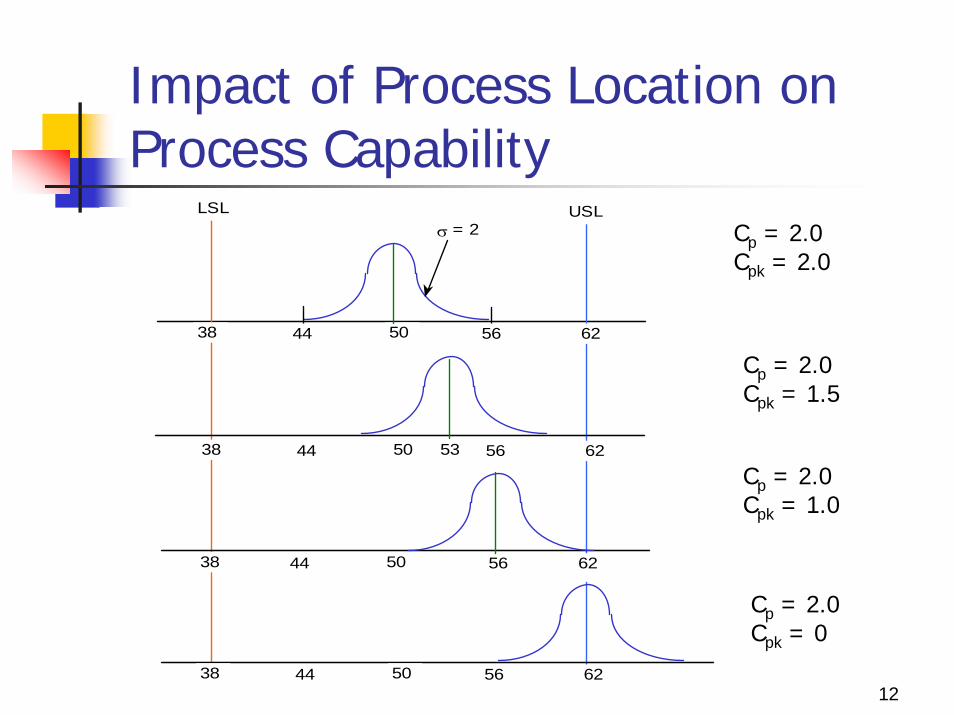
Impact of Process Location on Process Capability
σ = 2
5044 56 6238
5044 56 6238
5044 56 62 38
5044 56 6238
LSL USL
53
Cp = 2.0Cpk = 2.0
Cp = 2.0Cpk = 1.5
Cp = 2.0Cpk = 1.0
Cp = 2.0Cpk = 0
13
WHY Cpk IS NEEDED?
IS Cp NOT ENOUGH?
Cp TELLS U ONLY ABOUT THE SMARTNESS OF CURVE
Cpk TELLS U ABOUT THE POSITIONING / LOCATION OF THE CURVE
14
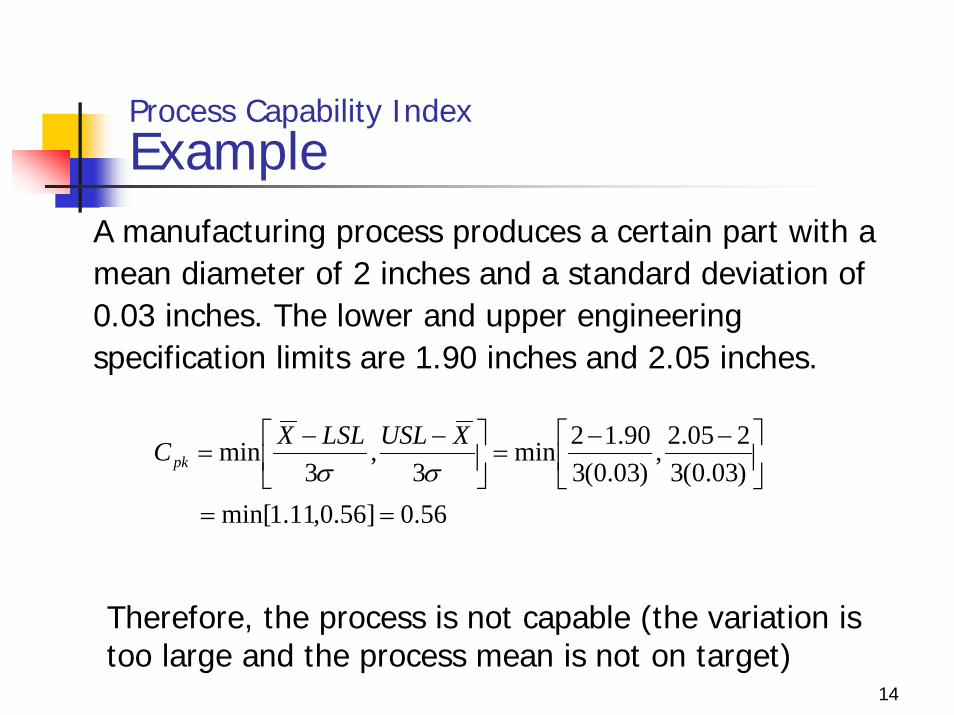
Process Capability IndexExample
A manufacturing process produces a certain part with a mean diameter of 2 inches and a standard deviation of 0.03 inches. The lower and upper engineering specification limits are 1.90 inches and 2.05 inches.
56.0]56.0,11.1min[ )03.0(3205.2,
)03.0(390.12min
3,
3min
==
⎥⎦
⎤⎢⎣
⎡ −−=⎥
⎦
⎤⎢⎣
⎡ −−=
σσXUSLLSLXCpk
Therefore, the process is not capable (the variation is too large and the process mean is not on target)
15
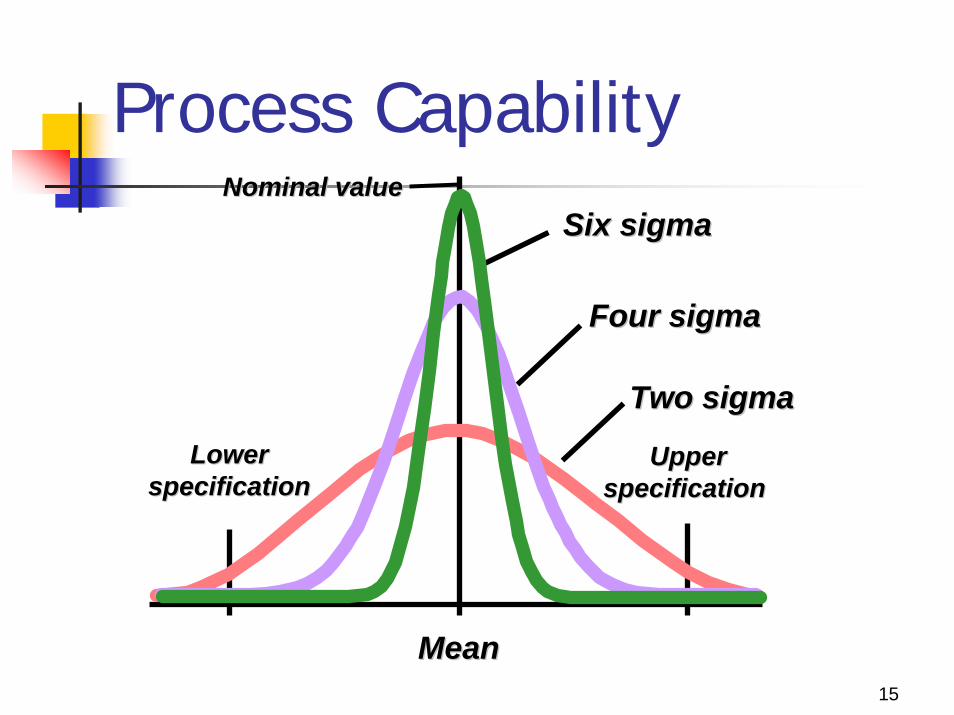
Process Capability
LowerLowerspecificationspecification
MeanMean
UpperUpperspecification specification
Nominal valueNominal valueSix sigmaSix sigma
Four sigmaFour sigma
Two sigmaTwo sigma
16
Six SigmaIs the relentless and rigorous pursuit of the reduction of variation in all critical processes to achieve continuous and breakthrough improvements that impact the bottom line of the organization and increase customer satisfaction. It is an organizational initiative designed to create manufacturing, service and administrative processes that produce approximately 3.4 defects per million. Opportunities (DPMO).
17
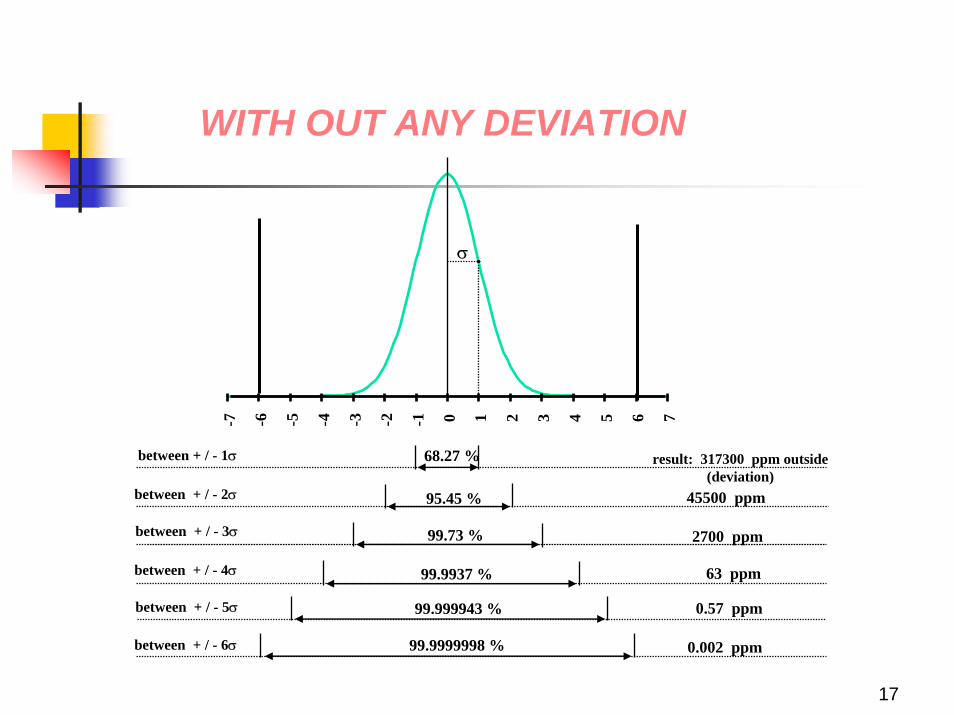
WITH OUT ANY DEVIATION
-7 -6 -5 -4 -3 -2 -1 0 1 2 3 4 5 6 7
68.27 %
95.45 %
99.73 %
99.9937 %
99.999943 %
result: 317300 ppm outside (deviation)
45500 ppm
2700 ppm
63 ppm
0.57 ppm
between + / - 1σ
between + / - 2σ
between + / - 3σ
between + / - 4σ
between + / - 5σ
σ
99.9999998 % 0.002 ppmbetween + / - 6σ
18
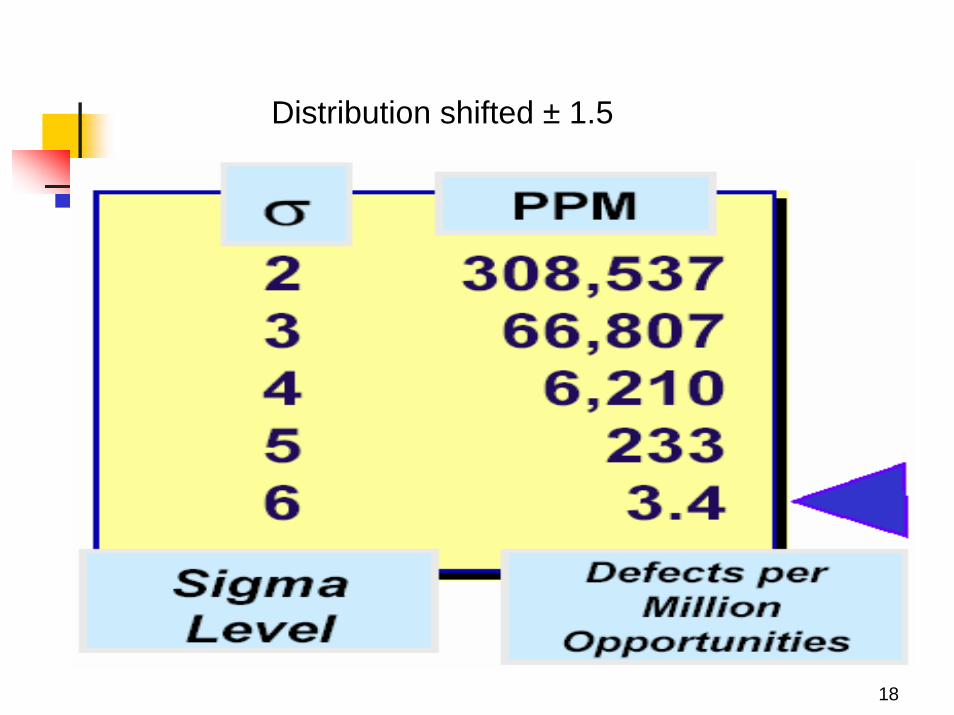
Distribution shifted ± 1.5
19
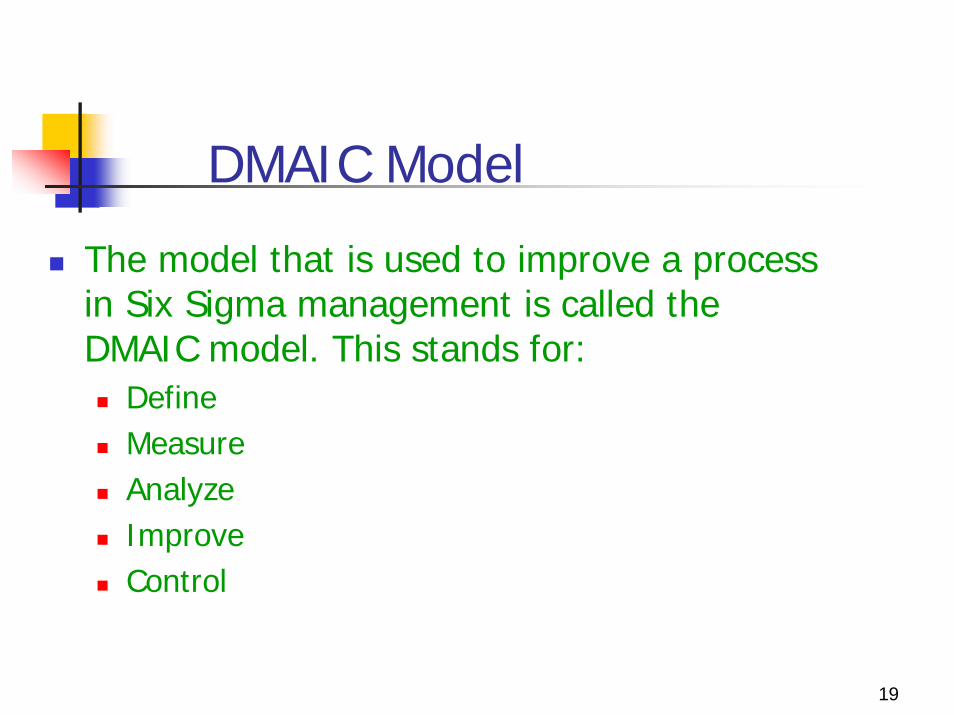
DMAIC Model
The model that is used to improve a process in Six Sigma management is called the DMAIC model. This stands for:
DefineMeasureAnalyzeImproveControl
20
LEADERSHIP
Six Sigma must be implementedfrom the top-down.
21
Green Belt.
Green Belts are project leaders who receive two weeks of training on the Six Sigma roadmap and essential elements of Statistical methodologies supporting Six Sigma projects.Successful Green Belts are able to allocate 50% of their time to their four to six month Six Sigma Project.
22
CHAMPIONS
An executive level business leader who facilitates the leadership, implementation, and deployment of Six Sigma philosophies.
23
Black Belt.
Black Belts are project leaders who receive four weeks of training focusing on the Six Sigma Road map and extensive statistical methodologiesSuccessful Black Belts normally dedicate at least 75% of their time to 4 -6 month Six Sigma Project.
24
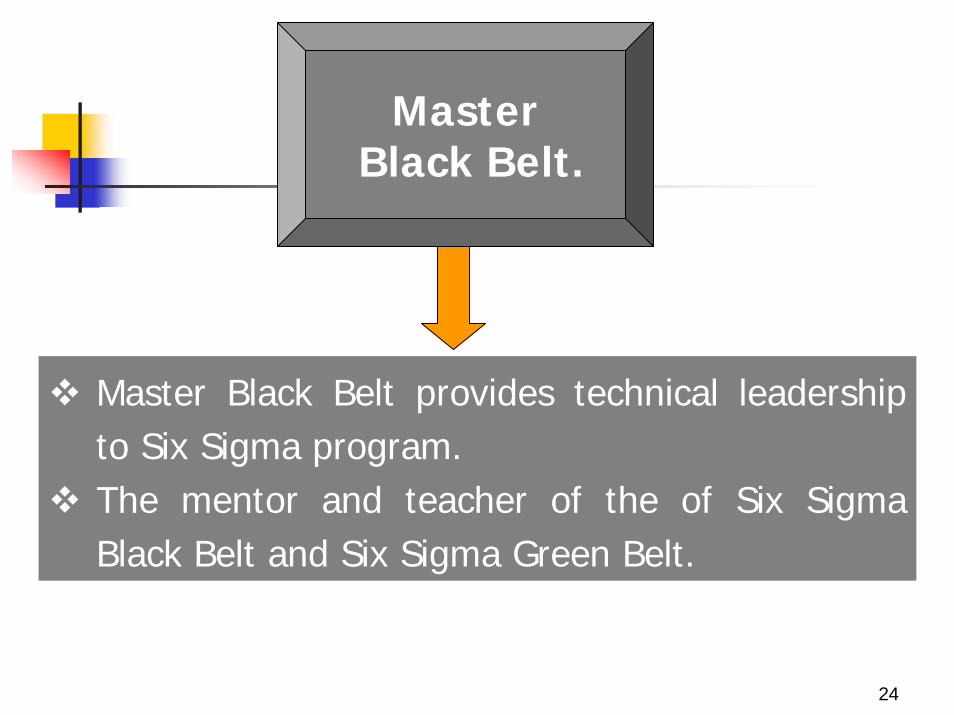
MasterBlack Belt.
Master Black Belt provides technical leadership to Six Sigma program. The mentor and teacher of the of Six Sigma Black Belt and Six Sigma Green Belt.
25
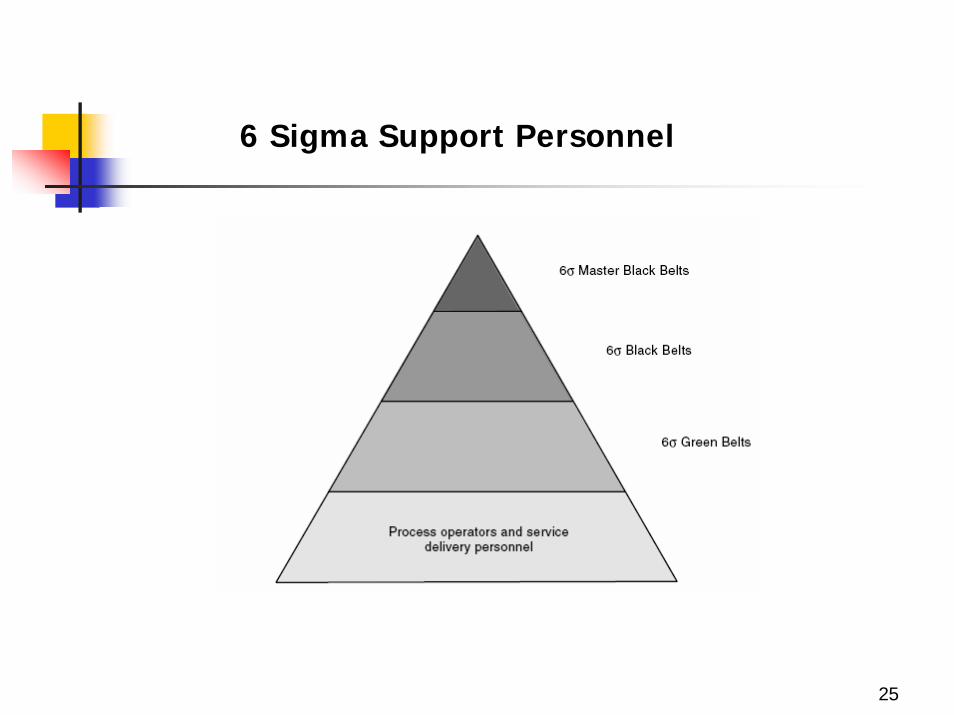
6 Sigma Support Personnel
26
Process capability calculation using Minitab
Please refer to the examples discussed in class
27
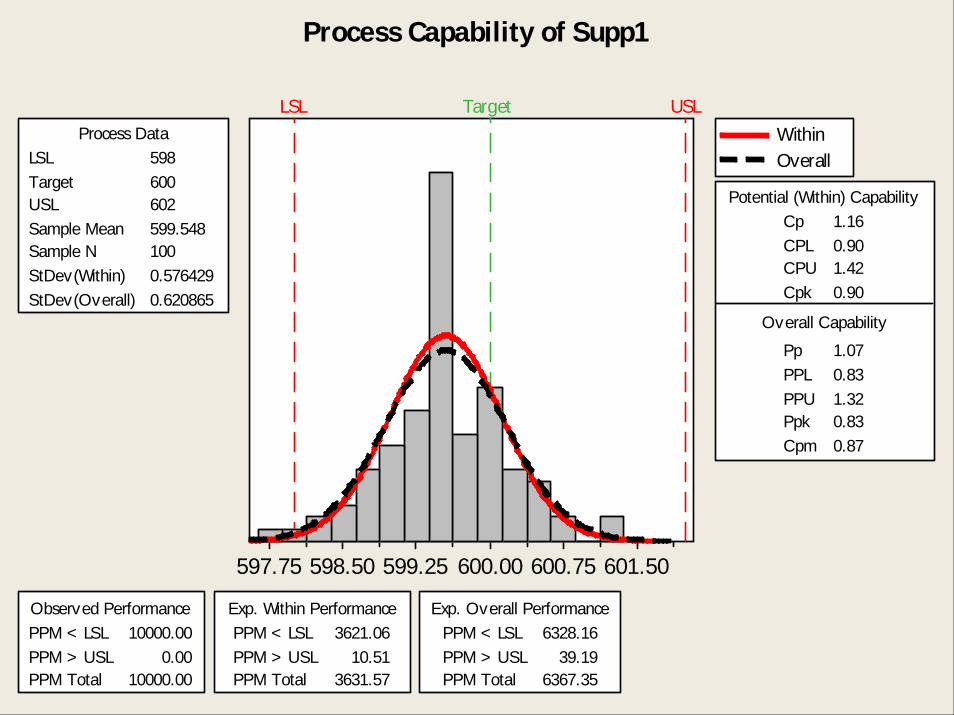
601.50600.75600.00599.25598.50597.75
LSL Target USLProcess Data
Sample N 100StDev(Within) 0.576429StDev(Overall) 0.620865
LSL 598Target 600USL 602Sample Mean 599.548
Potential (Within) Capability
Overall Capability
Pp 1.07PPL 0.83PPU 1.32Ppk 0.83Cpm
Cp
0.87
1.16CPL 0.90CPU 1.42Cpk 0.90
Observed PerformancePPM < LSL 10000.00PPM > USL 0.00PPM Total 10000.00
Exp. Within PerformancePPM < LSL 3621.06PPM > USL 10.51PPM Total 3631.57
Exp. Overall PerformancePPM < LSL 6328.16PPM > USL 39.19PPM Total 6367.35
WithinOverall
Process Capability of Supp1
28
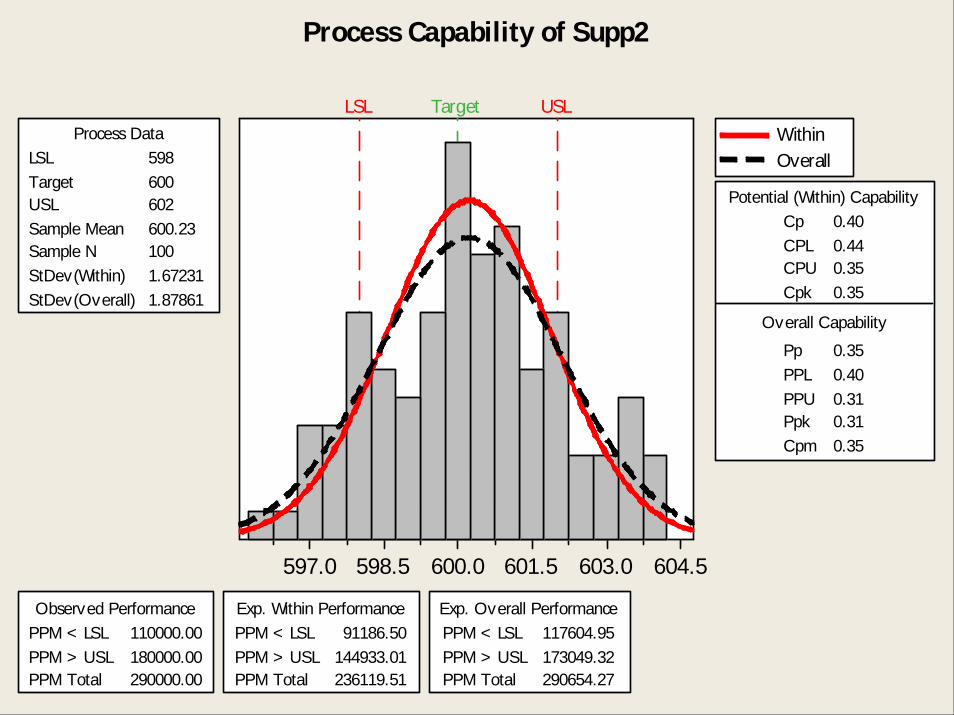
604.5603.0601.5600.0598.5597.0
LSL Target USLProcess Data
Sample N 100StDev(Within) 1.67231StDev(Overall) 1.87861
LSL 598Target 600USL 602Sample Mean 600.23
Potential (Within) Capability
Overall Capability
Pp 0.35PPL 0.40PPU 0.31Ppk 0.31Cpm
Cp
0.35
0.40CPL 0.44CPU 0.35Cpk 0.35
Observed PerformancePPM < LSL 110000.00PPM > USL 180000.00PPM Total 290000.00
Exp. Within PerformancePPM < LSL 91186.50PPM > USL 144933.01PPM Total 236119.51
Exp. Overall PerformancePPM < LSL 117604.95PPM > USL 173049.32PPM Total 290654.27
WithinOverall
Process Capability of Supp2
29
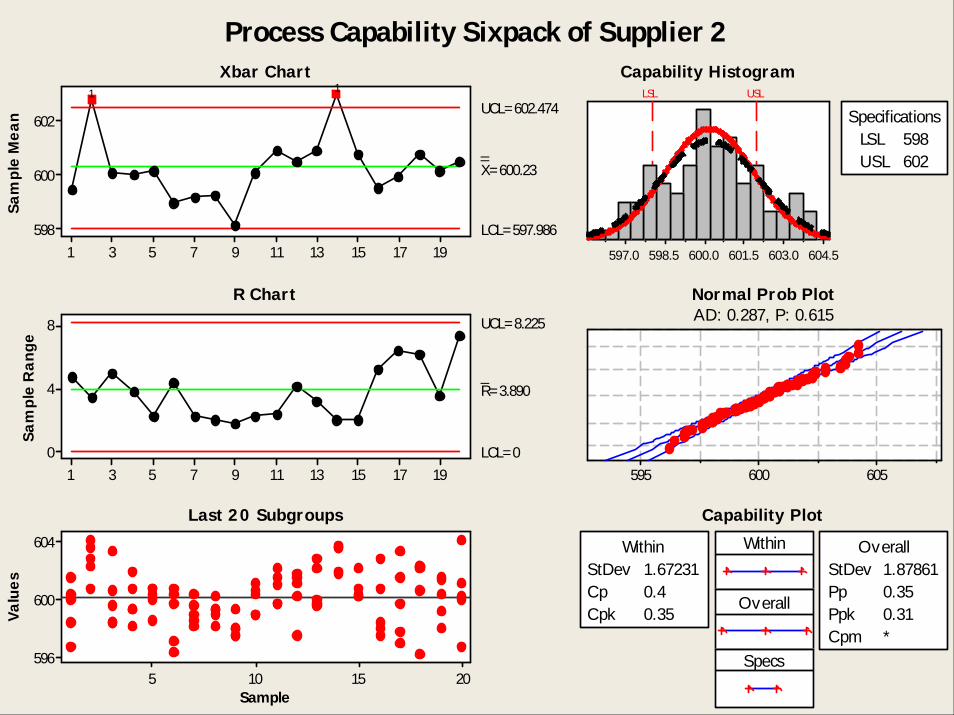
Sam
ple
Mea
n
191715131197531
602
600
598
__X=600.23
UCL=602.474
LCL=597.986
Sam
ple
Ran
ge
191715131197531
8
4
0
_R=3.890
UCL=8.225
LCL=0
Sample
Valu
es
2015105
604
600
596
604.5603.0601.5600.0598.5597.0
LSL USL
SpecificationsLSL 598USL 602
605600595
Within
Overall
Specs
WithinStDev 1.67231Cp 0.4Cpk 0.35
OverallStDev 1.87861Pp 0.35Ppk 0.31Cpm *
11
Process Capability Sixpack of Supplier 2Xbar Chart
R Chart
Last 20 Subgroups
Capability Histogram
Normal Prob PlotAD: 0.287, P: 0.615
Capability Plot


![Fabrication of CdS/SnS Heterojunction for Photovoltaic ...file.scirp.org/pdf/WJCMP_2015012113550782.pdf · R. Reddy [4] improved the ... SnS thin films were deposited on the CdS layers](https://static.fdocument.org/doc/165x107/5aa49b0b7f8b9afa758c254b/fabrication-of-cdssns-heterojunction-for-photovoltaic-filescirporgpdfwjcmp.jpg)

![DOE Process Optimization[1]](https://static.fdocument.org/doc/165x107/544b737daf7959ac438b52be/doe-process-optimization1.jpg)