Principles of Biostatistics ANOVA. DietWeight Gain (grams) Standard910 8 Junk Food10 13 12...
28
Principles of Biostatistics ANOVA
-
Upload
justin-mcdonald -
Category
Documents
-
view
214 -
download
1
Transcript of Principles of Biostatistics ANOVA. DietWeight Gain (grams) Standard910 8 Junk Food10 13 12...

Principles of BiostatisticsANOVA
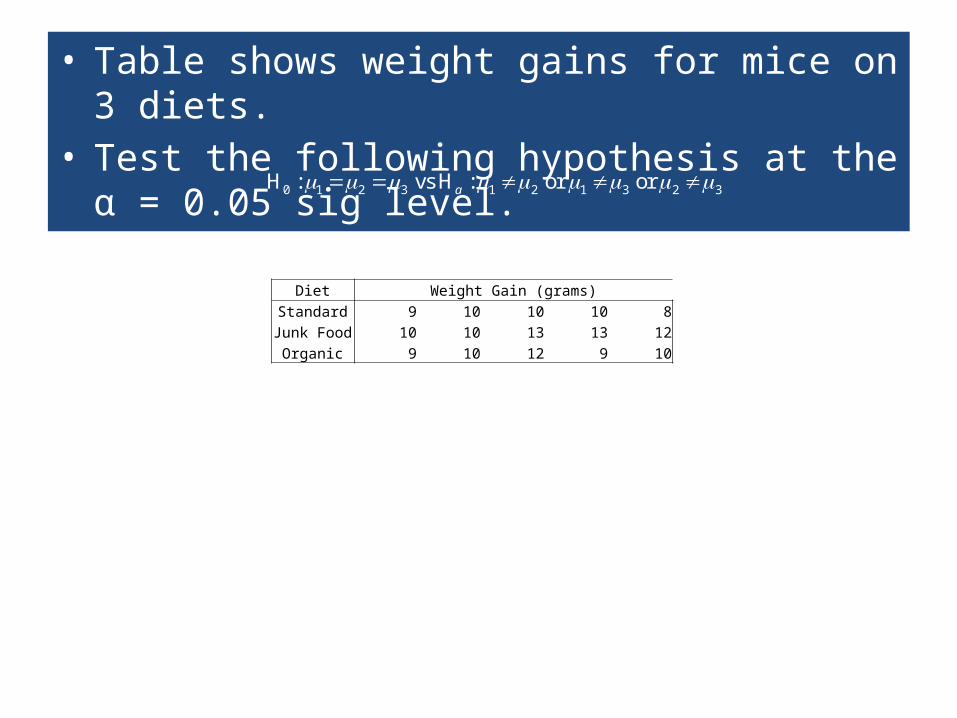
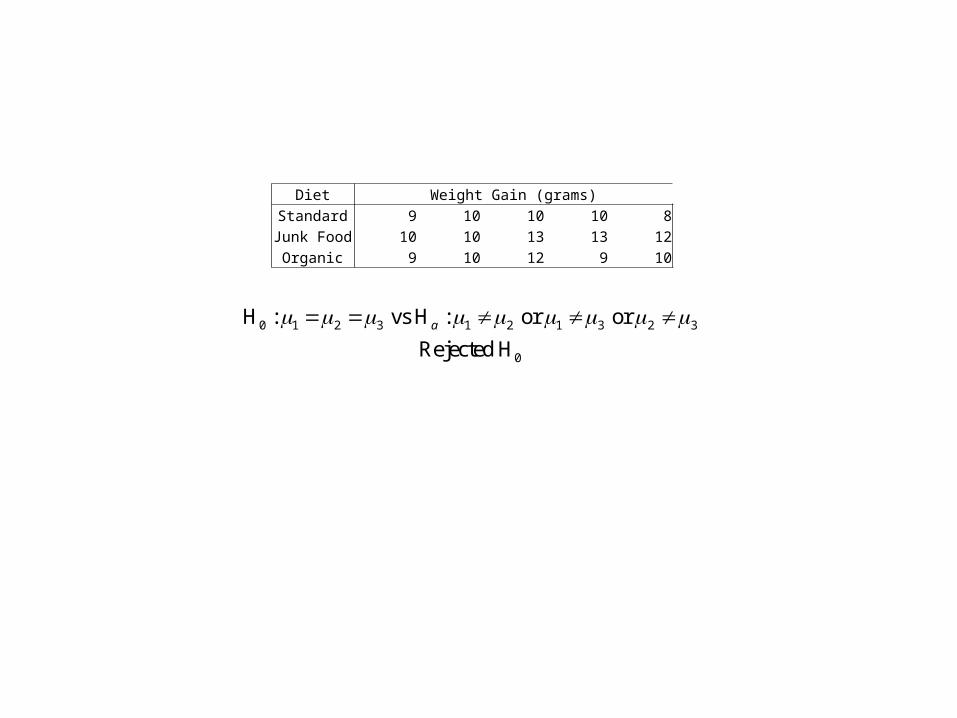
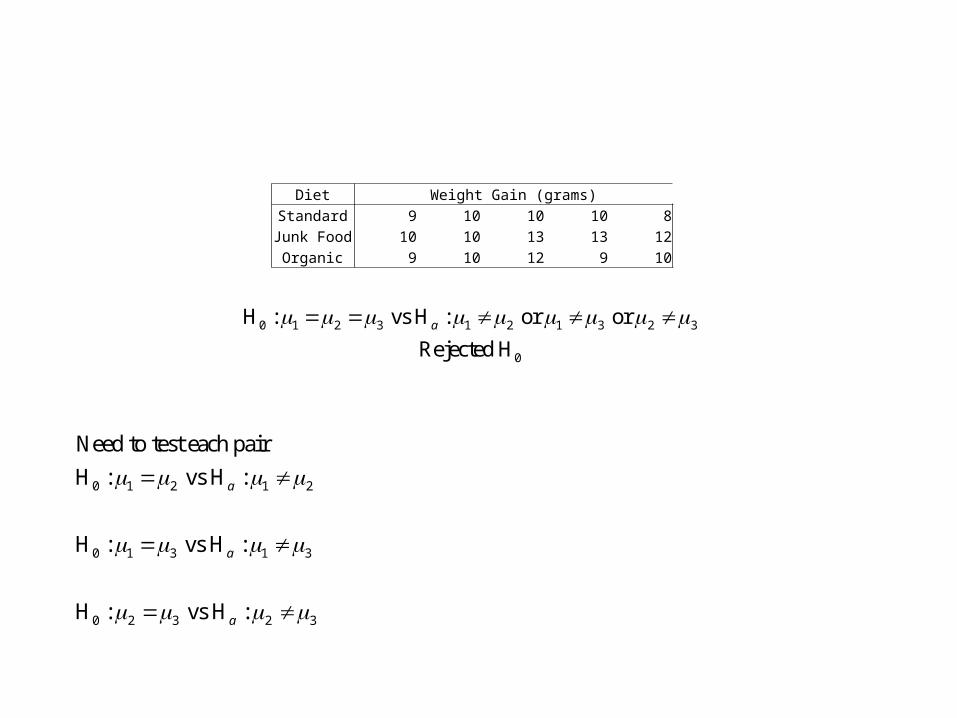
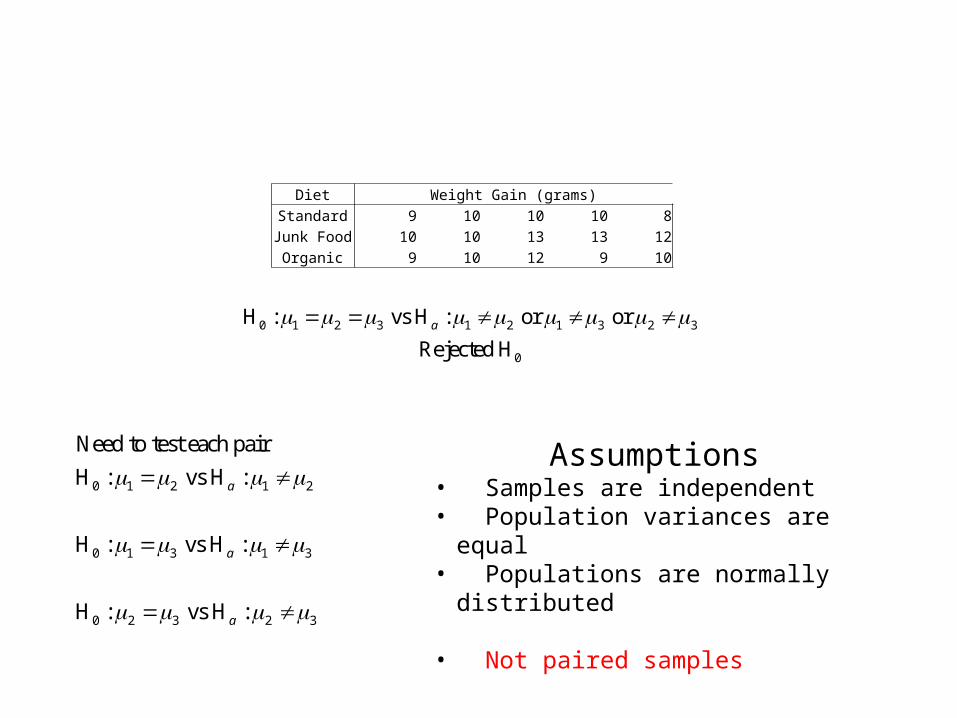
Diet Weight Gain (grams)Standard 9 10 10 10 8Junk Food 10 10 13 13 12
Organic 9 10 12 9 10
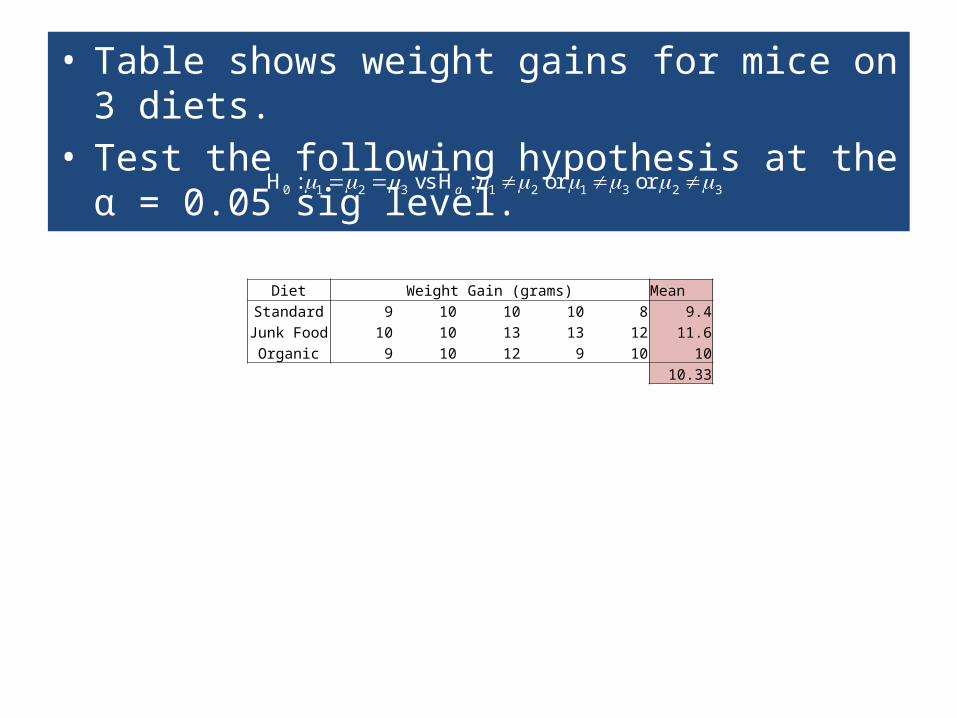
• Table shows weight gains for mice on 3 diets.• Test the following hypothesis at the α = 0.05 sig level.
0 1 2 3 1 2 1 3 2 3H : vs H : or or a
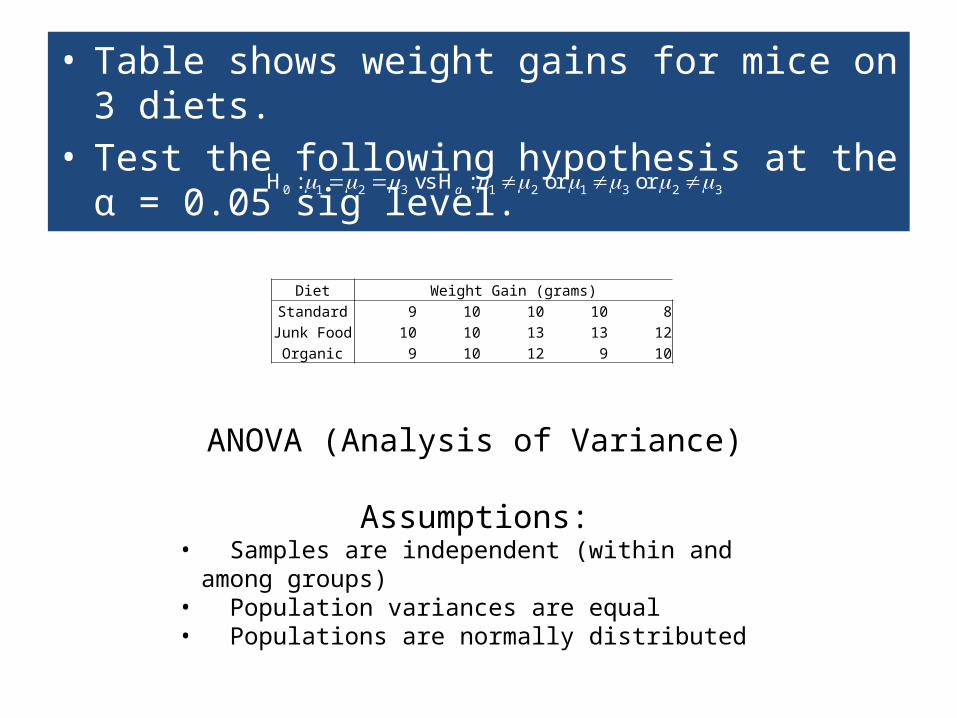
Diet Weight Gain (grams)Standard 9 10 10 10 8Junk Food 10 10 13 13 12
Organic 9 10 12 9 10
• Table shows weight gains for mice on 3 diets.• Test the following hypothesis at the α = 0.05 sig level.
0 1 2 3 1 2 1 3 2 3H : vs H : or or a
ANOVA (Analysis of Variance)
Assumptions:• Samples are independent (within and among groups)• Population variances are equal• Populations are normally distributed
• Table shows weight gains for mice on 3 diets.• Test the following hypothesis at the α = 0.05 sig level.
0 1 2 3 1 2 1 3 2 3H : vs H : or or a
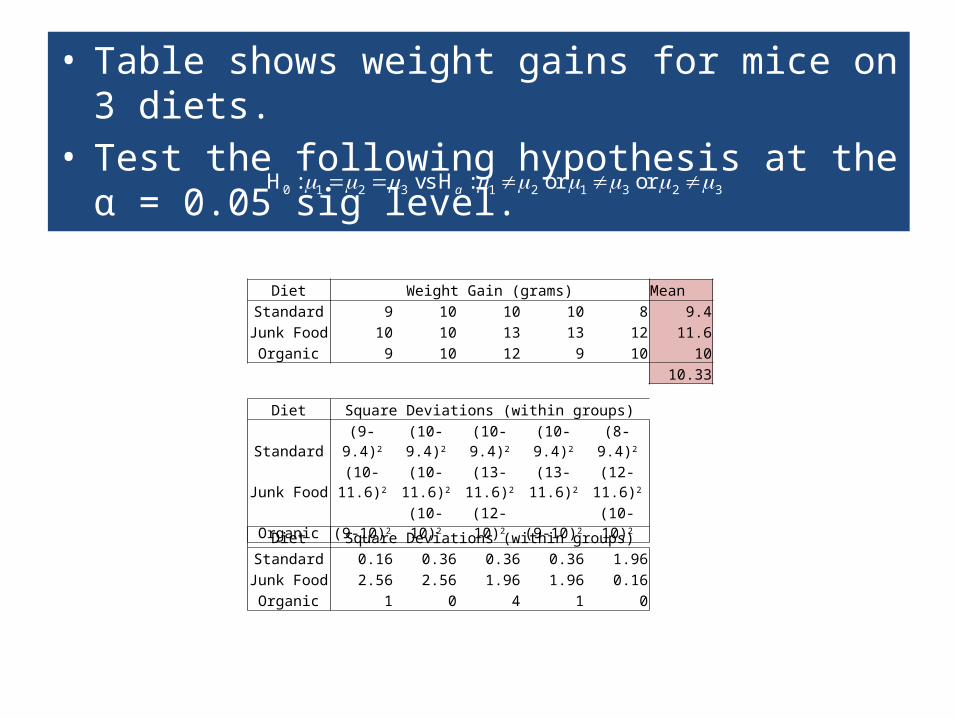
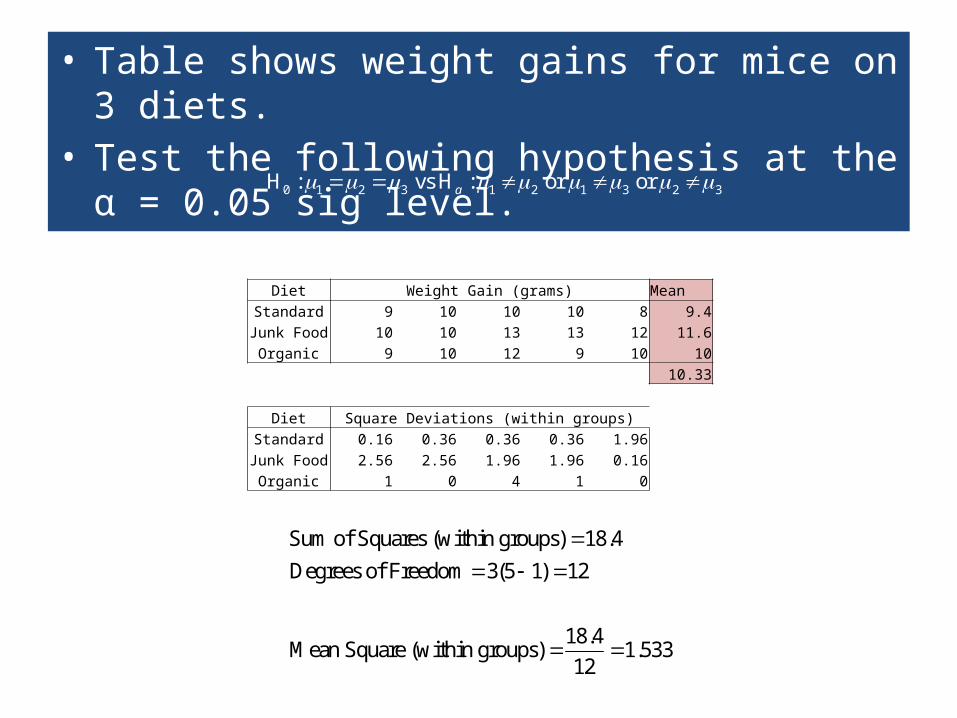
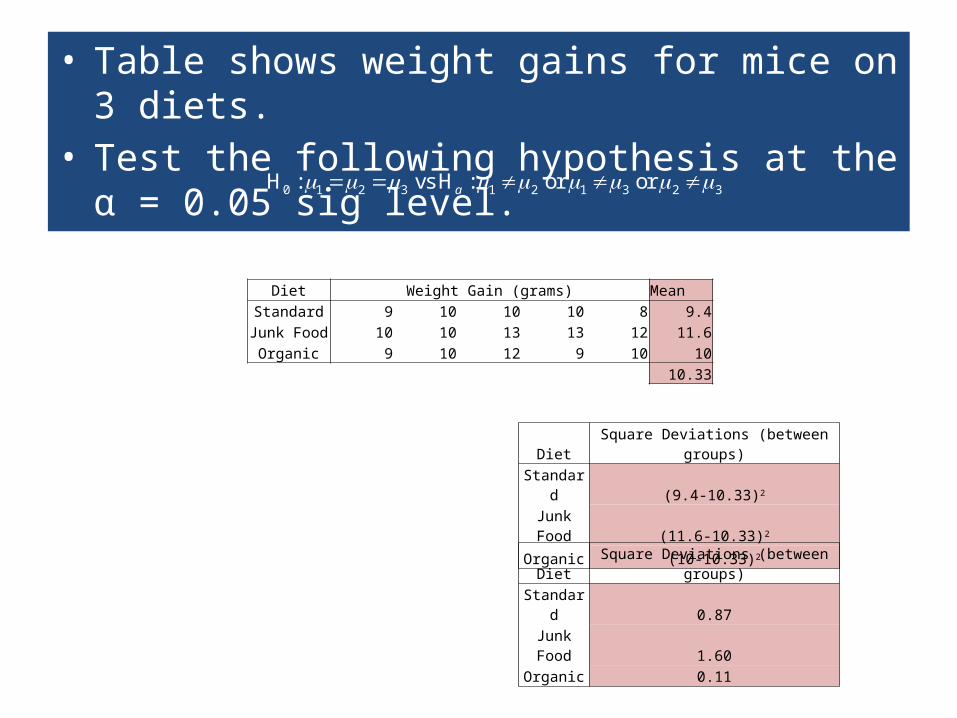
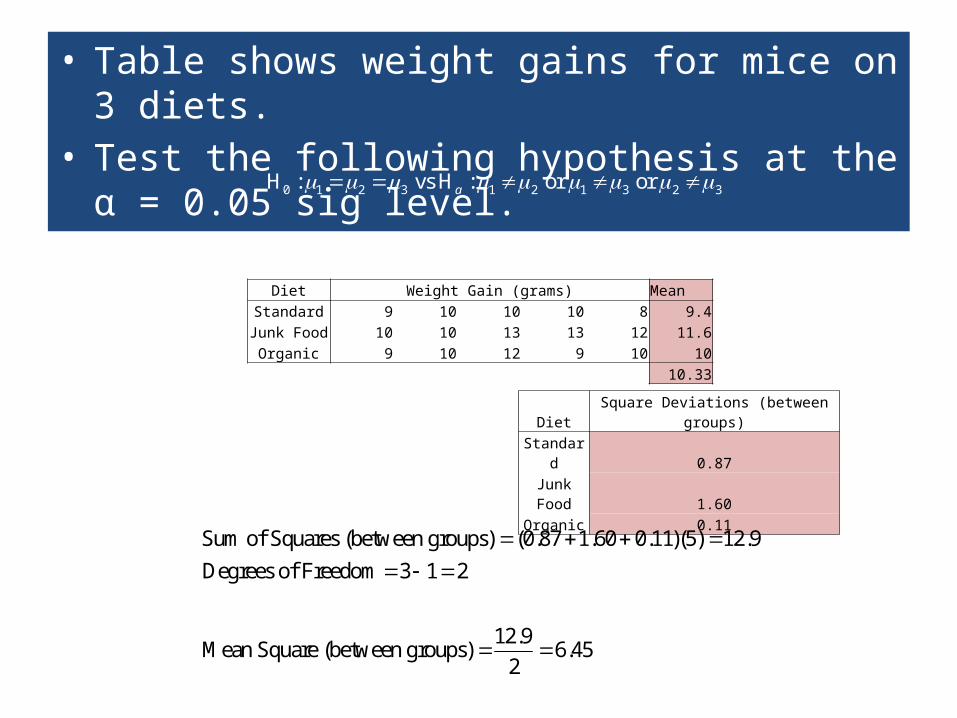
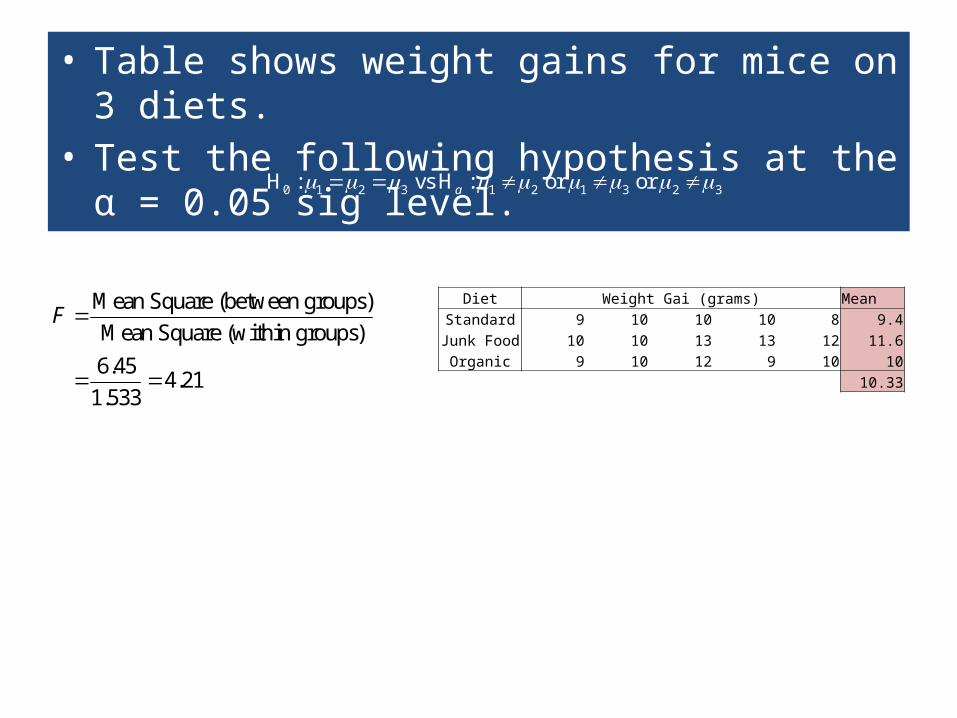
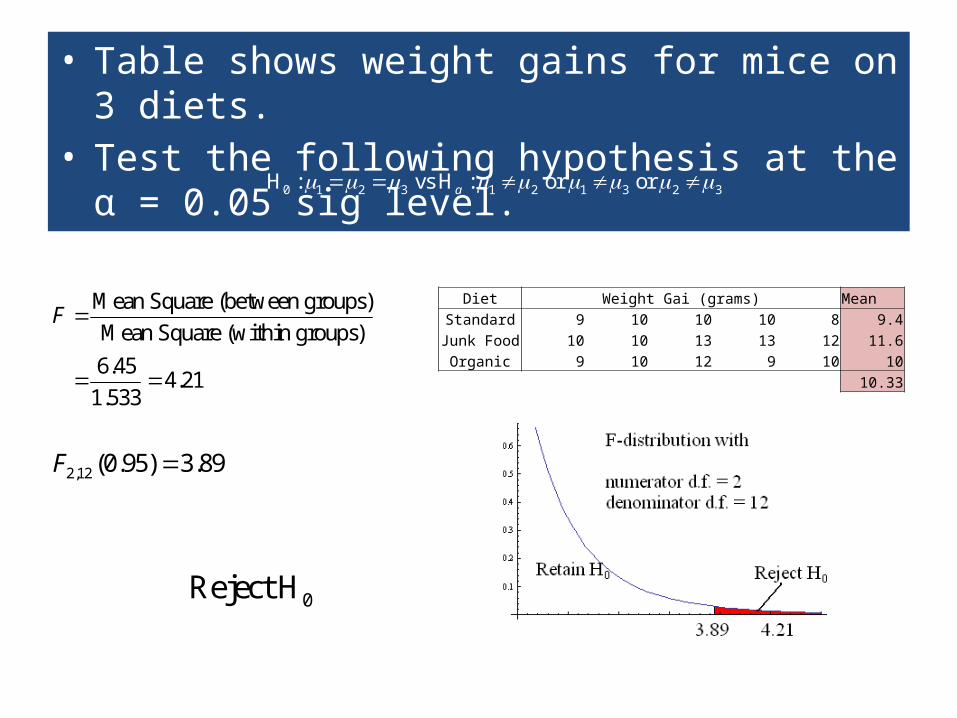
Diet Weight Gain (grams) MeanStandard 9 10 10 10 8 9.4Junk Food 10 10 13 13 12 11.6
Organic 9 10 12 9 10 1010.33
• Table shows weight gains for mice on 3 diets.• Test the following hypothesis at the α = 0.05 sig level.
0 1 2 3 1 2 1 3 2 3H : vs H : or or a
Diet Weight Gain (grams) MeanStandard 9 10 10 10 8 9.4Junk Food 10 10 13 13 12 11.6
Organic 9 10 12 9 10 1010.33
Diet Square Deviations (within groups)
Standard (9-9.4)2 (10-9.4)2 (10-9.4)2 (10-9.4)2 (8-9.4)2
Junk Food (10-11.6)2 (10-11.6)2 (13-11.6)2 (13-11.6)2 (12-11.6)2
Organic (9-10)2 (10-10)2 (12-10)2 (9-10)2 (10-10)2
Diet Square Deviations (within groups)Standard 0.16 0.36 0.36 0.36 1.96Junk Food 2.56 2.56 1.96 1.96 0.16
Organic 1 0 4 1 0
• Table shows weight gains for mice on 3 diets.• Test the following hypothesis at the α = 0.05 sig level.
0 1 2 3 1 2 1 3 2 3H : vs H : or or a
Diet Weight Gain (grams) MeanStandard 9 10 10 10 8 9.4Junk Food 10 10 13 13 12 11.6
Organic 9 10 12 9 10 1010.33
Diet Square Deviations (within groups)Standard 0.16 0.36 0.36 0.36 1.96Junk Food 2.56 2.56 1.96 1.96 0.16
Organic 1 0 4 1 0
Sum of Squares (within groups) 18.4
Degrees of Freedom 3(5 1) 12
18.4Mean Square (within groups) 1.533
12
• Table shows weight gains for mice on 3 diets.• Test the following hypothesis at the α = 0.05 sig level.
0 1 2 3 1 2 1 3 2 3H : vs H : or or a
Diet Weight Gain (grams) MeanStandard 9 10 10 10 8 9.4Junk Food 10 10 13 13 12 11.6
Organic 9 10 12 9 10 1010.33
Diet Square Deviations (between groups)
Standard (9.4-10.33)2
Junk Food (11.6-10.33)2
Organic (10-10.33)2
Diet Square Deviations (between groups)Standard 0.87Junk Food 1.60
Organic 0.11
• Table shows weight gains for mice on 3 diets.• Test the following hypothesis at the α = 0.05 sig level.
0 1 2 3 1 2 1 3 2 3H : vs H : or or a
Diet Weight Gain (grams) MeanStandard 9 10 10 10 8 9.4Junk Food 10 10 13 13 12 11.6
Organic 9 10 12 9 10 1010.33
Diet Square Deviations (between groups)Standard 0.87Junk Food 1.60
Organic 0.11
Sum of Squares (between groups) (0.87 1.60 0.11)(5) 12.9
Degrees of Freedom 3 1 2
12.9Mean Square (between groups) 6.45
2
• Table shows weight gains for mice on 3 diets.• Test the following hypothesis at the α = 0.05 sig level.
0 1 2 3 1 2 1 3 2 3H : vs H : or or a
Diet Weight Gai (grams) MeanStandard 9 10 10 10 8 9.4Junk Food 10 10 13 13 12 11.6
Organic 9 10 12 9 10 1010.33
Mean Square (between groups)
Mean Square (within groups)
6.454.21
1.533
F
2,12 (0.95) 3.89F
0Reject H
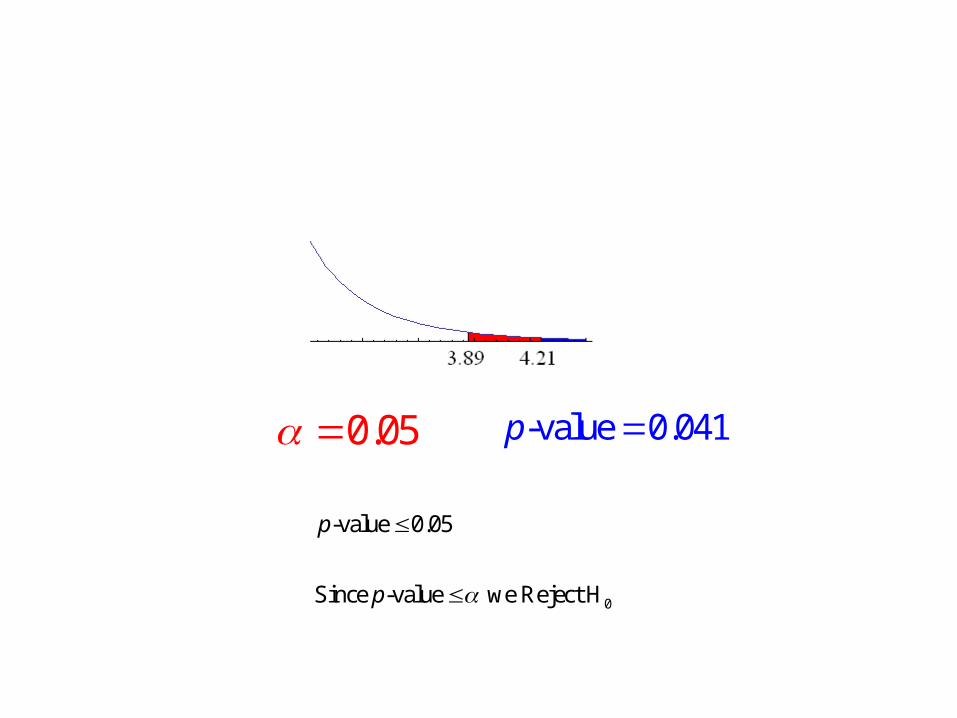
Calculating the p-value
0.05 -value 0.041p
0
-value 0.05
Since -value we Reject H
p
p
Post-hoc TestsDiet Weight Gain (grams)
Standard 9 10 10 10 8Junk Food 10 10 13 13 12
Organic 9 10 12 9 10
0 1 2 3 1 2 1 3 2
0
3H : vs H : or
Rejec
or
ted
Ha
Post-hoc TestsDiet Weight Gain (grams)
Standard 9 10 10 10 8Junk Food 10 10 13 13 12
Organic 9 10 12 9 10
0 1 2 3 1 2 1 3 2
0
3H : vs H : or
Rejec
or
ted
Ha
0 1 2 1 2
0 1 3 1 3
0 2 3 2 3
Need to test each pair
H : vs H :
H : vs H :
H : vs H :
a
a
a
Post-hoc TestsDiet Weight Gain (grams)
Standard 9 10 10 10 8Junk Food 10 10 13 13 12
Organic 9 10 12 9 10
0 1 2 3 1 2 1 3 2
0
3H : vs H : or
Rejec
or
ted
Ha
0 1 2 1 2
0 1 3 1 3
0 2 3 2 3
Need to test each pair
H : vs H :
H : vs H :
H : vs H :
a
a
a
Assumptions• Samples are independent • Population variances are equal• Populations are normally distributed
• Not paired samples
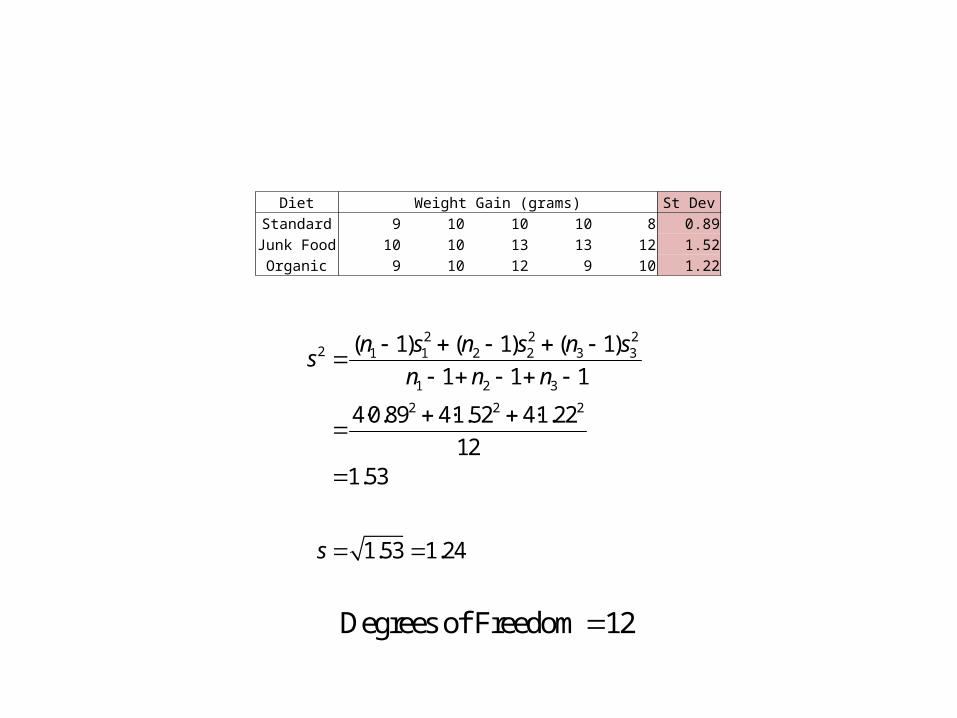
Estimating the Pooled Variance
Diet Weight Gain (grams) St DevStandard 9 10 10 10 8 0.89Junk Food 10 10 13 13 12 1.52
Organic 9 10 12 9 10 1.22
2 2 22 1 1 2 2 3 3
1 2 3
2 2 2
1) 1) 1)
1 1 1
4·0.89 ·1.52 ·1.22
1.53
1.53 1.2
( ( (
4 4
1
4
2
n n ns
n
s s s
n n
s
Degrees of Freedom 12
Back to the Post-hoc Tests
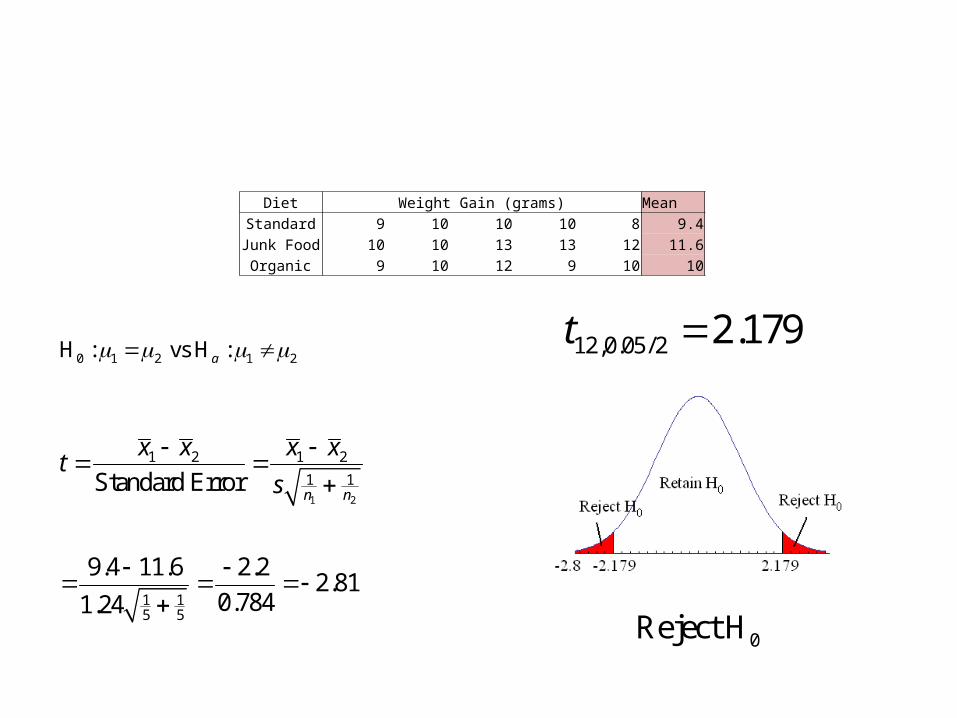
Diet Weight Gain (grams) MeanStandard 9 10 10 10 8 9.4Junk Food 10 10 13 13 12 11.6
Organic 9 10 12 9 10 10
0 1 2 1 2H : vs H :a
1 2
1 2 1 2
1 1
1 15 5
Standard Error
2.22.81
0.7841.24
9.4 11.6
n n
x x x xt
s
12,0.05/2 2.179t
0Reject H
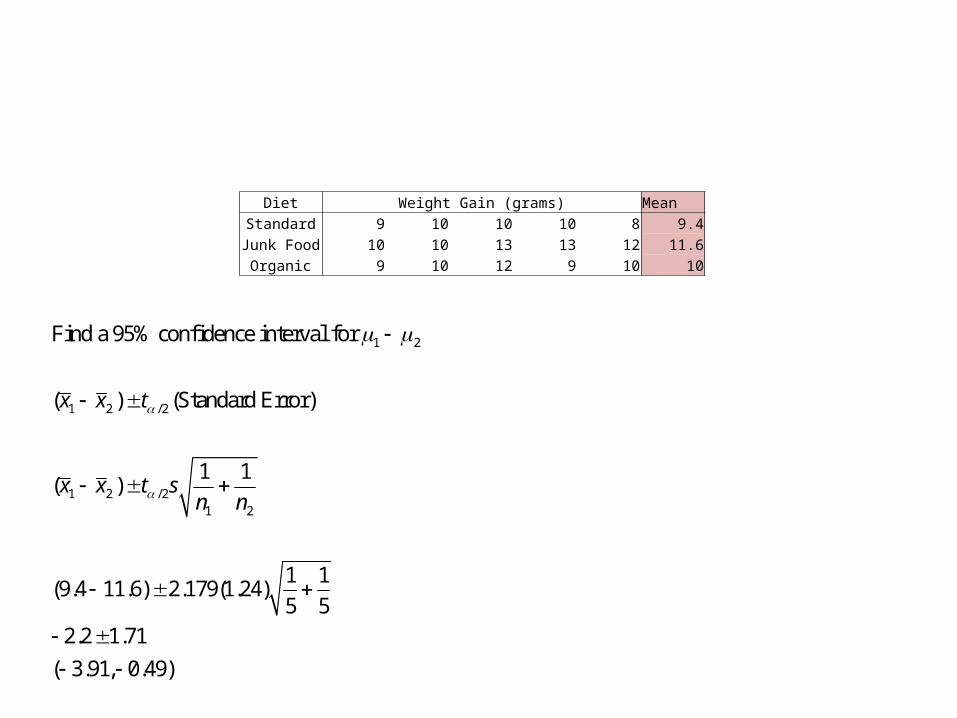
Post-hoc Confidence Interval
Diet Weight Gain (grams) MeanStandard 9 10 10 10 8 9.4Junk Food 10 10 13 13 12 11.6
Organic 9 10 12 9 10 10
1 2
1 2 /2
1 2 /21 2
( (
(
Find a 95% confidence interval for
) Standard Error)
1 1)
1 1(9.4 11.6) 2.179(1.24)
5 52.2 1.71
( 3.91, 0.49)
x x t
x x t sn n
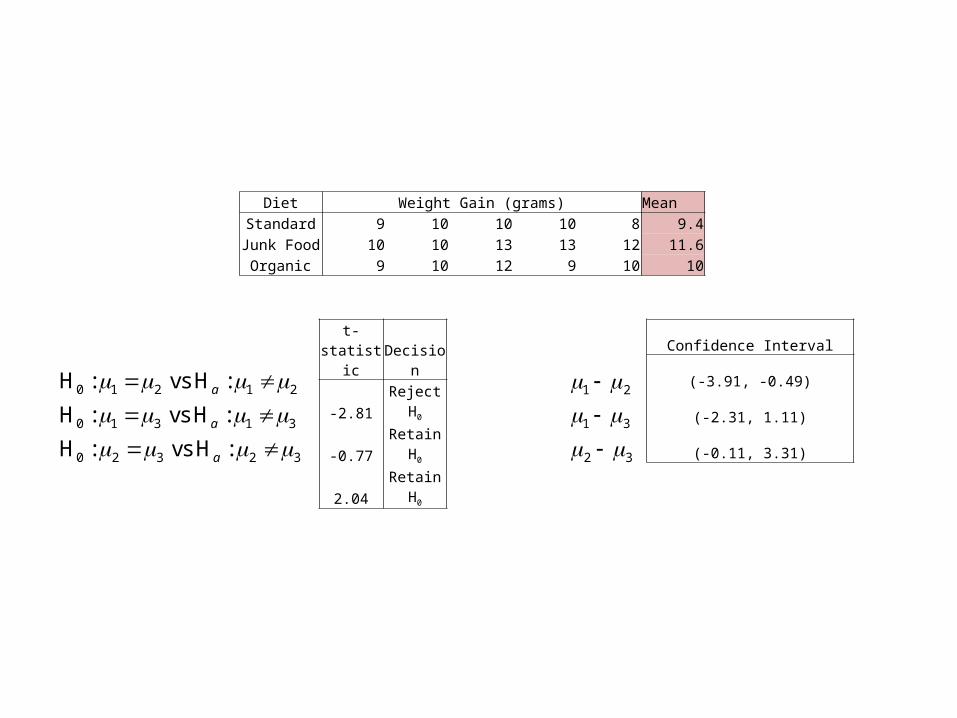
Post-hoc Summary
Diet Weight Gain (grams) MeanStandard 9 10 10 10 8 9.4Junk Food 10 10 13 13 12 11.6
Organic 9 10 12 9 10 10
t-statistic Decision
-2.81 Reject H0
-0.77 Retain H0
2.04 Retain H0
0 1 2 1 2
0 1 3 1 3
0 2 3 2 3
H : vs H :
H : vs H :
H : vs H :
a
a
a
1 2
1 3
2 3
Confidence Interval
(-3.91, -0.49)
(-2.31, 1.11)
(-0.11, 3.31)

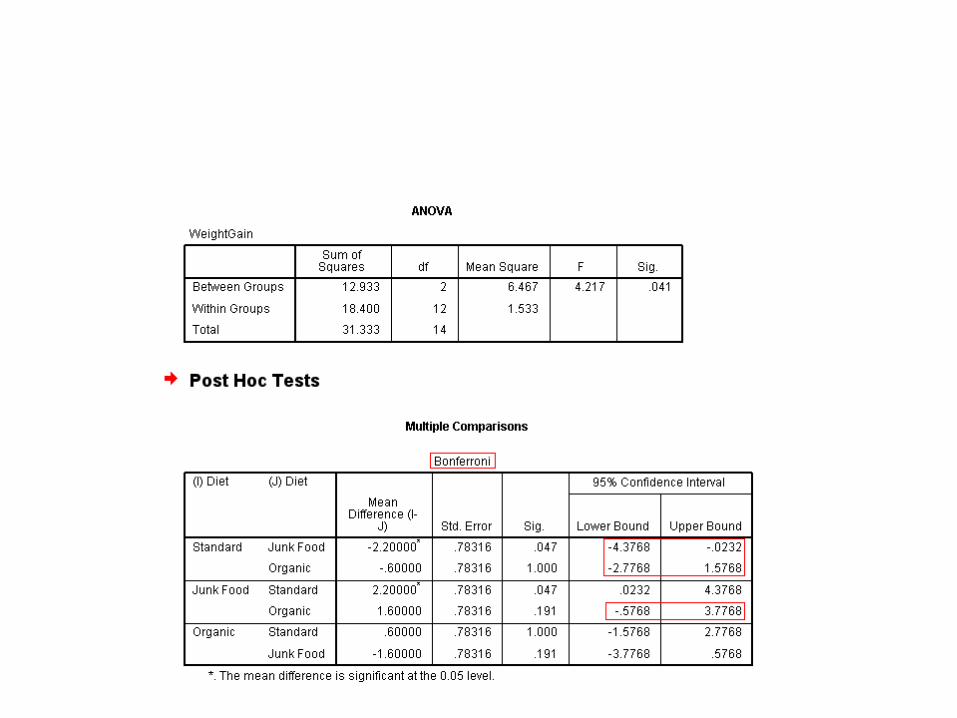
SPSS Output
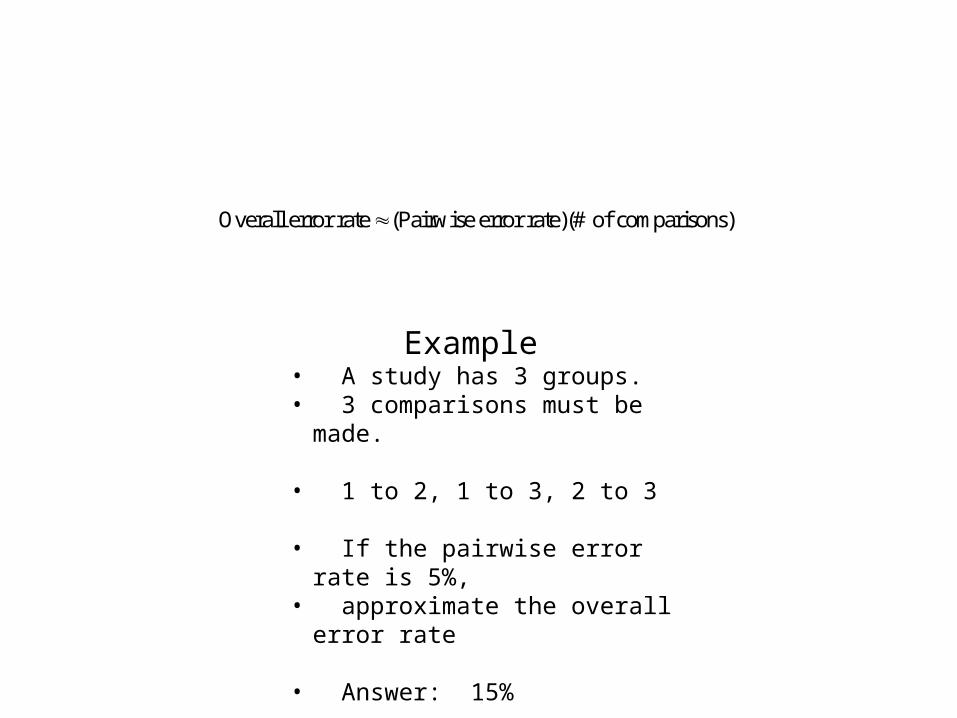
Bonferroni’s Correction
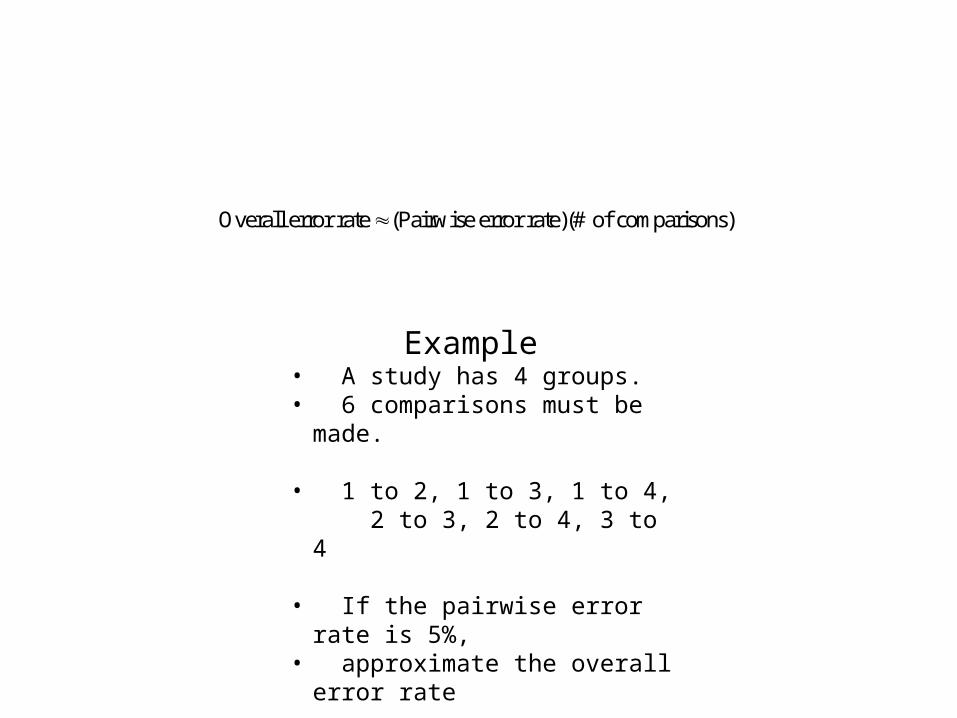
Overall error rate (Pairwise error rate)(# of comparisons)
Example• A study has 3 groups. • 3 comparisons must be made.
• 1 to 2, 1 to 3, 2 to 3
• If the pairwise error rate is 5%,• approximate the overall error rate
• Answer: 15%
Bonferroni’s Correction
Overall error rate (Pairwise error rate)(# of comparisons)
Example• A study has 4 groups. • 6 comparisons must be made.
• 1 to 2, 1 to 3, 1 to 4, 2 to 3, 2 to 4, 3 to 4
• If the pairwise error rate is 5%,• approximate the overall error rate
• Answer: 30%
Bonferroni’s Correction
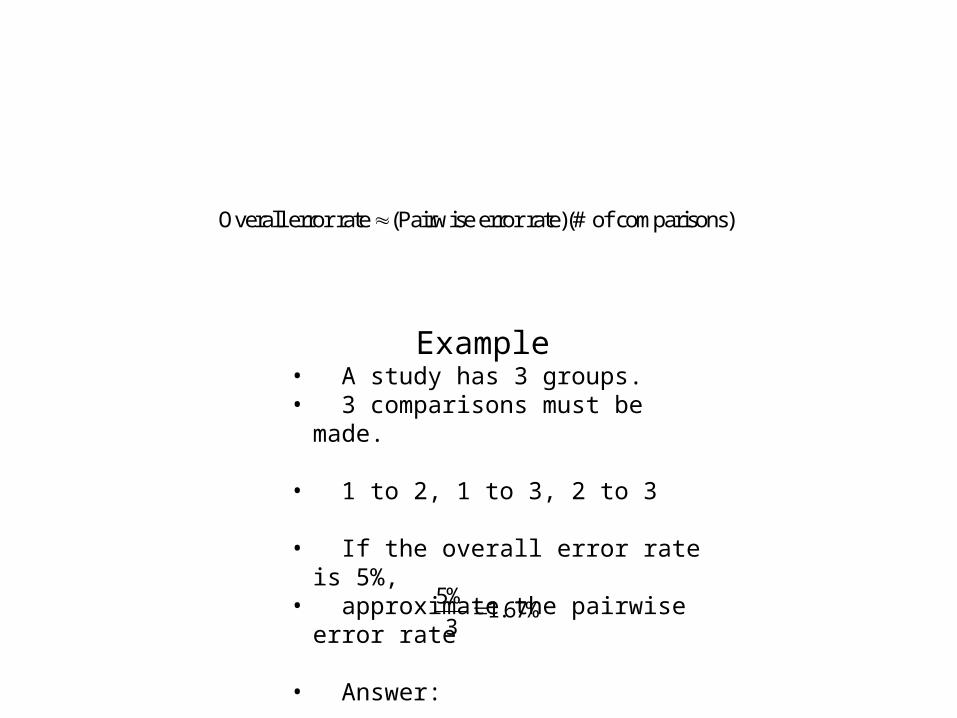
Overall error rate (Pairwise error rate)(# of comparisons)
Example• A study has 3 groups. • 3 comparisons must be made.
• 1 to 2, 1 to 3, 2 to 3
• If the overall error rate is 5%,• approximate the pairwise error rate
• Answer: 5%1.67%
3
Bonferroni’s Correction
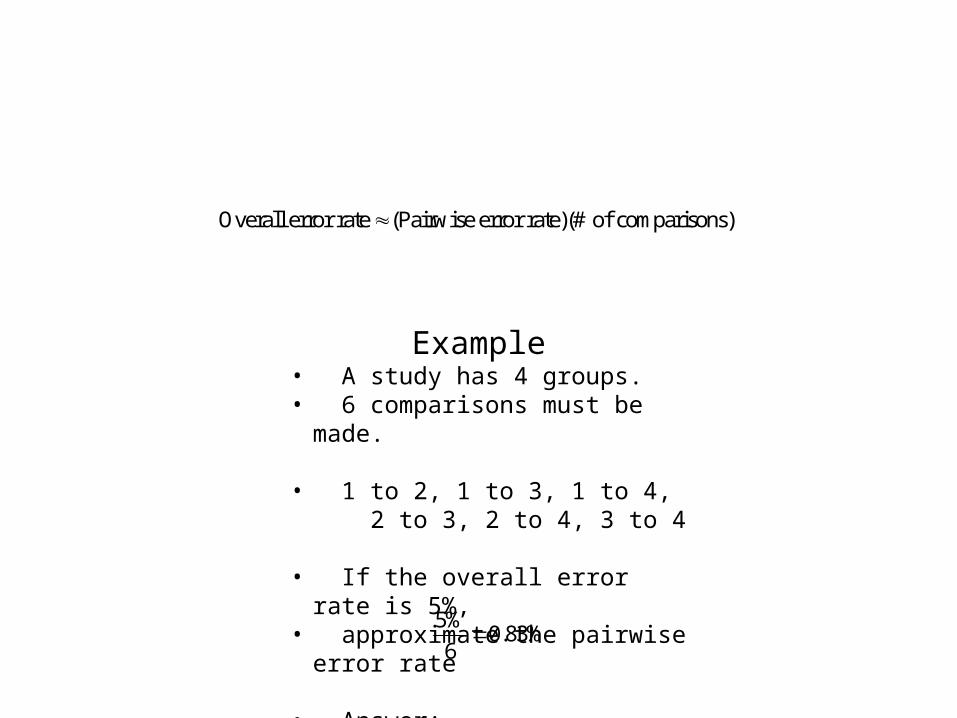
Overall error rate (Pairwise error rate)(# of comparisons)
Example• A study has 4 groups. • 6 comparisons must be made.
• 1 to 2, 1 to 3, 1 to 4, 2 to 3, 2 to 4, 3 to 4
• If the overall error rate is 5%,• approximate the pairwise error rate
• Answer:5%
0.83%6
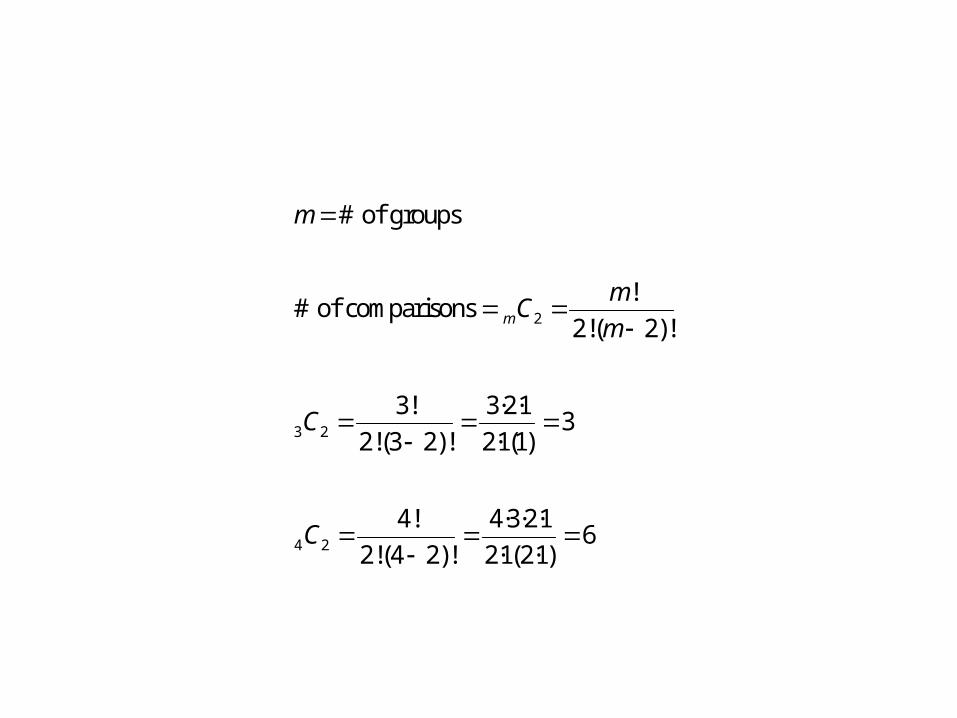
Formula for # of Comparisons
2
3 2
4 2
# of groups
!# of comparisons
2!( 2)!
3! ·2·13
2!(3 2)! ·1(1)
4! · ·2·16
2!(4
3
2
4
2)! ·1( ·1
3
2 2 )
m
mC
m
C
C
m
Post-hoc Confidence Intervals with Bonferroni’s Correction
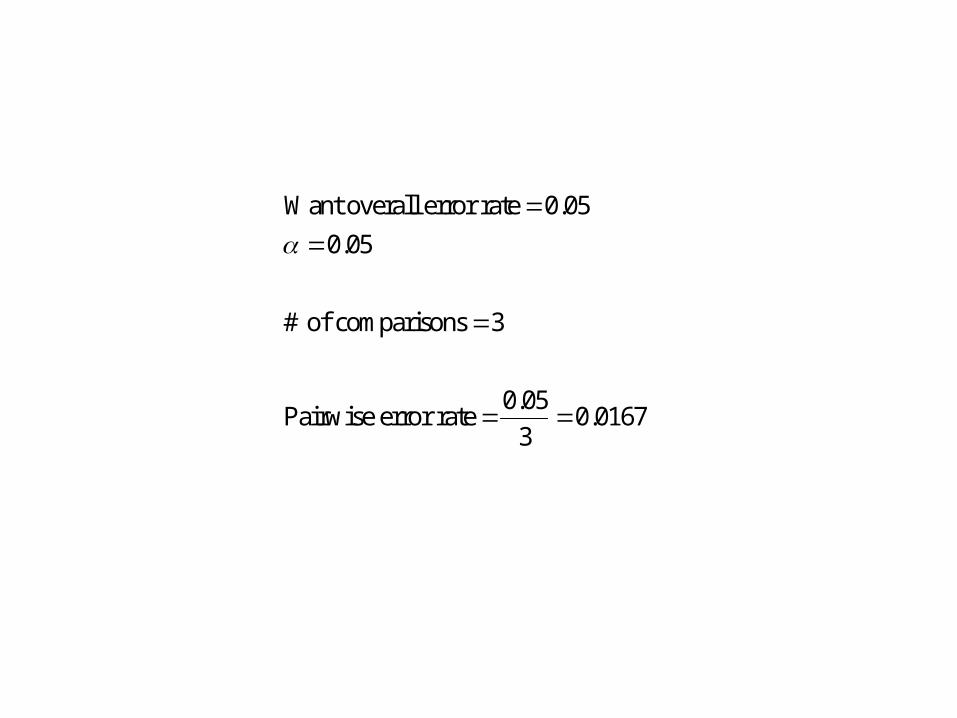
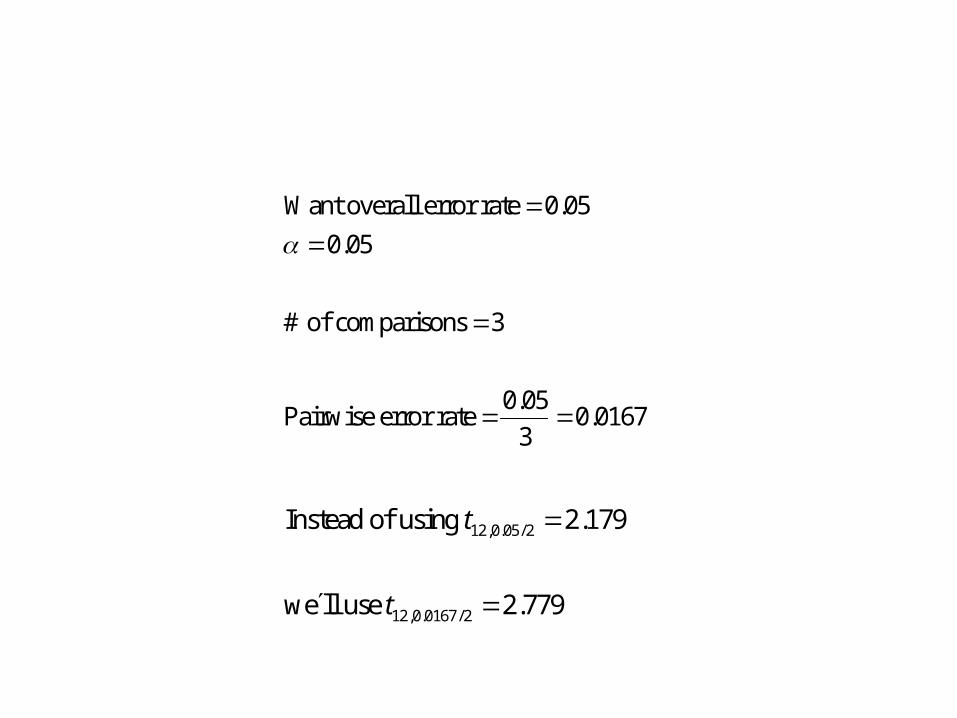
Want overall error rate 0.05
0.05
# of comparisons 3
0.05Pairwise error rate 0.0167
3
Post-hoc Confidence Intervals with Bonferroni’s Correction
Want overall error rate 0.05
0.05
# of comparisons 3
0.05Pairwise error rate 0.0167
3
12,0.05/2
12,0.0167/2
2.1Instead of using
we ll us
79
2. 7e 7 9
t
t
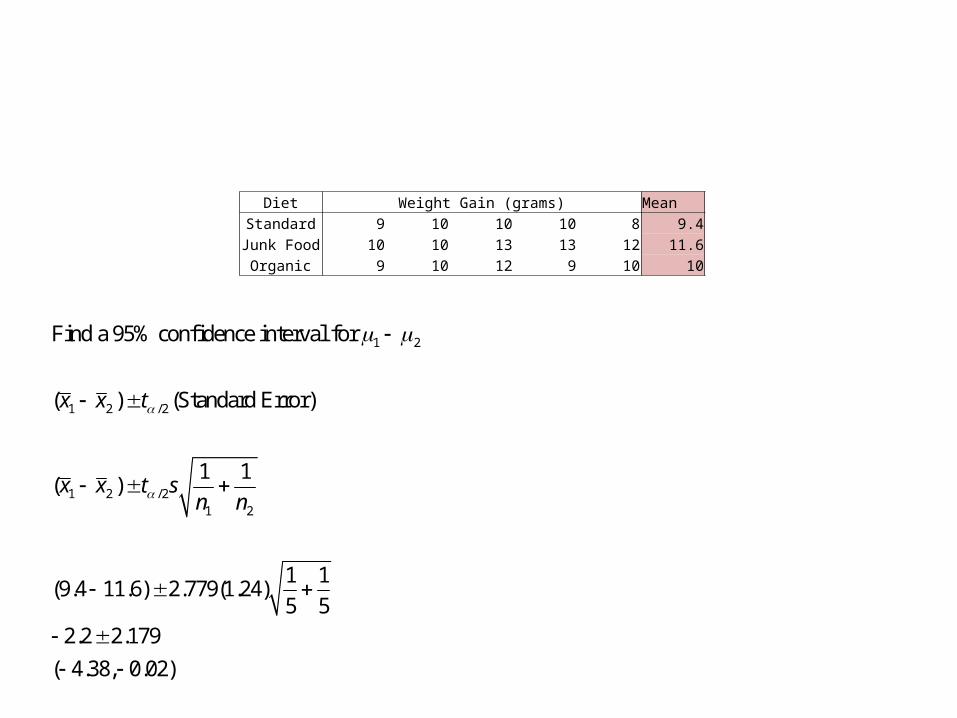
Post-hoc Confidence Intervals with Bonferroni’s Correction
Diet Weight Gain (grams) MeanStandard 9 10 10 10 8 9.4Junk Food 10 10 13 13 12 11.6
Organic 9 10 12 9 10 10
1 2
1 2 /2
1 2 /21 2
Find a 95% confidence interval for
) Standard Error)
1 1)
1 1(9.4 11.6) 2.779(1.24)
5 52.2 2.179
( 4.38, 0.
( (
02)
(
x x t
x x t sn n
SPSS Output

![High-Lard and High-Fish Oil Diets Differ in Their Effects …file.scirp.org/pdf/FNS_2013083015455426.pdfdoes not [1-3]. In addition, omega-3 polyunsaturated fatty acids (ω-3 PUFAs)](https://static.fdocument.org/doc/165x107/5ada9d2c7f8b9a86378d9725/high-lard-and-high-fish-oil-diets-differ-in-their-effects-filescirporgpdffns.jpg)


![Fundamental Properties and Optimal Gains of a Steady …file.scirp.org/pdf/ARS_2014061110444755.pdfK. Saho 64 1) Random velocity process noise model [7] [8]: let w(k) of Equation (1)](https://static.fdocument.org/doc/165x107/5af0ee227f8b9ad0618ebb8f/fundamental-properties-and-optimal-gains-of-a-steady-filescirporgpdfars.jpg)