Presented by - Philadelphia University Jordan | Home … 1.pdf · the matrix contains NAD+ and FAD...
71
Bioenergetics Presented by Dr. Mohammad Saadeh The requirements for the Pharmaceutical Biochemistry II Philadelphia University Faculty of pharmacy
Transcript of Presented by - Philadelphia University Jordan | Home … 1.pdf · the matrix contains NAD+ and FAD...
Bioenergetics
Presented by
Dr. Mohammad Saadeh
The requirements for the Pharmaceutical Biochemistry II
Philadelphia University
Faculty of pharmacy
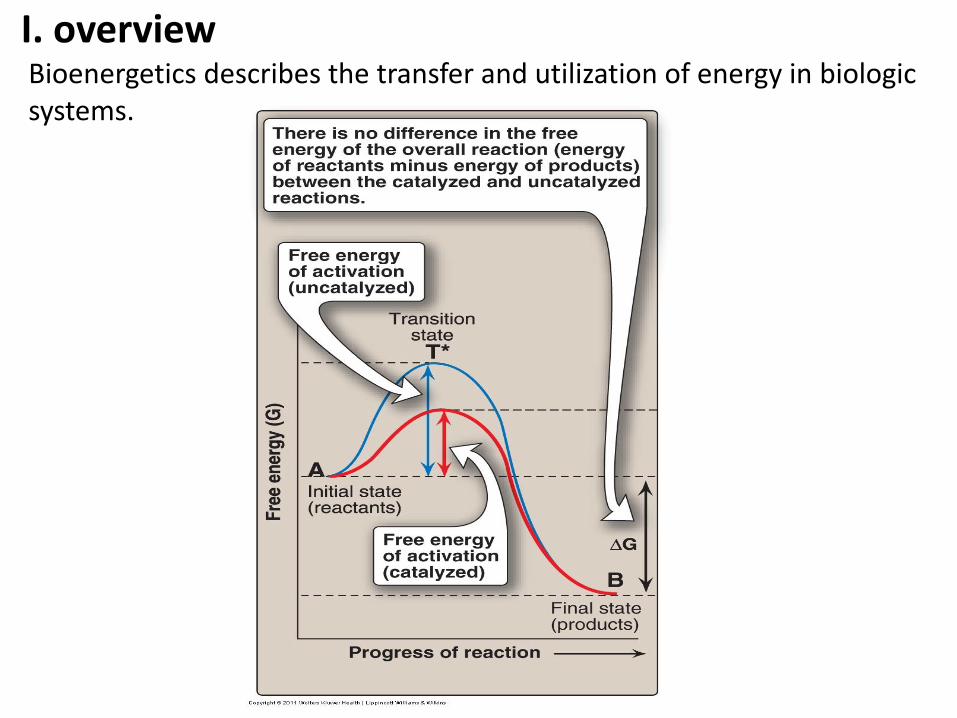
I. overview Bioenergetics describes the transfer and utilization of energy in biologic systems.
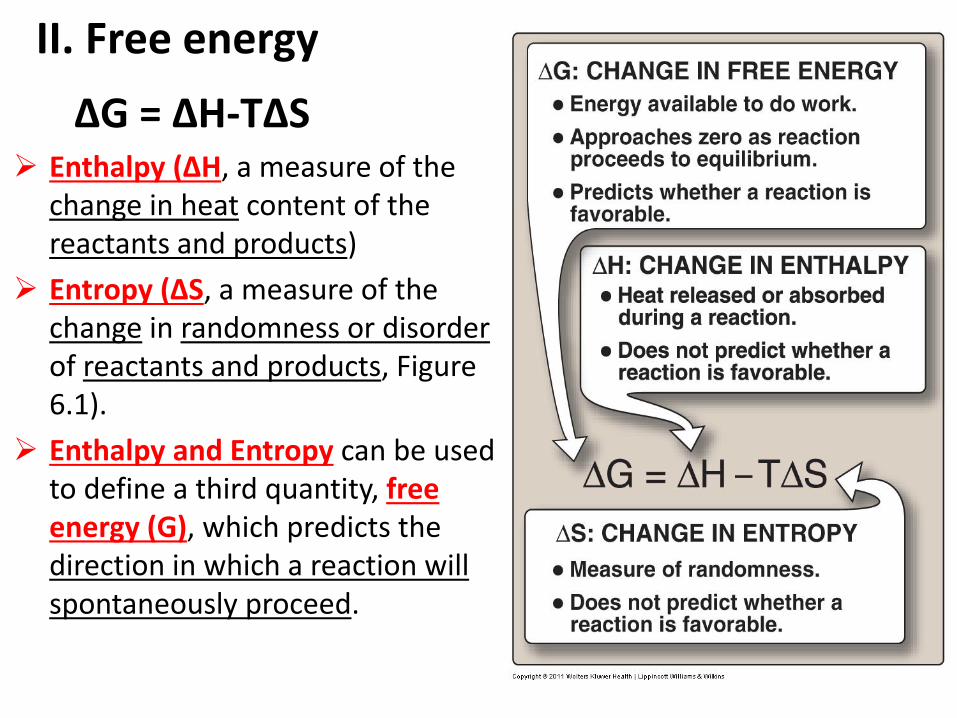
II. Free energy
∆G = ∆H-T∆S Enthalpy (ΔH, a measure of the
change in heat content of the reactants and products)
Entropy (ΔS, a measure of the change in randomness or disorder of reactants and products, Figure 6.1).
Enthalpy and Entropy can be used to define a third quantity, free energy (G), which predicts the direction in which a reaction will spontaneously proceed.
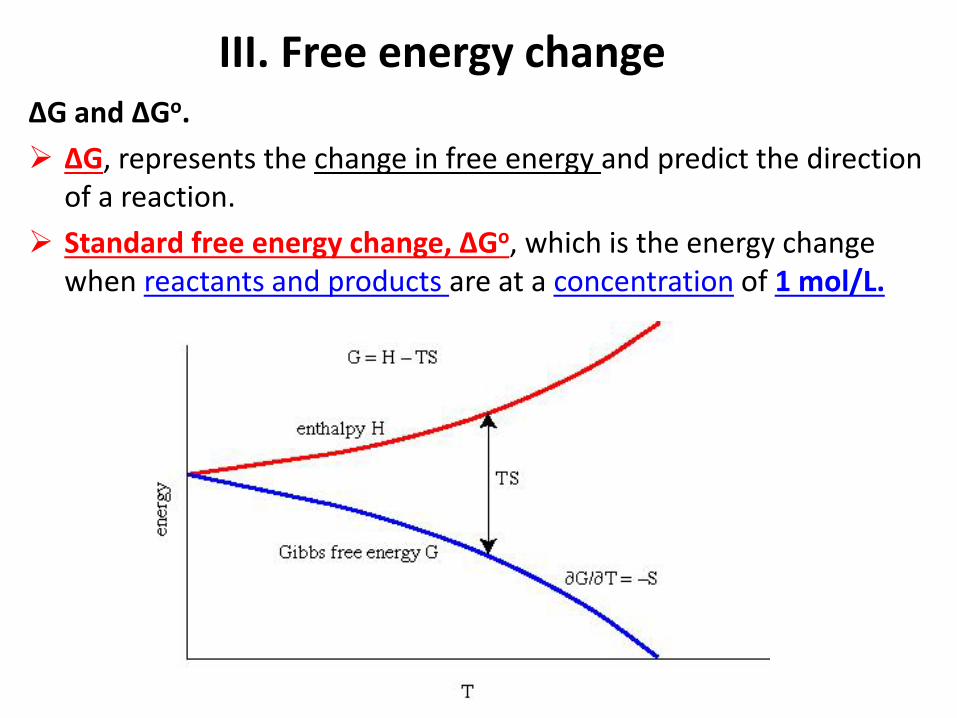
III. Free energy change
ΔG and ΔGo.
ΔG, represents the change in free energy and predict the direction of a reaction.
Standard free energy change, ΔGo, which is the energy change when reactants and products are at a concentration of 1 mol/L.
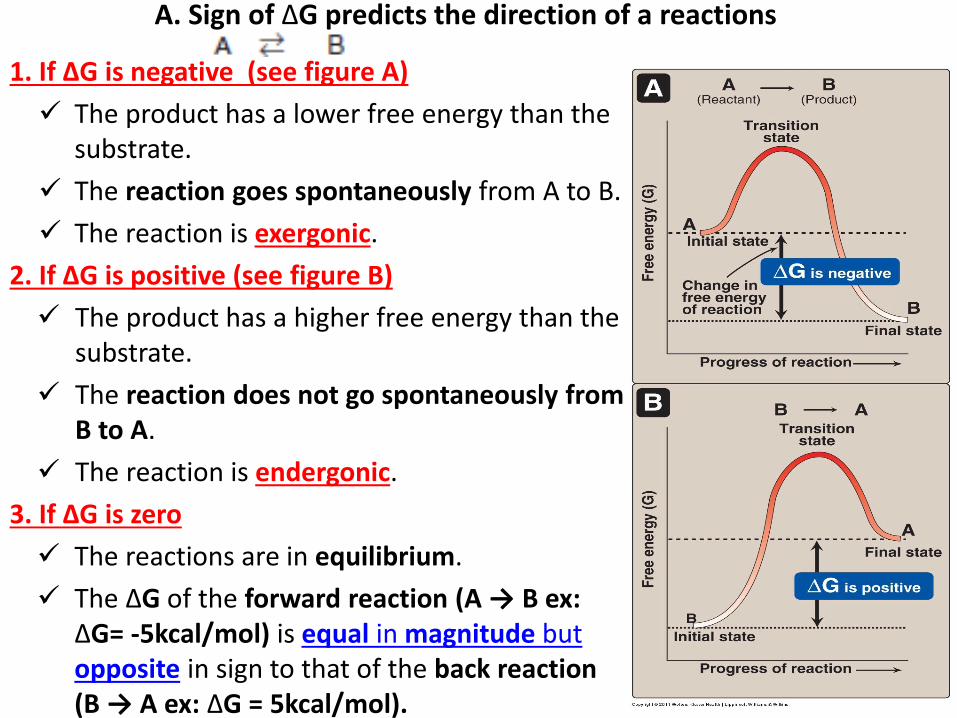
A. Sign of ΔG predicts the direction of a reactions
1. If ΔG is negative (see figure A)
The product has a lower free energy than the substrate.
The reaction goes spontaneously from A to B.
The reaction is exergonic.
2. If ΔG is positive (see figure B)
The product has a higher free energy than the substrate.
The reaction does not go spontaneously from B to A.
The reaction is endergonic.
3. If ΔG is zero
The reactions are in equilibrium.
The ΔG of the forward reaction (A → B ex: ΔG= -5kcal/mol) is equal in magnitude but opposite in sign to that of the back reaction (B → A ex: ΔG = 5kcal/mol).
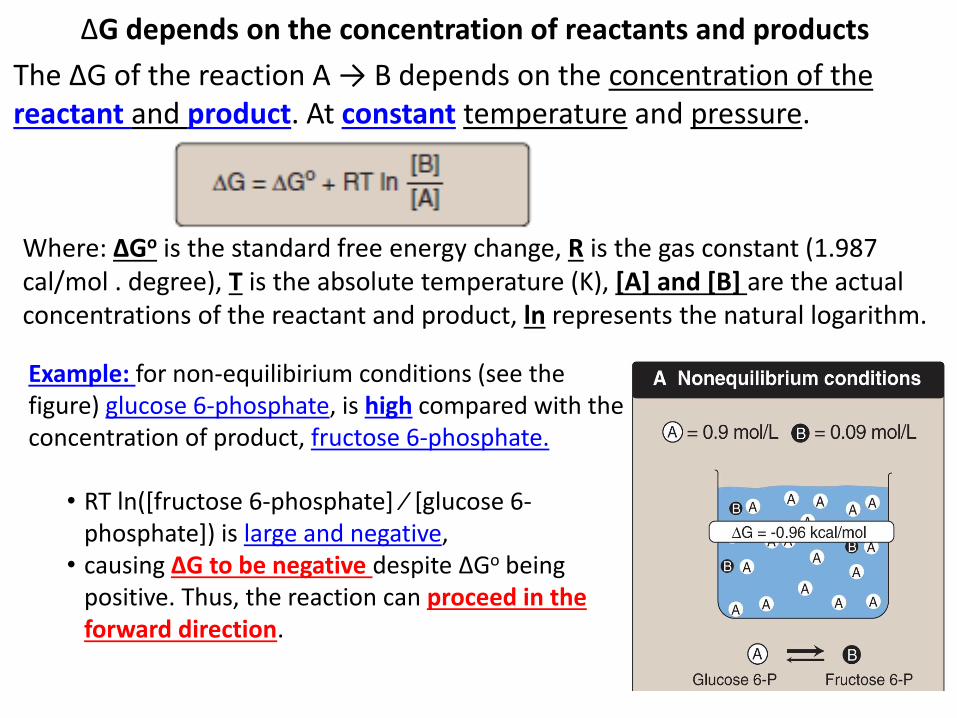
ΔG depends on the concentration of reactants and products
The ΔG of the reaction A → B depends on the concentration of the reactant and product. At constant temperature and pressure.
Where: ΔGo is the standard free energy change, R is the gas constant (1.987 cal/mol . degree), T is the absolute temperature (K), [A] and [B] are the actual concentrations of the reactant and product, ln represents the natural logarithm.
Example: for non-equilibirium conditions (see the figure) glucose 6-phosphate, is high compared with the concentration of product, fructose 6-phosphate.
• RT ln([fructose 6-phosphate] ⁄ [glucose 6-phosphate]) is large and negative,
• causing ΔG to be negative despite ΔGo being positive. Thus, the reaction can proceed in the forward direction.
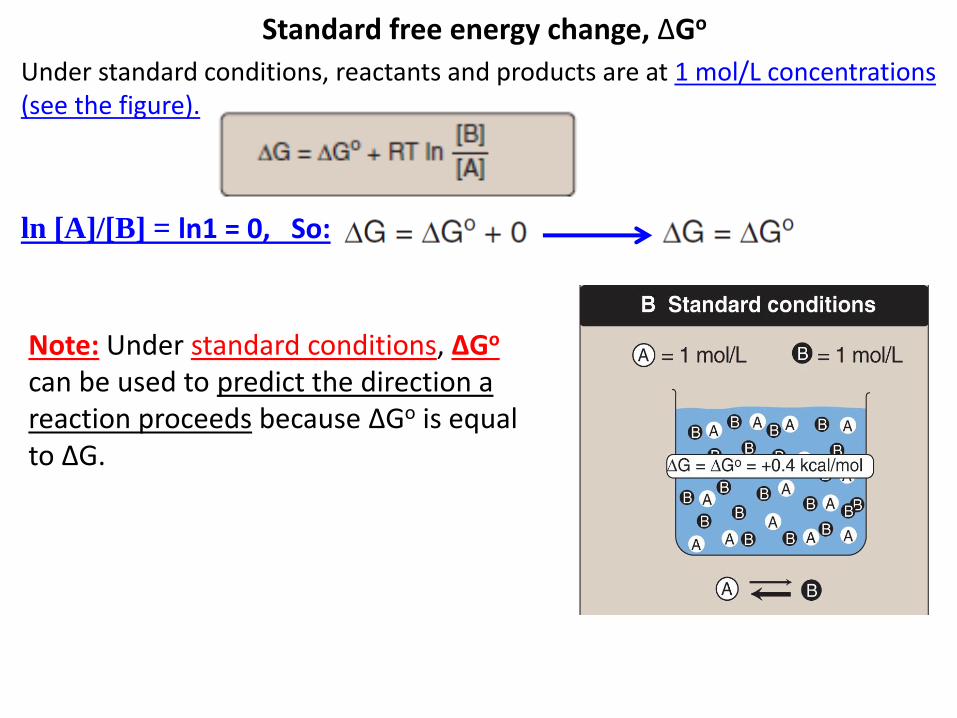
Standard free energy change, ΔGo
Under standard conditions, reactants and products are at 1 mol/L concentrations (see the figure).
ln [A]/[B] = ln1 = 0, So:
Note: Under standard conditions, ΔGo can be used to predict the direction a reaction proceeds because ΔGo is equal to ΔG.
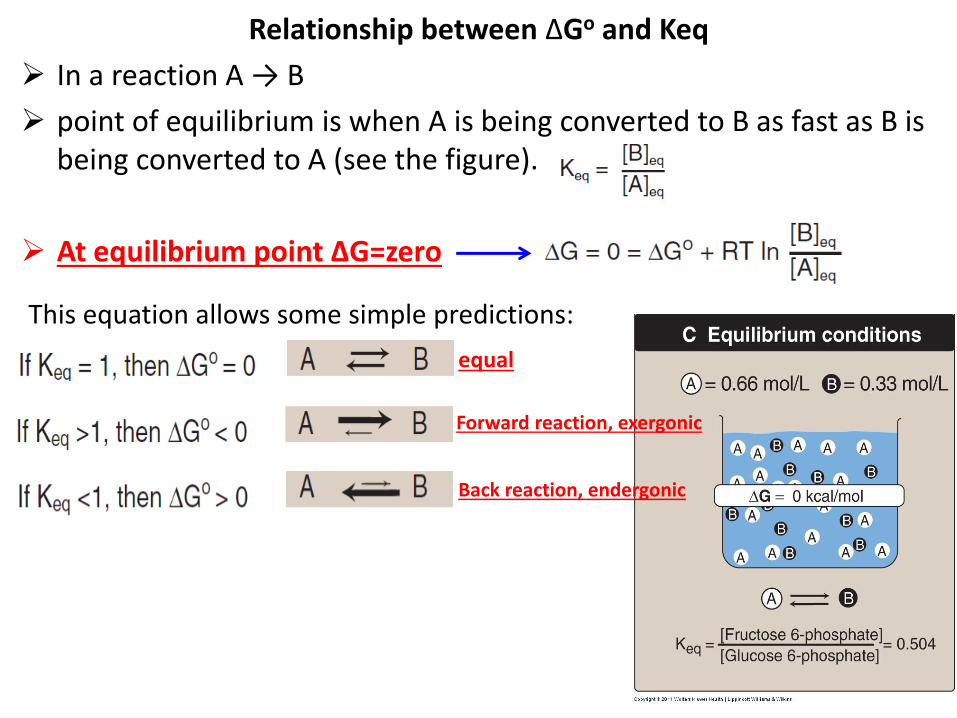
Relationship between ΔGo and Keq
In a reaction A → B
point of equilibrium is when A is being converted to B as fast as B is being converted to A (see the figure).
At equilibrium point ∆G=zero
equal
Forward reaction, exergonic
Back reaction, endergonic
This equation allows some simple predictions:
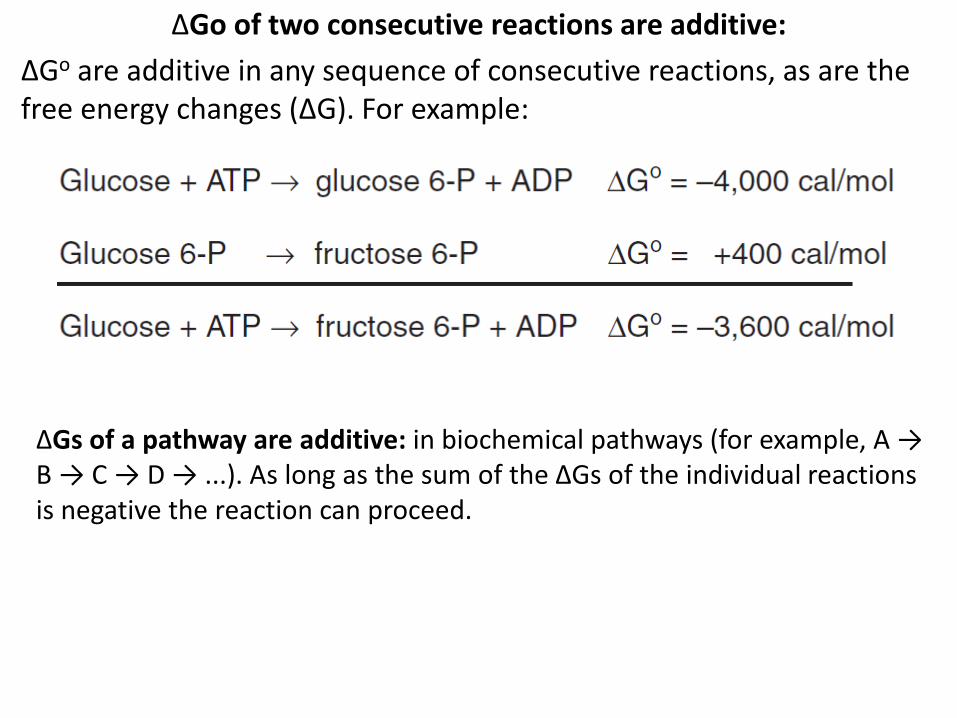
ΔGo of two consecutive reactions are additive:
ΔGo are additive in any sequence of consecutive reactions, as are the free energy changes (ΔG). For example:
ΔGs of a pathway are additive: in biochemical pathways (for example, A → B → C → D → ...). As long as the sum of the ΔGs of the individual reactions is negative the reaction can proceed.
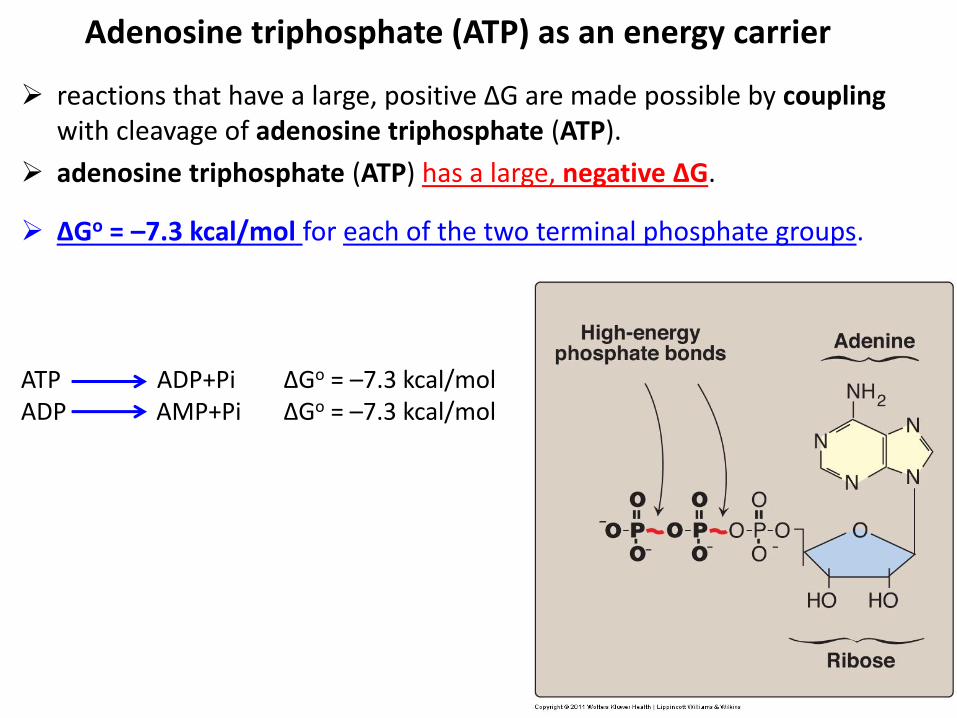
reactions that have a large, positive ΔG are made possible by coupling with cleavage of adenosine triphosphate (ATP).
adenosine triphosphate (ATP) has a large, negative ΔG.
Adenosine triphosphate (ATP) as an energy carrier
ΔGo = –7.3 kcal/mol for each of the two terminal phosphate groups.
ATP ADP+Pi ΔGo = –7.3 kcal/mol ADP AMP+Pi ΔGo = –7.3 kcal/mol
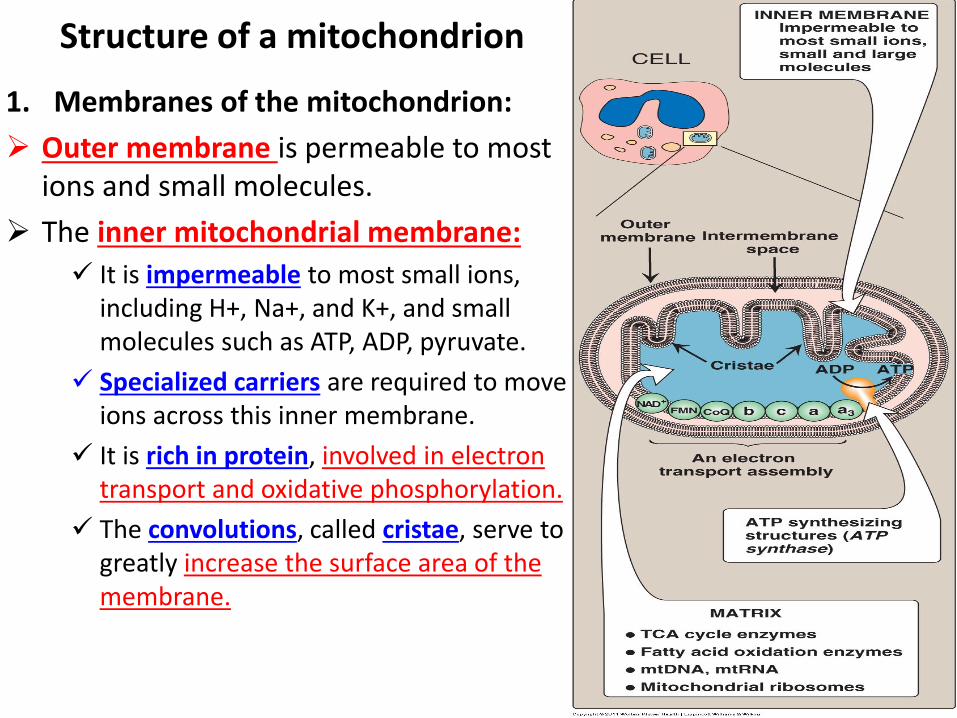
Structure of a mitochondrion
1. Membranes of the mitochondrion:
Outer membrane is permeable to most ions and small molecules.
The inner mitochondrial membrane:
It is impermeable to most small ions, including H+, Na+, and K+, and small molecules such as ATP, ADP, pyruvate.
Specialized carriers are required to move ions across this inner membrane.
It is rich in protein, involved in electron transport and oxidative phosphorylation.
The convolutions, called cristae, serve to greatly increase the surface area of the membrane.
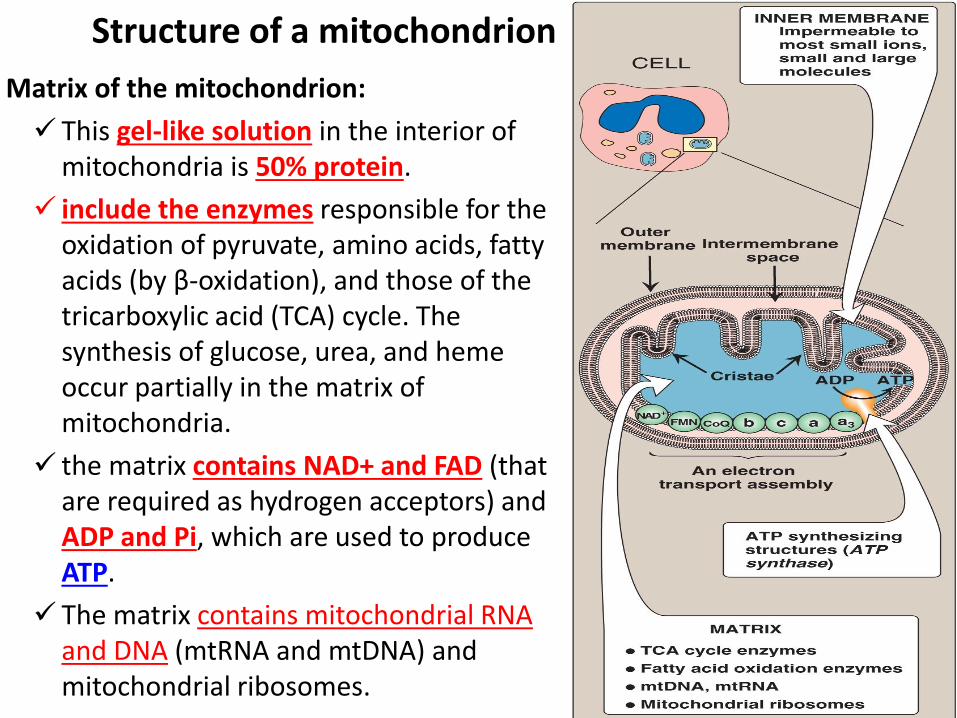
Structure of a mitochondrion
Matrix of the mitochondrion:
This gel-like solution in the interior of mitochondria is 50% protein.
include the enzymes responsible for the oxidation of pyruvate, amino acids, fatty acids (by β-oxidation), and those of the tricarboxylic acid (TCA) cycle. The synthesis of glucose, urea, and heme occur partially in the matrix of mitochondria.
the matrix contains NAD+ and FAD (that are required as hydrogen acceptors) and ADP and Pi, which are used to produce ATP.
The matrix contains mitochondrial RNA and DNA (mtRNA and mtDNA) and mitochondrial ribosomes.
Introduction to Carbohydrates
Presented by
Dr. Mohammad Saadeh
The requirements for the Pharmaceutical Biochemistry II
Philadelphia University
Faculty of pharmacy
I. overview Carbohydrates are the most abundant organic molecules in nature.
They have a wide range of functions:
1. Providing a dietary calories for most organisms.
2. Storage energy in the body,
3. Cell membrane components that mediate some forms of intercellular communication.
4. Structural component of many organisms, including (the cell walls of bacteria, exoskeleton of many insects, fibrous cellulose of plants.
The empiric formula for many of the simpler carbohydrates is (CH2O)n, where n ≥ 3 hence the name “hydrate of carbon.”
Classification and structure of carbohydrates
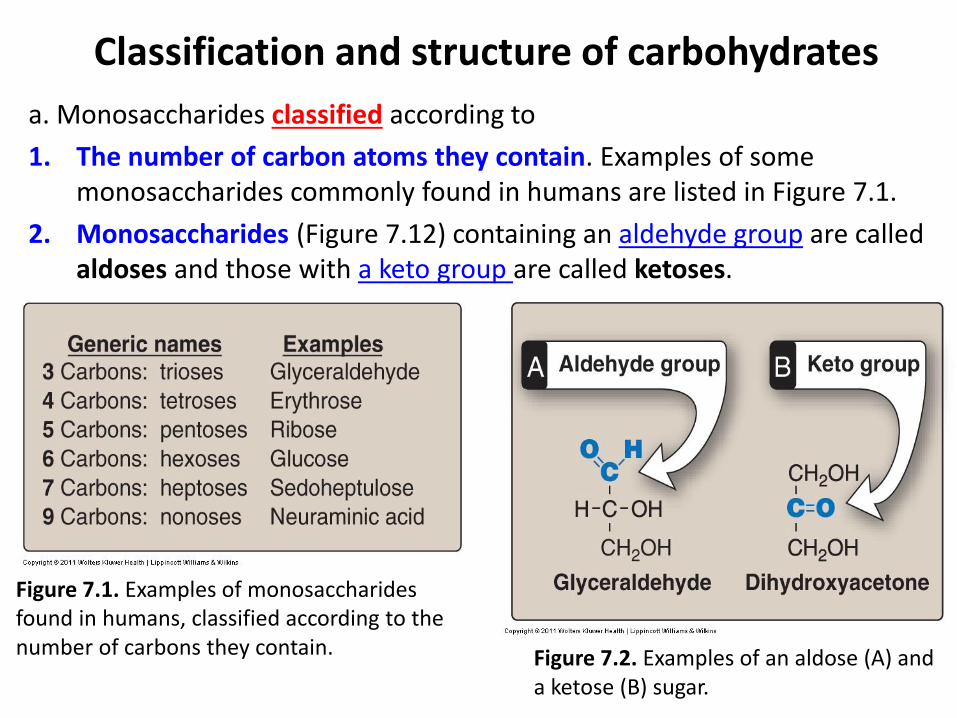
a. Monosaccharides classified according to
1. The number of carbon atoms they contain. Examples of some monosaccharides commonly found in humans are listed in Figure 7.1.
2. Monosaccharides (Figure 7.12) containing an aldehyde group are called aldoses and those with a keto group are called ketoses.
Figure 7.1. Examples of monosaccharides found in humans, classified according to the number of carbons they contain. Figure 7.2. Examples of an aldose (A) and
a ketose (B) sugar.
Classification and structure of carbohydrates
Monosaccharides can be linked by glyosidic bonds to create larger structures.
A. Disaccharides contain two mono saccharide units.
B. Oligosaccharides contain from 3-10 monosaccharide units.
C. Polysaccharides contain > 10 monosaccharide units, and can be hundreds of sugar units in length.
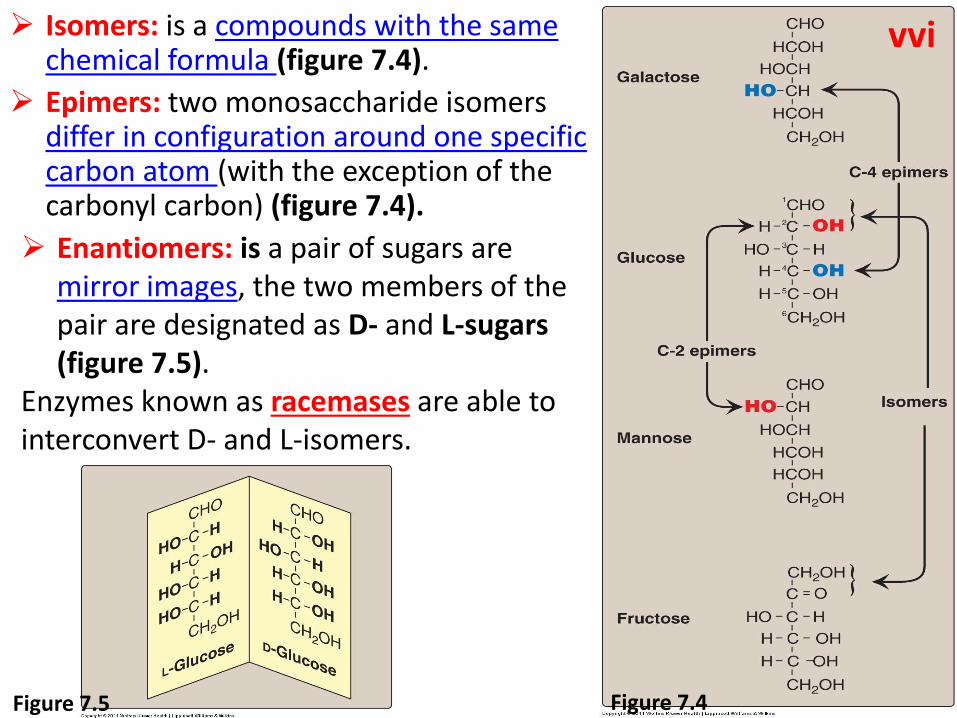
Isomers: is a compounds with the same chemical formula (figure 7.4).
Epimers: two monosaccharide isomers differ in configuration around one specific carbon atom (with the exception of the carbonyl carbon) (figure 7.4).
Enantiomers: is a pair of sugars are mirror images, the two members of the pair are designated as D- and L-sugars (figure 7.5).
Enzymes known as racemases are able to interconvert D- and L-isomers.
Figure 7.4 Figure 7.5
vvi
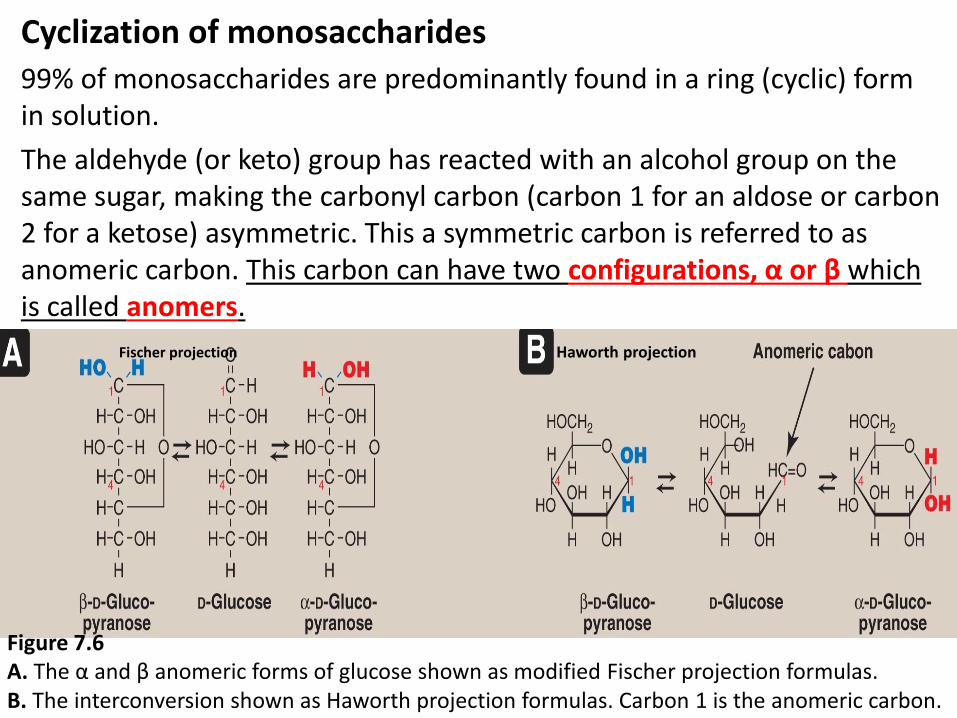
Cyclization of monosaccharides
99% of monosaccharides are predominantly found in a ring (cyclic) form in solution.
The aldehyde (or keto) group has reacted with an alcohol group on the same sugar, making the carbonyl carbon (carbon 1 for an aldose or carbon 2 for a ketose) asymmetric. This a symmetric carbon is referred to as anomeric carbon. This carbon can have two configurations, α or β which is called anomers.
Figure 7.6 A. The α and β anomeric forms of glucose shown as modified Fischer projection formulas. B. The interconversion shown as Haworth projection formulas. Carbon 1 is the anomeric carbon.
Fischer projection Haworth projection
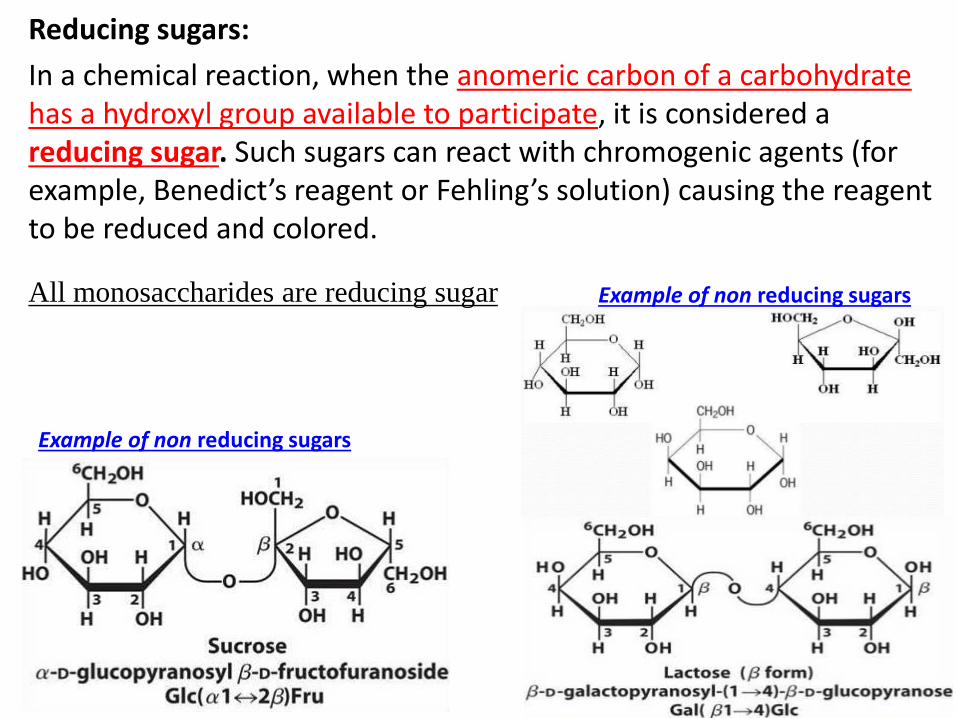
Reducing sugars:
In a chemical reaction, when the anomeric carbon of a carbohydrate has a hydroxyl group available to participate, it is considered a reducing sugar. Such sugars can react with chromogenic agents (for example, Benedict’s reagent or Fehling’s solution) causing the reagent to be reduced and colored.
All monosaccharides are reducing sugar
Example of non reducing sugars
Example of non reducing sugars
Example of disaccharides: Lactose (galactose + glucose)
sucrose (glucose + fructose)
Maltose ( glucose + glucose)
Example of polysaccharides: glycogen: animal branched poly glucose
Starch: plant branched poly glucose
Cellulose: plant unbranched poly glucose
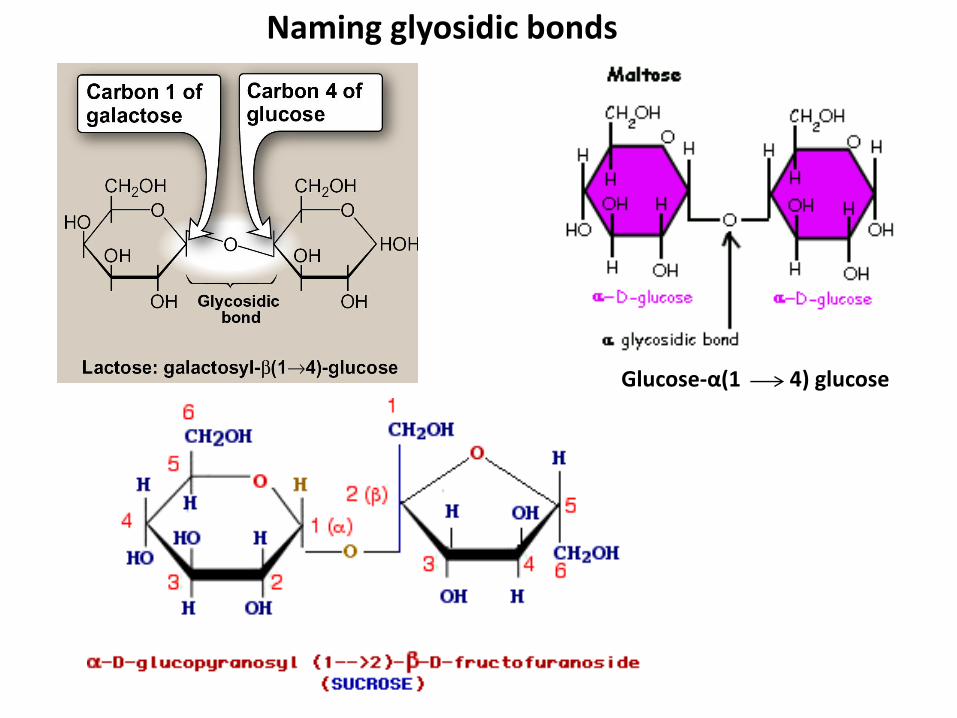
Naming glyosidic bonds
Glucose-α(1 4) glucose
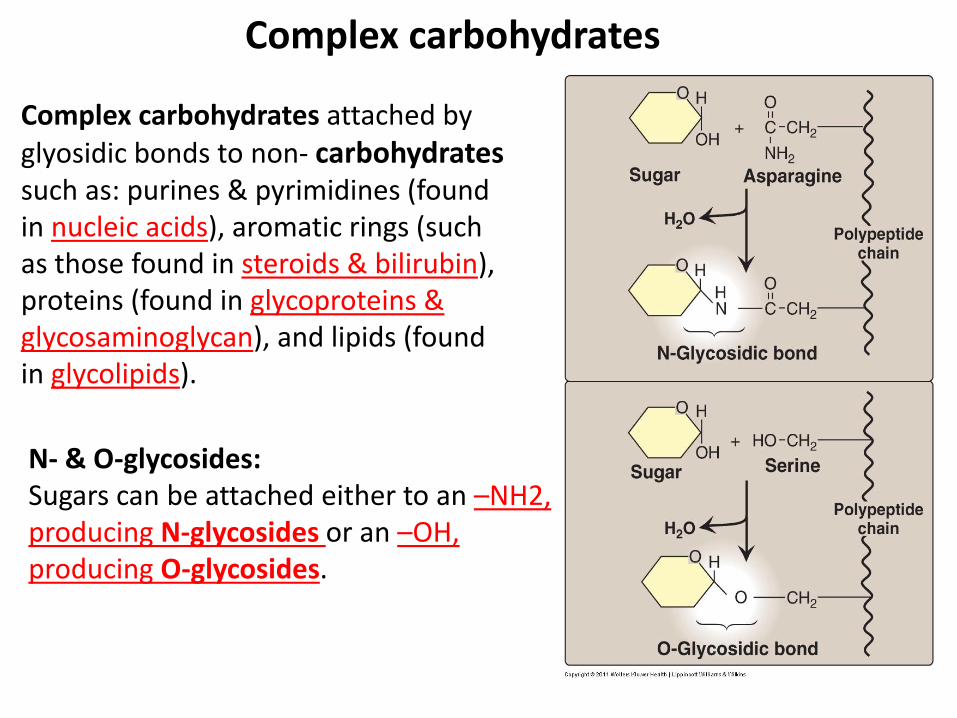
Complex carbohydrates
Complex carbohydrates attached by glyosidic bonds to non- carbohydrates such as: purines & pyrimidines (found in nucleic acids), aromatic rings (such as those found in steroids & bilirubin), proteins (found in glycoproteins & glycosaminoglycan), and lipids (found in glycolipids).
N- & O-glycosides: Sugars can be attached either to an –NH2, producing N-glycosides or an –OH, producing O-glycosides.
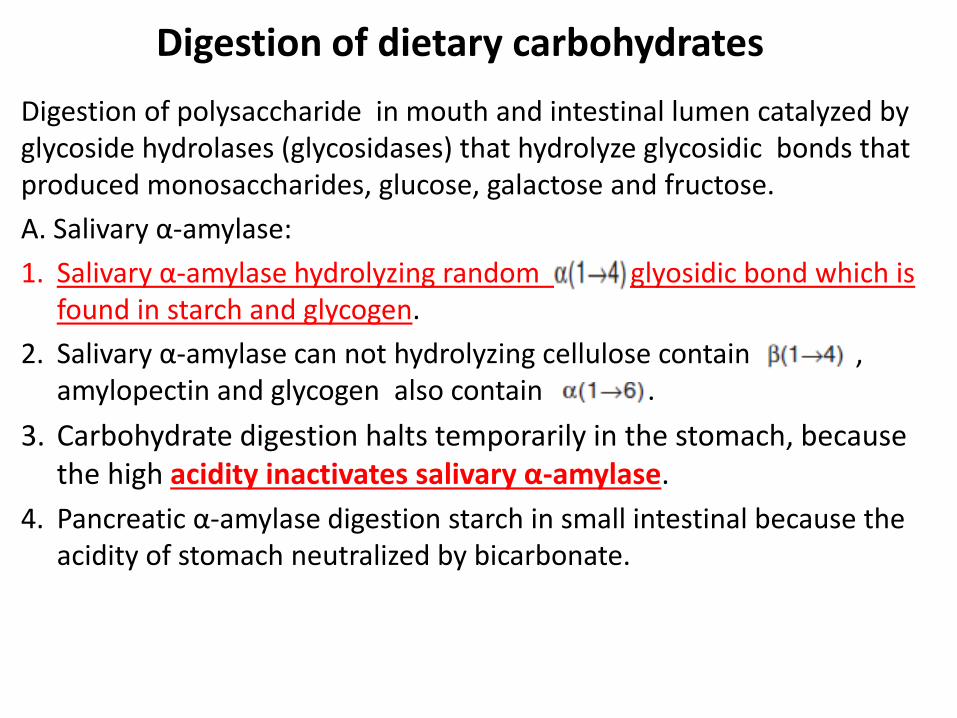
Digestion of dietary carbohydrates
Digestion of polysaccharide in mouth and intestinal lumen catalyzed by glycoside hydrolases (glycosidases) that hydrolyze glycosidic bonds that produced monosaccharides, glucose, galactose and fructose.
A. Salivary α-amylase:
1. Salivary α-amylase hydrolyzing random glyosidic bond which is found in starch and glycogen.
2. Salivary α-amylase can not hydrolyzing cellulose contain , , amylopectin and glycogen also contain .
3. Carbohydrate digestion halts temporarily in the stomach, because the high acidity inactivates salivary α-amylase.
4. Pancreatic α-amylase digestion starch in small intestinal because the acidity of stomach neutralized by bicarbonate.
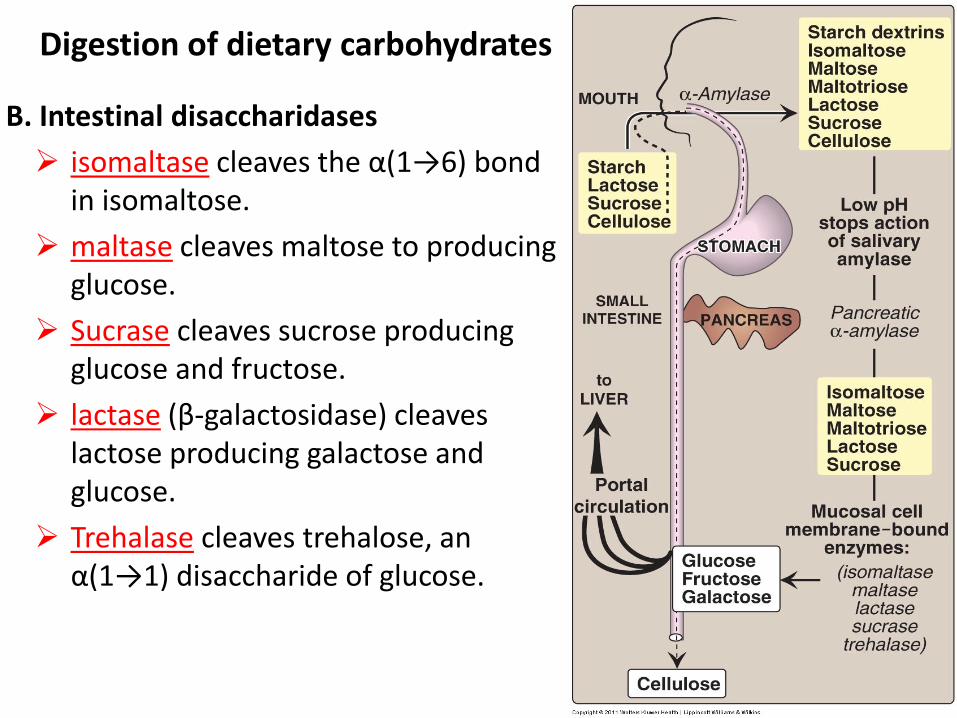
B. Intestinal disaccharidases
isomaltase cleaves the α(1→6) bond in isomaltose.
maltase cleaves maltose to producing glucose.
Sucrase cleaves sucrose producing glucose and fructose.
lactase (β-galactosidase) cleaves lactose producing galactose and glucose.
Trehalase cleaves trehalose, an α(1→1) disaccharide of glucose.
Digestion of dietary carbohydrates
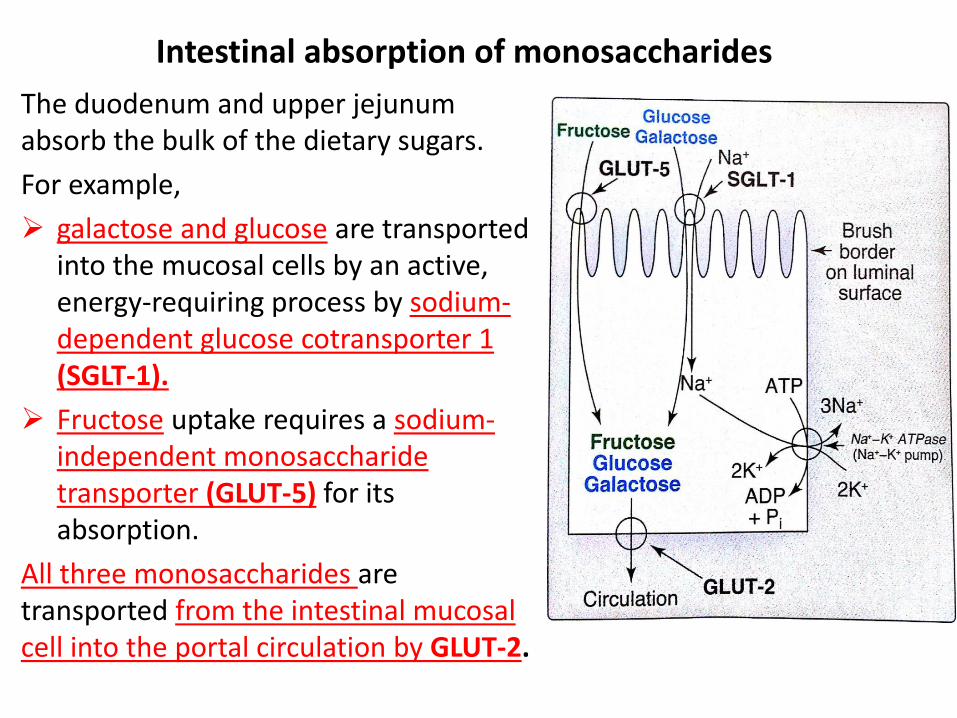
The duodenum and upper jejunum absorb the bulk of the dietary sugars.
For example,
galactose and glucose are transported into the mucosal cells by an active, energy-requiring process by sodium-dependent glucose cotransporter 1 (SGLT-1).
Fructose uptake requires a sodium-independent monosaccharide transporter (GLUT-5) for its absorption.
All three monosaccharides are transported from the intestinal mucosal cell into the portal circulation by GLUT-2.
Intestinal absorption of monosaccharides
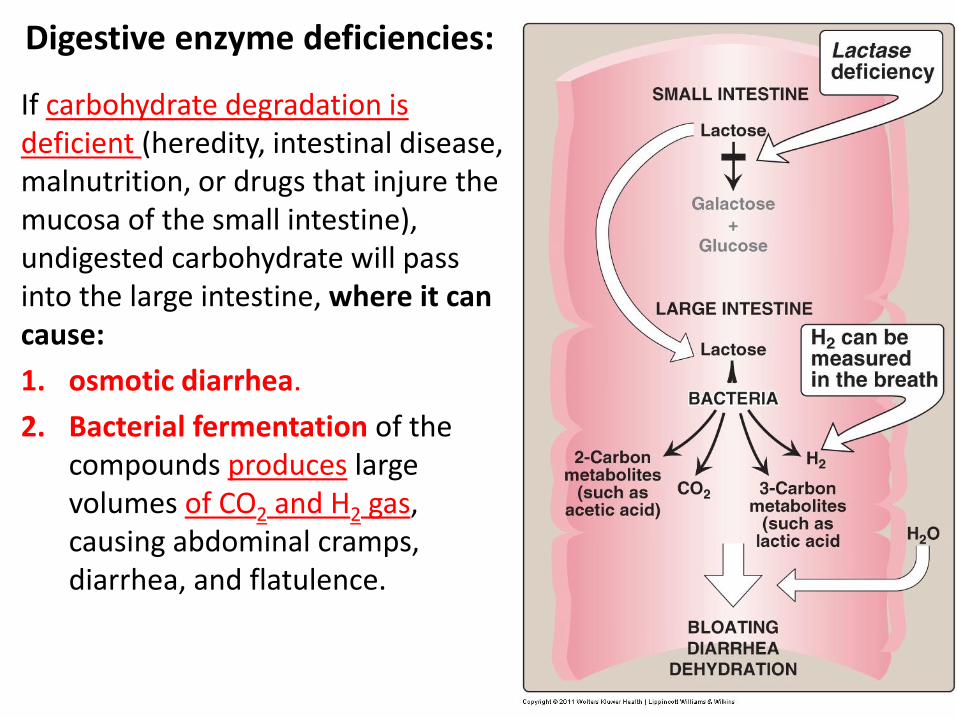
If carbohydrate degradation is deficient (heredity, intestinal disease, malnutrition, or drugs that injure the mucosa of the small intestine), undigested carbohydrate will pass into the large intestine, where it can cause:
1. osmotic diarrhea.
2. Bacterial fermentation of the compounds produces large volumes of CO2 and H2 gas, causing abdominal cramps, diarrhea, and flatulence.
Digestive enzyme deficiencies:
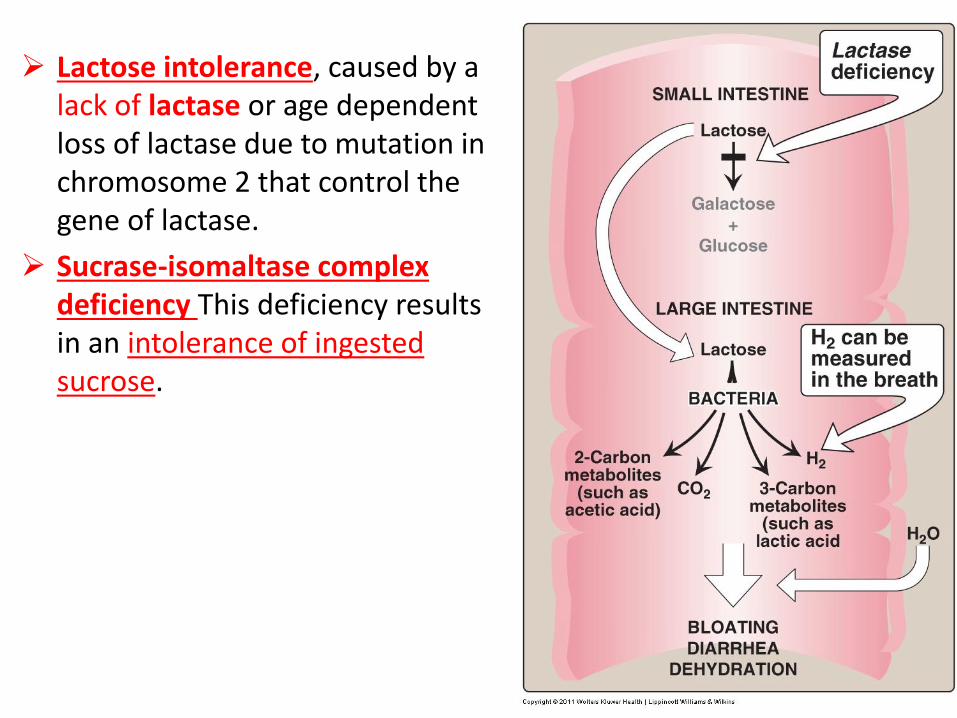
Lactose intolerance, caused by a lack of lactase or age dependent loss of lactase due to mutation in chromosome 2 that control the gene of lactase.
Sucrase-isomaltase complex deficiency This deficiency results in an intolerance of ingested sucrose.
Introduction to Metabolism and Glycolysis
Presented by
Dr. Mohammad Saadeh
The requirements for the Pharmaceutical Biochemistry II
Philadelphia University
Faculty of pharmacy
Introduction to Metabolism
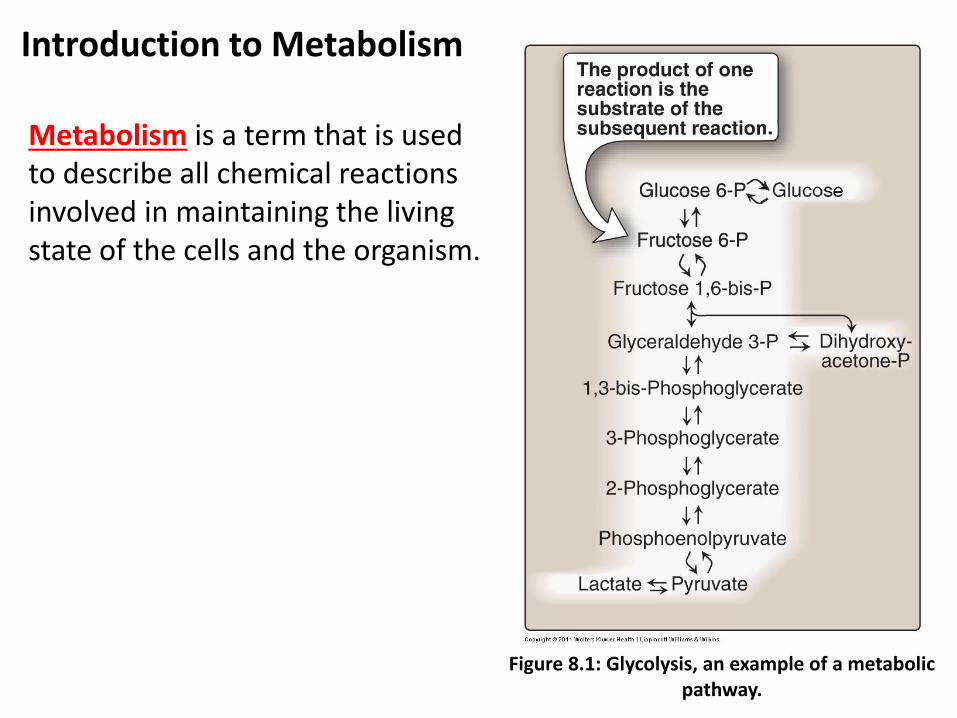
Metabolism is a term that is used to describe all chemical reactions involved in maintaining the living state of the cells and the organism.
Figure 8.1: Glycolysis, an example of a metabolic pathway.
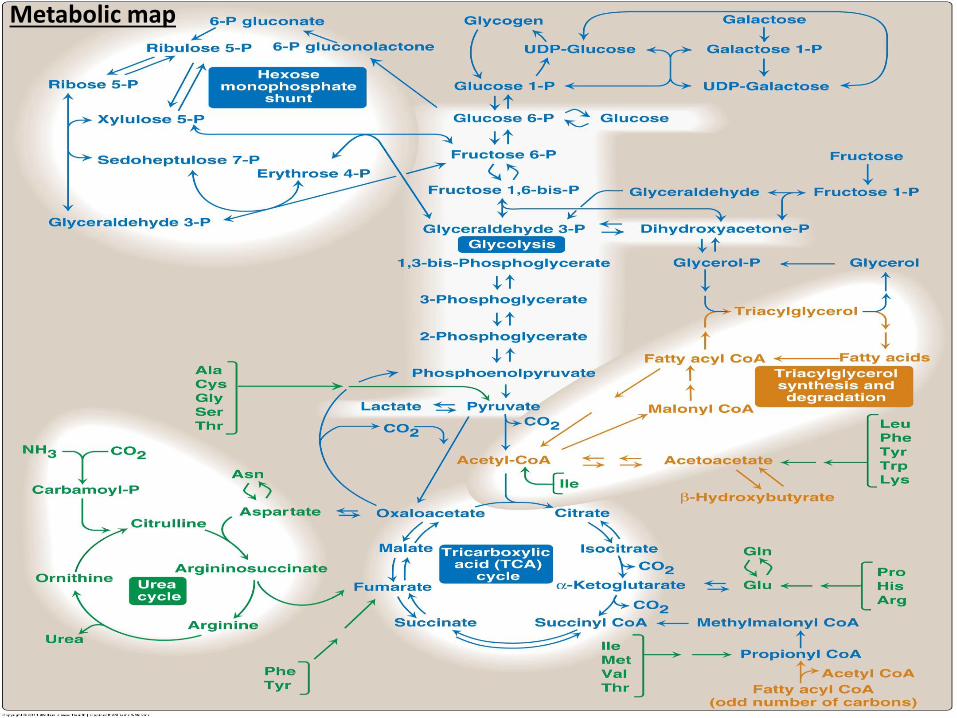
Metabolic map
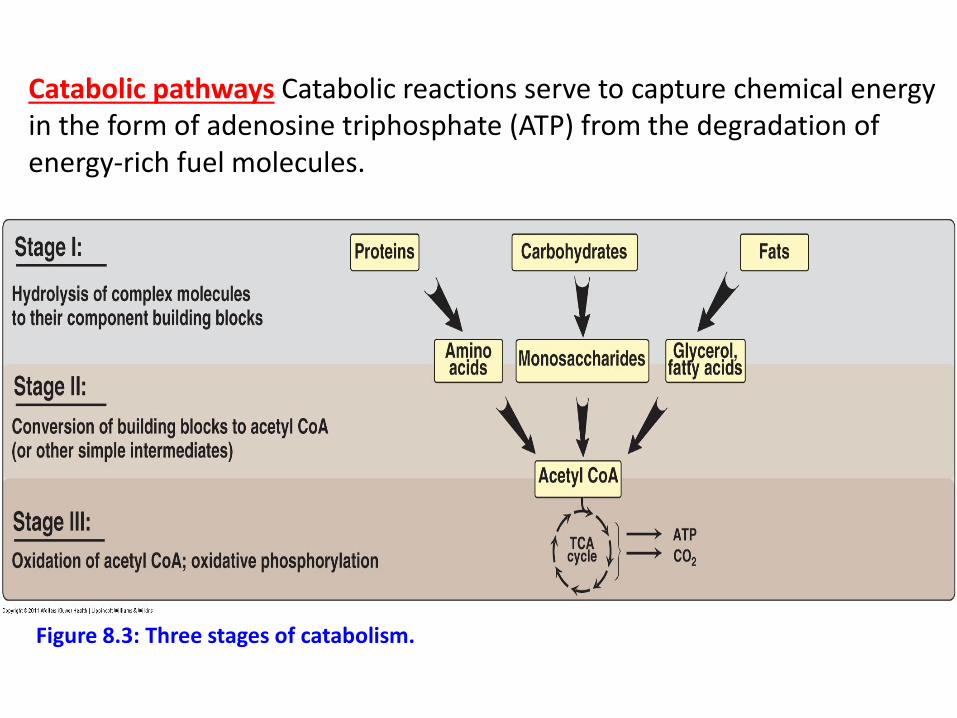
Catabolic pathways Catabolic reactions serve to capture chemical energy in the form of adenosine triphosphate (ATP) from the degradation of energy-rich fuel molecules.
Figure 8.3: Three stages of catabolism.
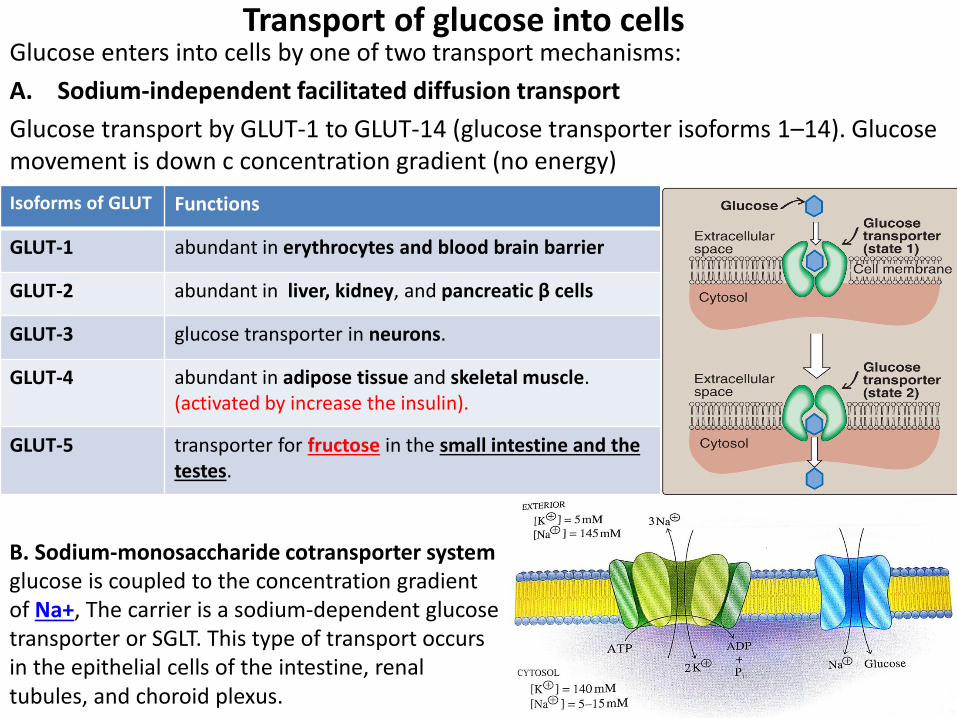
Transport of glucose into cells Glucose enters into cells by one of two transport mechanisms:
A. Sodium-independent facilitated diffusion transport
Glucose transport by GLUT-1 to GLUT-14 (glucose transporter isoforms 1–14). Glucose movement is down c concentration gradient (no energy)
Functions Isoforms of GLUT
abundant in erythrocytes and blood brain barrier GLUT-1
abundant in liver, kidney, and pancreatic β cells GLUT-2
glucose transporter in neurons. GLUT-3
abundant in adipose tissue and skeletal muscle. (activated by increase the insulin).
GLUT-4
transporter for fructose in the small intestine and the testes.
GLUT-5
B. Sodium-monosaccharide cotransporter system glucose is coupled to the concentration gradient of Na+, The carrier is a sodium-dependent glucose transporter or SGLT. This type of transport occurs in the epithelial cells of the intestine, renal tubules, and choroid plexus.
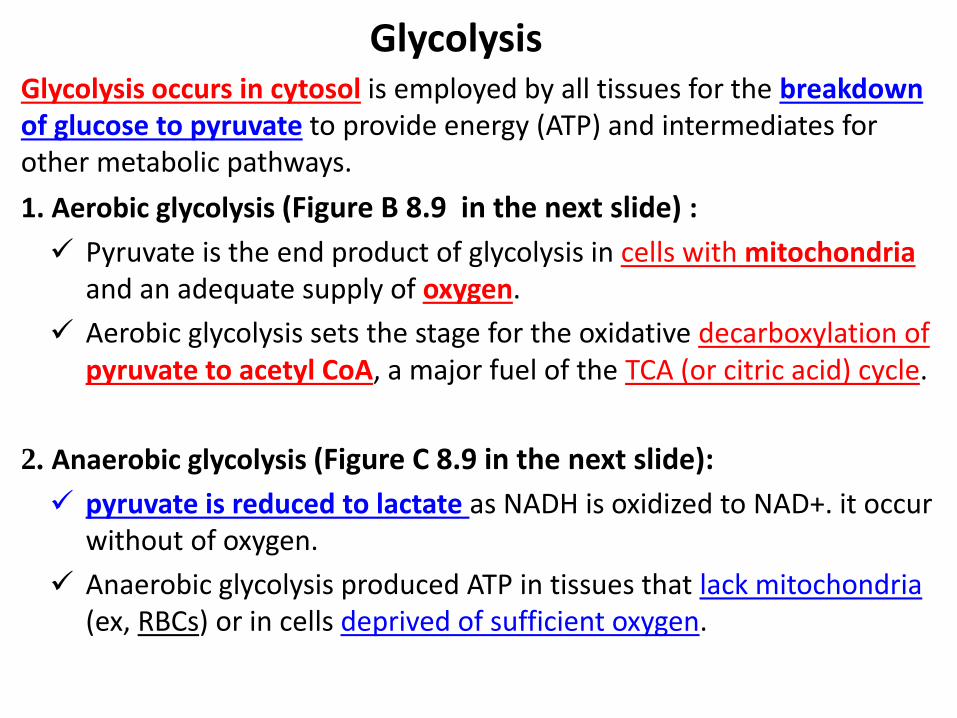
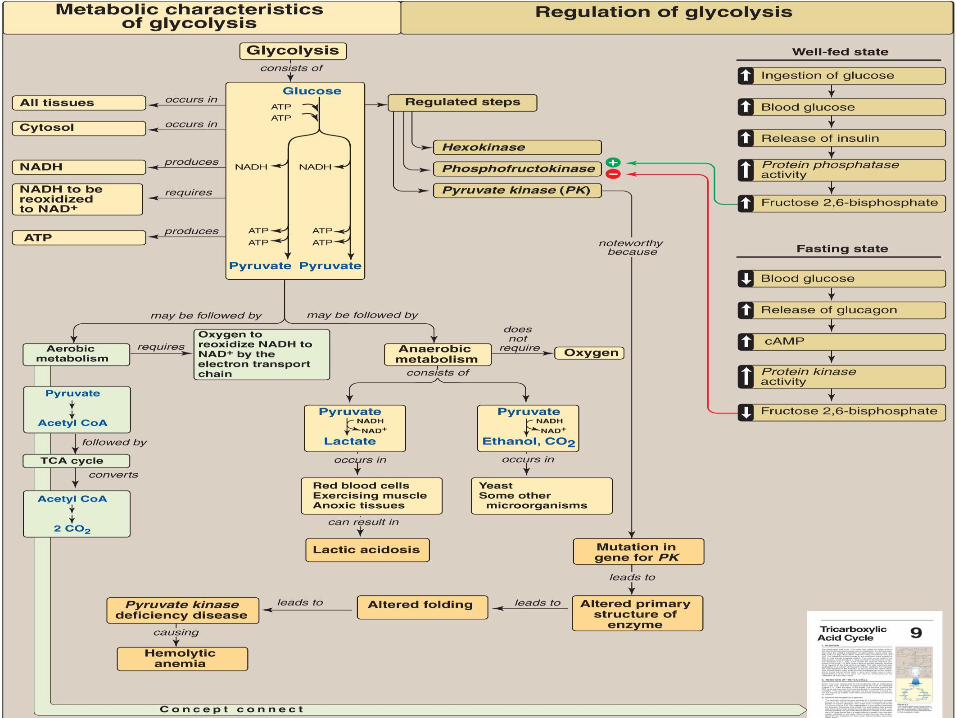
Glycolysis Glycolysis occurs in cytosol is employed by all tissues for the breakdown of glucose to pyruvate to provide energy (ATP) and intermediates for other metabolic pathways.
1. Aerobic glycolysis (Figure B 8.9 in the next slide) :
Pyruvate is the end product of glycolysis in cells with mitochondria and an adequate supply of oxygen.
Aerobic glycolysis sets the stage for the oxidative decarboxylation of pyruvate to acetyl CoA, a major fuel of the TCA (or citric acid) cycle.
2. Anaerobic glycolysis (Figure C 8.9 in the next slide):
pyruvate is reduced to lactate as NADH is oxidized to NAD+. it occur without of oxygen.
Anaerobic glycolysis produced ATP in tissues that lack mitochondria (ex, RBCs) or in cells deprived of sufficient oxygen.
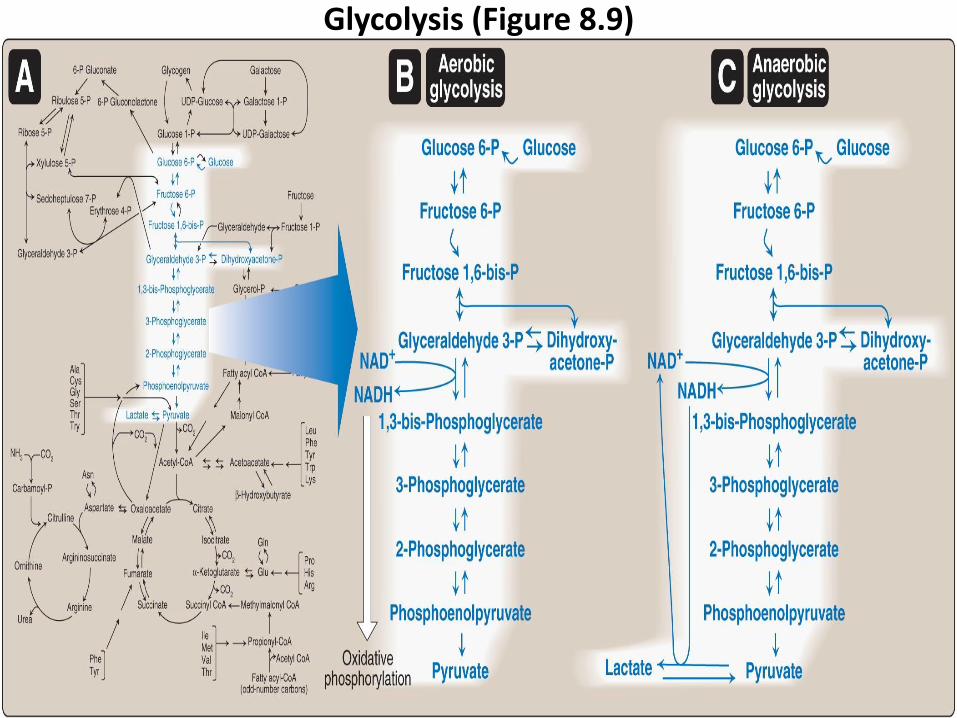
Glycolysis (Figure 8.9)
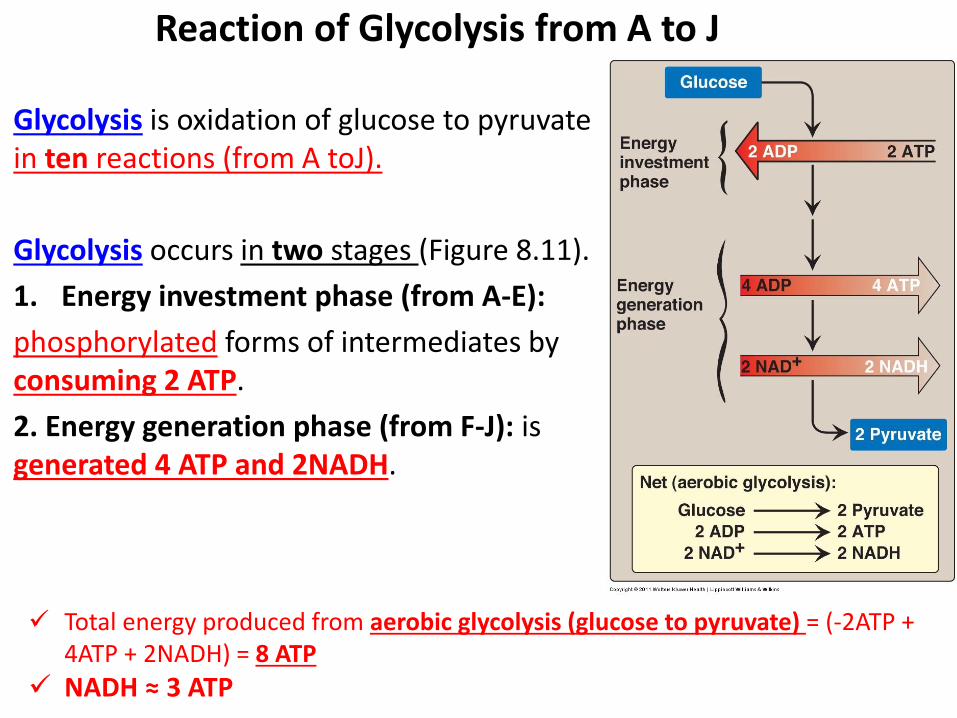
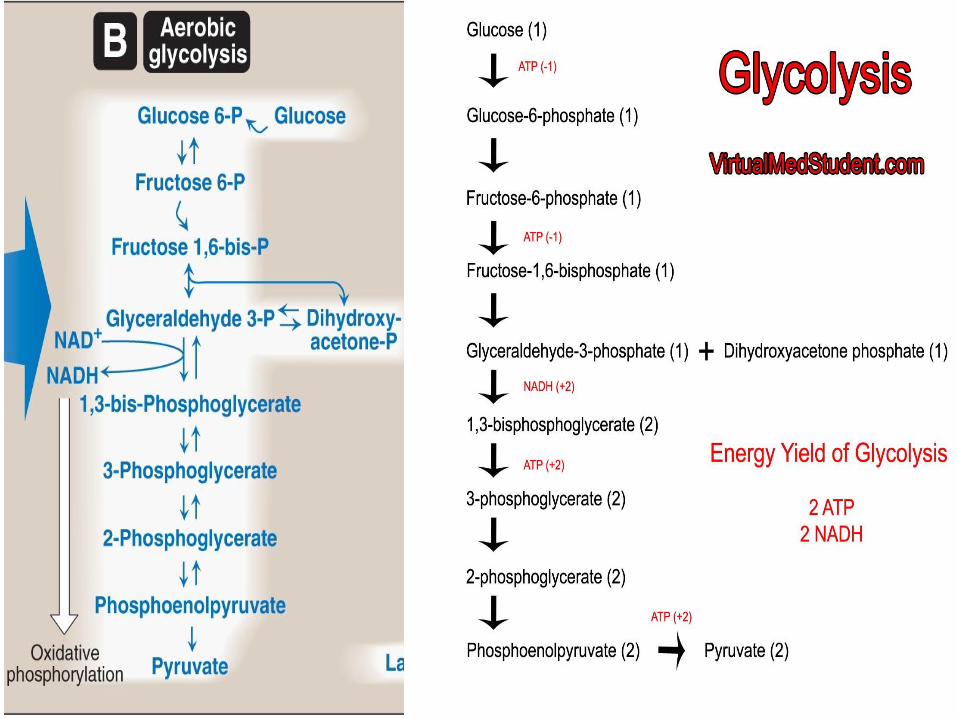
Glycolysis is oxidation of glucose to pyruvate in ten reactions (from A toJ).
Glycolysis occurs in two stages (Figure 8.11).
1. Energy investment phase (from A-E):
phosphorylated forms of intermediates by consuming 2 ATP.
2. Energy generation phase (from F-J): is generated 4 ATP and 2NADH.
Reaction of Glycolysis from A to J
Total energy produced from aerobic glycolysis (glucose to pyruvate) = (-2ATP + 4ATP + 2NADH) = 8 ATP
NADH ≈ 3 ATP
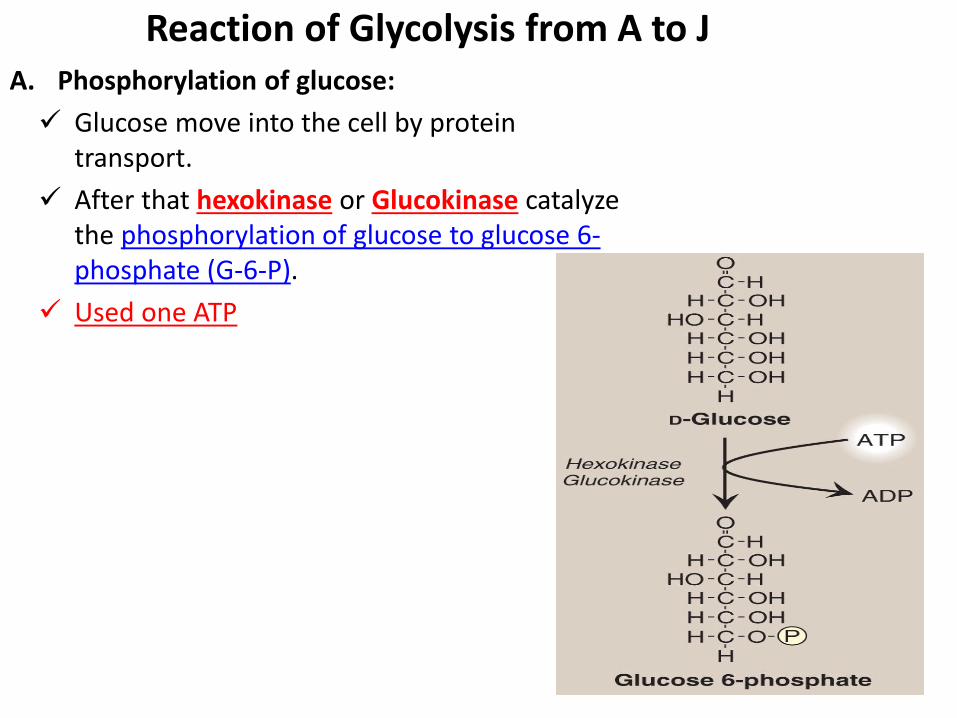
A. Phosphorylation of glucose:
Glucose move into the cell by protein transport.
After that hexokinase or Glucokinase catalyze the phosphorylation of glucose to glucose 6-phosphate (G-6-P).
Used one ATP
Reaction of Glycolysis from A to J
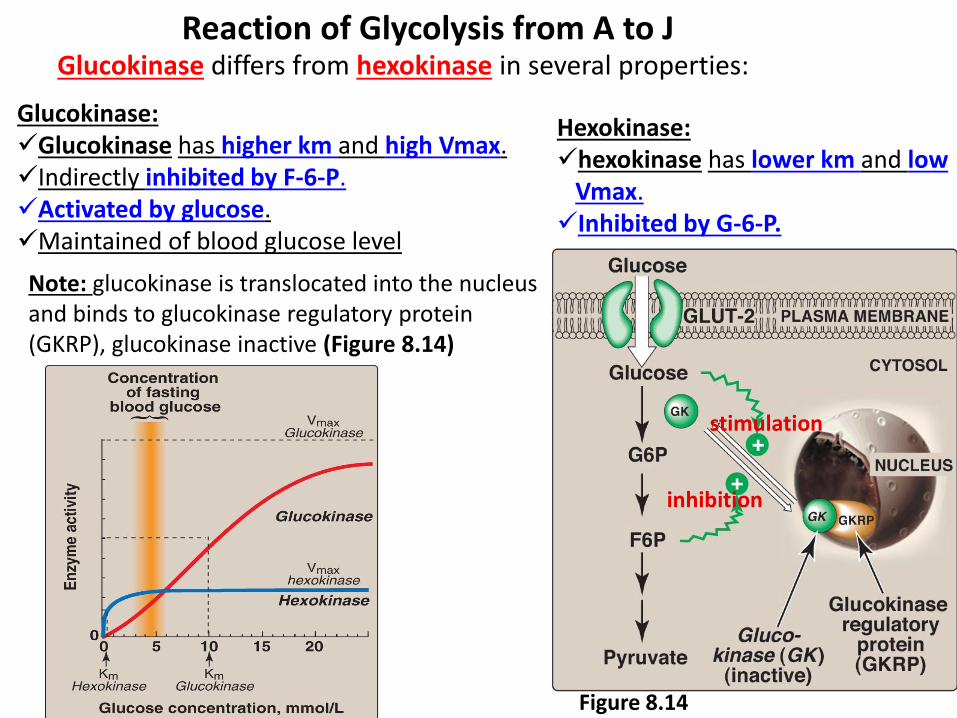
Reaction of Glycolysis from A to J Glucokinase differs from hexokinase in several properties:
Hexokinase: hexokinase has lower km and low
Vmax. Inhibited by G-6-P.
Glucokinase: Glucokinase has higher km and high Vmax. Indirectly inhibited by F-6-P. Activated by glucose. Maintained of blood glucose level
Figure 8.14
Note: glucokinase is translocated into the nucleus and binds to glucokinase regulatory protein (GKRP), glucokinase inactive (Figure 8.14)
stimulation
inhibition
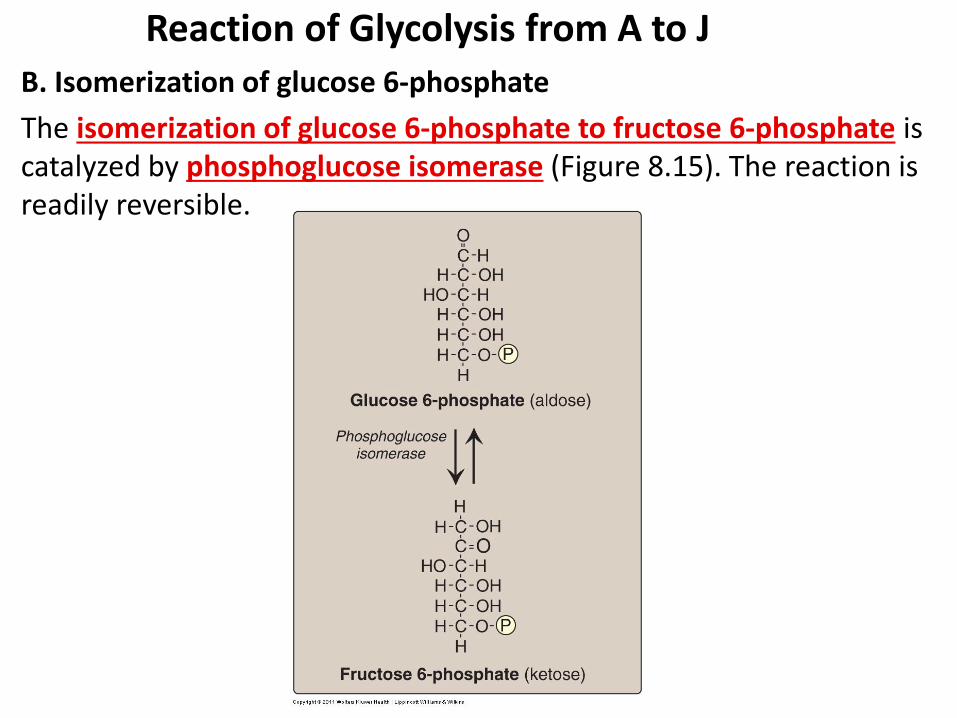
B. Isomerization of glucose 6-phosphate
The isomerization of glucose 6-phosphate to fructose 6-phosphate is catalyzed by phosphoglucose isomerase (Figure 8.15). The reaction is readily reversible.
Reaction of Glycolysis from A to J
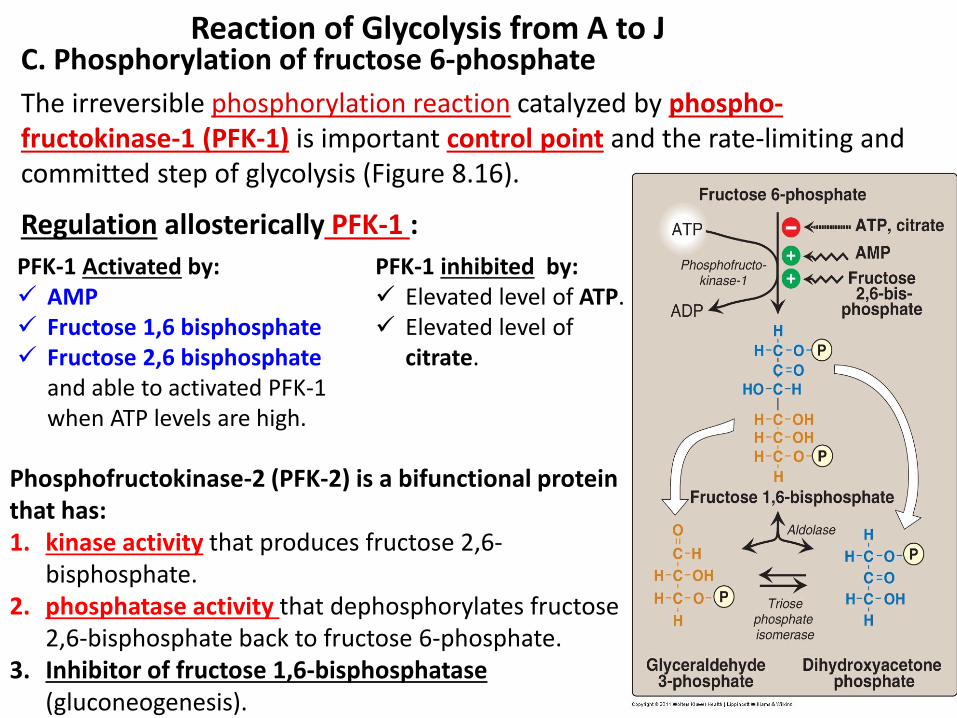
C. Phosphorylation of fructose 6-phosphate
The irreversible phosphorylation reaction catalyzed by phospho- fructokinase-1 (PFK-1) is important control point and the rate-limiting and committed step of glycolysis (Figure 8.16).
Reaction of Glycolysis from A to J
Regulation allosterically PFK-1 :
PFK-1 Activated by: AMP Fructose 1,6 bisphosphate Fructose 2,6 bisphosphate
and able to activated PFK-1 when ATP levels are high.
PFK-1 inhibited by: Elevated level of ATP. Elevated level of
citrate.
Phosphofructokinase-2 (PFK-2) is a bifunctional protein that has: 1. kinase activity that produces fructose 2,6-
bisphosphate. 2. phosphatase activity that dephosphorylates fructose
2,6-bisphosphate back to fructose 6-phosphate. 3. Inhibitor of fructose 1,6-bisphosphatase
(gluconeogenesis).
During the well-fed state:
Decreased levels of glucagon.
elevated levels of insulin.
Elevated level of glucose.
increase in fructose 2,6-bisphosphate.
Increase rate of glycolysis.
Decrease in gluconeogenesis.
During fasting:
Elevated levels of glucagon.
low levels of insulin.
Decrease fructose 2,6-bisphosphate.
Decrease rate of glycolysis.
Increase in gluconeogenesis.
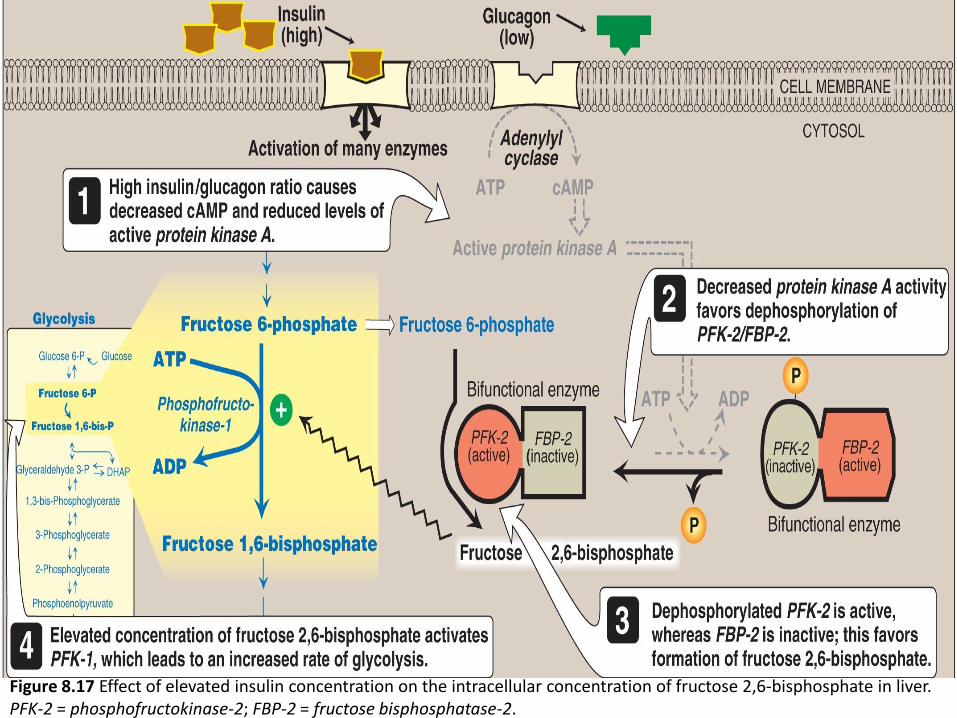
Figure 8.17 Effect of elevated insulin concentration on the intracellular concentration of fructose 2,6-bisphosphate in liver. PFK-2 = phosphofructokinase-2; FBP-2 = fructose bisphosphatase-2.
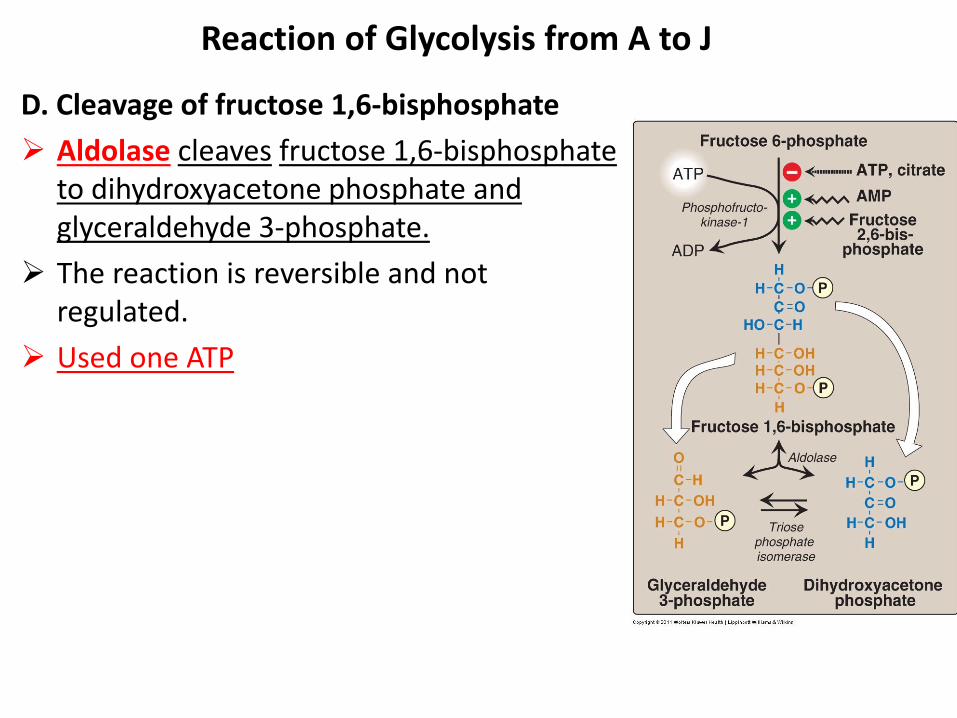
D. Cleavage of fructose 1,6-bisphosphate
Aldolase cleaves fructose 1,6-bisphosphate to dihydroxyacetone phosphate and glyceraldehyde 3-phosphate.
The reaction is reversible and not regulated.
Used one ATP
Reaction of Glycolysis from A to J
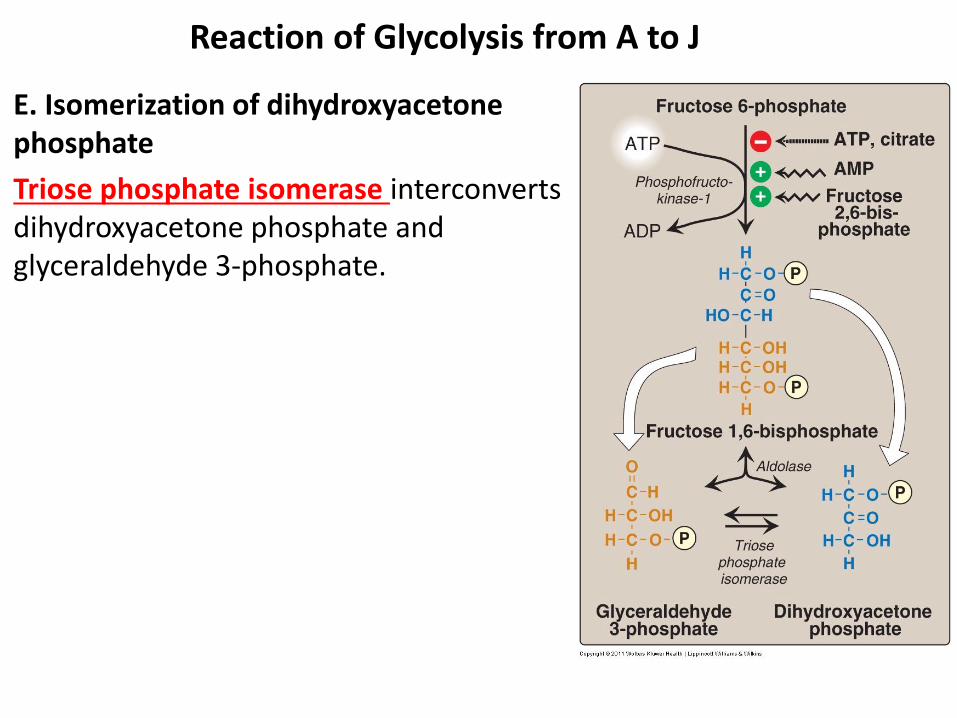
E. Isomerization of dihydroxyacetone phosphate
Triose phosphate isomerase interconverts dihydroxyacetone phosphate and glyceraldehyde 3-phosphate.
Reaction of Glycolysis from A to J
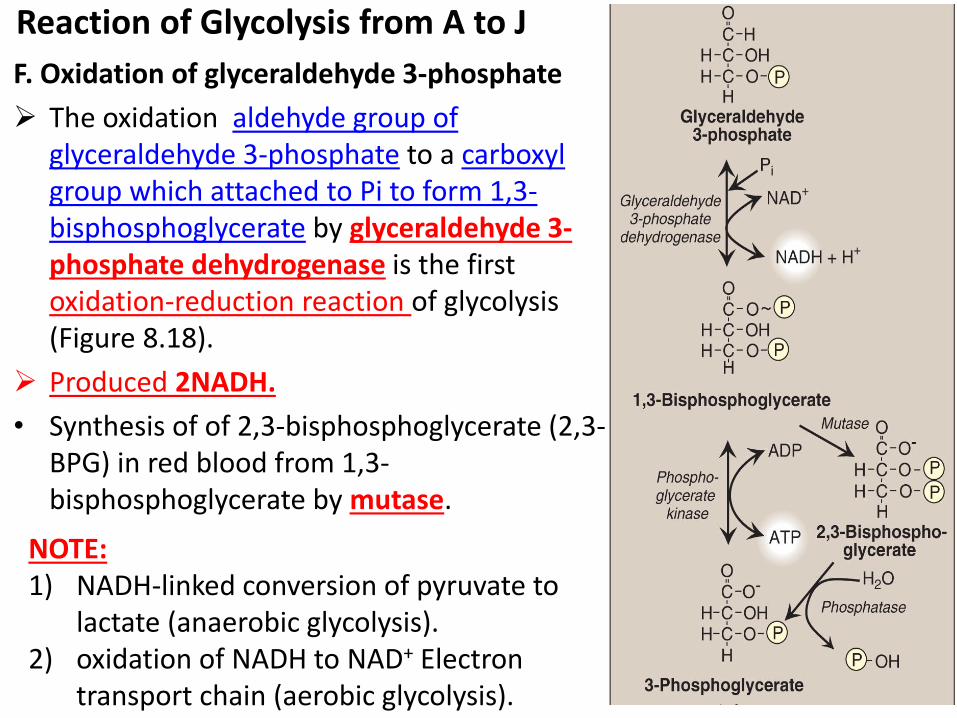
F. Oxidation of glyceraldehyde 3-phosphate
The oxidation aldehyde group of glyceraldehyde 3-phosphate to a carboxyl group which attached to Pi to form 1,3-bisphosphoglycerate by glyceraldehyde 3-phosphate dehydrogenase is the first oxidation-reduction reaction of glycolysis (Figure 8.18).
Produced 2NADH.
• Synthesis of of 2,3-bisphosphoglycerate (2,3-BPG) in red blood from 1,3-bisphosphoglycerate by mutase.
Reaction of Glycolysis from A to J
NOTE: 1) NADH-linked conversion of pyruvate to
lactate (anaerobic glycolysis). 2) oxidation of NADH to NAD+ Electron
transport chain (aerobic glycolysis).
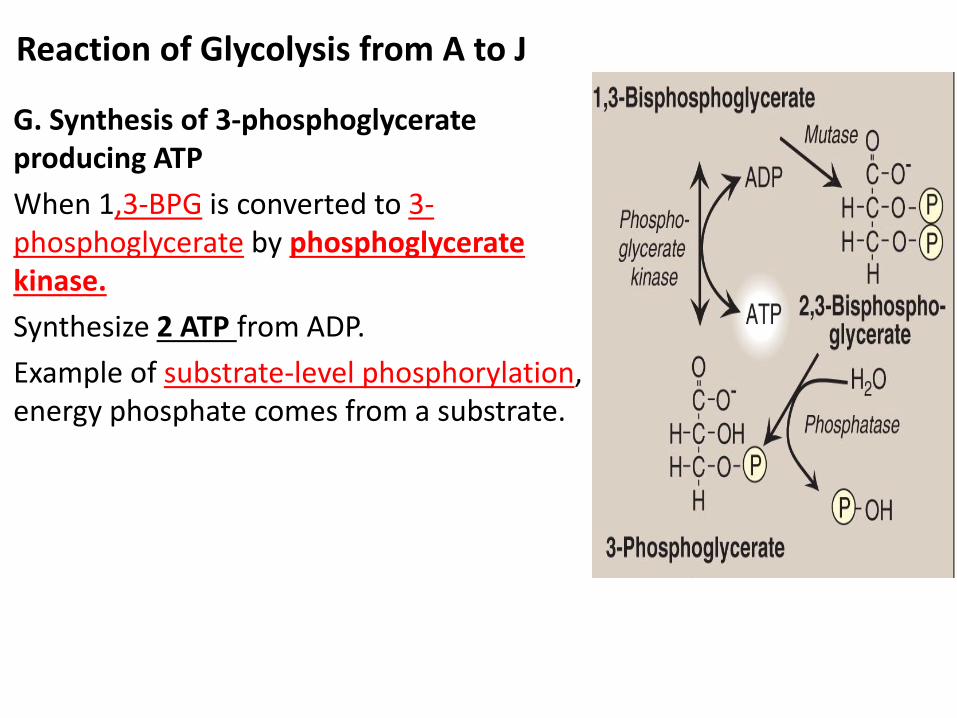
G. Synthesis of 3-phosphoglycerate producing ATP
When 1,3-BPG is converted to 3-phosphoglycerate by phosphoglycerate kinase.
Synthesize 2 ATP from ADP.
Example of substrate-level phosphorylation, energy phosphate comes from a substrate.
Reaction of Glycolysis from A to J
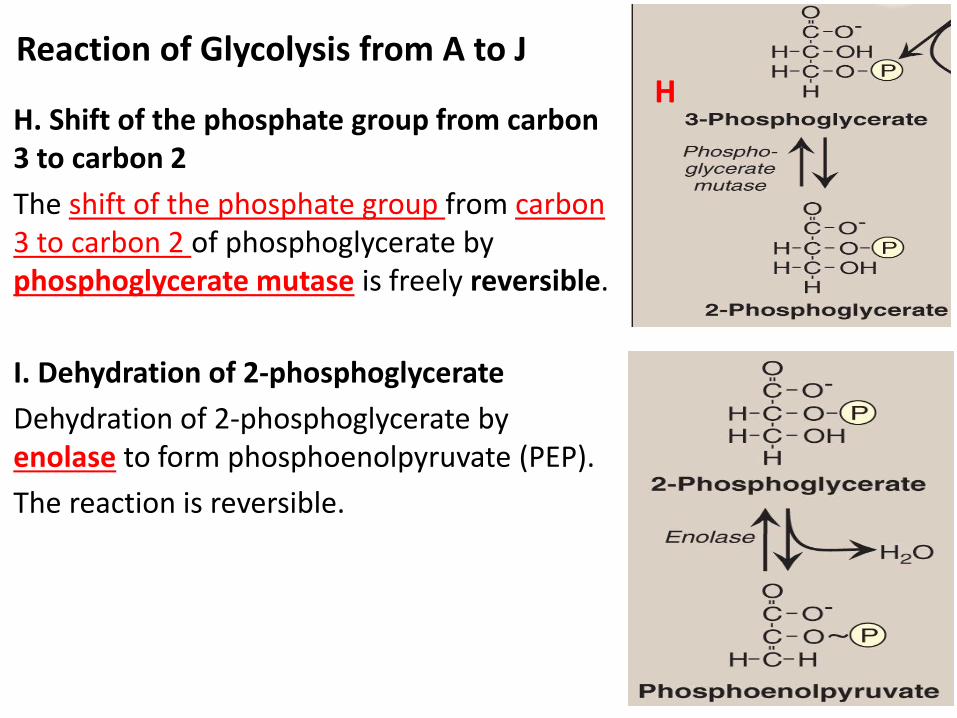
H. Shift of the phosphate group from carbon 3 to carbon 2
The shift of the phosphate group from carbon 3 to carbon 2 of phosphoglycerate by phosphoglycerate mutase is freely reversible.
I. Dehydration of 2-phosphoglycerate
Dehydration of 2-phosphoglycerate by enolase to form phosphoenolpyruvate (PEP).
The reaction is reversible.
Reaction of Glycolysis from A to J H
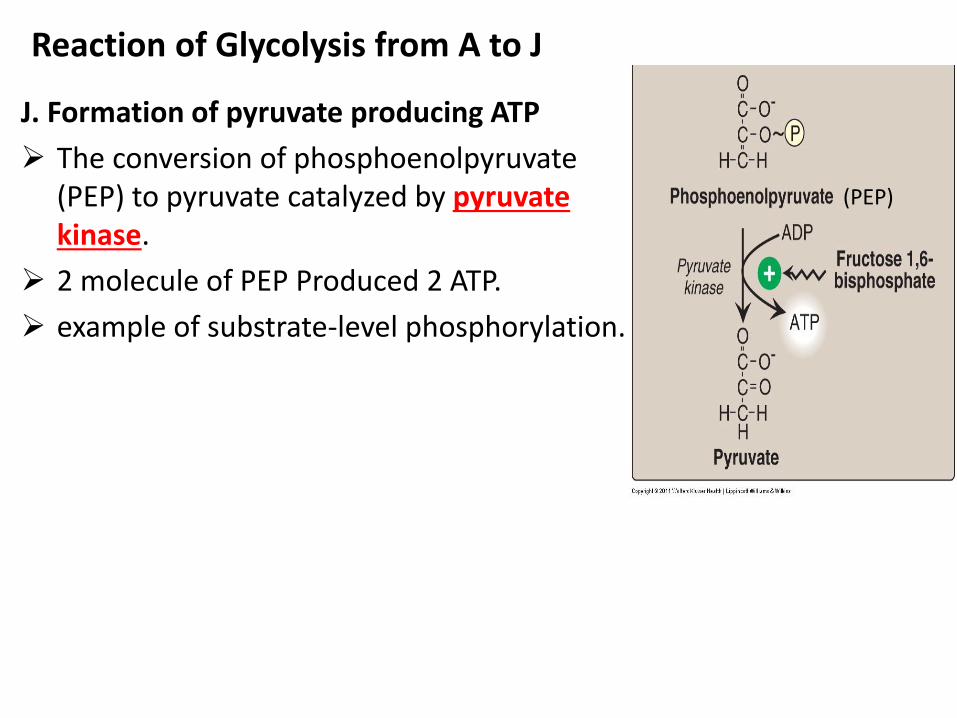
J. Formation of pyruvate producing ATP
The conversion of phosphoenolpyruvate (PEP) to pyruvate catalyzed by pyruvate kinase.
2 molecule of PEP Produced 2 ATP.
example of substrate-level phosphorylation.
Reaction of Glycolysis from A to J
(PEP)
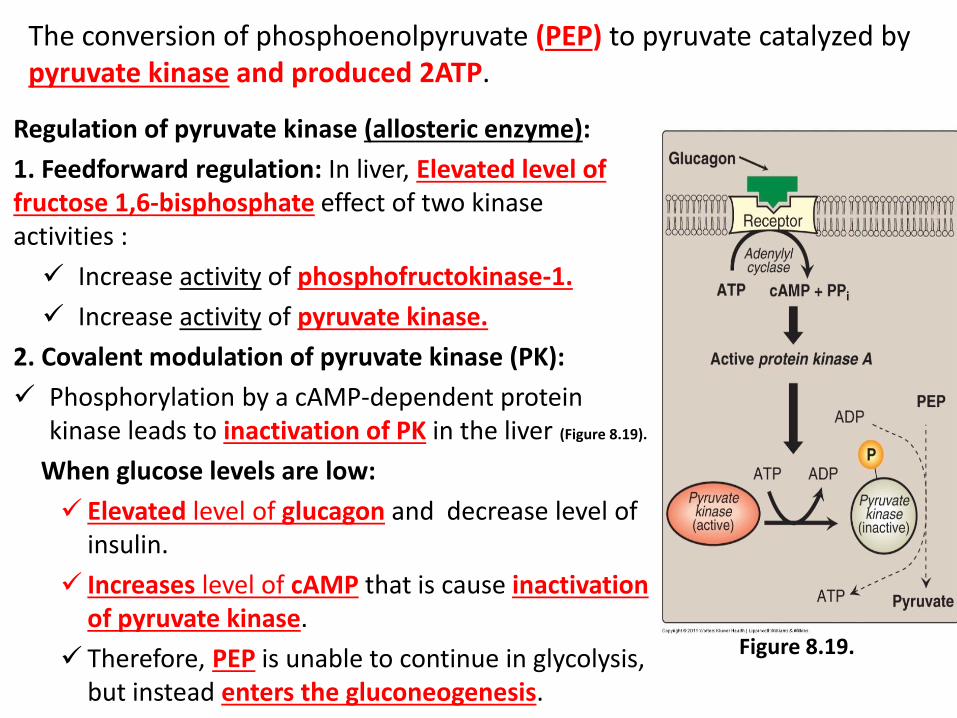
Regulation of pyruvate kinase (allosteric enzyme):
1. Feedforward regulation: In liver, Elevated level of fructose 1,6-bisphosphate effect of two kinase activities :
Increase activity of phosphofructokinase-1.
Increase activity of pyruvate kinase.
2. Covalent modulation of pyruvate kinase (PK):
Phosphorylation by a cAMP-dependent protein kinase leads to inactivation of PK in the liver (Figure 8.19).
When glucose levels are low:
Elevated level of glucagon and decrease level of insulin.
Increases level of cAMP that is cause inactivation of pyruvate kinase.
Therefore, PEP is unable to continue in glycolysis, but instead enters the gluconeogenesis.
Figure 8.19.
The conversion of phosphoenolpyruvate (PEP) to pyruvate catalyzed by pyruvate kinase and produced 2ATP.
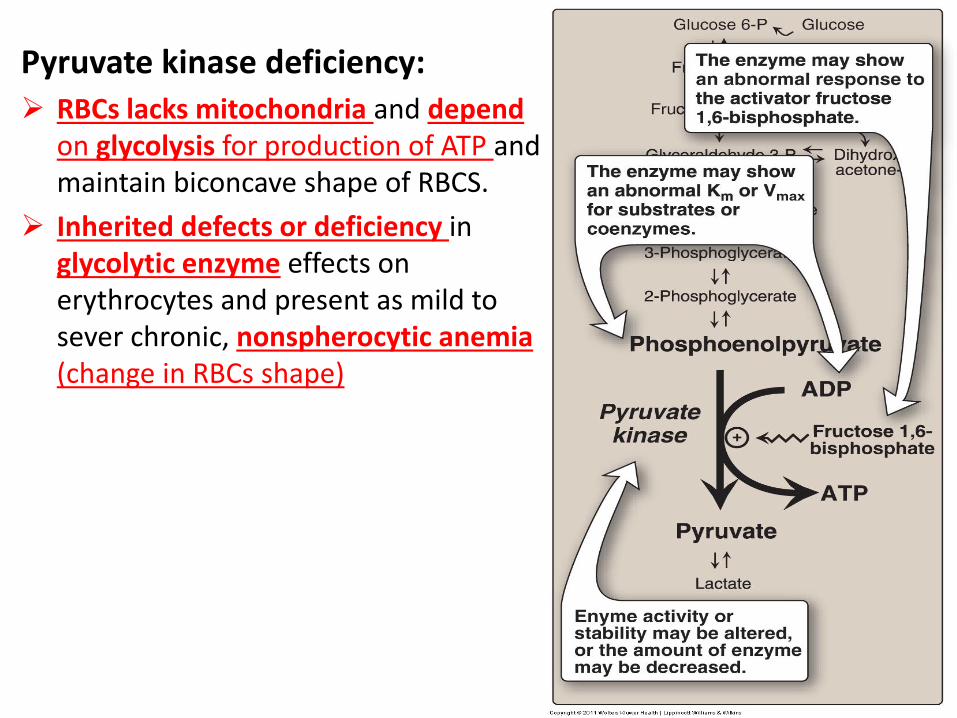
Pyruvate kinase deficiency:
RBCs lacks mitochondria and depend on glycolysis for production of ATP and maintain biconcave shape of RBCS.
Inherited defects or deficiency in glycolytic enzyme effects on erythrocytes and present as mild to sever chronic, nonspherocytic anemia (change in RBCs shape)
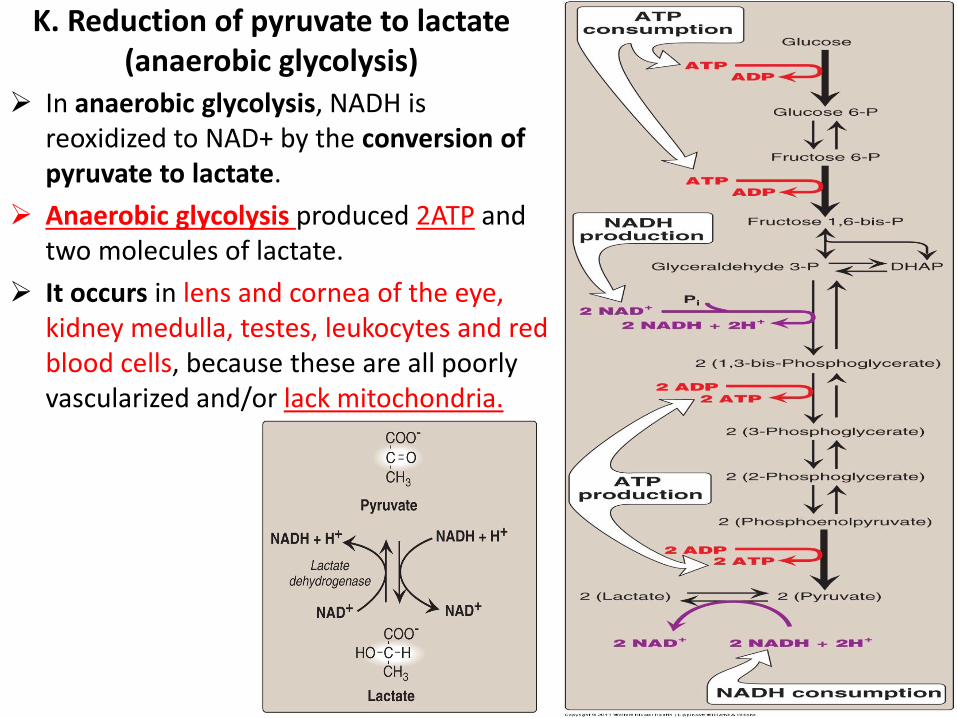
In anaerobic glycolysis, NADH is reoxidized to NAD+ by the conversion of pyruvate to lactate.
Anaerobic glycolysis produced 2ATP and two molecules of lactate.
It occurs in lens and cornea of the eye, kidney medulla, testes, leukocytes and red blood cells, because these are all poorly vascularized and/or lack mitochondria.
K. Reduction of pyruvate to lactate (anaerobic glycolysis)
Reduction of pyruvate to lactate (anaerobic glycolysis)
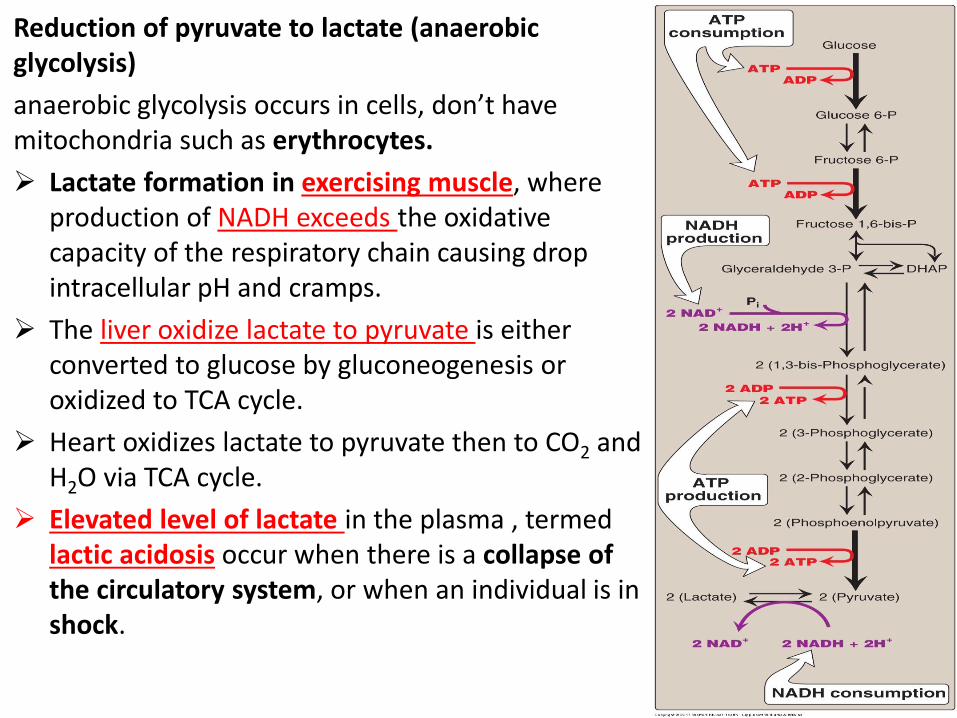
anaerobic glycolysis occurs in cells, don’t have mitochondria such as erythrocytes.
Lactate formation in exercising muscle, where production of NADH exceeds the oxidative capacity of the respiratory chain causing drop intracellular pH and cramps.
The liver oxidize lactate to pyruvate is either converted to glucose by gluconeogenesis or oxidized to TCA cycle.
Heart oxidizes lactate to pyruvate then to CO2 and H2O via TCA cycle.
Elevated level of lactate in the plasma , termed lactic acidosis occur when there is a collapse of the circulatory system, or when an individual is in shock.
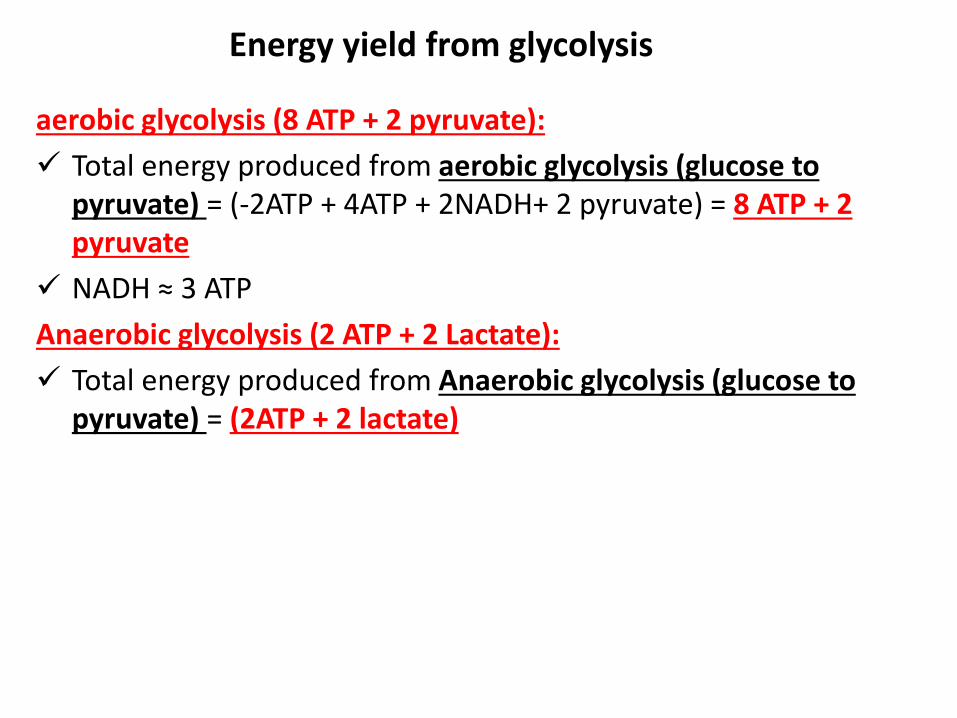
aerobic glycolysis (8 ATP + 2 pyruvate):
Total energy produced from aerobic glycolysis (glucose to pyruvate) = (-2ATP + 4ATP + 2NADH+ 2 pyruvate) = 8 ATP + 2 pyruvate
NADH ≈ 3 ATP
Anaerobic glycolysis (2 ATP + 2 Lactate):
Total energy produced from Anaerobic glycolysis (glucose to pyruvate) = (2ATP + 2 lactate)
Energy yield from glycolysis
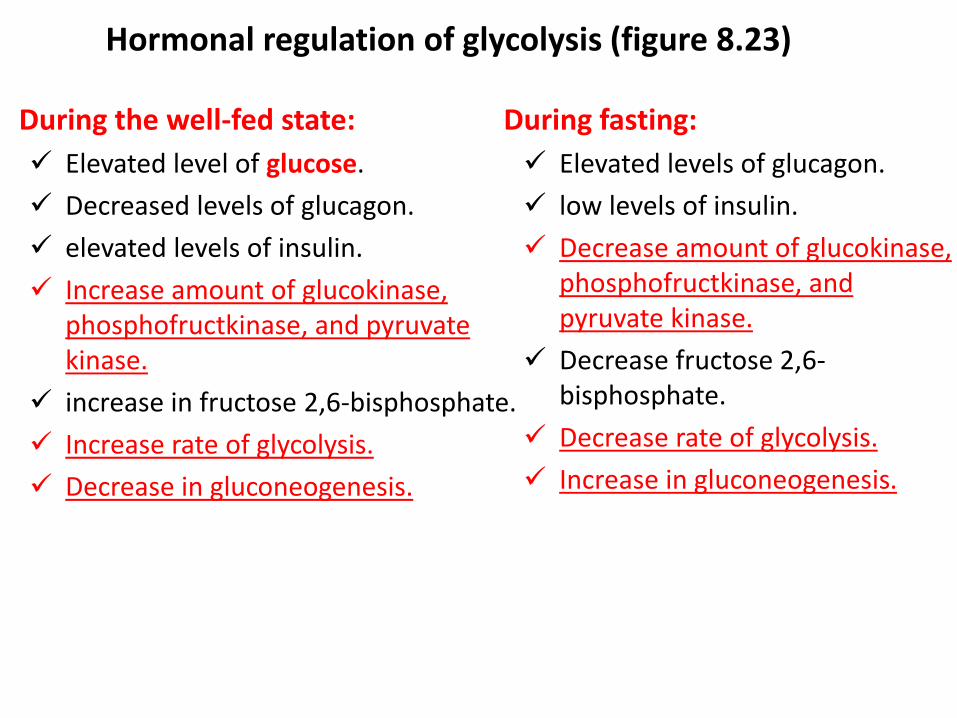
During the well-fed state:
Elevated level of glucose.
Decreased levels of glucagon.
elevated levels of insulin.
Increase amount of glucokinase, phosphofructkinase, and pyruvate kinase.
increase in fructose 2,6-bisphosphate.
Increase rate of glycolysis.
Decrease in gluconeogenesis.
During fasting:
Elevated levels of glucagon.
low levels of insulin.
Decrease amount of glucokinase, phosphofructkinase, and pyruvate kinase.
Decrease fructose 2,6-bisphosphate.
Decrease rate of glycolysis.
Increase in gluconeogenesis.
Hormonal regulation of glycolysis (figure 8.23)
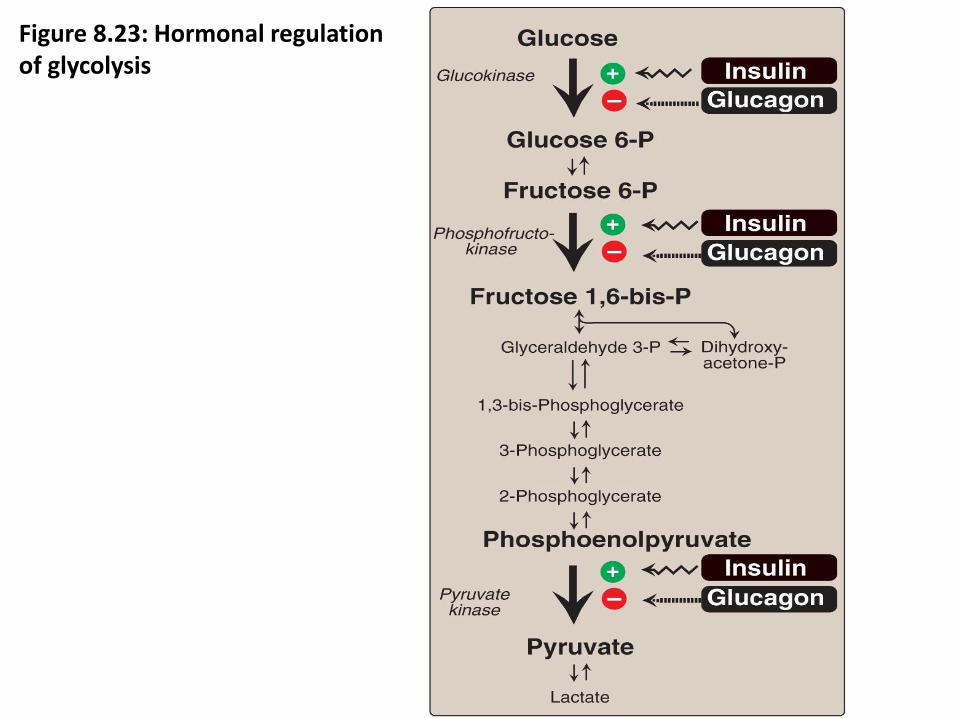
Figure 8.23: Hormonal regulation of glycolysis
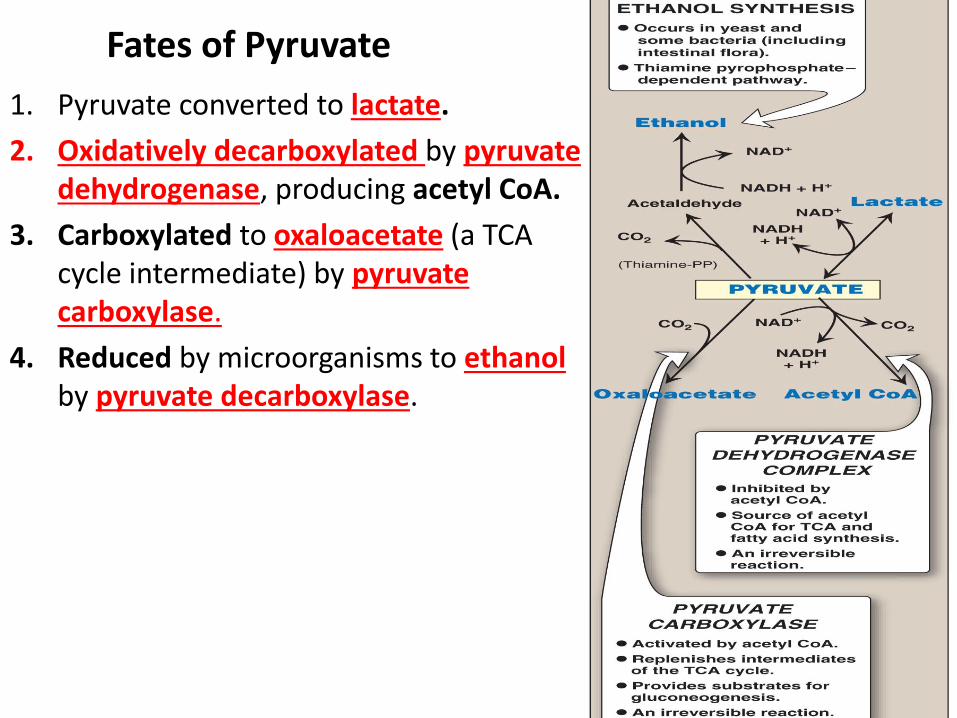
1. Pyruvate converted to lactate.
2. Oxidatively decarboxylated by pyruvate dehydrogenase, producing acetyl CoA.
3. Carboxylated to oxaloacetate (a TCA cycle intermediate) by pyruvate carboxylase.
4. Reduced by microorganisms to ethanol by pyruvate decarboxylase.
Fates of Pyruvate
Metabolism of Monosaccharides and Disaccharides
Presented by
Dr. Mohammad Saadeh
The requirements for the Pharmaceutical Biochemistry II
Philadelphia University
Faculty of pharmacy
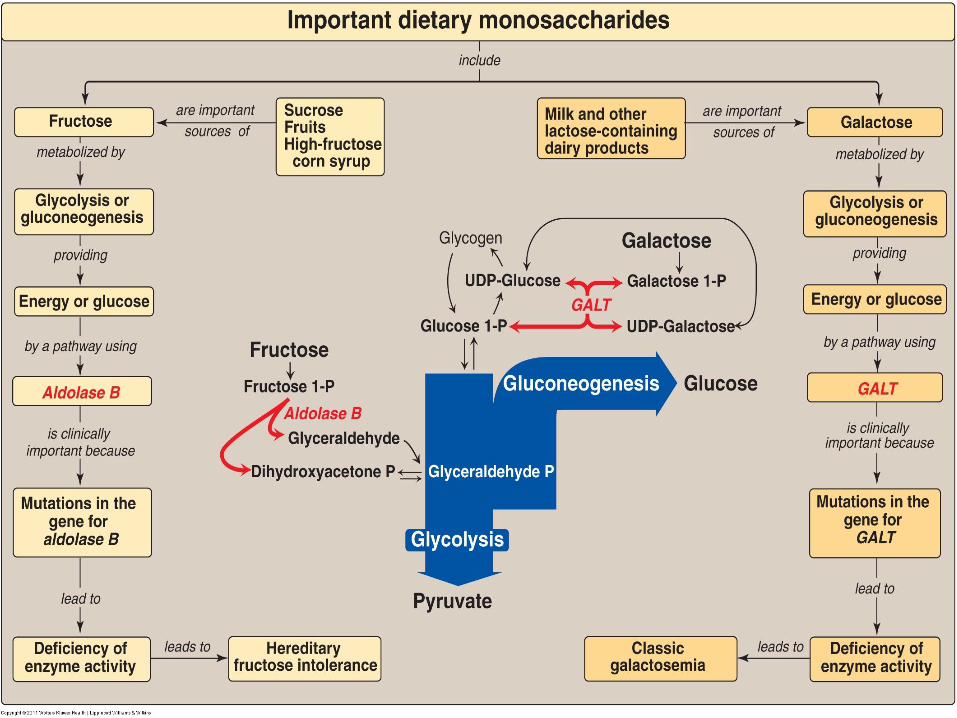
Glucose, fructose, and galactose are important in energy metabolism.
Fructose Metabolism:
Fructose is a monosaccharide in fruits and honey.
10% of the calories are supplied by fructose (approximately 55 g/day).
The sucrose combination of the glucose and fructose.
Entry of fructose into cells is not insulin dependent.
fructose does not promote the secretion of insulin.
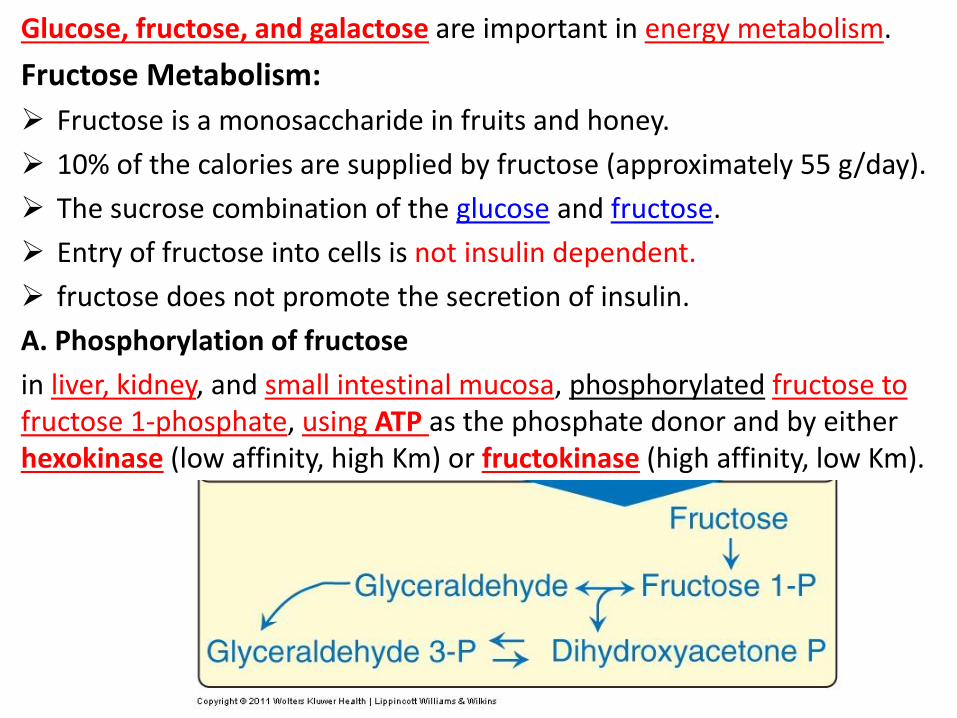
A. Phosphorylation of fructose
in liver, kidney, and small intestinal mucosa, phosphorylated fructose to fructose 1-phosphate, using ATP as the phosphate donor and by either hexokinase (low affinity, high Km) or fructokinase (high affinity, low Km).
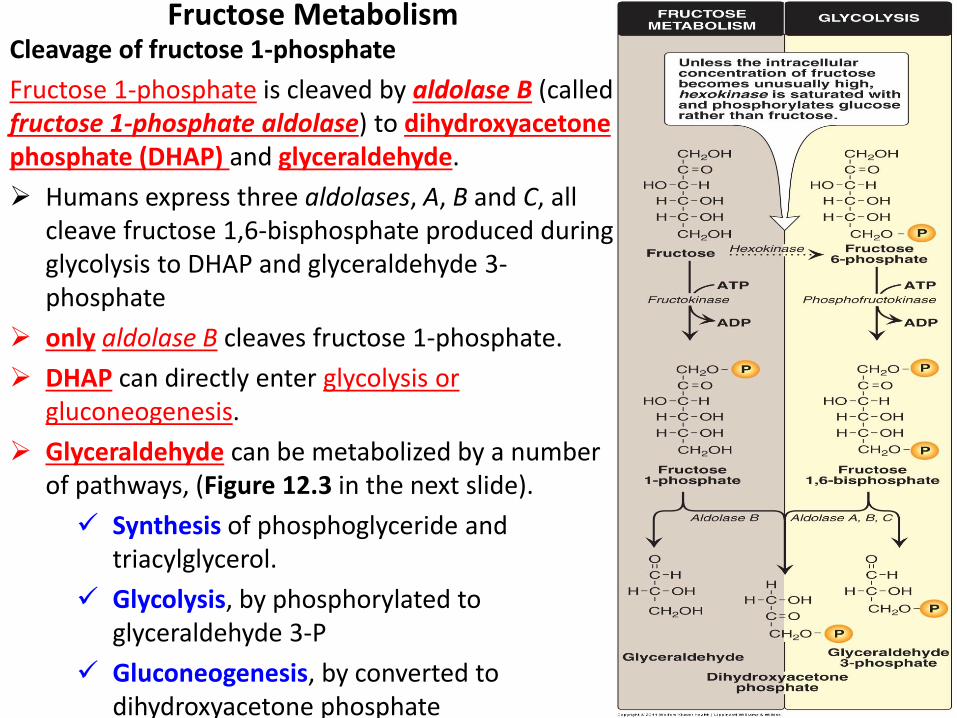
Fructose Metabolism Cleavage of fructose 1-phosphate
Fructose 1-phosphate is cleaved by aldolase B (called fructose 1-phosphate aldolase) to dihydroxyacetone phosphate (DHAP) and glyceraldehyde.
Humans express three aldolases, A, B and C, all cleave fructose 1,6-bisphosphate produced during glycolysis to DHAP and glyceraldehyde 3-phosphate
only aldolase B cleaves fructose 1-phosphate.
DHAP can directly enter glycolysis or gluconeogenesis.
Glyceraldehyde can be metabolized by a number of pathways, (Figure 12.3 in the next slide).
Synthesis of phosphoglyceride and triacylglycerol.
Glycolysis, by phosphorylated to glyceraldehyde 3-P
Gluconeogenesis, by converted to dihydroxyacetone phosphate
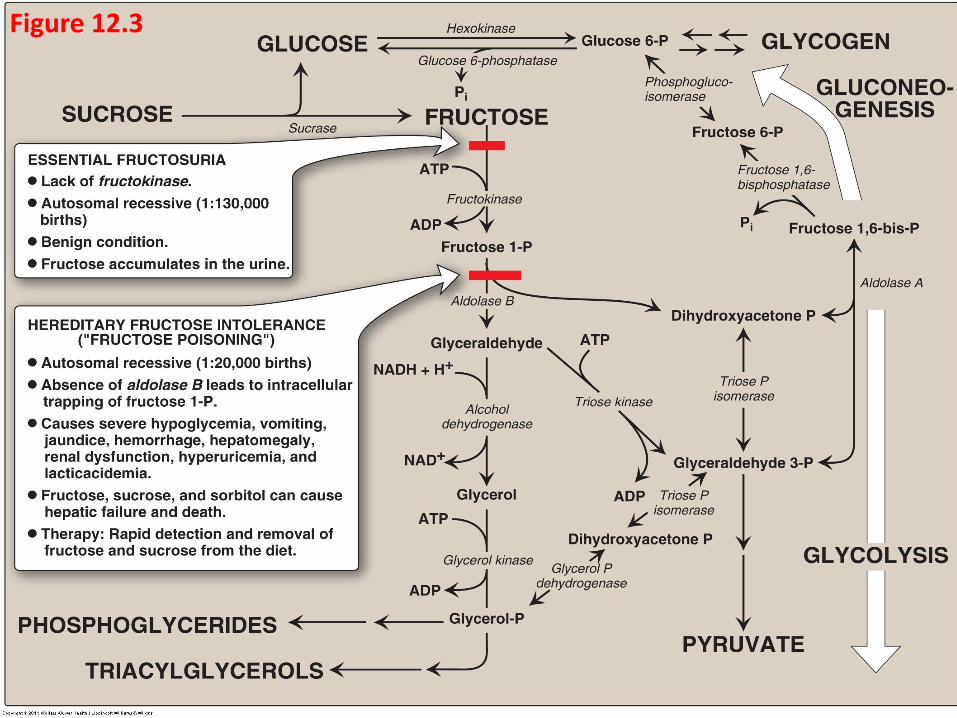
Figure 12.3
Fructose Metabolism C. Kinetics of fructose metabolism
The rate of fructose metabolism is more rapid than that of glucose because the trioses formed from fructose 1-phosphate bypass phosphofructokinase-1 the major rate-limiting step in glycolysis.
D. Disorders of fructose metabolism
fructokinase deficiency, or aldolase B deficiency cause hereditary fructose intolerance (HFI) lead to liver failure and death and appear when feed food containing sucrose or fructose.
Therefore, Fructose 1-phosphate accumulates, resulting decrease level of inorganic phosphate (Pi) and ATP, AMP rises.
affects gluconeogenesis, and protein synthesis (causing a decrease in blood clotting factors and other essential proteins), and Kidney function may also be affected.
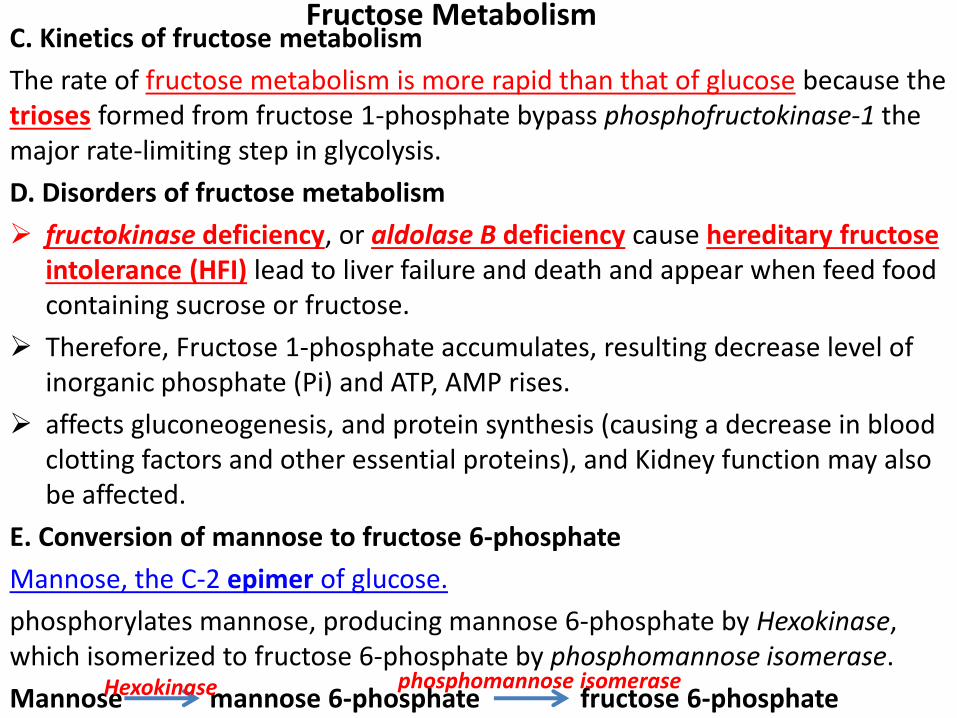
E. Conversion of mannose to fructose 6-phosphate
Mannose, the C-2 epimer of glucose.
phosphorylates mannose, producing mannose 6-phosphate by Hexokinase, which isomerized to fructose 6-phosphate by phosphomannose isomerase.
Mannose mannose 6-phosphate fructose 6-phosphate Hexokinase phosphomannose isomerase
Fructose Metabolism
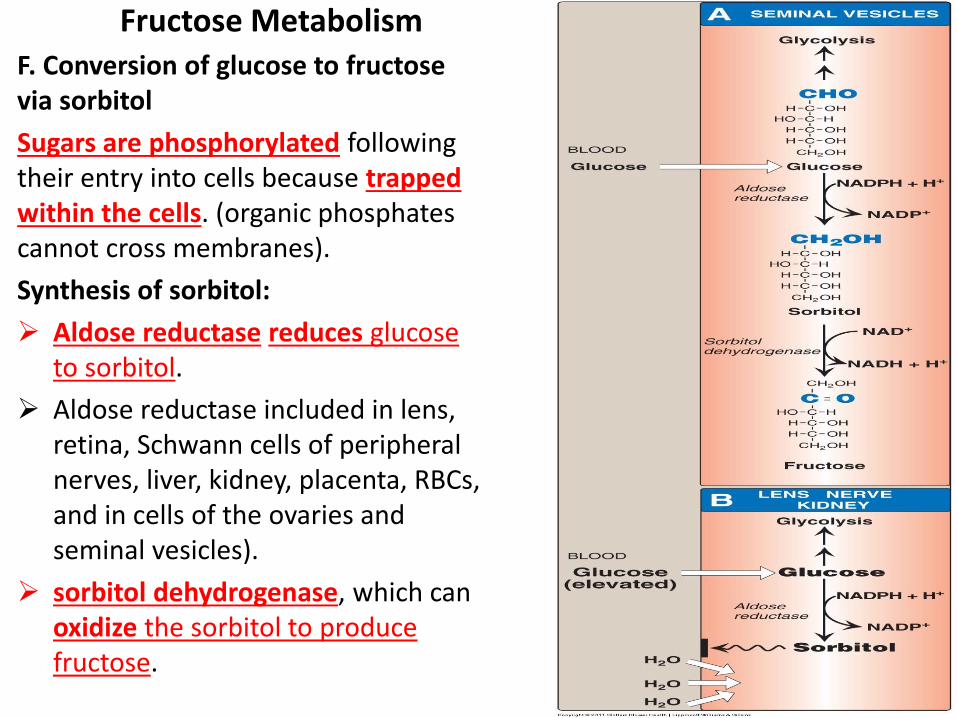
F. Conversion of glucose to fructose via sorbitol
Sugars are phosphorylated following their entry into cells because trapped within the cells. (organic phosphates cannot cross membranes).
Synthesis of sorbitol:
Aldose reductase reduces glucose to sorbitol.
Aldose reductase included in lens, retina, Schwann cells of peripheral nerves, liver, kidney, placenta, RBCs, and in cells of the ovaries and seminal vesicles).
sorbitol dehydrogenase, which can oxidize the sorbitol to produce fructose.
Fructose Metabolism
The effect of hyperglycemia on sorbitol metabolism:
Elevated intracellular glucose due to hyperglycemia and an adequate supply of NADPH cause aldose reductase to produce sorbitol.
Sorbitol accumulate in cells causing strong osmotic effects, swelling , water retention. peripheral neuropathy, and microvascular problems leading to nephropathy and retinopathy.
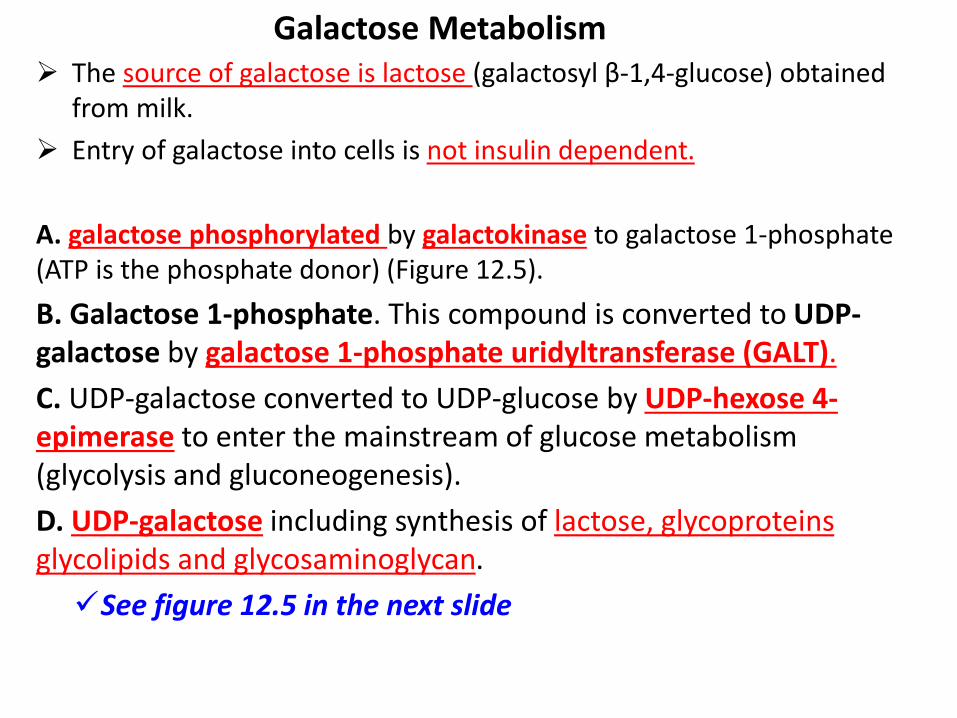
Galactose Metabolism The source of galactose is lactose (galactosyl β-1,4-glucose) obtained
from milk.
Entry of galactose into cells is not insulin dependent.
A. galactose phosphorylated by galactokinase to galactose 1-phosphate (ATP is the phosphate donor) (Figure 12.5).
B. Galactose 1-phosphate. This compound is converted to UDP-galactose by galactose 1-phosphate uridyltransferase (GALT).
C. UDP-galactose converted to UDP-glucose by UDP-hexose 4-epimerase to enter the mainstream of glucose metabolism (glycolysis and gluconeogenesis).
D. UDP-galactose including synthesis of lactose, glycoproteins glycolipids and glycosaminoglycan.
See figure 12.5 in the next slide
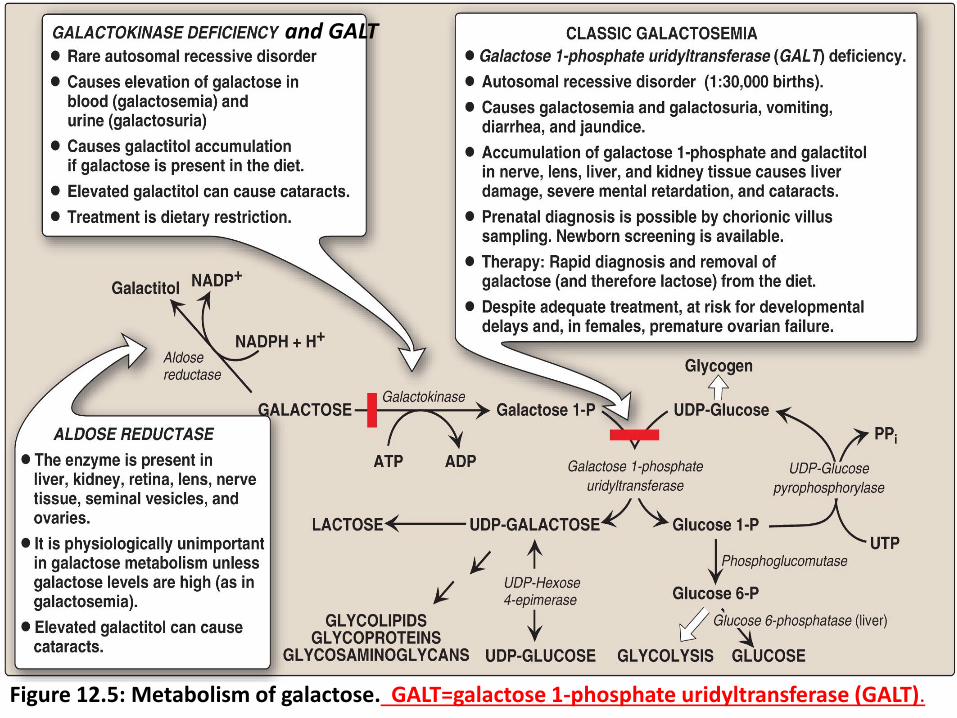
Figure 12.5: Metabolism of galactose. GALT=galactose 1-phosphate uridyltransferase (GALT).
and GALT
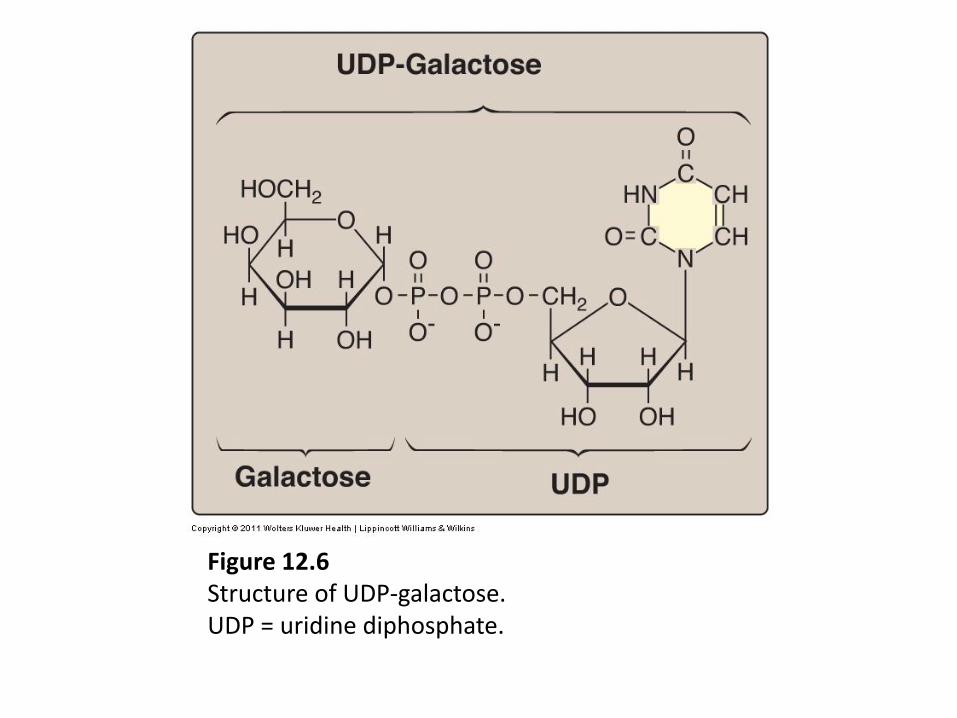
Figure 12.6 Structure of UDP-galactose. UDP = uridine diphosphate.
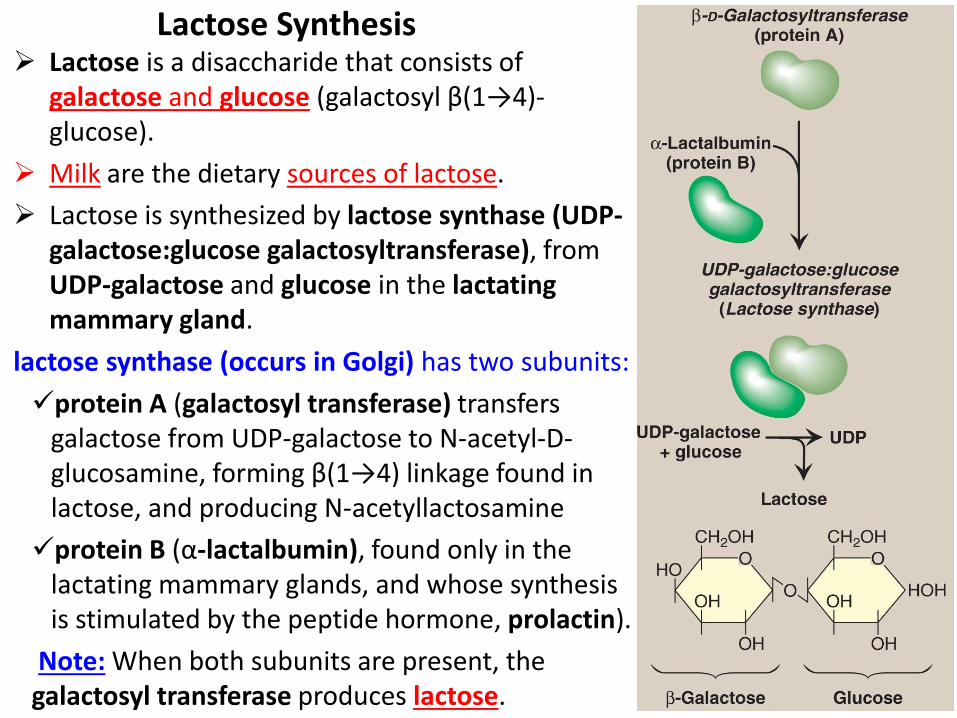
Lactose is a disaccharide that consists of galactose and glucose (galactosyl β(1→4)-glucose).
Milk are the dietary sources of lactose.
Lactose is synthesized by lactose synthase (UDP- galactose:glucose galactosyltransferase), from UDP-galactose and glucose in the lactating mammary gland.
lactose synthase (occurs in Golgi) has two subunits:
protein A (galactosyl transferase) transfers galactose from UDP-galactose to N-acetyl-D-glucosamine, forming β(1→4) linkage found in lactose, and producing N-acetyllactosamine
protein B (α-lactalbumin), found only in the lactating mammary glands, and whose synthesis is stimulated by the peptide hormone, prolactin).
Note: When both subunits are present, the galactosyl transferase produces lactose.
Lactose Synthesis
Science Should be as simple as possible, but not simpler. Albert Einstein
References: Biochemistry. Lippincott's Illustrated Reviews. 6th Edition by, Richard A Harvey, Denise R. Ferrier. Lippincott Williams and Wilkins, a Wolters kluwer business. 2014.
![An Ordination οf Western and Chinese Burial Sites · [3]. Laurel Hill Cemetery was established in 1836 in Philadelphia; Greenwood Cemetery was established in 1838 by New York City](https://static.fdocument.org/doc/165x107/6053674f286efe21620fa6dd/an-ordination-f-western-and-chinese-burial-sites-3-laurel-hill-cemetery-was.jpg)


![Implications of altered NAD metabolism in metabolic disorders...NAD levels in each organ [21, 38, 39]. Most trypto-phan, a precursor for de novo synthesis pathway, is consumed in the](https://static.fdocument.org/doc/165x107/61057f1f0fbb533ac7078440/implications-of-altered-nad-metabolism-in-metabolic-disorders-nad-levels-in.jpg)