Powerpoint Presentation: Mixed dust-black carbon forcing: How … · = Ksc / (Ksc + Kab) ......
34
Mixed dust-black carbon forcing: How large is it? School of Earth and Atmospheric Sciences Georgia Institute of Technology, Atlanta, GA, USA Irina N. Sokolik
Transcript of Powerpoint Presentation: Mixed dust-black carbon forcing: How … · = Ksc / (Ksc + Kab) ......
Mixed dust-black carbon forcing:How large is it?
School of Earth and Atmospheric Sciences
Georgia Institute of Technology, Atlanta, GA, USA
Irina N. Sokolik
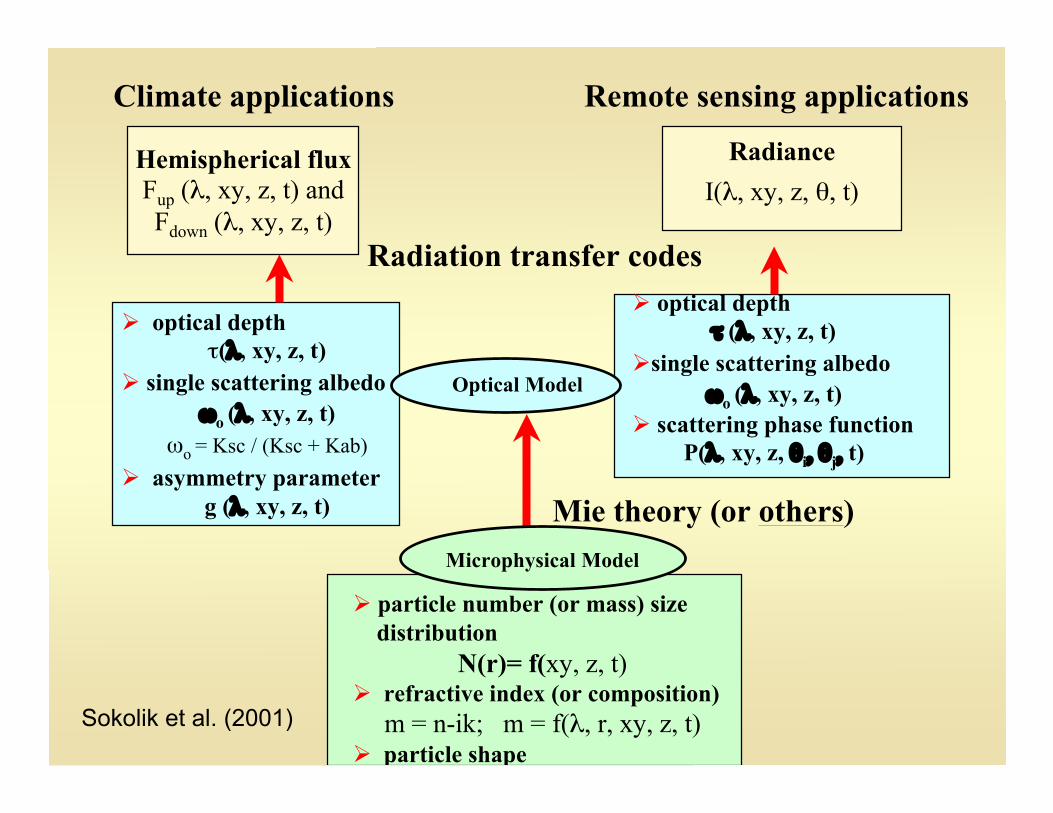
Climate applications Remote sensing applications
Hemispherical fluxFup (λ, xy, z, t) andFdown (λ, xy, z, t)
RadianceI(λ, xy, z, θ, t)
optical depthτ(λ, xy, z, t)
single scattering albedoωo (λ, xy, z, t)
ωo = Ksc / (Ksc + Kab) asymmetry parameter
g (λ, xy, z, t)
optical depthτ (λ, xy, z, t)
single scattering albedoωo (λ, xy, z, t)
scattering phase functionP(λ, xy, z, θi, θj, t)
particle number (or mass) size distribution
N(r)= f(xy, z, t) refractive index (or composition)
m = n-ik; m = f(λ, r, xy, z, t) particle shape
Optical Model
Radiation transfer codes
Microphysical Model
Mie theory (or others)
Sokolik et al. (2001)
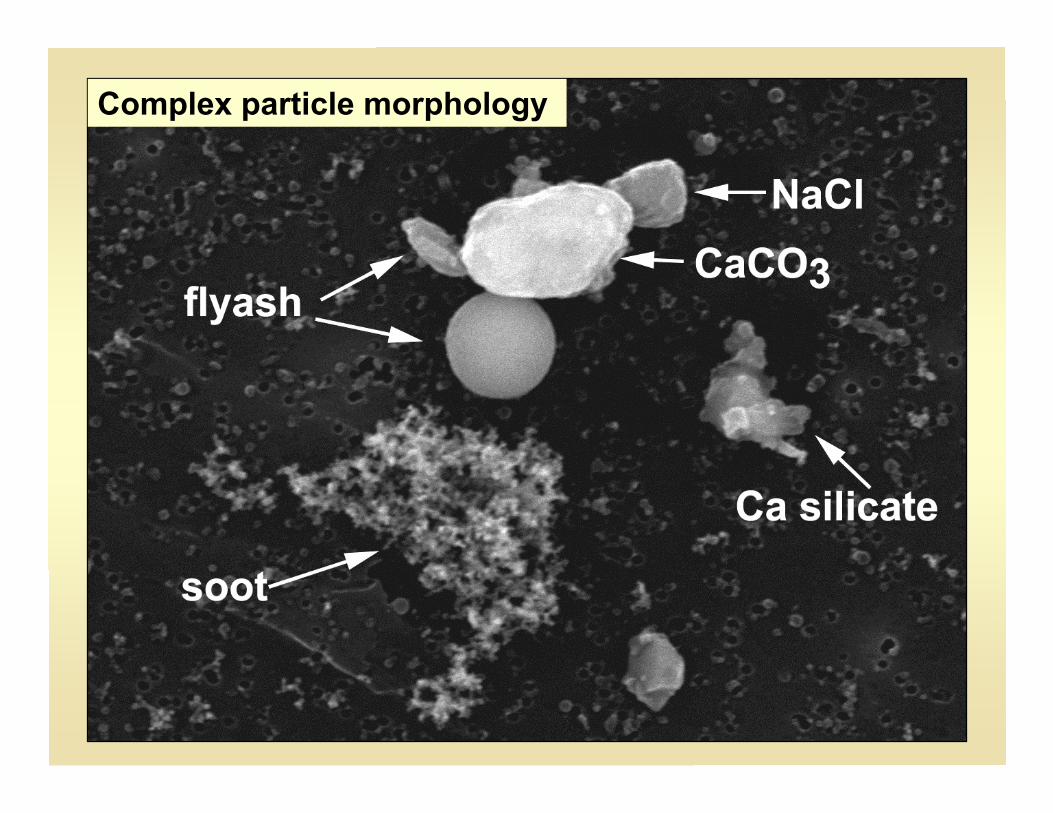
Complex particle morphology
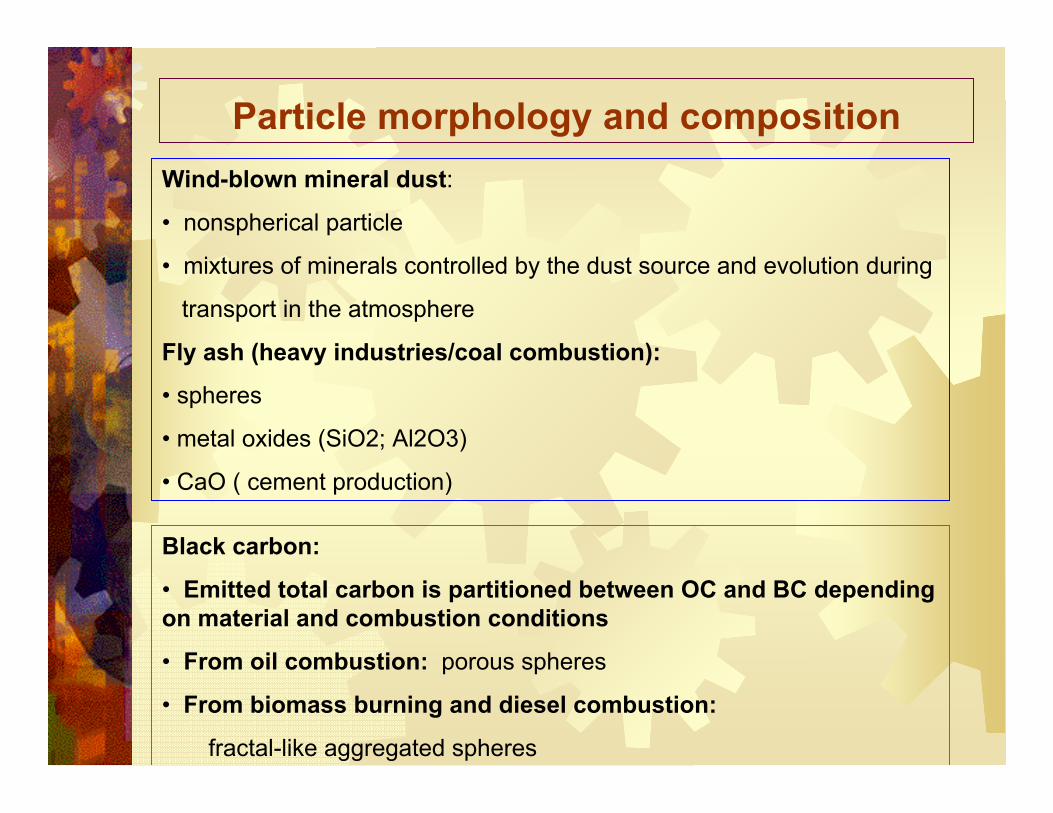
Particle morphology and compositionWind-blown mineral dust:
• nonspherical particle
• mixtures of minerals controlled by the dust source and evolution during
transport in the atmosphere
Fly ash (heavy industries/coal combustion):
• spheres
• metal oxides (SiO2; Al2O3)
• CaO ( cement production)
Black carbon:
• Emitted total carbon is partitioned between OC and BC dependingon material and combustion conditions
• From oil combustion: porous spheres
• From biomass burning and diesel combustion:
fractal-like aggregated spheres
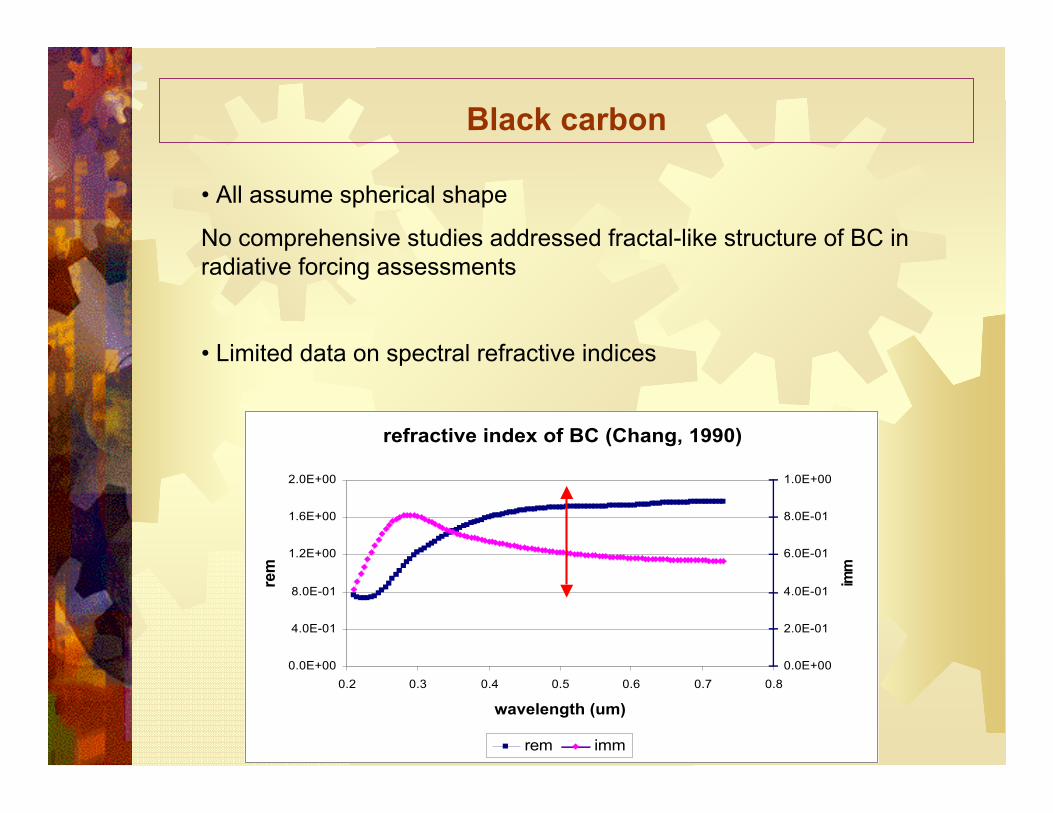
Black carbon
• All assume spherical shape
No comprehensive studies addressed fractal-like structure of BC inradiative forcing assessments
• Limited data on spectral refractive indices
refractive index of BC (Chang, 1990)
0.0E+00
4.0E-01
8.0E-01
1.2E+00
1.6E+00
2.0E+00
0.2 0.3 0.4 0.5 0.6 0.7 0.8
wavelength (um)
rem
0.0E+00
2.0E-01
4.0E-01
6.0E-01
8.0E-01
1.0E+00
imm
rem imm
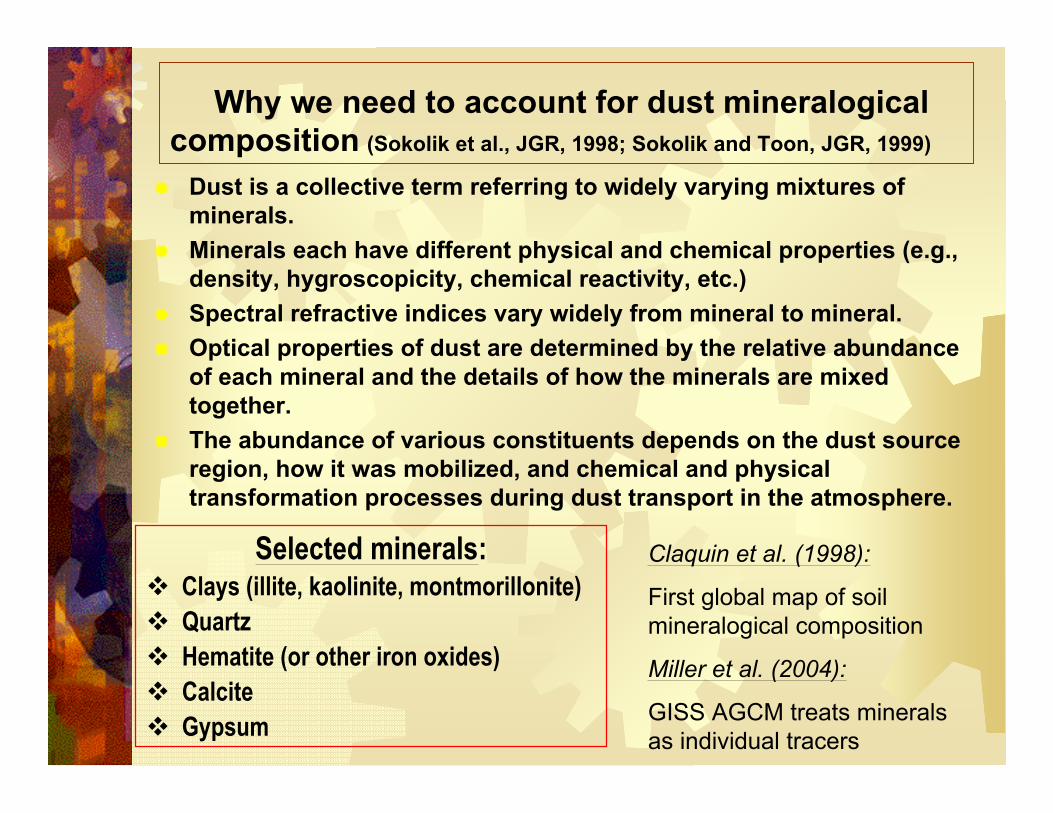
Why we need to account for dust mineralogicalcomposition (Sokolik et al., JGR, 1998; Sokolik and Toon, JGR, 1999)
Dust is a collective term referring to widely varying mixtures ofminerals.
Minerals each have different physical and chemical properties (e.g.,density, hygroscopicity, chemical reactivity, etc.)
Spectral refractive indices vary widely from mineral to mineral. Optical properties of dust are determined by the relative abundance
of each mineral and the details of how the minerals are mixedtogether.
The abundance of various constituents depends on the dust sourceregion, how it was mobilized, and chemical and physicaltransformation processes during dust transport in the atmosphere.
Selected minerals: Clays (illite, kaolinite, montmorillonite) Quartz Hematite (or other iron oxides) Calcite Gypsum
Claquin et al. (1998):
First global map of soilmineralogical composition
Miller et al. (2004):
GISS AGCM treats mineralsas individual tracers
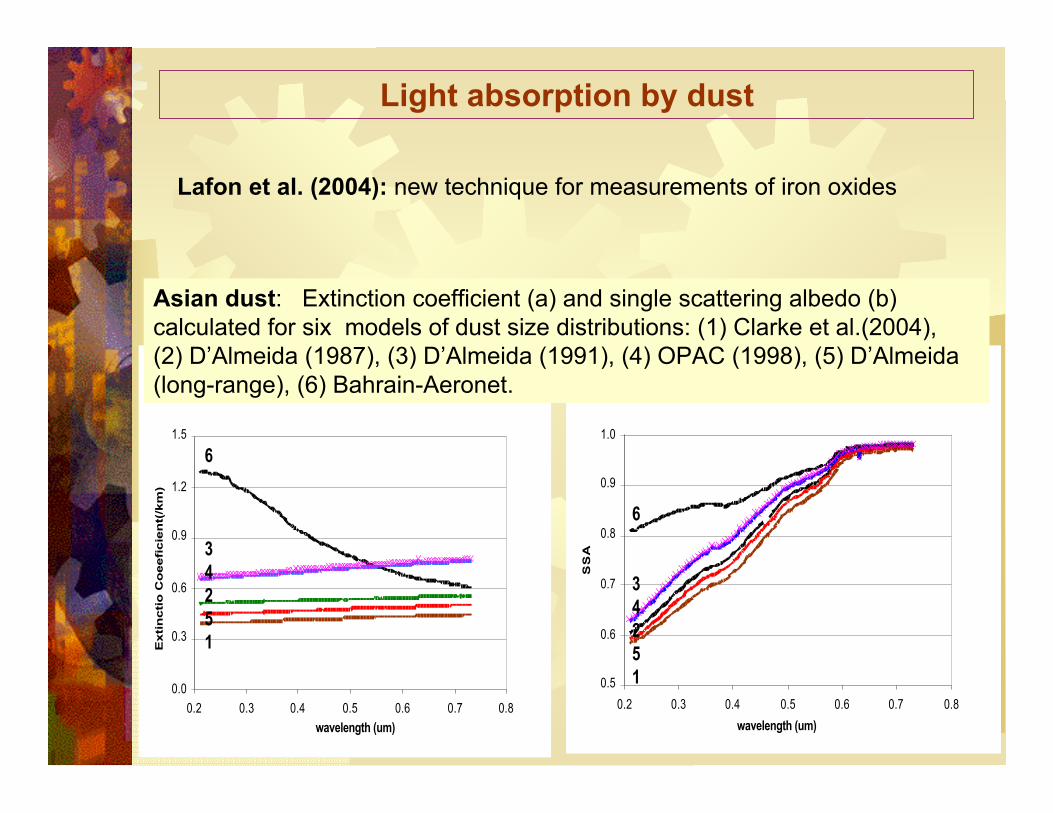
Light absorption by dust
(b) Single Scatternig Albedos of 6 size distribution modelsmoderate dust loading 3g/m^2, 99%K1%H
0.5
0.6
0.7
0.8
0.9
1.0
0.2 0.3 0.4 0.5 0.6 0.7 0.8wavelength (um)
SS
A
(a) Extinction Coefficients of 6 size distribution modelsmoderate dust loading 3g/m^2, 99%K1%H
0.0
0.3
0.6
0.9
1.2
1.5
0.2 0.3 0.4 0.5 0.6 0.7 0.8wavelength (um)
Exti
ncti
o C
oeefi
cie
nt(
/km
)
6
34251
6
34251
Asian dust: Extinction coefficient (a) and single scattering albedo (b)calculated for six models of dust size distributions: (1) Clarke et al.(2004),(2) D’Almeida (1987), (3) D’Almeida (1991), (4) OPAC (1998), (5) D’Almeida(long-range), (6) Bahrain-Aeronet.
Lafon et al. (2004): new technique for measurements of iron oxides
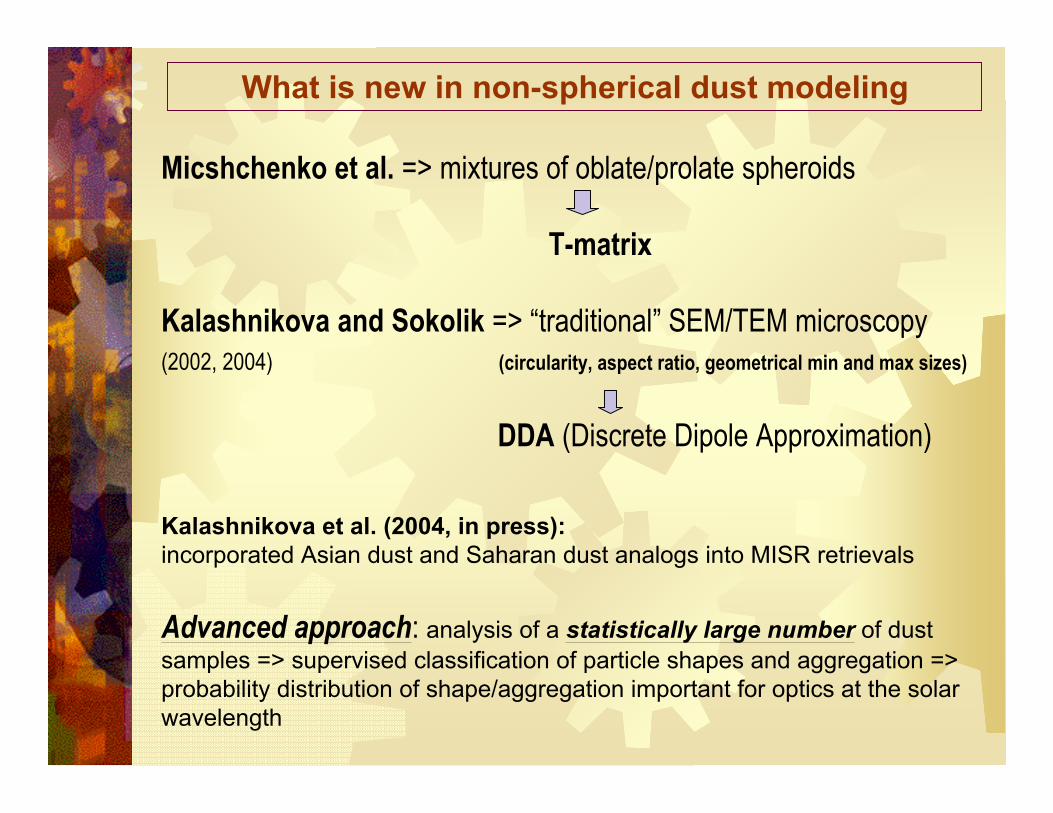
What is new in non-spherical dust modeling
Micshchenko et al. => mixtures of oblate/prolate spheroids
T-matrix
Kalashnikova and Sokolik => “traditional” SEM/TEM microscopy(2002, 2004) (circularity, aspect ratio, geometrical min and max sizes)
DDA (Discrete Dipole Approximation)
Kalashnikova et al. (2004, in press):incorporated Asian dust and Saharan dust analogs into MISR retrievals
Advanced approach: analysis of a statistically large number of dustsamples => supervised classification of particle shapes and aggregation =>probability distribution of shape/aggregation important for optics at the solarwavelength
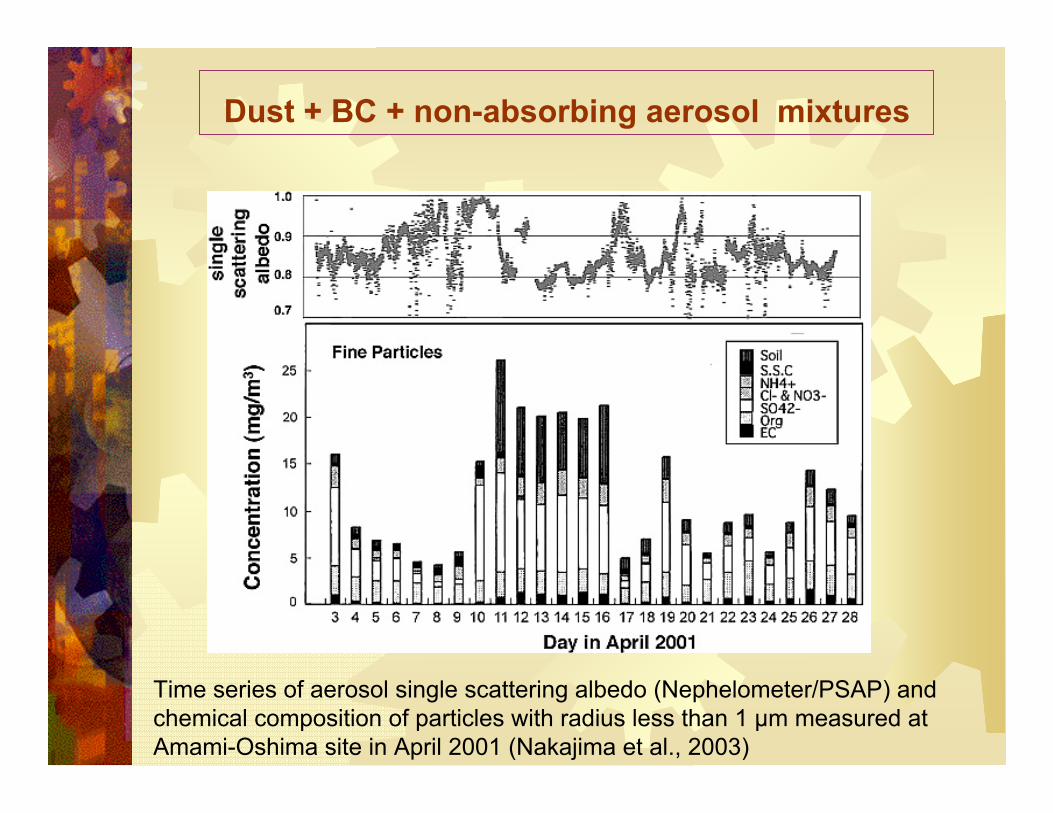
Dust + BC + non-absorbing aerosol mixtures
Time series of aerosol single scattering albedo (Nephelometer/PSAP) andchemical composition of particles with radius less than 1 µm measured atAmami-Oshima site in April 2001 (Nakajima et al., 2003)
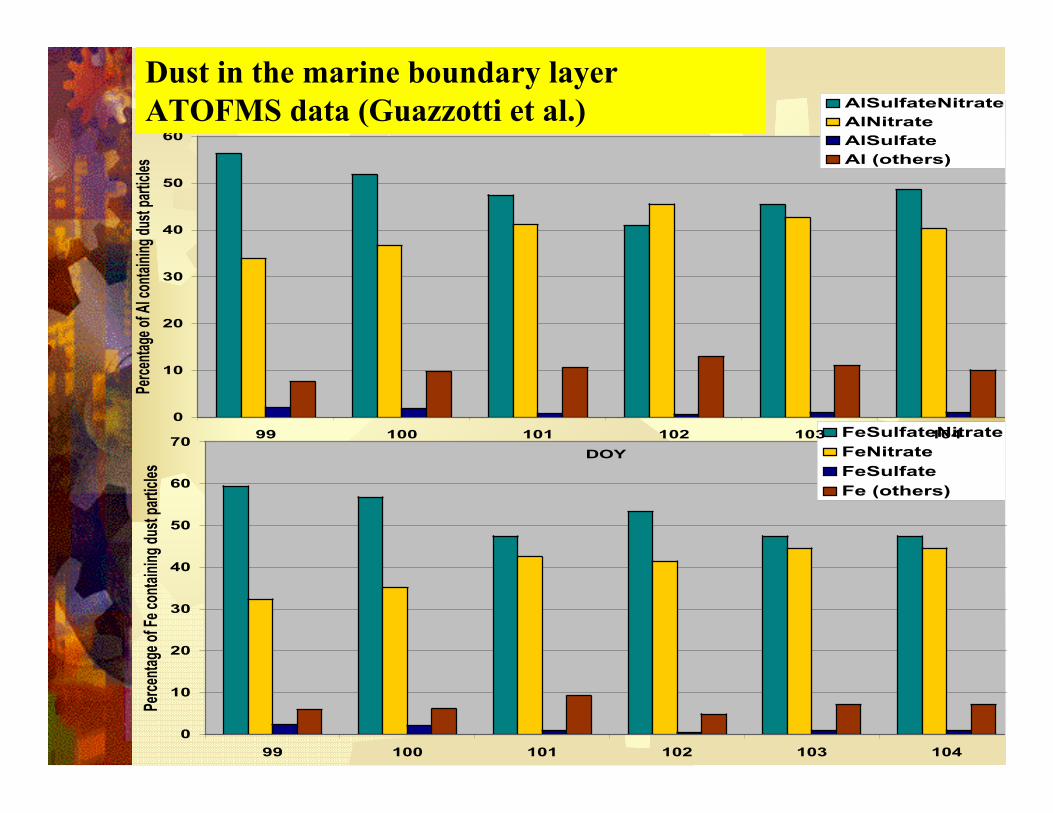
Fe containing dust particles
0
10
20
30
40
50
60
70
99 100 101 102 103 104DOY
Perce
ntage
of Fe
conta
ining
dust
partic
les
FeSulfateNitrateFeNitrateFeSulfateFe (others)
Al containing dust particles
0
10
20
30
40
50
60
99 100 101 102 103 104DOY
Perce
ntage
of Al
conta
ining
dust
partic
les
AlSulfateNitrateAlNitrateAlSulfateAl (others)
Dust in the marine boundary layerATOFMS data (Guazzotti et al.)

Processes resulting in the formation ofmulticomponent aerosols containing dust
Adsorption of water vapor on dust particlesurfaces Cloud processing Coagulation of dust with other aerosol or cloudparticles Heterogeneous chemistry: uptake of SO2, NO2, (H2SO4 or HNO3) gases on dustparticle surfaces followed by heterogeneous chemicalreactions resulting in the formation of sulfates or nitrates.
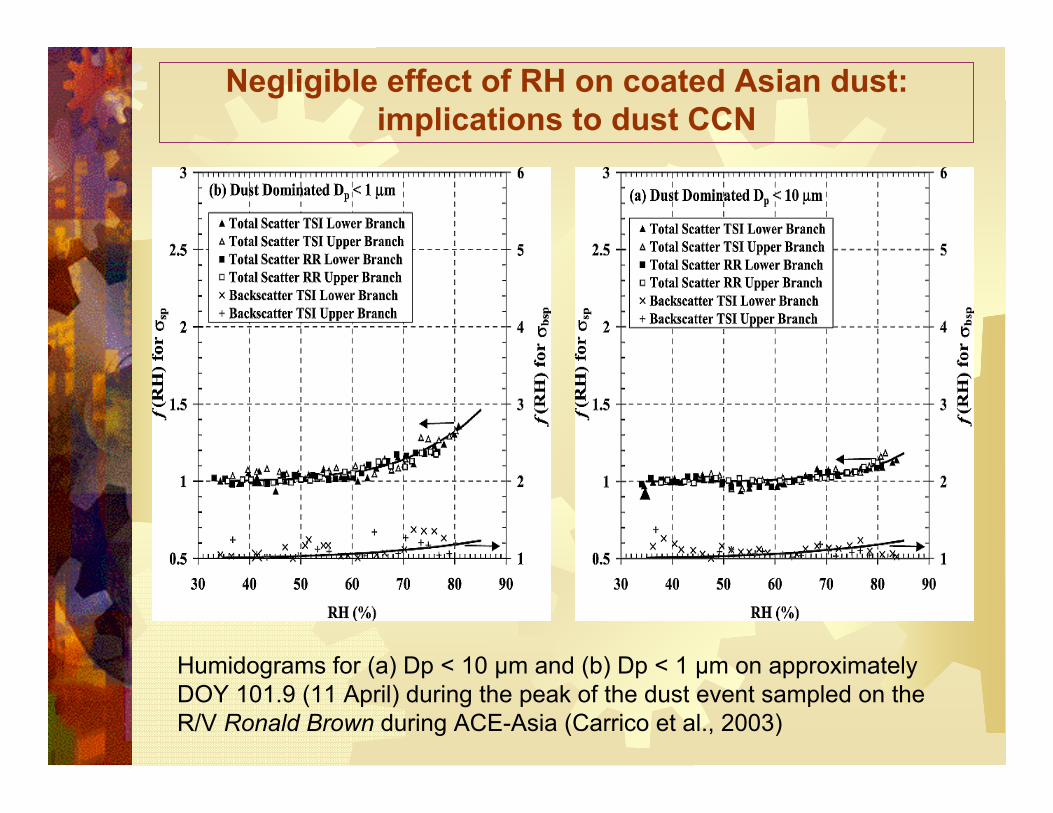
Negligible effect of RH on coated Asian dust:implications to dust CCN
Humidograms for (a) Dp < 10 µm and (b) Dp < 1 µm on approximatelyDOY 101.9 (11 April) during the peak of the dust event sampled on theR/V Ronald Brown during ACE-Asia (Carrico et al., 2003)
0 %
2 0 %
4 0 %
6 0 %
8 0 %
1 0 0 %0
.4-0
.6
0.6
-0.8
0.8
-1.0
1.0
-1.2
1.2
-1.4
1.4
-1.6
1.6
-1.8
1.8
-2.0
2.0
-2.2
2.2
-.2
4
2.4
-2.6
2.6
-2.8
2.8
-3.0
Da (? m )
Perc
entg
e of
Du
st
Part
icle
s
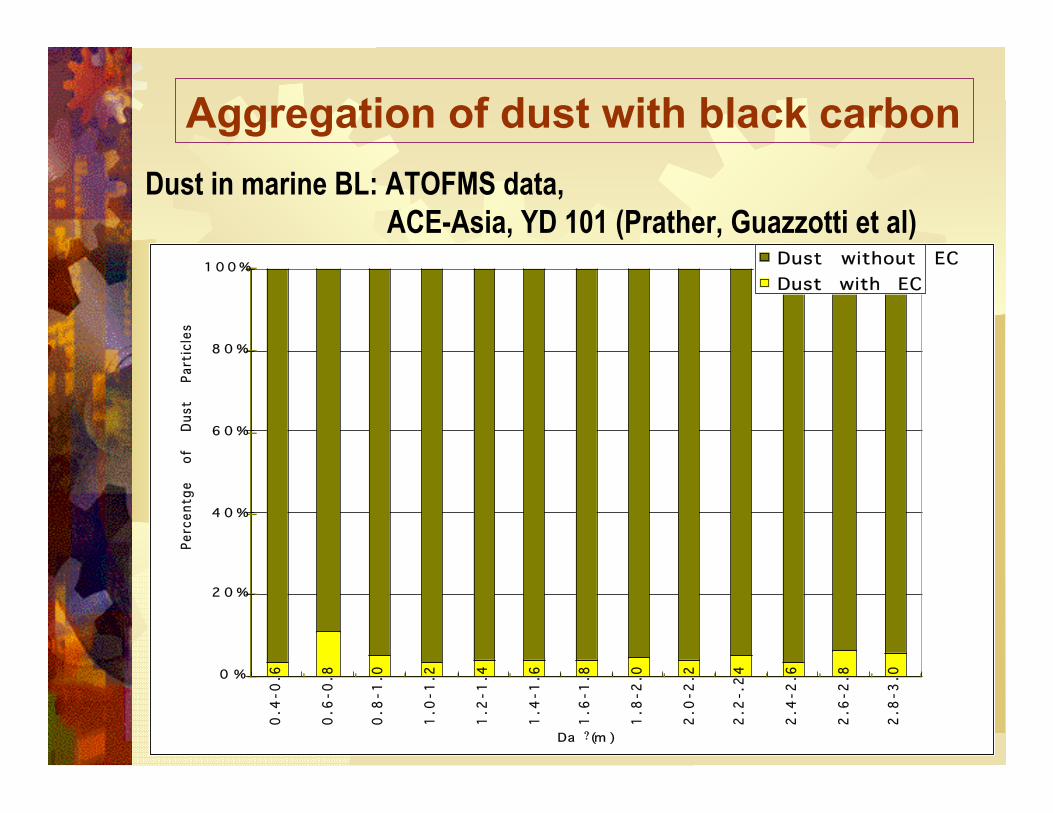
Dust without ECDust with EC
Dust in marine BL: ATOFMS data, ACE-Asia, YD 101 (Prather, Guazzotti et al)
Aggregation of dust with black carbon
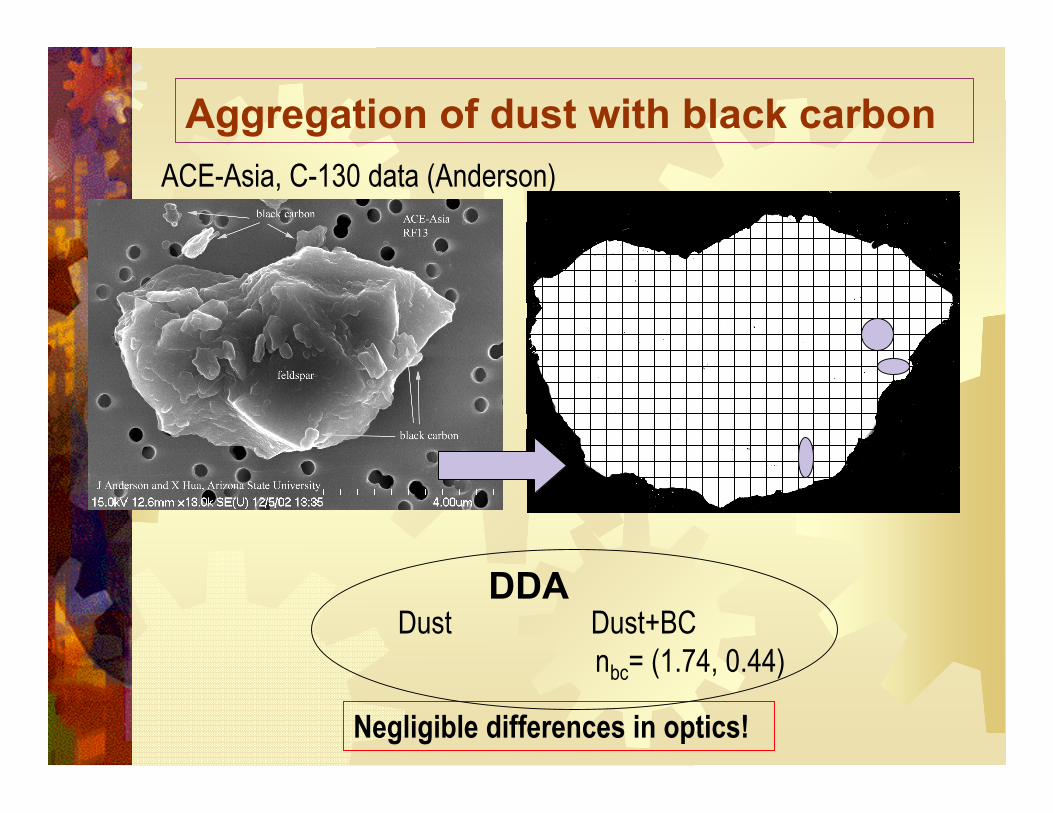
Aggregation of dust with black carbonACE-Asia, C-130 data (Anderson)
DDA Dust Dust+BC nbc= (1.74, 0.44)
Negligible differences in optics!
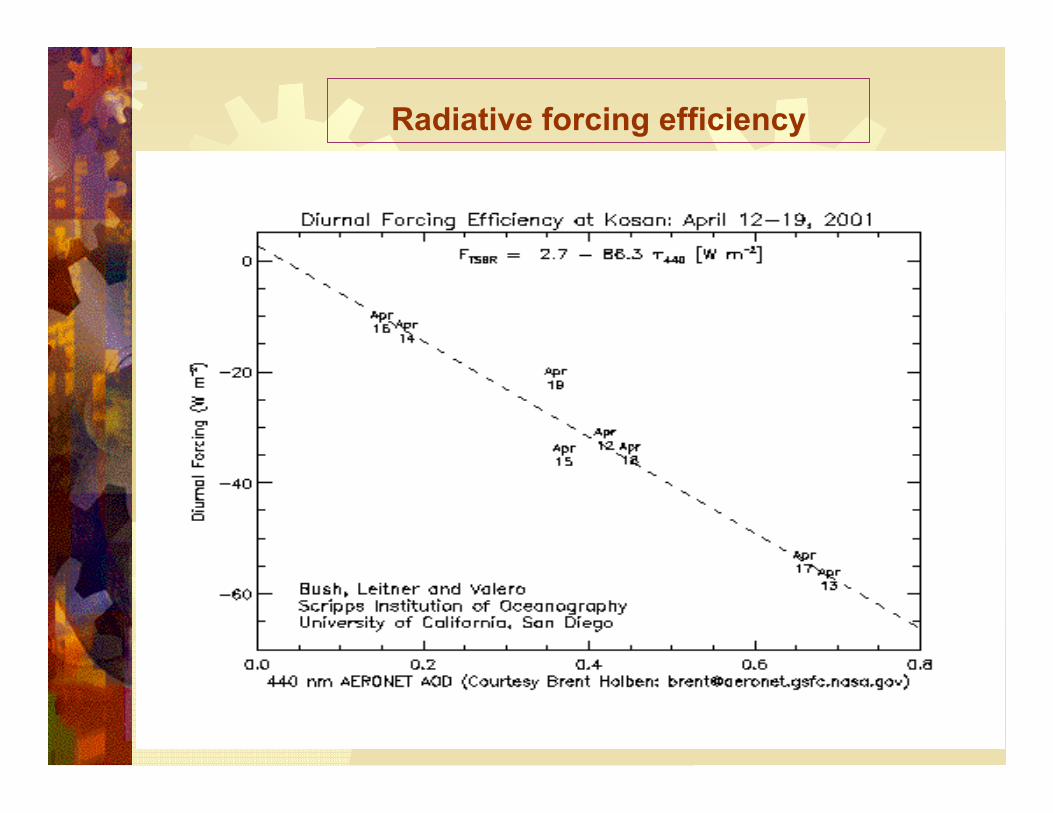
Radiative forcing efficiency
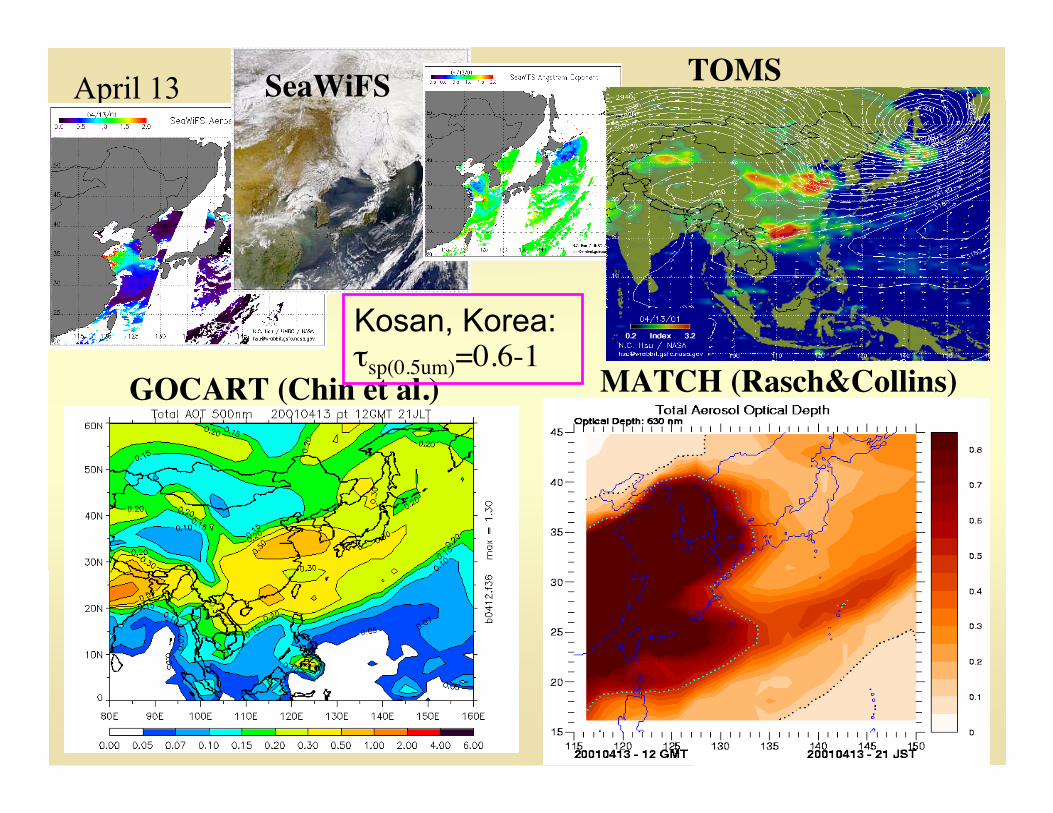
April 13 SeaWiFS TOMS
GOCART (Chin et al.) MATCH (Rasch&Collins)
Kosan, Korea:τsp(0.5um)=0.6-1
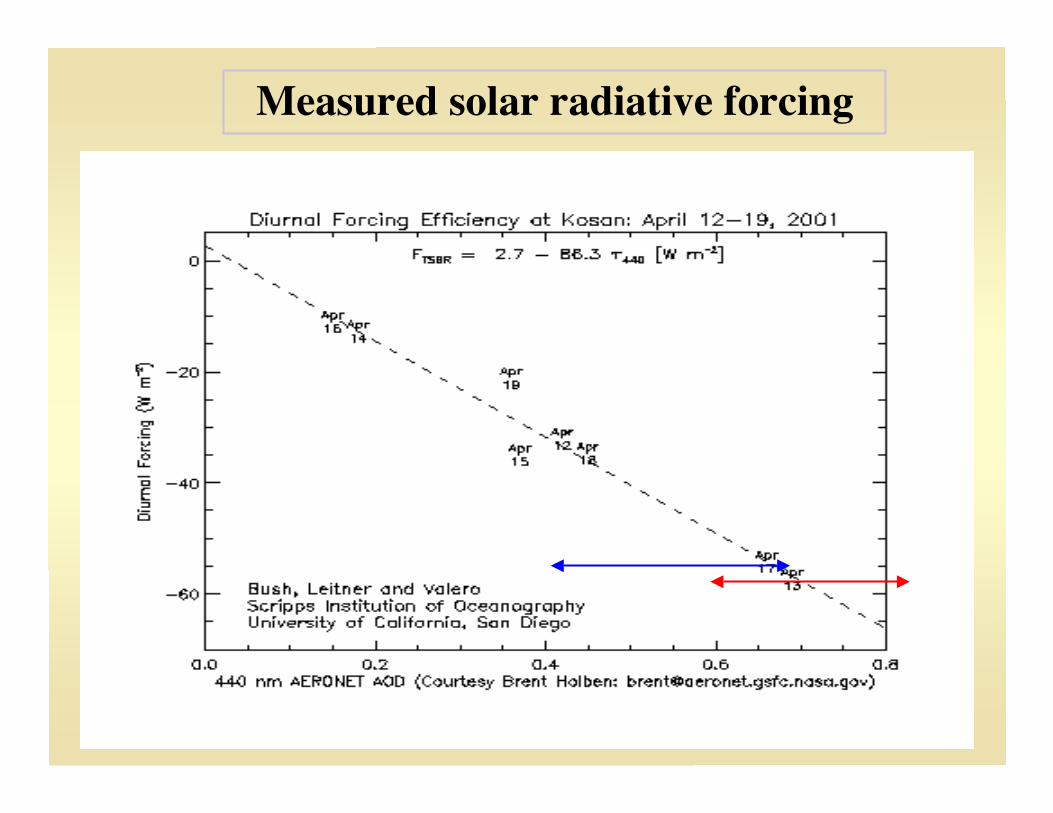
Measured solar radiative forcing
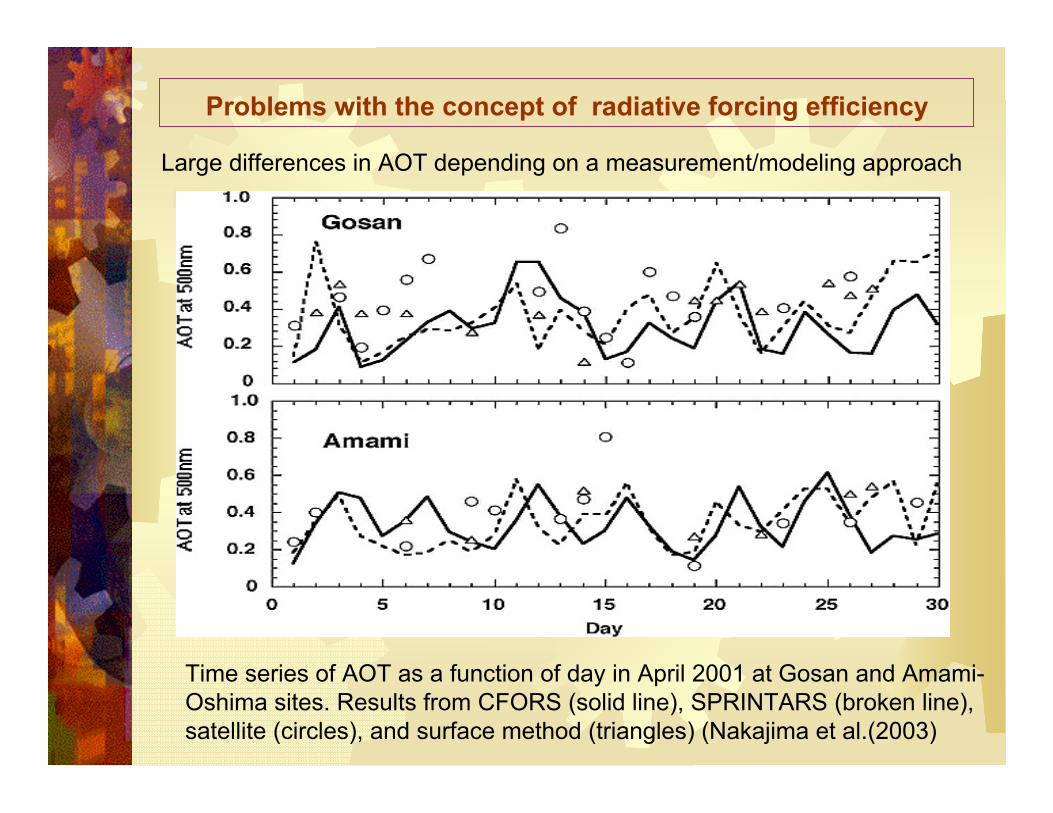
Problems with the concept of radiative forcing efficiency
Large differences in AOT depending on a measurement/modeling approach
Time series of AOT as a function of day in April 2001 at Gosan and Amami-Oshima sites. Results from CFORS (solid line), SPRINTARS (broken line),satellite (circles), and surface method (triangles) (Nakajima et al.(2003)
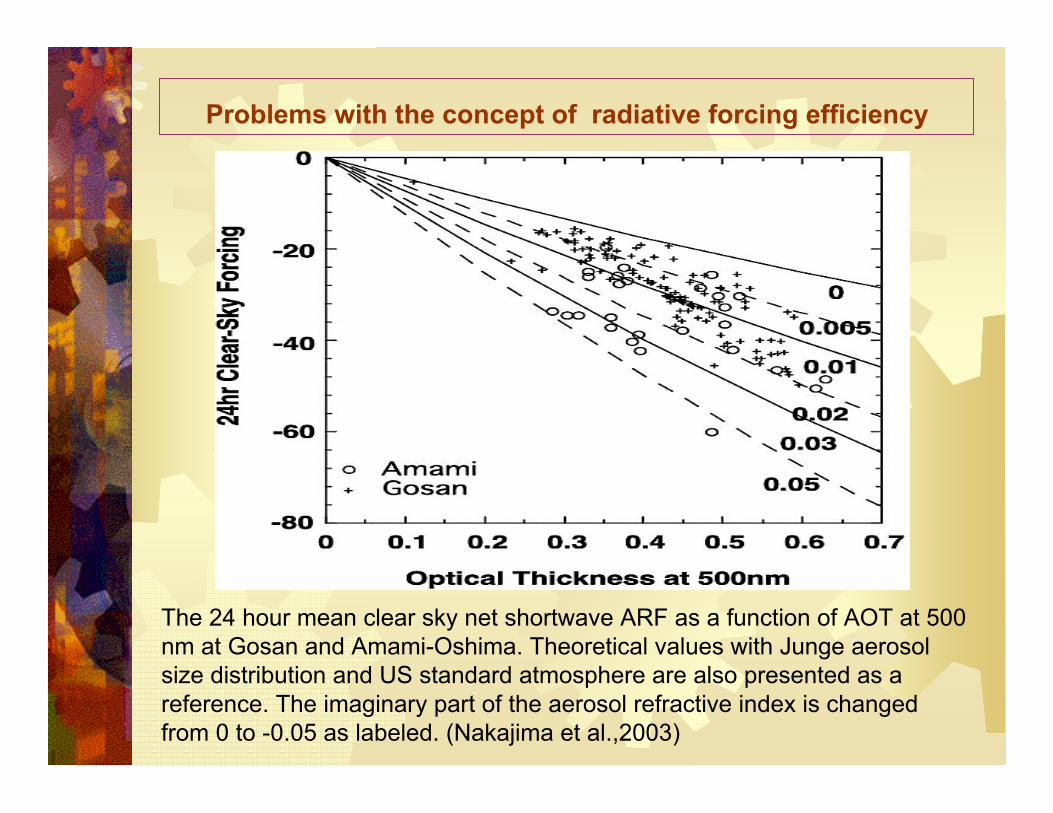
Problems with the concept of radiative forcing efficiency
The 24 hour mean clear sky net shortwave ARF as a function of AOT at 500nm at Gosan and Amami-Oshima. Theoretical values with Junge aerosolsize distribution and US standard atmosphere are also presented as areference. The imaginary part of the aerosol refractive index is changedfrom 0 to -0.05 as labeled. (Nakajima et al.,2003)
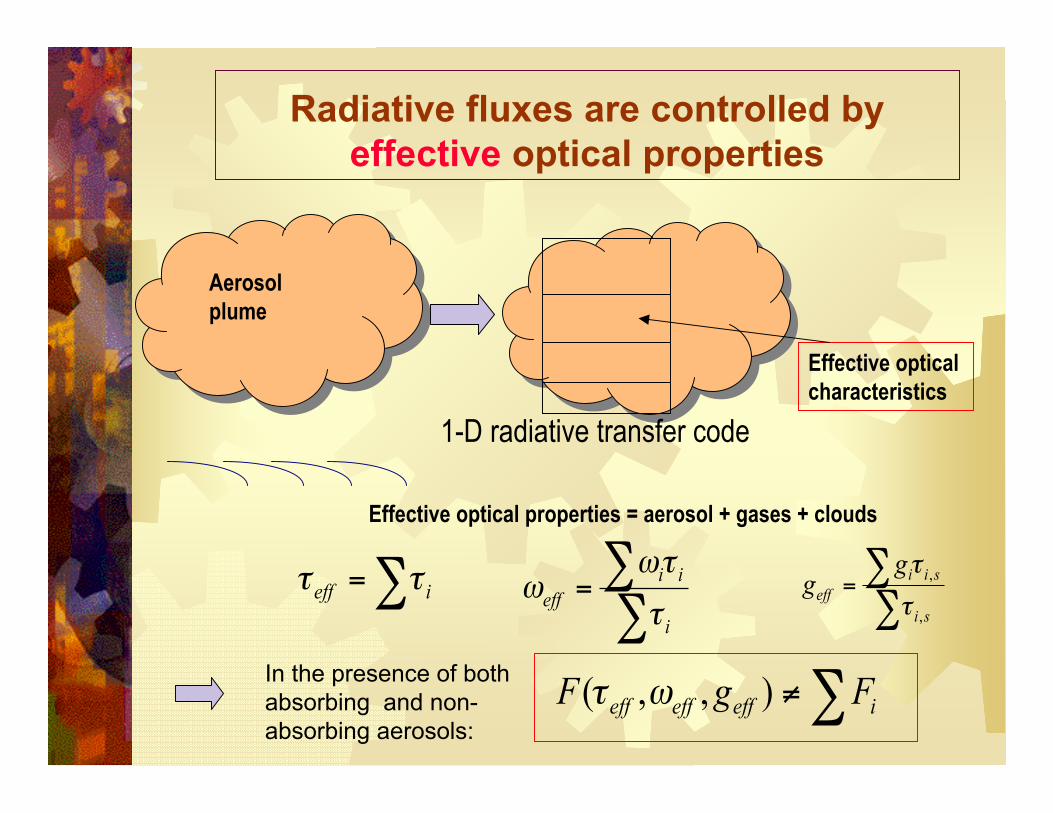
Radiative fluxes are controlled byeffective optical properties
Effective optical properties = aerosol + gases + clouds
1-D radiative transfer code
Effective opticalcharacteristics
Aerosolplume
∑= ieff ττ∑∑=
i
iieff τ
τωω ∑
∑=si
siieff
gg
,
,
τ
τ
∑≠ ieffeffeff FgF ),,( ωτIn the presence of bothabsorbing and non-absorbing aerosols:
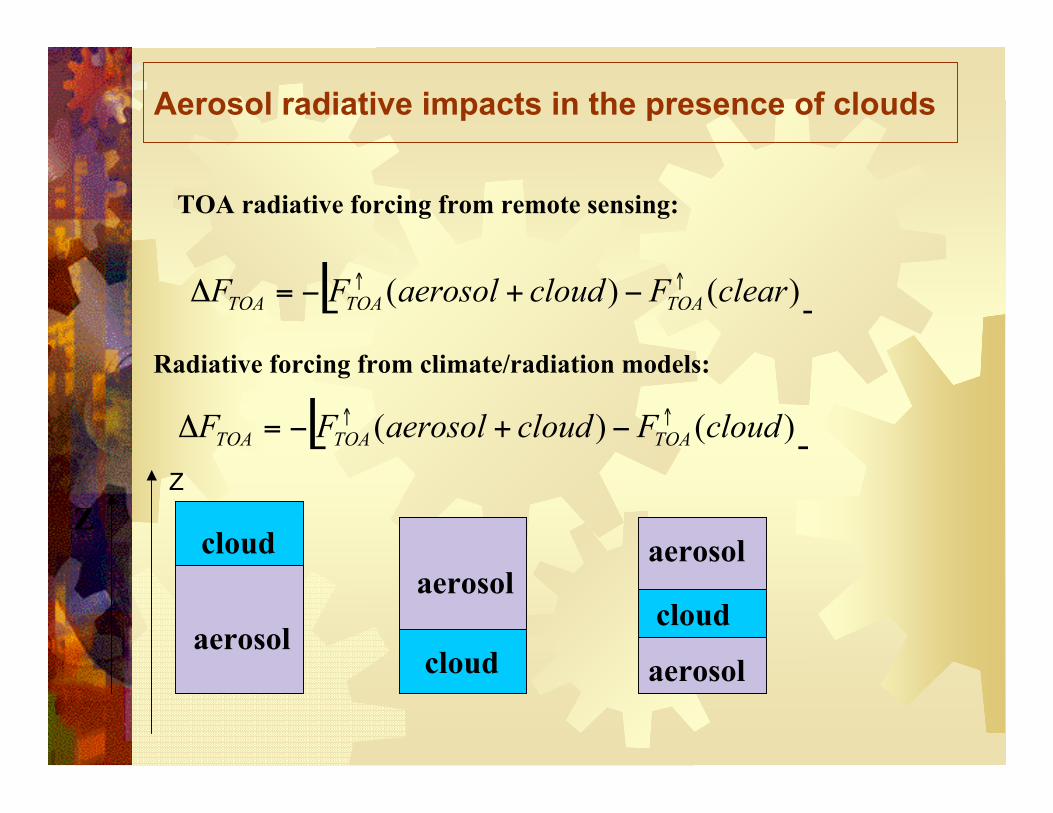
Aerosol radiative impacts in the presence of clouds
TOA radiative forcing from remote sensing:
Radiative forcing from climate/radiation models:
[ ])()( clearFcloudaerosolFF TOATOATOA↑↑ −+−=Δ
[ ])()( cloudFcloudaerosolFF TOATOATOA↑↑ −+−=Δ
aerosol
cloudaerosol
aerosol
aerosolcloudcloud
ZZ
-100
-80
-60
-40
-20
0
20
40
60
Δ FTO
A (
W/m
2 ) Solar
IR
Solar
IR
Net Solar
IR
Net
only dust dust + thin cloud dust + thick cloud
Net Solar
IR
Net
Solar
IR
Net
dust + thin cloud dust + thick cloud
(a)
-100
-50
0
50
100
150
200
ΔF T
OA (
W/m
2 )
Solar
IR
Solar
IR
Net
Solar
IR
Net
only dust dust + thin cloud
dust + thick cloud
Net
(b)
Solar
Solar
IR IR
Net
Net
dust + thin cloud dust + thick cloud
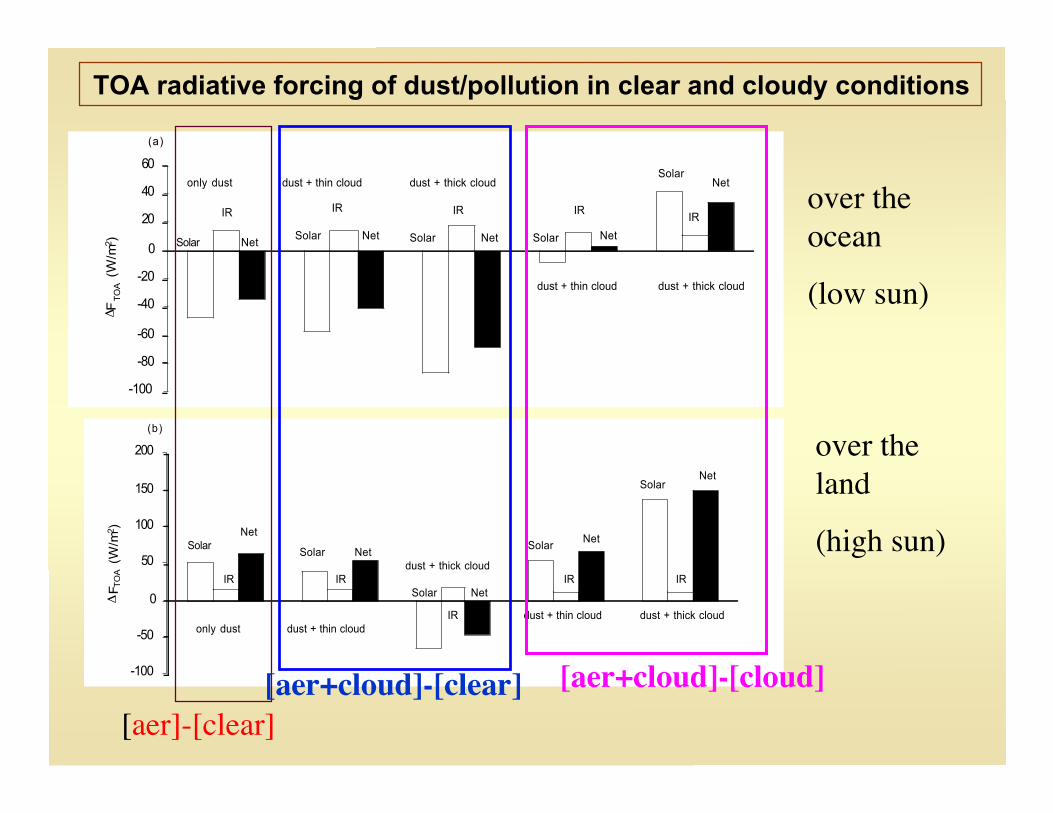
TOA radiative forcing of dust/pollution in clear and cloudy conditions
over theocean
(low sun)
over theland
(high sun)
[aer]-[clear] [aer+cloud]-[clear] [aer+cloud]-[cloud]
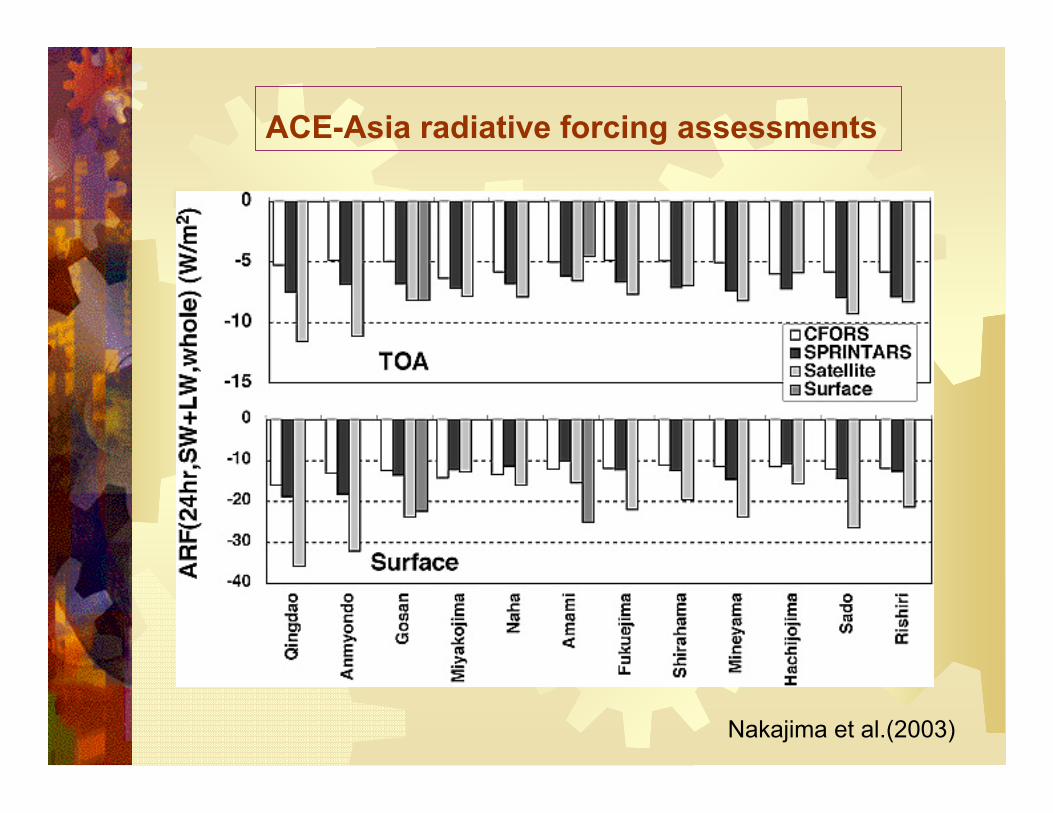
ACE-Asia radiative forcing assessments
Nakajima et al.(2003)
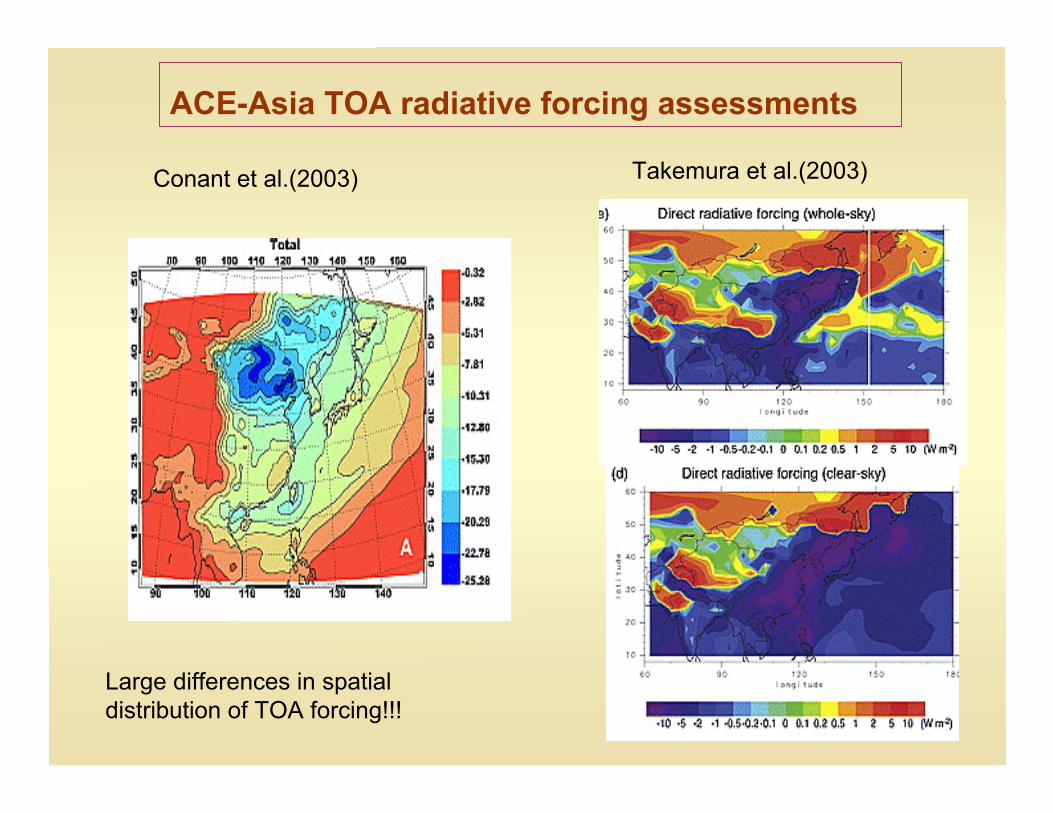
ACE-Asia TOA radiative forcing assessments
Conant et al.(2003) Takemura et al.(2003)
Large differences in spatialdistribution of TOA forcing!!!
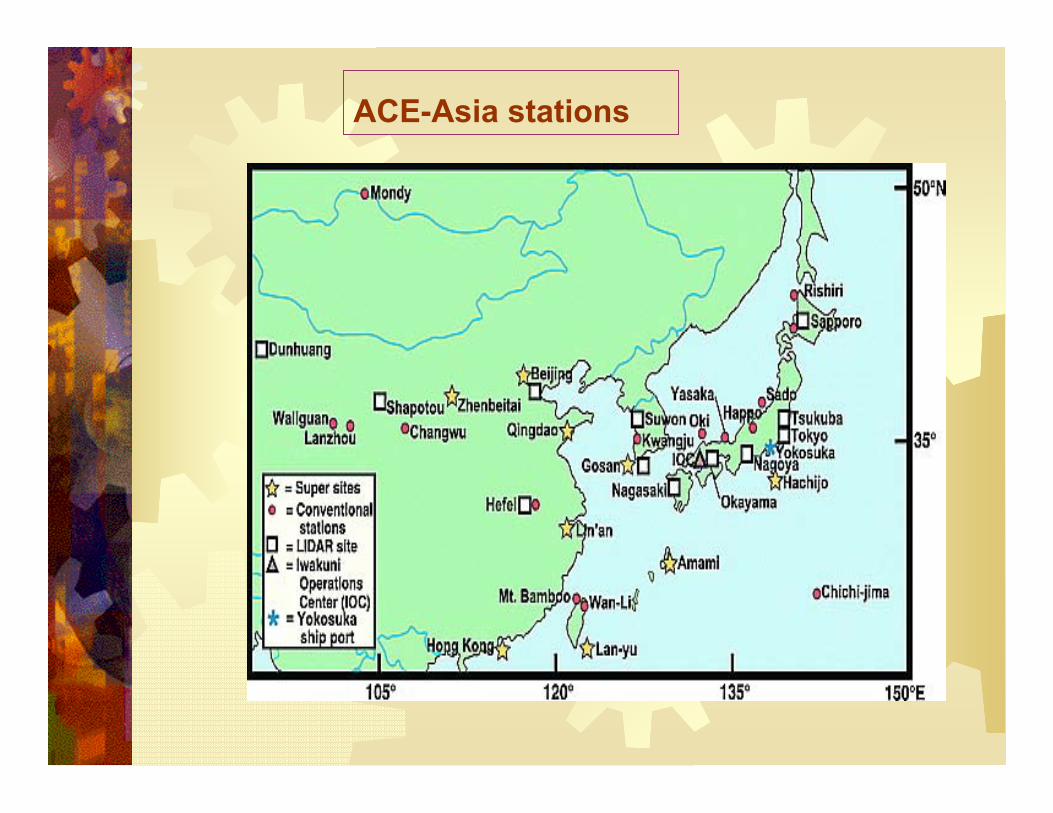
ACE-Asia stations
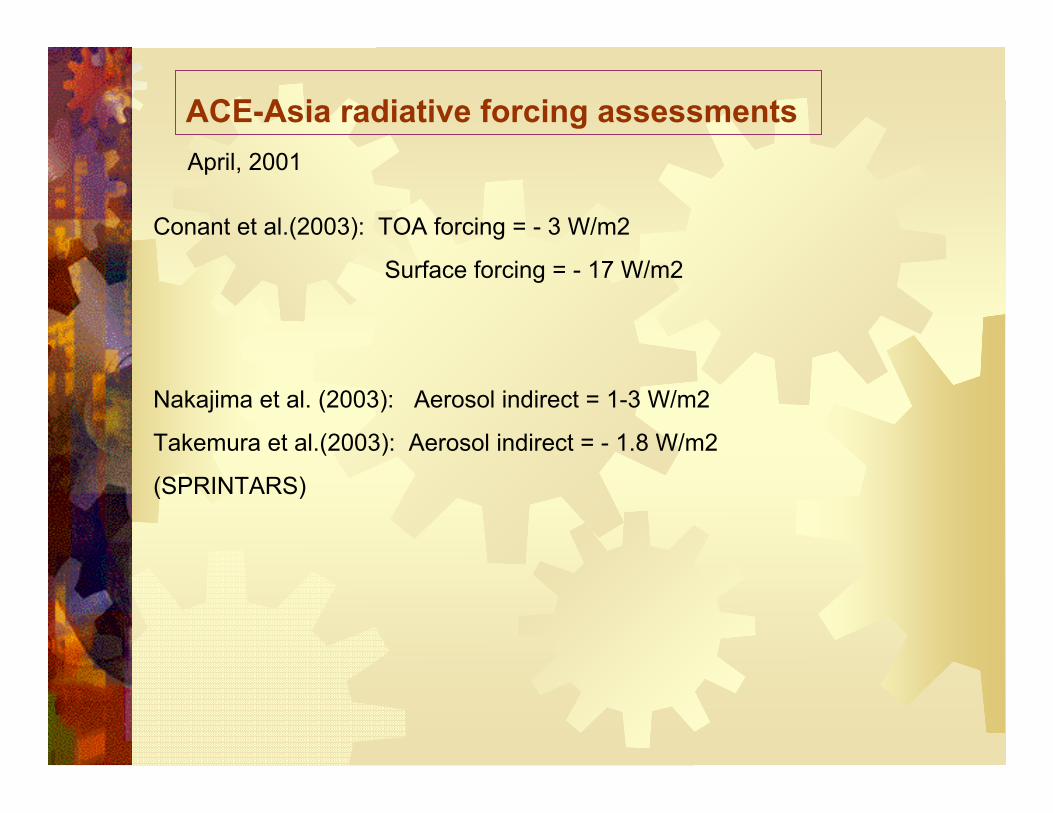
ACE-Asia radiative forcing assessments
Conant et al.(2003): TOA forcing = - 3 W/m2
Surface forcing = - 17 W/m2
Nakajima et al. (2003): Aerosol indirect = 1-3 W/m2
Takemura et al.(2003): Aerosol indirect = - 1.8 W/m2
(SPRINTARS)
April, 2001
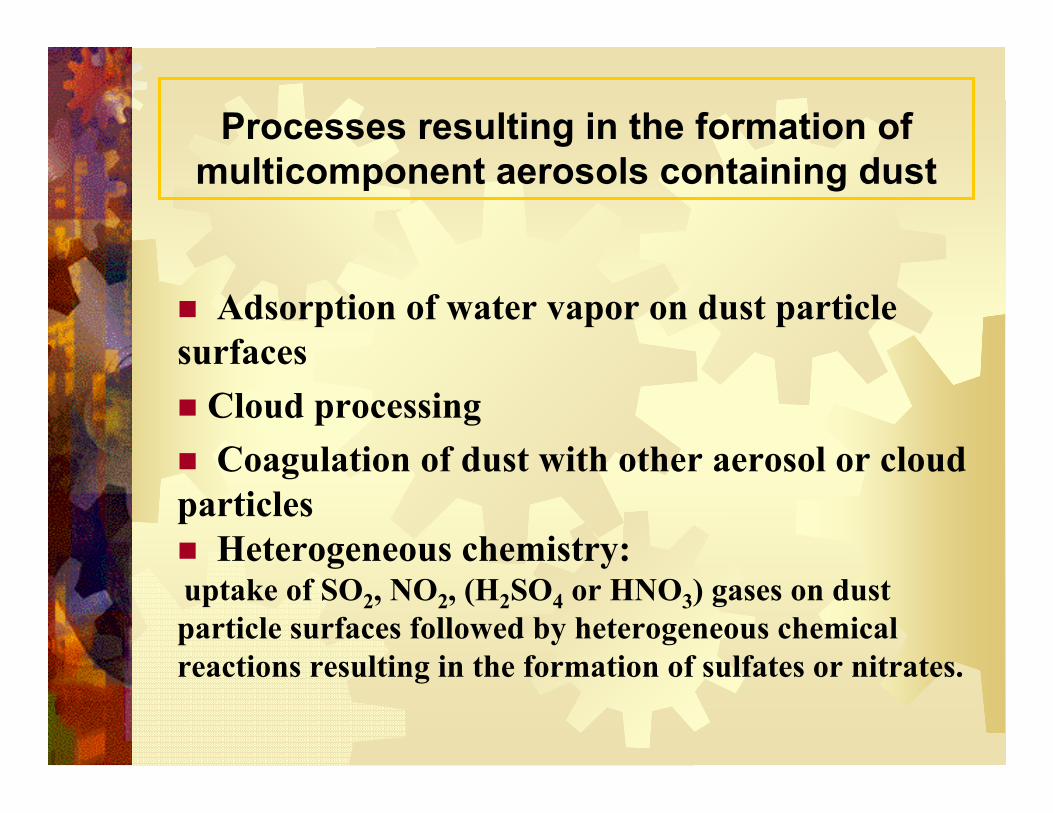
Processes resulting in the formation ofmulticomponent aerosols containing dust
Adsorption of water vapor on dust particlesurfaces Cloud processing Coagulation of dust with other aerosol or cloudparticles Heterogeneous chemistry: uptake of SO2, NO2, (H2SO4 or HNO3) gases on dustparticle surfaces followed by heterogeneous chemicalreactions resulting in the formation of sulfates or nitrates.
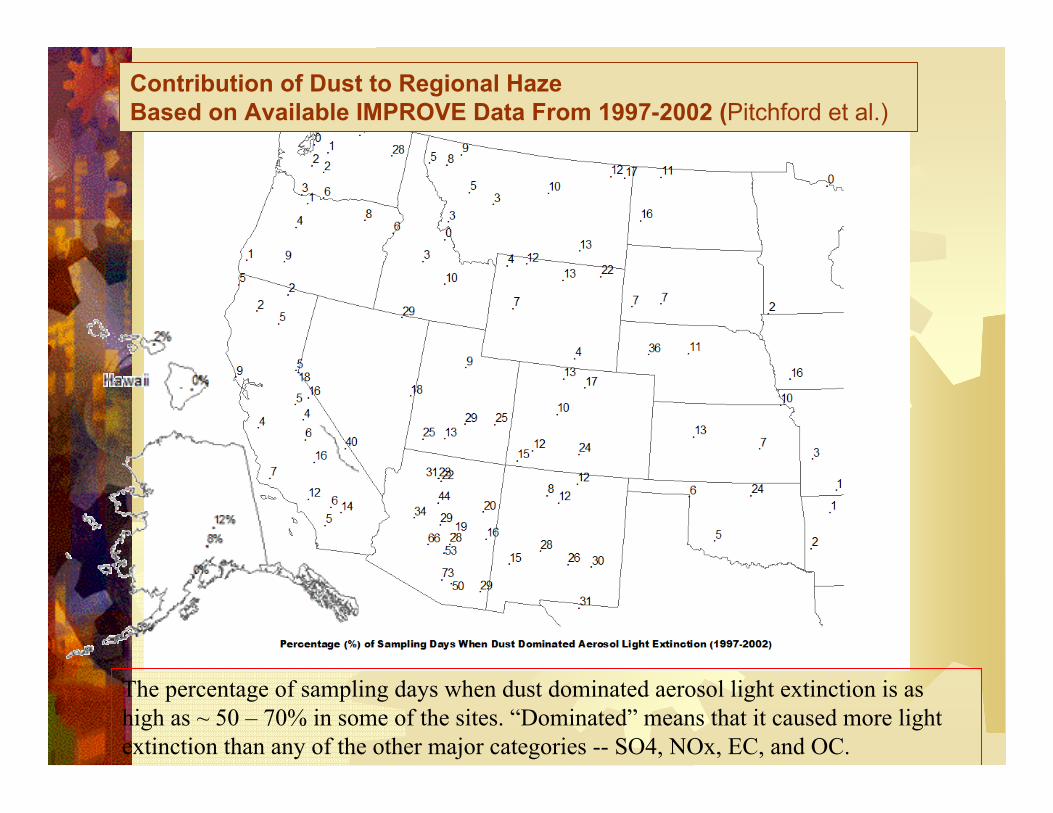
The percentage of sampling days when dust dominated aerosol light extinction is ashigh as ~ 50 – 70% in some of the sites. “Dominated” means that it caused more lightextinction than any of the other major categories -- SO4, NOx, EC, and OC.
Contribution of Dust to Regional HazeBased on Available IMPROVE Data From 1997-2002 (Pitchford et al.)
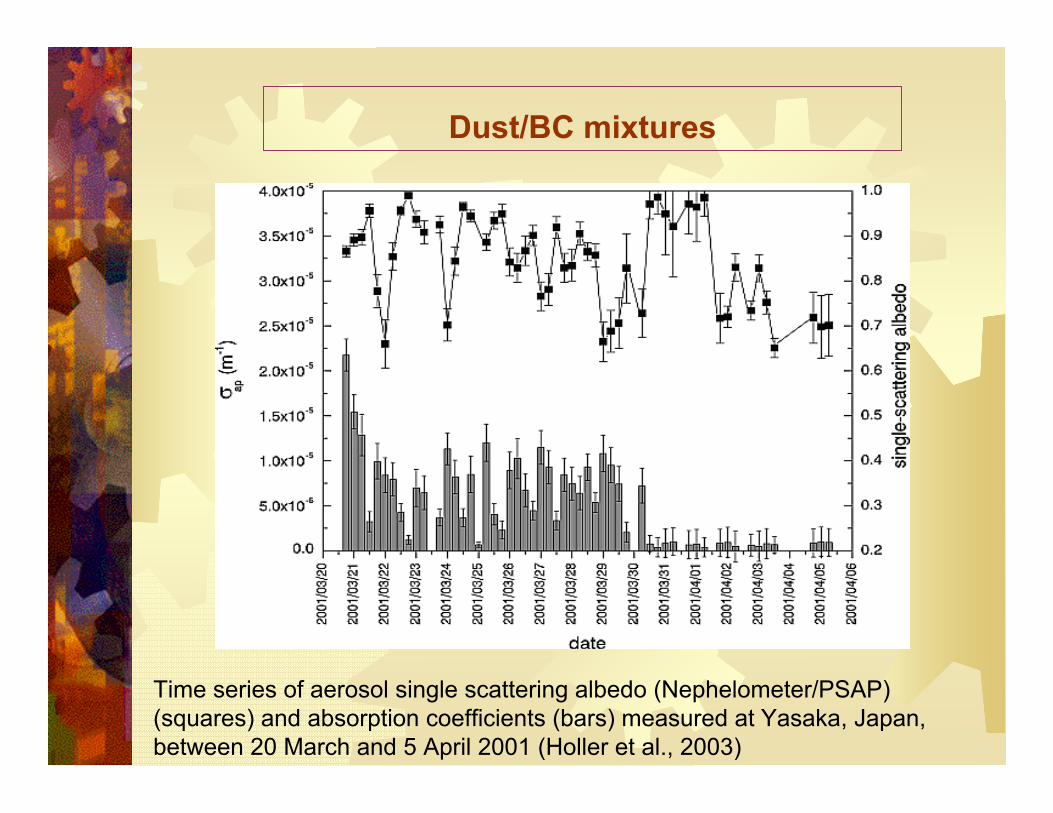
Dust/BC mixtures
Time series of aerosol single scattering albedo (Nephelometer/PSAP)(squares) and absorption coefficients (bars) measured at Yasaka, Japan,between 20 March and 5 April 2001 (Holler et al., 2003)
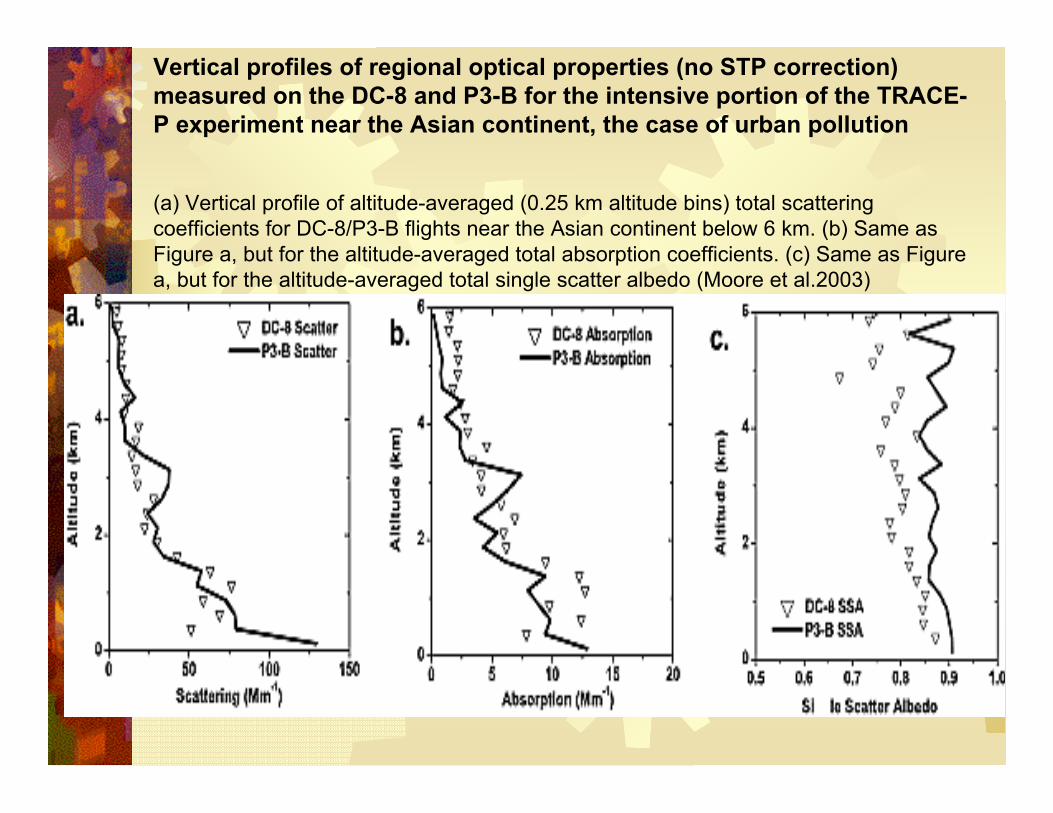
Vertical profiles of regional optical properties (no STP correction)measured on the DC-8 and P3-B for the intensive portion of the TRACE-P experiment near the Asian continent, the case of urban pollution
(a) Vertical profile of altitude-averaged (0.25 km altitude bins) total scatteringcoefficients for DC-8/P3-B flights near the Asian continent below 6 km. (b) Same asFigure a, but for the altitude-averaged total absorption coefficients. (c) Same as Figurea, but for the altitude-averaged total single scatter albedo (Moore et al.2003)
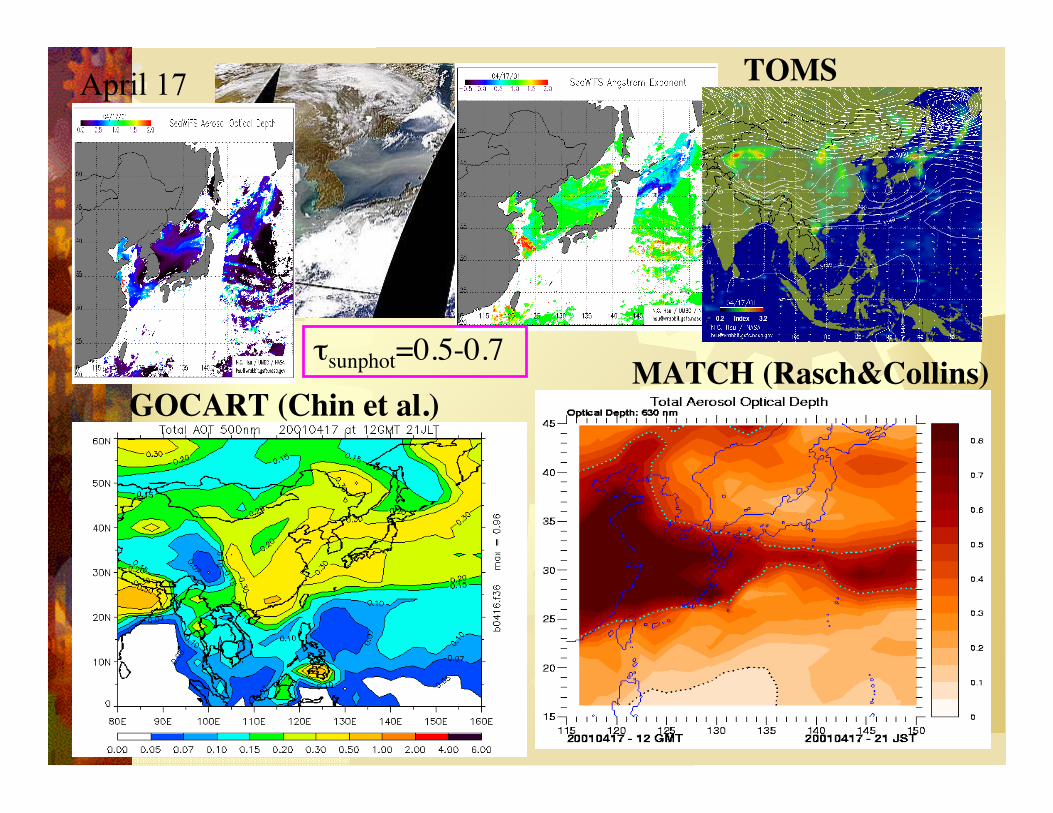
April 17 TOMS
MATCH (Rasch&Collins)GOCART (Chin et al.)
τsunphot=0.5-0.7
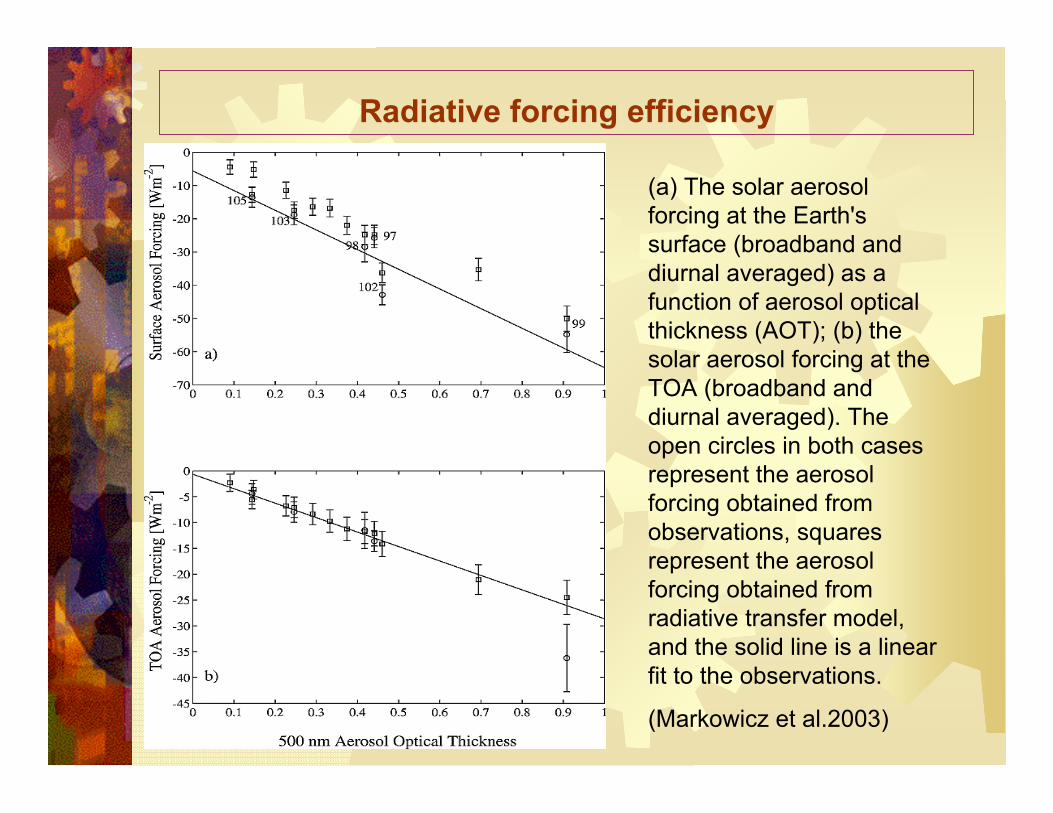
Radiative forcing efficiency
(a) The solar aerosolforcing at the Earth'ssurface (broadband anddiurnal averaged) as afunction of aerosol opticalthickness (AOT); (b) thesolar aerosol forcing at theTOA (broadband anddiurnal averaged). Theopen circles in both casesrepresent the aerosolforcing obtained fromobservations, squaresrepresent the aerosolforcing obtained fromradiative transfer model,and the solid line is a linearfit to the observations.
(Markowicz et al.2003)
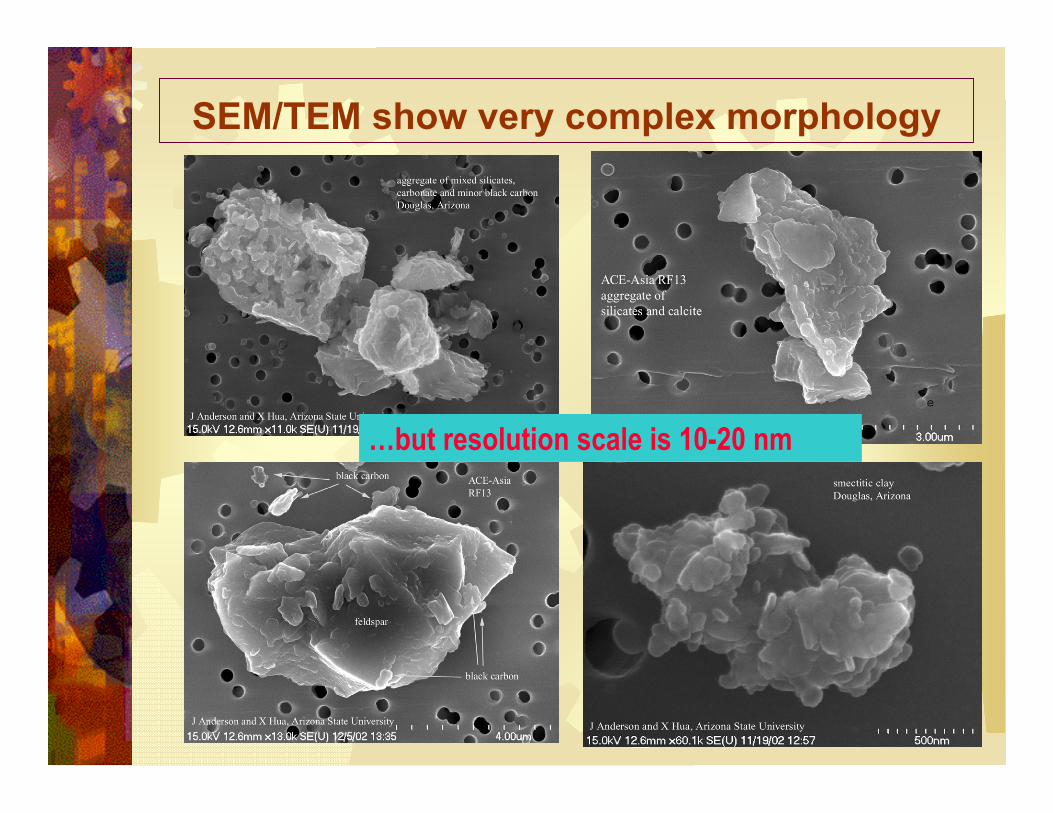
SEM/TEM show very complex morphology
…but resolution scale is 10-20 nm


![Data Validation Charts for Aerosol Sulfate Definitions: Sulfate: SO4fVal = [SO 4 ]](https://static.fdocument.org/doc/165x107/5681474d550346895db491ae/data-validation-charts-for-aerosol-sulfate-definitions-sulfate-so4fval-.jpg)


![[Presentation (pdf, 4.2 Mb)] - Harvard Universityacmg.seas.harvard.edu/presentations/IGC6/talks/MonD_BC_curci... · SENSITIVITY TESTS WITH GEOS-Chem AEROSOL OPTICAL PROPERTIES: THE](https://static.fdocument.org/doc/165x107/5a9d74e07f8b9abd058d5ffa/presentation-pdf-42-mb-harvard-tests-with-geos-chem-aerosol-optical-properties.jpg)