
Poster Primary Support Off-Grid test bench at cigre colloquium lyon 2014
1
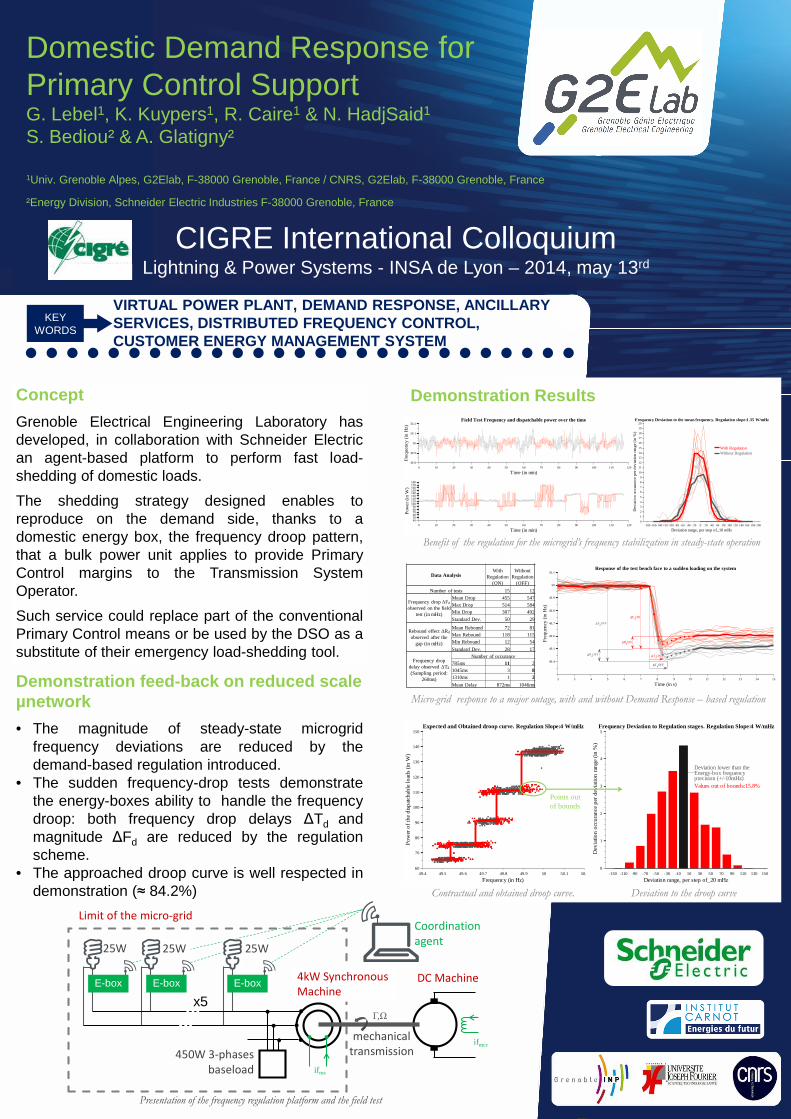
4kW Synchronous Machine Γ ,Ω if mcc DC Machine if ms Limit of the micro-grid 450W 3-phases baseload E-box E-box E-box x5 25W 25W 25W Coordination agent mechanical transmission 49.4 49.5 49.6 49.7 49.8 49.9 50 50.1 50.2 60 70 80 90 100 110 120 130 140 150 Expected and Obtained droop curve. Regulation Slope:4 W/mHz Frequency (in Hz) Power of the dispatchable loads (in W) -130 -110 -90 -70 -50 -30 -10 10 30 50 70 90 110 130 150 0 1 2 3 4 5 Frequency Deviation to Regulation stages. Regulation Slope:4 W/mHz Deviation range, per step of_20 mHz Deviation occurance per deviation range (in %) Values out of bounds:15.8% Deviation lower than the Energy-box frequency precision (+/-10mHz) Demonstration feed-back on reduced scale μnetwork • The magnitude of steady-state microgrid frequency deviations are reduced by the demand-based regulation introduced. • The sudden frequency-drop tests demonstrate the energy-boxes ability to handle the frequency droop: both frequency drop delays ∆T d and magnitude ∆F d are reduced by the regulation scheme. • The approached droop curve is well respected in demonstration (≈ 84.2%) Domestic Demand Response for Primary Control Support G. Lebel 1 , K. Kuypers 1 , R. Caire 1 & N. HadjSaid 1 S. Bediou² & A. Glatigny² 1 Univ. Grenoble Alpes, G2Elab, F-38000 Grenoble, France / CNRS, G2Elab, F-38000 Grenoble, France ²Energy Division, Schneider Electric Industries F-38000 Grenoble, France Presentation of the frequency regulation platform and the field test CIGRE International Colloquium Lightning & Power Systems - INSA de Lyon – 2014, may 13 rd Benefit of the regulation for the microgrid’s frequency stabilization in steady-state operation Concept Grenoble Electrical Engineering Laboratory has developed, in collaboration with Schneider Electric an agent-based platform to perform fast load- shedding of domestic loads. The shedding strategy designed enables to reproduce on the demand side, thanks to a domestic energy box, the frequency droop pattern, that a bulk power unit applies to provide Primary Control margins to the Transmission System Operator. Such service could replace part of the conventional Primary Control means or be used by the DSO as a substitute of their emergency load-shedding tool. Micro-grid response to a major outage, with and without Demand Response – based regulation Contractual and obtained droop curve. Deviation to the droop curve KEY WORDS VIRTUAL POWER PLANT, DEMAND RESPONSE, ANCILLARY SERVICES, DISTRIBUTED FREQUENCY CONTROL, CUSTOMER ENERGY MANAGEMENT SYSTEM 2 3 4 5 6 7 8 9 10 11 12 13 14 15 49.4 49.5 49.6 49.7 49.8 49.9 50 50.1 Response of the test bench face to a sudden loading on the system Time (in s) Frequency (in Hz) ∆T d ON ∆T d OFF ∆F d ON ∆R d ON ∆F d OFF ∆R d OFF Demonstration Results Data Analysis With Regulation (ON) Without Regulation (OFF) Number of tests 15 12 Frequency drop ∆Fd observed on the field test (in mHz) Mean Drop 455 547 Max Drop 514 584 Min Drop 307 492 Standard Dev. 50 29 Rebound effect ∆Rd observed after the gap (in mHz) Mean Rebound 72 81 Max Rebound 118 115 Min Rebound 12 54 Standard Dev. 28 17 Frequency drop delay observed ∆Td (Sampling period: 260ms) Number of occurance 785ms 11 2 1045ms 3 8 1310ms 1 2 Mean Delay 872ms 1046ms 10 20 30 40 50 60 70 80 90 49.8 49.9 50 50.1 50.2 Field Test Frequency and dispatchable power over the time Time (in min) Frequency (in Hz) 10 20 30 40 50 60 70 80 90 60 70 80 90 100 110 120 130 140 150 160 170 180 Time (in min) Power (in W) -180 -160 -140 -120 -100 -80 -60 -40 -20 0 20 40 60 80 100 120 140 160 180 200 0 1 2 3 4 5 6 7 8 9 10 11 12 13 14 15 16 17 18 19 20 Frequency Deviation to the mean frequency. Regulation slope:1.35 W/mHz Deviation range, per step of_10 mHz Deviation occurance per deviation range (in %) Without Regulation With Regulation 0 10 20 30 40 50 60 70 80 90 100 110 120 49.8 49.9 50 50.1 50.2 Field Test Frequency and dispatchable power over the time Time (in min) Frequency (in Hz) 0 10 20 30 40 50 60 70 80 90 100 110 120 40 50 60 70 80 90 100 110 120 130 140 150 160 170 180 Time (in min) Power (in W) Points out of bounds
-
Upload
gaspard-lebel -
Category
Engineering
-
view
166 -
download
2
Transcript of Poster Primary Support Off-Grid test bench at cigre colloquium lyon 2014
4kW Synchronous
Machine
Γ,Ω
ifmcc
DC Machine
ifms
Limit of the micro-grid
450W 3-phases
baseload
E-boxE-boxE-box
x5
25W 25W 25W
Coordination
agent
mechanical
transmission
49.4 49.5 49.6 49.7 49.8 49.9 50 50.1 50.260
70
80
90
100
110
120
130
140
150Expected and Obtained droop curve. Regulation Slope:4 W/mHz
Frequency (in Hz)
Pow
er o
f th
e di
spat
chab
le lo
ads
(in
W)
-130 -110 -90 -70 -50 -30 -10 10 30 50 70 90 110 130 1500
1
2
3
4
5Frequency Deviation to Regulation stages. Regulation Slope:4 W/mHz
Deviation range, per step of_20 mHz
Dev
iatio
n oc
cura
nce
per
devi
atio
n ra
nge
(in
%)
Values out of bounds:15.8%
Deviation lower than theEnergy-box frequencyprecision (+/-10mHz)
Demonstration feed-back on reduced scale µnetwork
• The magnitude of steady-state microgridfrequency deviations are reduced by thedemand-based regulation introduced.
• The sudden frequency-drop tests demonstratethe energy-boxes ability to handle the frequencydroop: both frequency drop delays ∆Td andmagnitude ∆Fd are reduced by the regulationscheme.
• The approached droop curve is well respected indemonstration (≈ 84.2%)
Domestic Demand Response for Primary Control SupportG. Lebel1, K. Kuypers1, R. Caire1 & N. HadjSaid1
S. Bediou² & A. Glatigny²
1Univ. Grenoble Alpes, G2Elab, F-38000 Grenoble, France / CNRS, G2Elab, F-38000 Grenoble, France
²Energy Division, Schneider Electric Industries F-38000 Grenoble, France
Presentation of the frequency regulation platform and the field test
CIGRE International Colloquium Lightning & Power Systems - INSA de Lyon – 2014, may 13rd
Benefit of the regulation for the microgrid’s frequency stabilization in steady-state operation
Concept
Grenoble Electrical Engineering Laboratory hasdeveloped, in collaboration with Schneider Electrican agent-based platform to perform fast load-shedding of domestic loads.
The shedding strategy designed enables toreproduce on the demand side, thanks to adomestic energy box, the frequency droop pattern,that a bulk power unit applies to provide PrimaryControl margins to the Transmission SystemOperator.
Such service could replace part of the conventionalPrimary Control means or be used by the DSO as asubstitute of their emergency load-shedding tool.
Micro-grid response to a major outage, with and without Demand Response – based regulation
Contractual and obtained droop curve. Deviation to the droop curve
KEY WORDS
VIRTUAL POWER PLANT, DEMAND RESPONSE, ANCILLARY SERVICES, DISTRIBUTED FREQUENCY CONTROL, CUSTOMER ENERGY MANAGEMENT SYSTEM
2 3 4 5 6 7 8 9 10 11 12 13 14 15
49.4
49.5
49.6
49.7
49.8
49.9
50
50.1Response of the test bench face to a sudden loading on the system
Time (in s)
Freq
uenc
y (i
n H
z)
∆TdON
∆TdOFF
∆FdON
∆RdON
∆FdOFF
∆RdOFF
Demonstration Results
Data AnalysisWith
Regulation (ON)
Without Regulation
(OFF)
Number of tests 15 12
Frequency drop ∆Fd
observed on the field test (in mHz)
Mean Drop 455 547Max Drop 514 584Min Drop 307 492
Standard Dev. 50 29
Rebound effect ∆Rd
observed after the gap (in mHz)
Mean Rebound 72 81Max Rebound 118 115Min Rebound 12 54
Standard Dev. 28 17
Frequency drop delay observed ∆Td
(Sampling period: 260ms)
Number of occurance785ms 11 21045ms 3 81310ms 1 2
Mean Delay 872ms 1046ms
10 20 30 40 50 60 70 80 90
49.8
49.9
50
50.1
50.2Field Test Frequency and dispatchable power over the time
Time (in min)
Freq
uenc
y (i
n H
z)
10 20 30 40 50 60 70 80 90
60708090
100110120130140150160170180
Time (in min)
Pow
er (
in W
)
-180-160-140-120-100 -80 -60 -40 -20 0 20 40 60 80 100 120 140 160 180 2000
1
2
3
4
5
6
7
8
9
10
11
12
13
14
15
16
17
18
19
20Frequency Deviation to the mean frequency. Regulation slope:1.35 W/mHz
Deviation range, per step of_10 mHz
Dev
iatio
n oc
cura
nce
per
devi
atio
n ra
nge
(in
%)
Without RegulationWith Regulation
0 10 20 30 40 50 60 70 80 90 100 110 120
49.8
49.9
50
50.1
50.2Field Test Frequency and dispatchable power over the time
Time (in min)
Freq
uenc
y (i
n H
z)
0 10 20 30 40 50 60 70 80 90 100 110 120
405060708090
100110120130140150160170180
Time (in min)
Pow
er (
in W
)
Points out of bounds


![TECHNICAL SPECS DR1 - alke.com · EH [ kg ] rear seat bench ― + 22.0 cab interior lighting • car audio system AM/FM with USB and Bluetooth Δ car audio system AM/FM/DAB/DAB+ with](https://static.fdocument.org/doc/165x107/5d66c2c188c99356368b4bf1/technical-specs-dr1-alkecom-eh-kg-rear-seat-bench-220-cab-interior.jpg)