Positivity assessment for intracellular cytokine staining ......ICS positivity Compare proportion of...
27
Positivity assessment for intracellular cytokine staining (ICS) Stephen De Rosa HVTN Laboratory Center Fred Hutchinson Cancer Research Center In collaboration with: Raphael Gottardo Greg Finak
Transcript of Positivity assessment for intracellular cytokine staining ......ICS positivity Compare proportion of...
Positivity assessment for intracellular cytokine staining (ICS)
Stephen De Rosa HVTN Laboratory Center
Fred Hutchinson Cancer Research Center
In collaboration with: Raphael Gottardo
Greg Finak
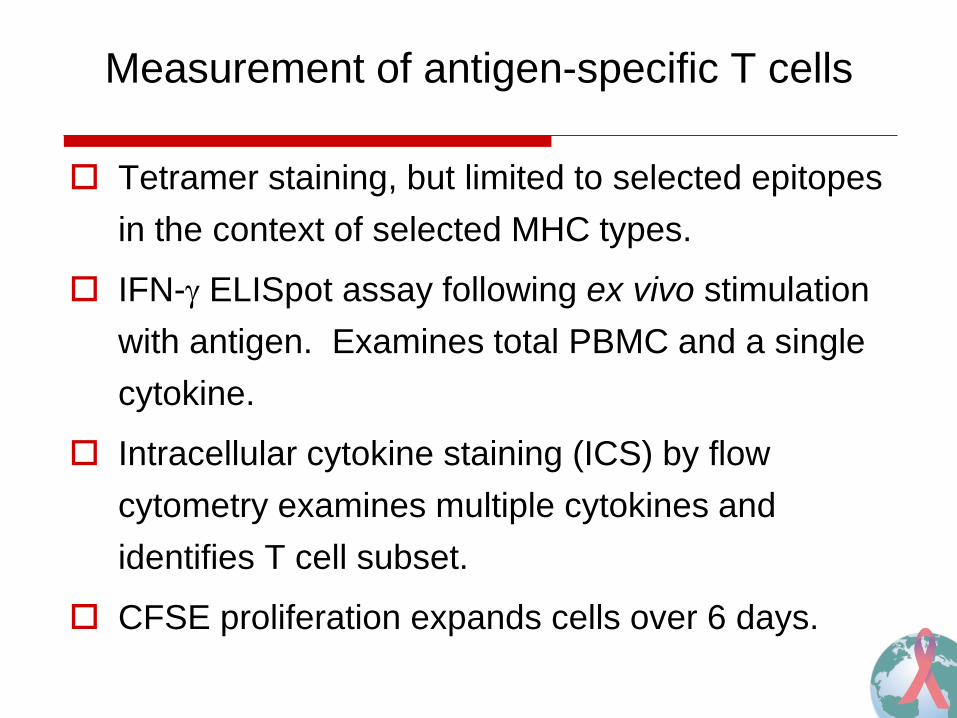
Measurement of antigen-specific T cells
Tetramer staining, but limited to selected epitopes in the context of selected MHC types.
IFN-γ ELISpot assay following ex vivo stimulation with antigen. Examines total PBMC and a single cytokine.
Intracellular cytokine staining (ICS) by flow cytometry examines multiple cytokines and identifies T cell subset.
CFSE proliferation expands cells over 6 days.
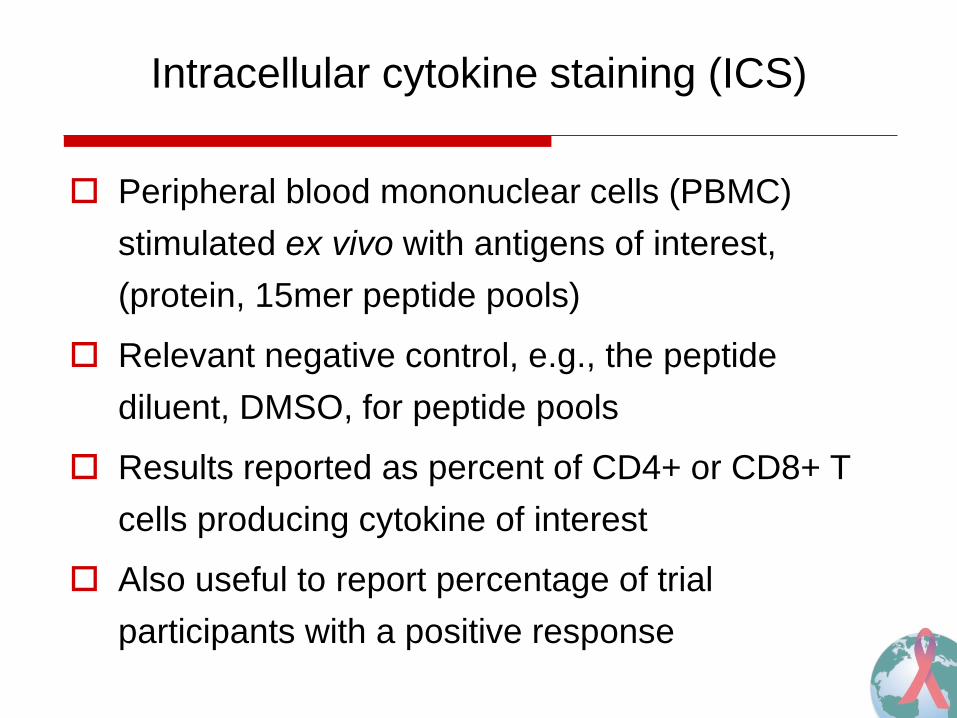
Intracellular cytokine staining (ICS)
Peripheral blood mononuclear cells (PBMC) stimulated ex vivo with antigens of interest, (protein, 15mer peptide pools)
Relevant negative control, e.g., the peptide diluent, DMSO, for peptide pools
Results reported as percent of CD4+ or CD8+ T cells producing cytokine of interest
Also useful to report percentage of trial participants with a positive response
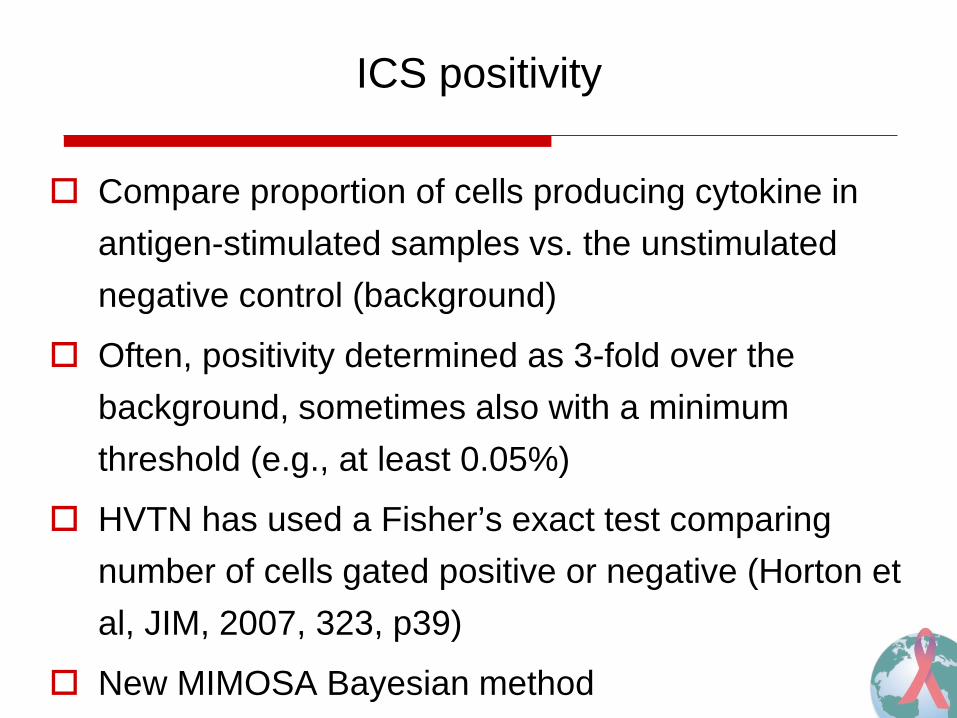
ICS positivity
Compare proportion of cells producing cytokine in antigen-stimulated samples vs. the unstimulated negative control (background)
Often, positivity determined as 3-fold over the background, sometimes also with a minimum threshold (e.g., at least 0.05%)
HVTN has used a Fisher’s exact test comparing number of cells gated positive or negative (Horton et al, JIM, 2007, 323, p39)
New MIMOSA Bayesian method
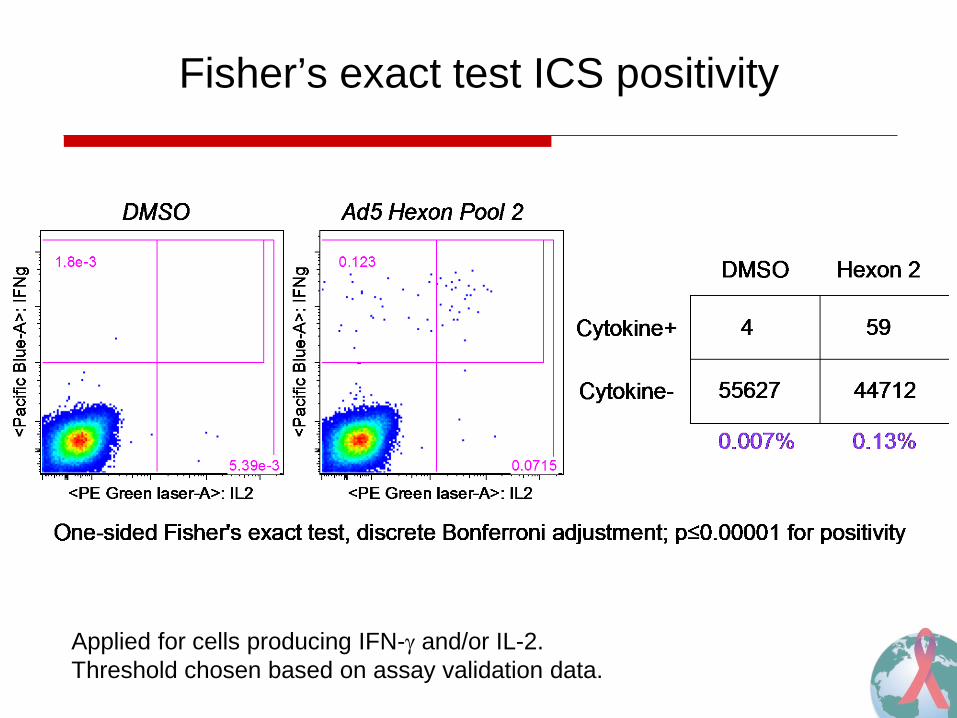
Fisher’s exact test ICS positivity
Applied for cells producing IFN-γ and/or IL-2. Threshold chosen based on assay validation data.
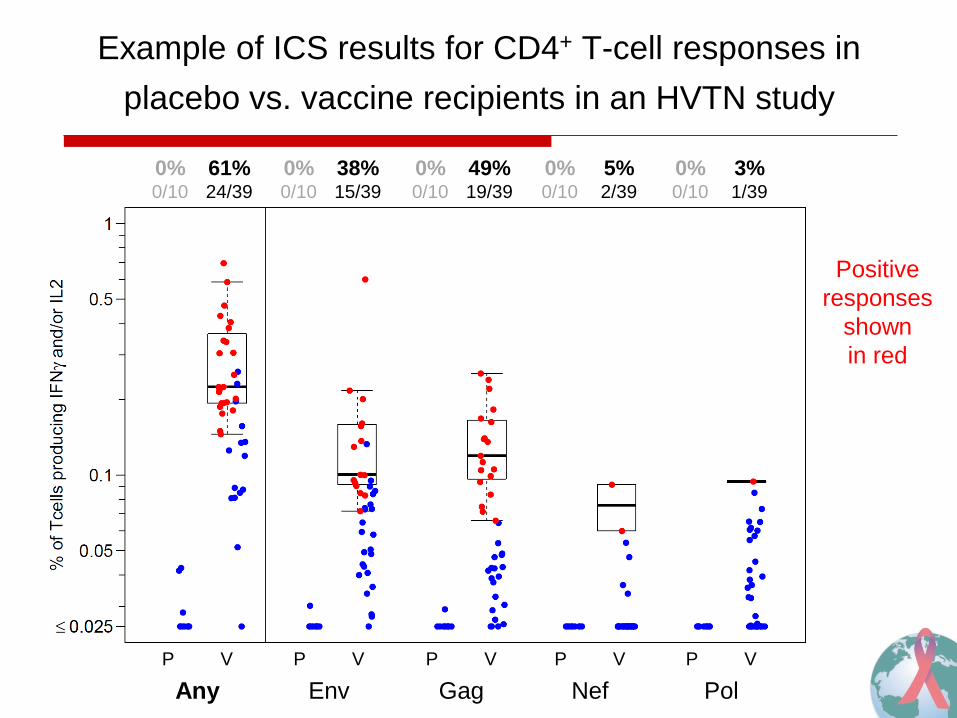
Example of ICS results for CD4+ T-cell responses in placebo vs. vaccine recipients in an HVTN study
0% 0/10
61% 24/39
0% 0/10
38% 15/39
0% 0/10
49% 19/39
0% 0/10
5% 2/39
0% 0/10
3% 1/39
Any Pol Nef Gag Env P V P V P V P V P V
Positive responses
shown in red
Mixture Models for Single-Cell Assays (MIMOSA)
Bayesian hierarchical mixture model framework where one component models the responders and the other models the non-responders
Parameters defining these distributions, as well as probabilities of response/non-response, are estimated from observed data
Thus, there is sharing of information across responders and non-responders
False-discovery rate multiplicity adjustment (0.01, 1%) Finak et al, Biostatistics, 2013, 15, p87
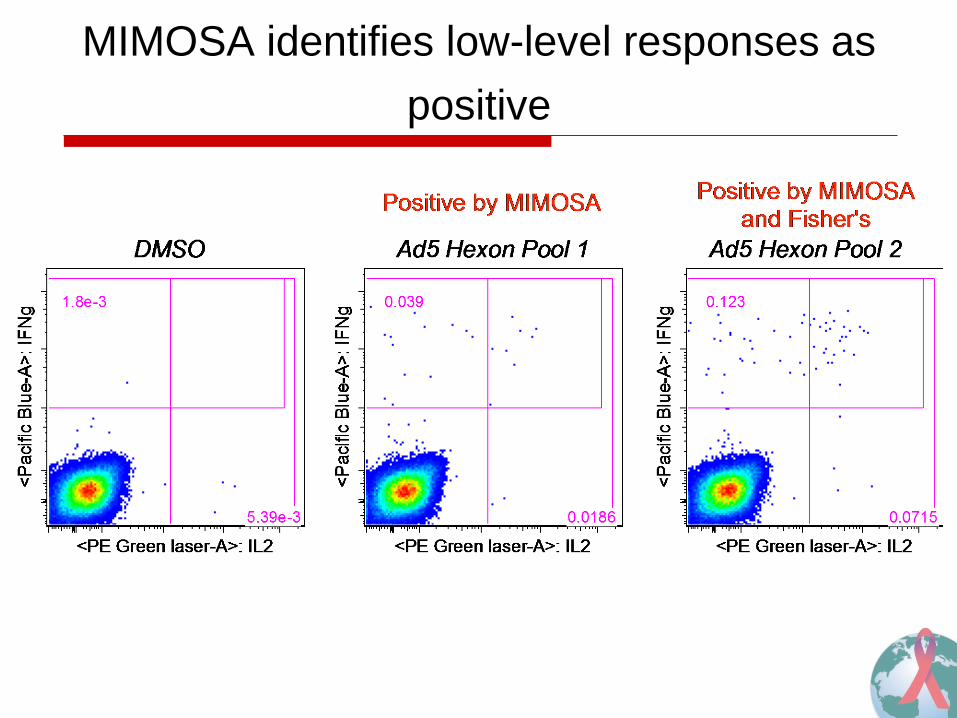
MIMOSA identifies low-level responses as positive
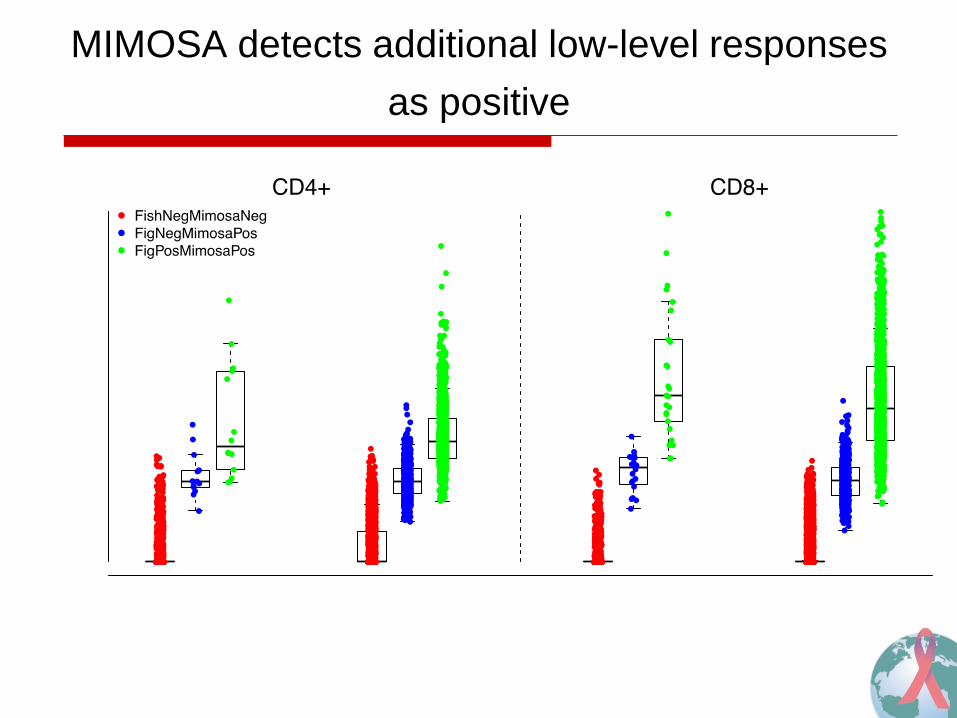
MIMOSA detects additional low-level responses as positive
Cross-protocol comparison
ICS has been used across multiple clinical trials
The ICS assay has been modified over time from 8 colors to 12 colors, but IFN-γ and IL-2 have been cross validated for each new assay
Phase I to II trials, varying numbers of participants
Primary immunogenicity time point generally 2 to 4 weeks post last vaccination
False-positivity assessed in placebo recipients
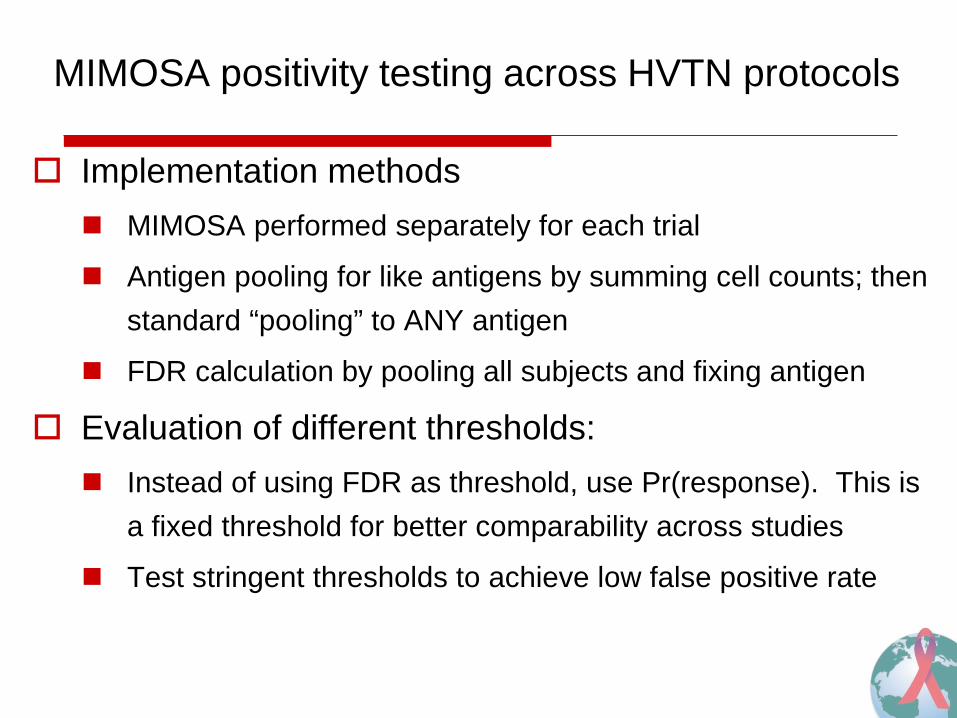
MIMOSA positivity testing across HVTN protocols
Implementation methods MIMOSA performed separately for each trial
Antigen pooling for like antigens by summing cell counts; then standard “pooling” to ANY antigen
FDR calculation by pooling all subjects and fixing antigen
Evaluation of different thresholds: Instead of using FDR as threshold, use Pr(response). This is
a fixed threshold for better comparability across studies
Test stringent thresholds to achieve low false positive rate
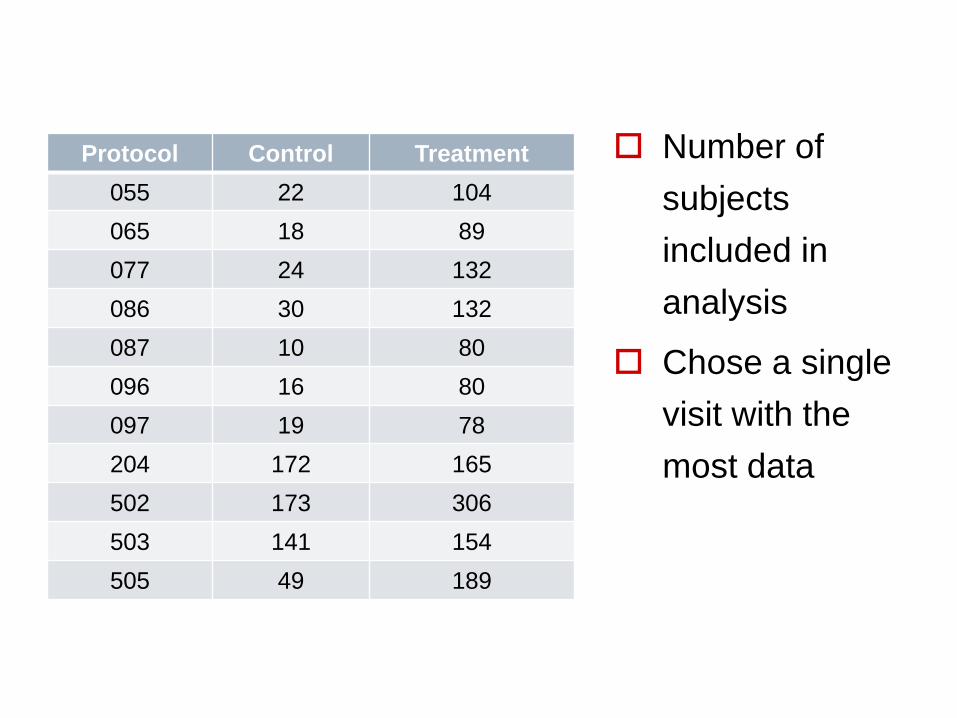
Protocol Control Treatment 055 22 104 065 18 89 077 24 132 086 30 132 087 10 80 096 16 80 097 19 78 204 172 165 502 173 306 503 141 154 505 49 189
Number of subjects included in analysis
Chose a single visit with the most data
Terminology
FPF = false positive frequency, positivity among placebo recipients
TPT = true positive frequency, positivity among vaccine recipients
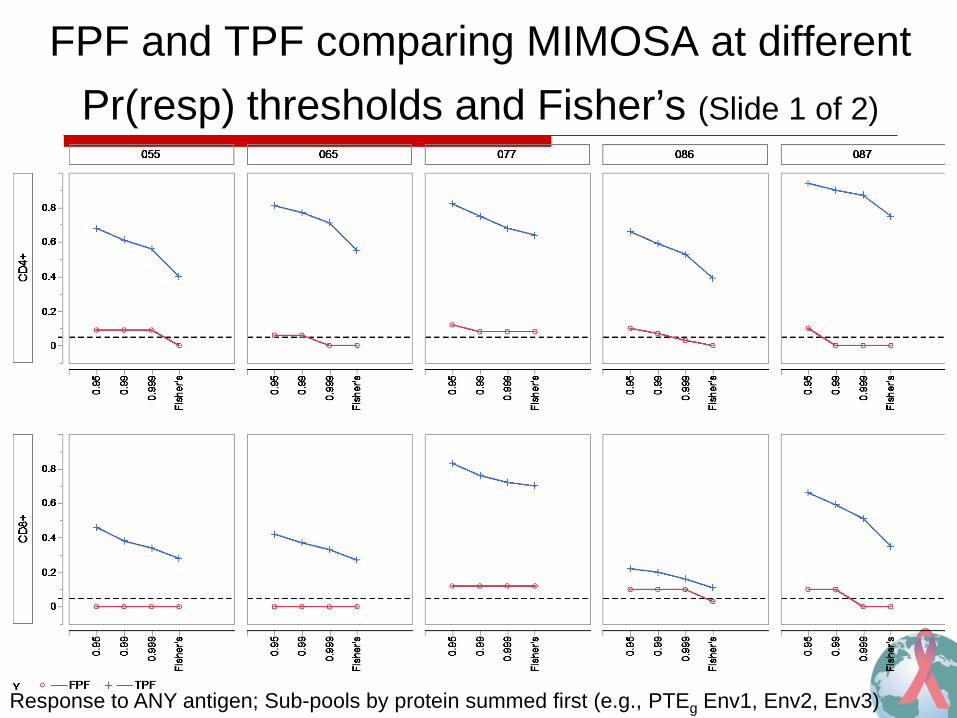
FPF and TPF comparing MIMOSA at different Pr(resp) thresholds and Fisher’s (Slide 1 of 2)
Response to ANY antigen; Sub-pools by protein summed first (e.g., PTEg Env1, Env2, Env3)
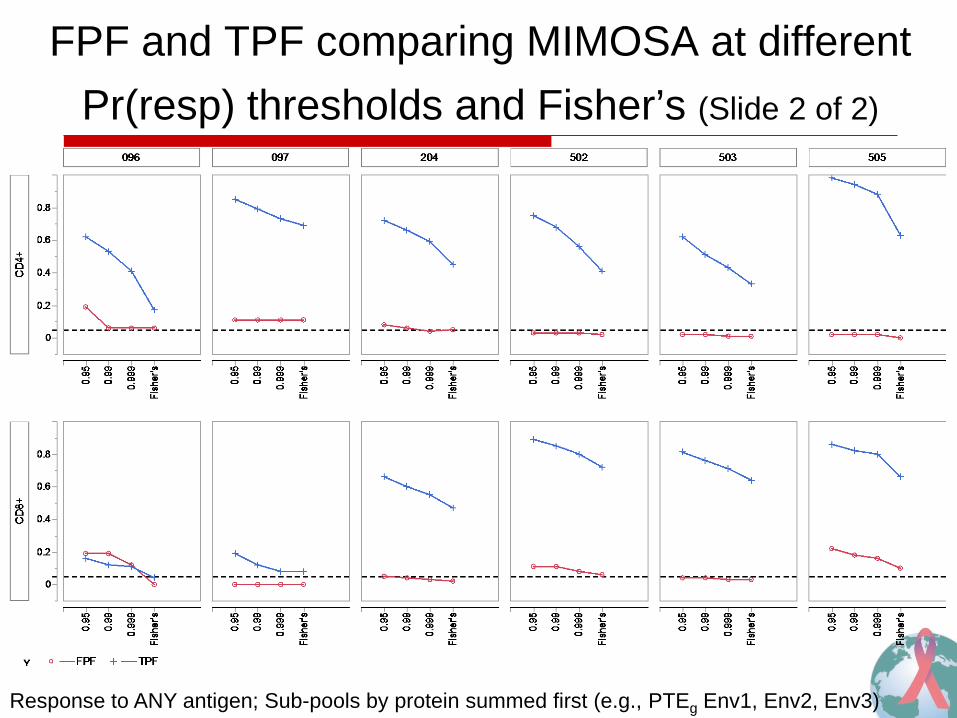
FPF and TPF comparing MIMOSA at different Pr(resp) thresholds and Fisher’s (Slide 2 of 2)
Response to ANY antigen; Sub-pools by protein summed first (e.g., PTEg Env1, Env2, Env3)
Conclusions
Compared with the Fisher’s method, MIMOSA at the most stringent threshold of 0.999 increases false positivity substantially only for 055 CD4, 086 CD8, and 096 CD8, yet increases sensitivity substantially (note especially 096 CD4, 505 CD4 and CD8).
Lowering threshold to 0.99 increases false positivity further for 065 CD4, 087 CD8, 096 CD8, 502 CD8. Although sensitivity improves further at 0.99 from 0.999, the largest increase in sensitivity is between Fisher’s and 0.999.
Threshold of 0.999 may be the optimal conservative choice to control false positivity.
COMPASS: Combinatorial Polyfunctionality Analysis of Single-cell Subsets
• Goals: • Characterize the complete Ag-specific T-cell profile using ICS
• Quantify response for each cell subset in each subject
• COMPASS extends MIMOSA in several ways: • Jointly models all combinatorial subsets using a multivariate model
(multinomial/Dirichlet)
• Identifies Ag-specific responses in specific cell-subsets in each subject (via a variable selection prior)
• Output: a probability of Ag-specific response for each cell subset/subject
Lin et al. Combinatorial Polyfunctionality Analysis of Antigen-Specific T-cell Subsets Identifies Novel Cellular Subsets Correlated with Clinical Outcomes (Submitted and under review)
COMPASS analysis of RV144
• 262 subjects
- 226 vaccinees (38 infected, 188 non-infected), 36 placebos
- 2 stimulation conditions per subject (stimulated with ENV, unstimulated)
• CD4+ T-cells
- 6 functional markers: CD154, IL2, IFNγ, TNFα, IL17, IL4
- 26=64 possible combinations / cell subsets
- Many empty combinations → 15 considered
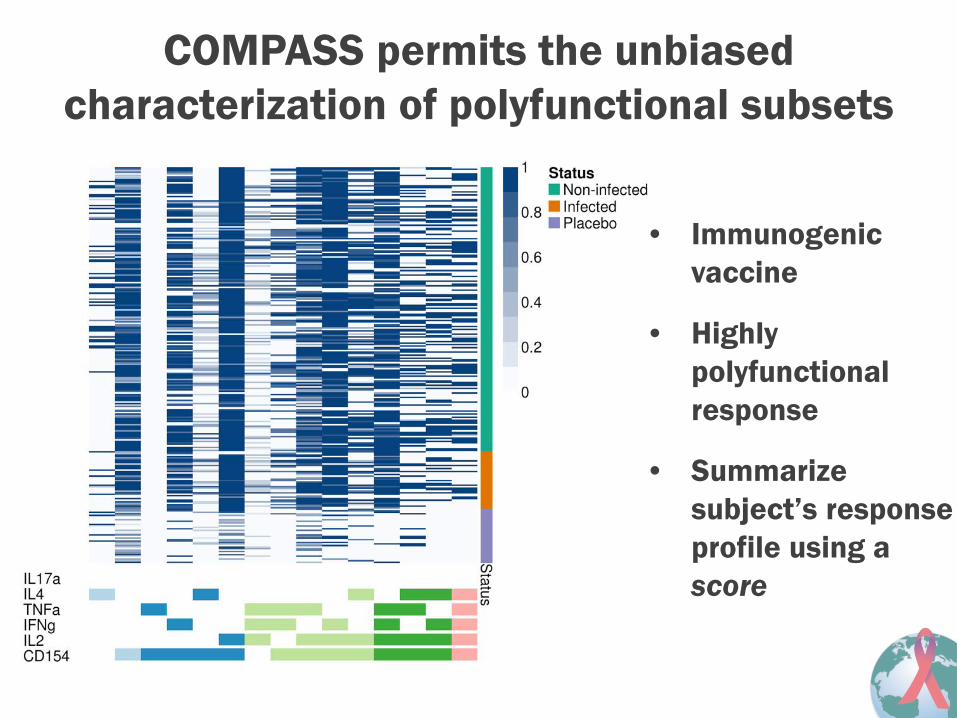
COMPASS permits the unbiased characterization of polyfunctional subsets
• Immunogenic vaccine
• Highly polyfunctional response
• Summarize subject’s response profile using a score

Two new scores
• Summarize an individual’s entire Ag-specific polyfunctional profile into a single numerical value
• Functionality score: proportion of Ag-specific subsets detected among all possible ones
• Polyfunctionality score: similar, but weighs the different subsets by their degree of functionality, favoring subsets with higher degrees of functionality
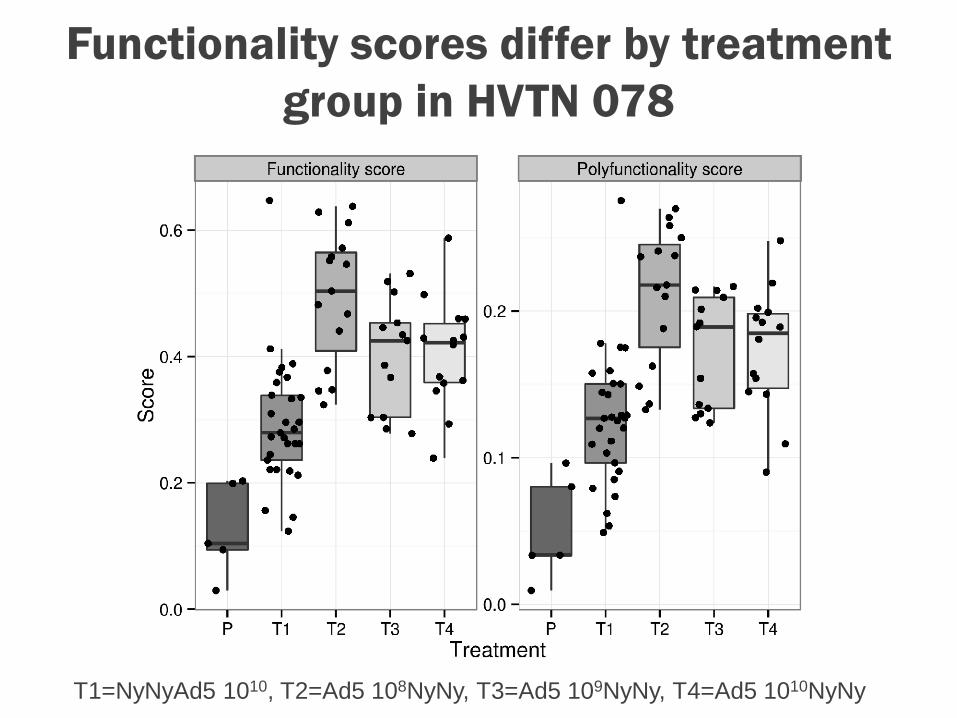
Functionality scores differ by treatment group in HVTN 078
T1=NyNyAd5 1010, T2=Ad5 108NyNy, T3=Ad5 109NyNy, T4=Ad5 1010NyNy
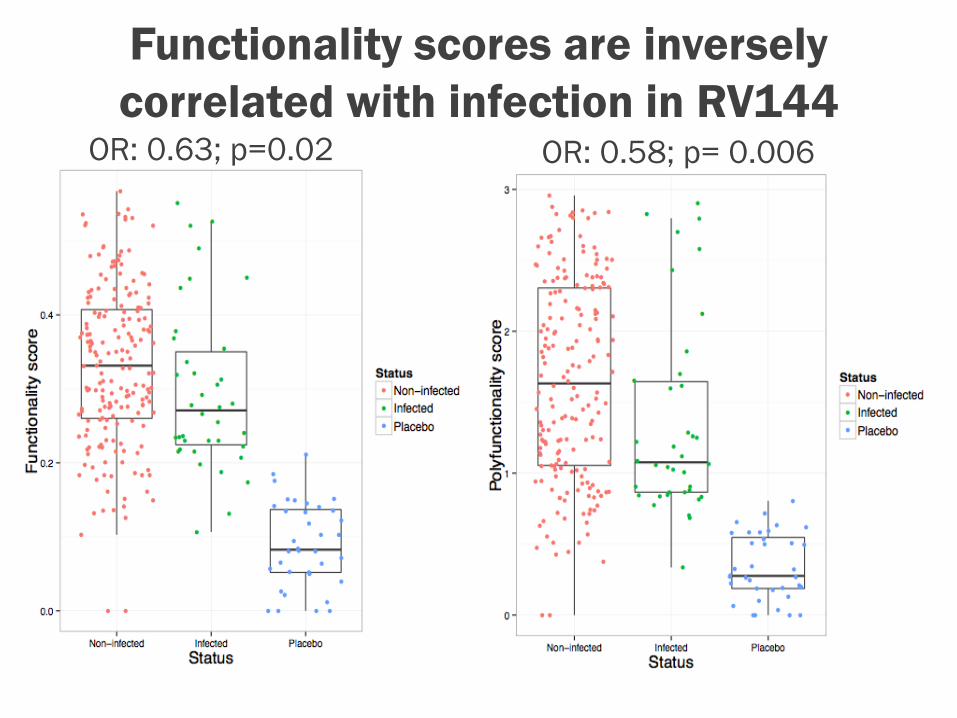
Functionality scores are inversely correlated with infection in RV144
OR: 0.58; p= 0.006 OR: 0.63; p=0.02
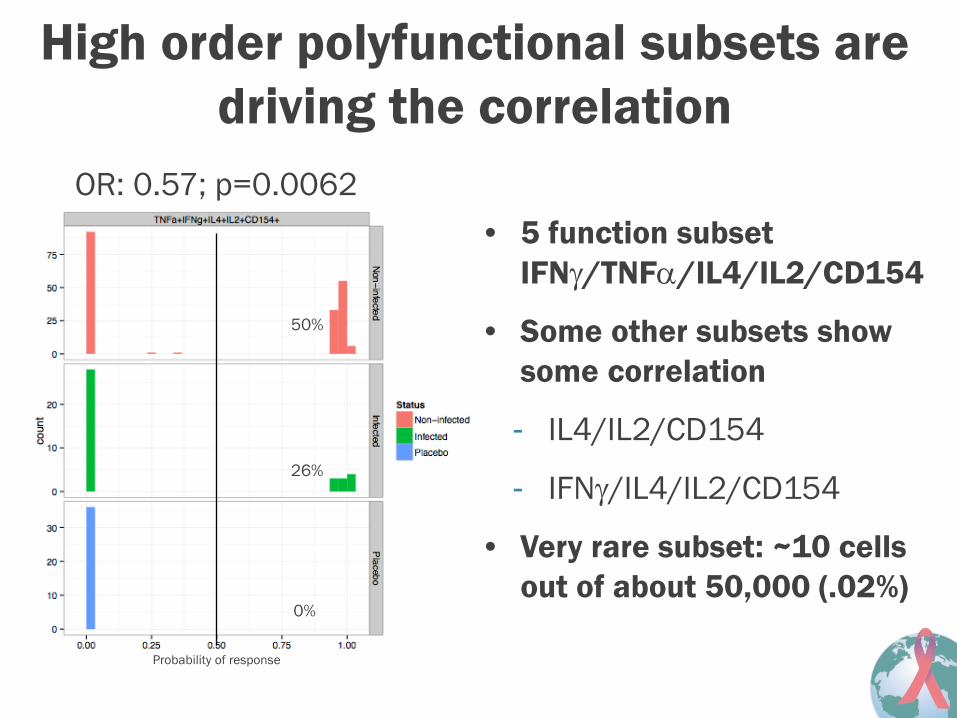
High order polyfunctional subsets are driving the correlation
Probability of response
50%
26%
0%
• 5 function subset IFNγ/TNFα/IL4/IL2/CD154
• Some other subsets show some correlation
- IL4/IL2/CD154
- IFNγ/IL4/IL2/CD154
• Very rare subset: ~10 cells out of about 50,000 (.02%)
OR: 0.57; p=0.0062
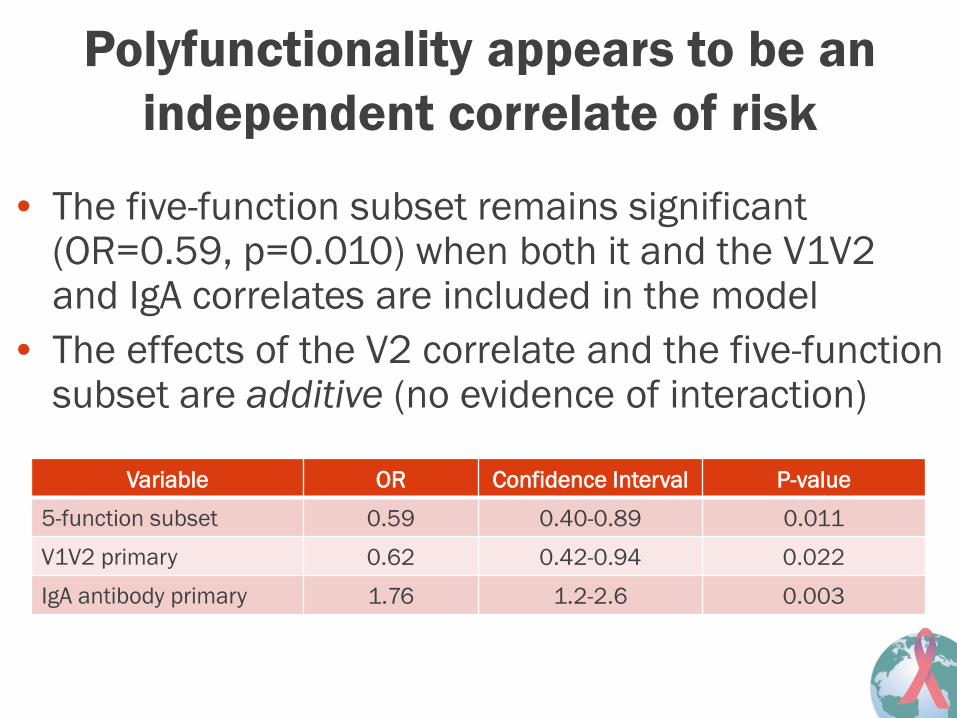
Polyfunctionality appears to be an independent correlate of risk
• The five-function subset remains significant (OR=0.59, p=0.010) when both it and the V1V2 and IgA correlates are included in the model
• The effects of the V2 correlate and the five-function subset are additive (no evidence of interaction)
Variable OR Confidence Interval P-value
5-function subset 0.59 0.40-0.89 0.011
V1V2 primary 0.62 0.42-0.94 0.022
IgA antibody primary 1.76 1.2-2.6 0.003
Why was this subset not detected in the primary analysis?
• IL4 was excluded • Subset is rare – magnitude is very small
• Signal drowned out by looking at cells expressing ANY cytokine
• We model the cohort as a whole rather than each subject independently • e.g., borrow strength • Small but consistent vaccine induced response
Summary
• What is a possible interpretation? • Ab is likely the primary correlate of protection – B-cell
driven • B-cells require T-cell help – expect T cells producing IL4,
IFNγ • Polyfunctionality is believed to be a good feature for CD4+
and CD8+ T cells, supported by other studies • Surprising that the polyfunctional correlate has Th1 and
Th2 like qualities (IL4 and IFNγ simultaneously) • Important to be unbiased
• We will be looking at the polyfunctionality score for evaluating future vaccine candidates
Acknowledgments • Gottardo Group: Raphael
Gottardo, Greg Finak, Lynn Lin, Mike Jiang, Andrew McDavid, Kevin Ushey
• HVTN Lab Program: Julie McElrath, Nicole Frahm
• SCHARP: Daryl Morris, Hasan Ahmed, Julie Stofel
• RV144 Immune correlate study team leadership: Peter Gilbert, Julie McElrath, Barton Haynes, Charla Andrews, Nelson Michael, Jerome Kim
• HVTN Protocol Teams
• Funding:
• NIAID - HVTN
• Bill and Melinda Gates Foundation – CAVD
• UW/FHCRC CFAR
• Human Immunology Project Consortium, NIH/NIBIB R01EB008400
Study Volunteers!