Portfolio Analytics Presentation
13
PORTFOLIO ANALYTICS
Transcript of Portfolio Analytics Presentation
PORTFOLIO ANALYTICS
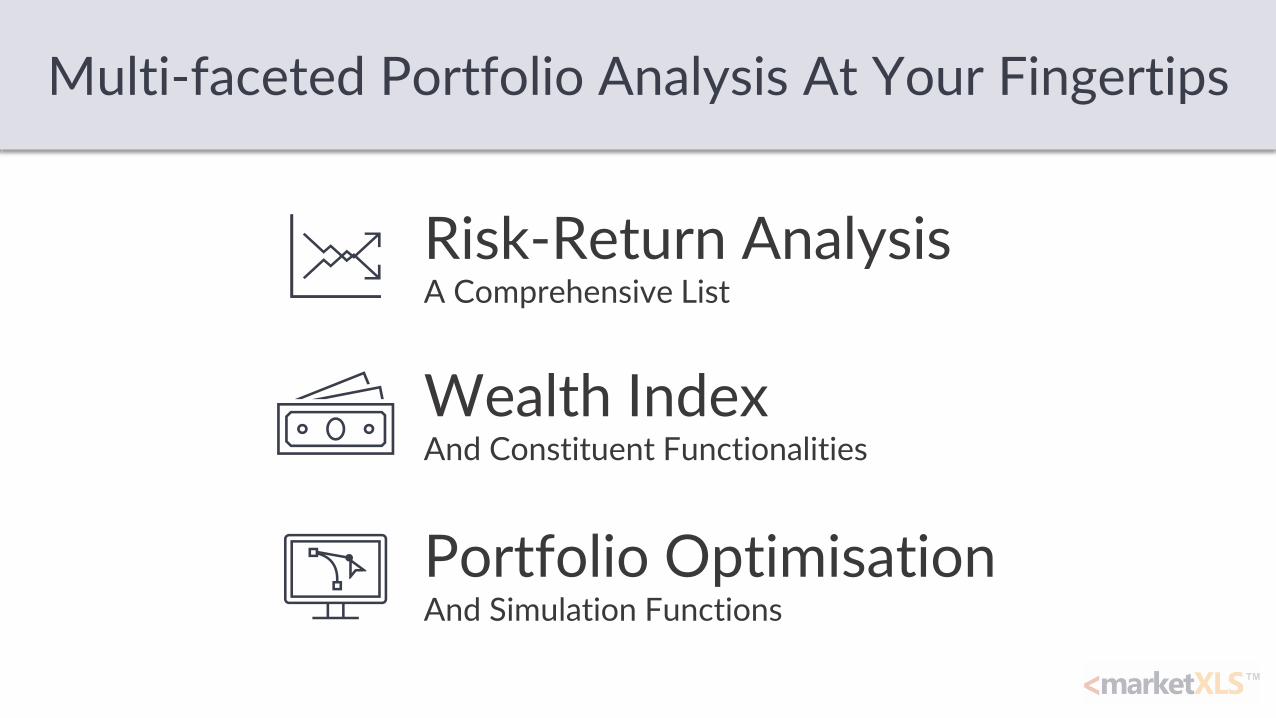
Multi-faceted Portfolio Analysis At Your Fingertips
Wealth Index And Constituent Functionalities
Risk-Return Analysis A Comprehensive List
Portfolio Optimisation And Simulation Functions
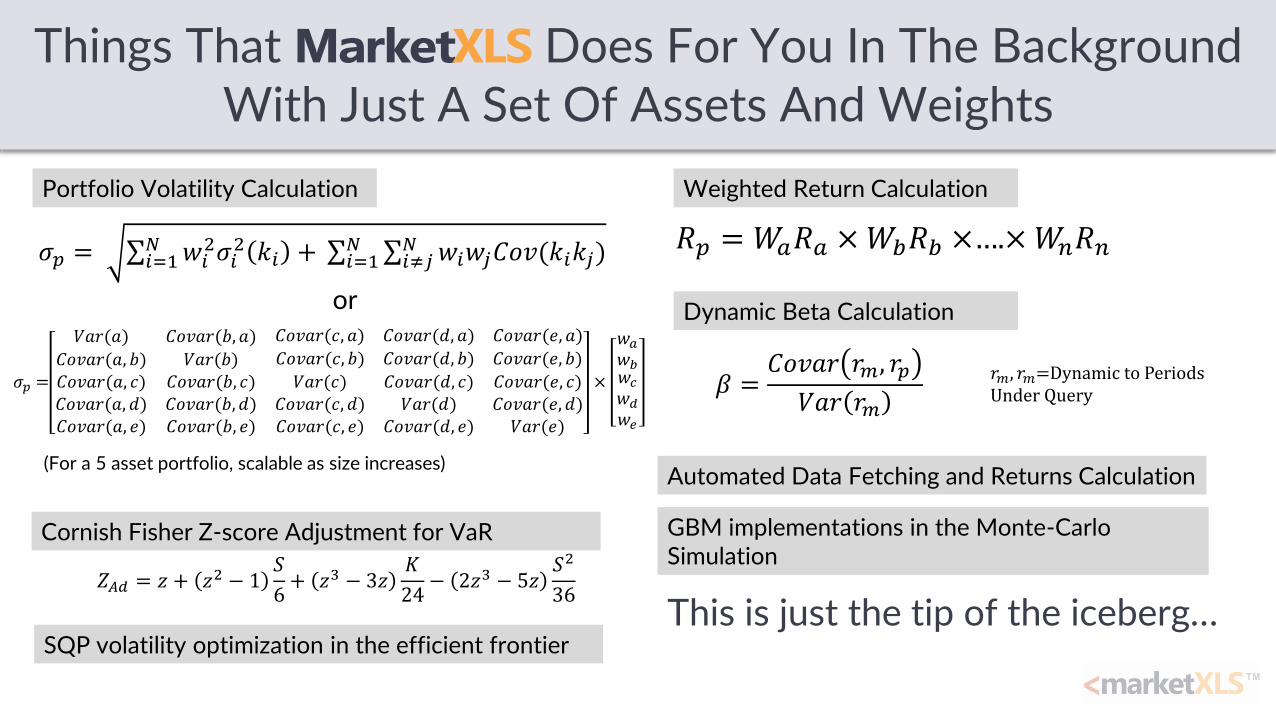
Things That MarketXLS Does For You In The Background With Just A Set Of Assets And Weights
𝜎𝑝 = σ𝑖=1𝑁 𝑤𝑖
2𝜎𝑖2 𝑘𝑖 + σ𝑖=1
𝑁 σ𝑖≠𝑗𝑁 𝑤𝑖𝑤𝑗𝐶𝑜𝑣(𝑘𝑖𝑘𝑗)
or
𝜎𝑝 =
𝑉𝑎𝑟(𝑎) 𝐶𝑜𝑣𝑎𝑟(𝑏, 𝑎) 𝐶𝑜𝑣𝑎𝑟(𝑐, 𝑎) 𝐶𝑜𝑣𝑎𝑟(𝑑, 𝑎) 𝐶𝑜𝑣𝑎𝑟(𝑒, 𝑎)
𝐶𝑜𝑣𝑎𝑟(𝑎, 𝑏) 𝑉𝑎𝑟(𝑏) 𝐶𝑜𝑣𝑎𝑟(𝑐, 𝑏) 𝐶𝑜𝑣𝑎𝑟(𝑑, 𝑏) 𝐶𝑜𝑣𝑎𝑟(𝑒, 𝑏)
𝐶𝑜𝑣𝑎𝑟(𝑎, 𝑐)𝐶𝑜𝑣𝑎𝑟(𝑎, 𝑑)𝐶𝑜𝑣𝑎𝑟(𝑎, 𝑒)
𝐶𝑜𝑣𝑎𝑟(𝑏, 𝑐)𝐶𝑜𝑣𝑎𝑟(𝑏, 𝑑)𝐶𝑜𝑣𝑎𝑟(𝑏, 𝑒)
𝑉𝑎𝑟(𝑐)𝐶𝑜𝑣𝑎𝑟(𝑐, 𝑑)𝐶𝑜𝑣𝑎𝑟(𝑐, 𝑒)
𝐶𝑜𝑣𝑎𝑟(𝑑, 𝑐)𝑉𝑎𝑟(𝑑)
𝐶𝑜𝑣𝑎𝑟(𝑑, 𝑒)
𝐶𝑜𝑣𝑎𝑟(𝑒, 𝑐)𝐶𝑜𝑣𝑎𝑟(𝑒, 𝑑)𝑉𝑎𝑟(𝑒)
×
𝑤𝑎
𝑤𝑏𝑤𝑐
𝑤𝑑
𝑤𝑒
SQP volatility optimization in the efficient frontier
Portfolio Volatility Calculation
𝑅𝑝 = 𝑊𝑎𝑅𝑎 ×𝑊𝑏𝑅𝑏 ×….×𝑊𝑛𝑅𝑛
Weighted Return Calculation
Automated Data Fetching and Returns Calculation
𝑍𝐴𝑑 = 𝑧 + 𝑧2 − 1𝑆
6+ 𝑧3 − 3𝑧
𝐾
24− 2𝑧3 − 5𝑧
𝑆2
36
Cornish Fisher Z-score Adjustment for VaR
𝛽 =𝐶𝑜𝑣𝑎𝑟 𝑟𝑚, 𝑟𝑝
𝑉𝑎𝑟 𝑟𝑚
Dynamic Beta Calculation
GBM implementations in the Monte-Carlo Simulation
This is just the tip of the iceberg…
(For a 5 asset portfolio, scalable as size increases)
𝑟𝑚, 𝑟𝑚=Dynamic to Periods Under Query
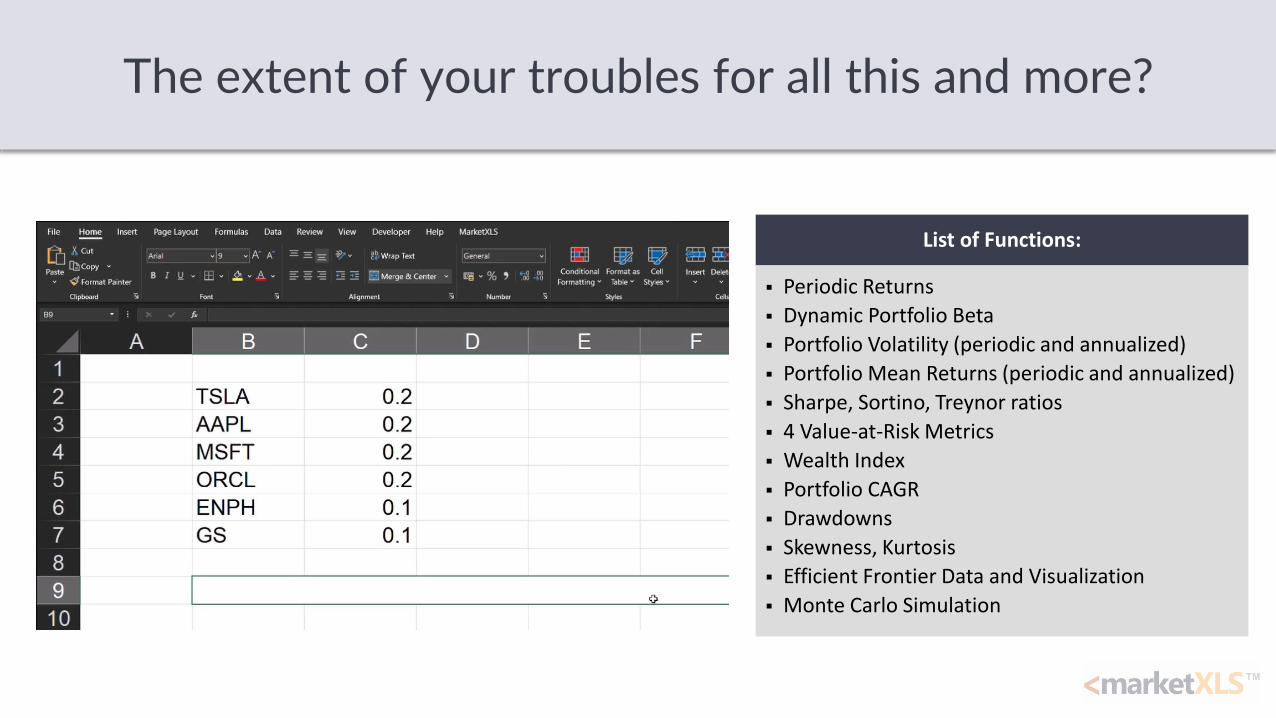
The extent of your troubles for all this and more?
List of Functions:
▪ Periodic Returns
▪ Dynamic Portfolio Beta
▪ Portfolio Volatility (periodic and annualized)
▪ Portfolio Mean Returns (periodic and annualized)
▪ Sharpe, Sortino, Treynor ratios
▪ 4 Value-at-Risk Metrics
▪ Wealth Index
▪ Portfolio CAGR
▪ Drawdowns
▪ Skewness, Kurtosis
▪ Efficient Frontier Data and Visualization
▪ Monte Carlo Simulation
Risk-Return Analysis
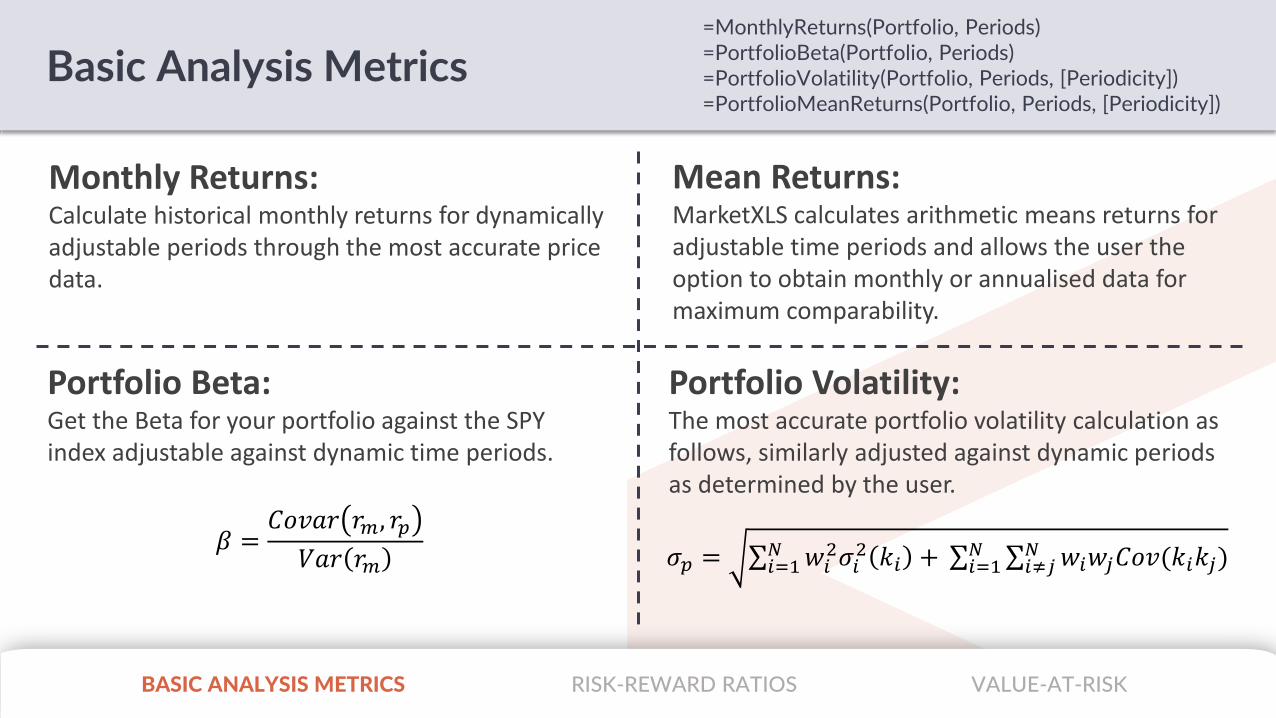
Basic Analysis Metrics
BASIC ANALYSIS METRICS VALUE-AT-RISK
=MonthlyReturns(Portfolio, Periods)=PortfolioBeta(Portfolio, Periods)=PortfolioVolatility(Portfolio, Periods, [Periodicity])=PortfolioMeanReturns(Portfolio, Periods, [Periodicity])
Monthly Returns:Calculate historical monthly returns for dynamically adjustable periods through the most accurate price data.
Mean Returns:MarketXLS calculates arithmetic means returns for adjustable time periods and allows the user the option to obtain monthly or annualised data for maximum comparability.
Portfolio Beta:Get the Beta for your portfolio against the SPY index adjustable against dynamic time periods.
𝛽 =𝐶𝑜𝑣𝑎𝑟 𝑟𝑚, 𝑟𝑝
𝑉𝑎𝑟 𝑟𝑚
Portfolio Volatility:The most accurate portfolio volatility calculation as follows, similarly adjusted against dynamic periods as determined by the user.
𝜎𝑝 = σ𝑖=1𝑁 𝑤𝑖
2𝜎𝑖2 𝑘𝑖 + σ𝑖=1
𝑁 σ𝑖≠𝑗𝑁 𝑤𝑖𝑤𝑗𝐶𝑜𝑣(𝑘𝑖𝑘𝑗)
RISK-REWARD RATIOS
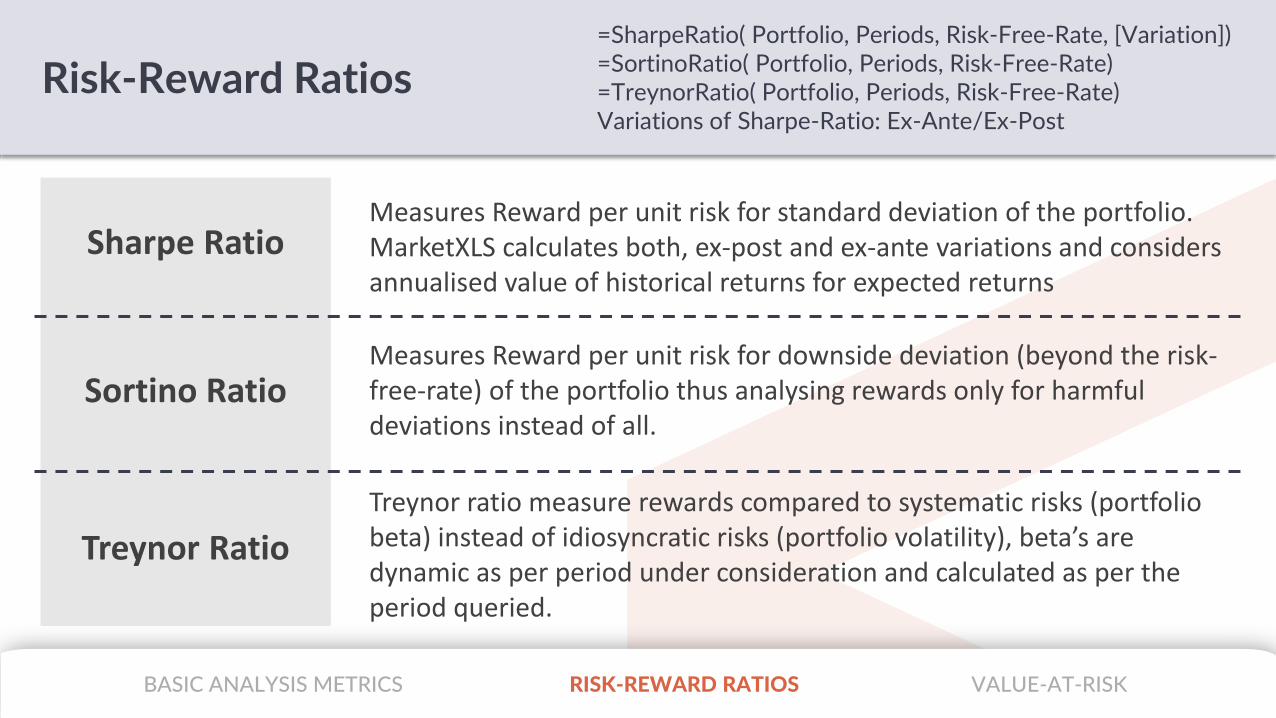
Risk-Reward Ratios=SharpeRatio( Portfolio, Periods, Risk-Free-Rate, [Variation])=SortinoRatio( Portfolio, Periods, Risk-Free-Rate)=TreynorRatio( Portfolio, Periods, Risk-Free-Rate)Variations of Sharpe-Ratio: Ex-Ante/Ex-Post
Sharpe RatioMeasures Reward per unit risk for standard deviation of the portfolio. MarketXLS calculates both, ex-post and ex-ante variations and considers annualised value of historical returns for expected returns
Sortino Ratio
Treynor Ratio
Measures Reward per unit risk for downside deviation (beyond the risk-free-rate) of the portfolio thus analysing rewards only for harmful deviations instead of all.
Treynor ratio measure rewards compared to systematic risks (portfolio beta) instead of idiosyncratic risks (portfolio volatility), beta’s are dynamic as per period under consideration and calculated as per the period queried.
BASIC ANALYSIS METRICS VALUE-AT-RISKRISK-REWARD RATIOS
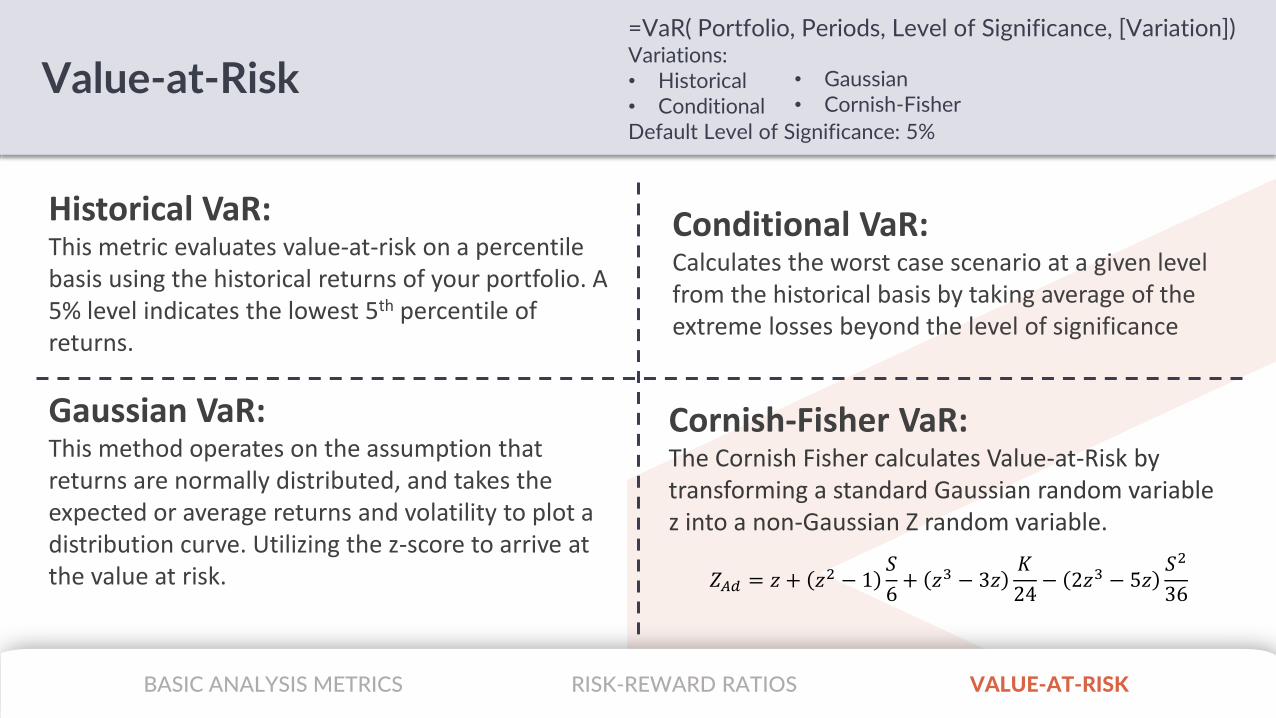
Value-at-Risk
=VaR( Portfolio, Periods, Level of Significance, [Variation])Variations:• Historical• ConditionalDefault Level of Significance: 5%
Historical VaR:This metric evaluates value-at-risk on a percentile basis using the historical returns of your portfolio. A 5% level indicates the lowest 5th percentile of returns.
Conditional VaR:Calculates the worst case scenario at a given level from the historical basis by taking average of the extreme losses beyond the level of significance
Gaussian VaR:This method operates on the assumption that returns are normally distributed, and takes the expected or average returns and volatility to plot a distribution curve. Utilizing the z-score to arrive at the value at risk.
Cornish-Fisher VaR:The Cornish Fisher calculates Value-at-Risk by transforming a standard Gaussian random variable z into a non-Gaussian Z random variable.
• Gaussian• Cornish-Fisher
𝑍𝐴𝑑 = 𝑧 + 𝑧2 − 1𝑆
6+ 𝑧3 − 3𝑧
𝐾
24− 2𝑧3 − 5𝑧
𝑆2
36
BASIC ANALYSIS METRICS VALUE-AT-RISKRISK-REWARD RATIOS
WealthIndices
(And Related Functionalities)
Wealth Indices And Related Functionalities
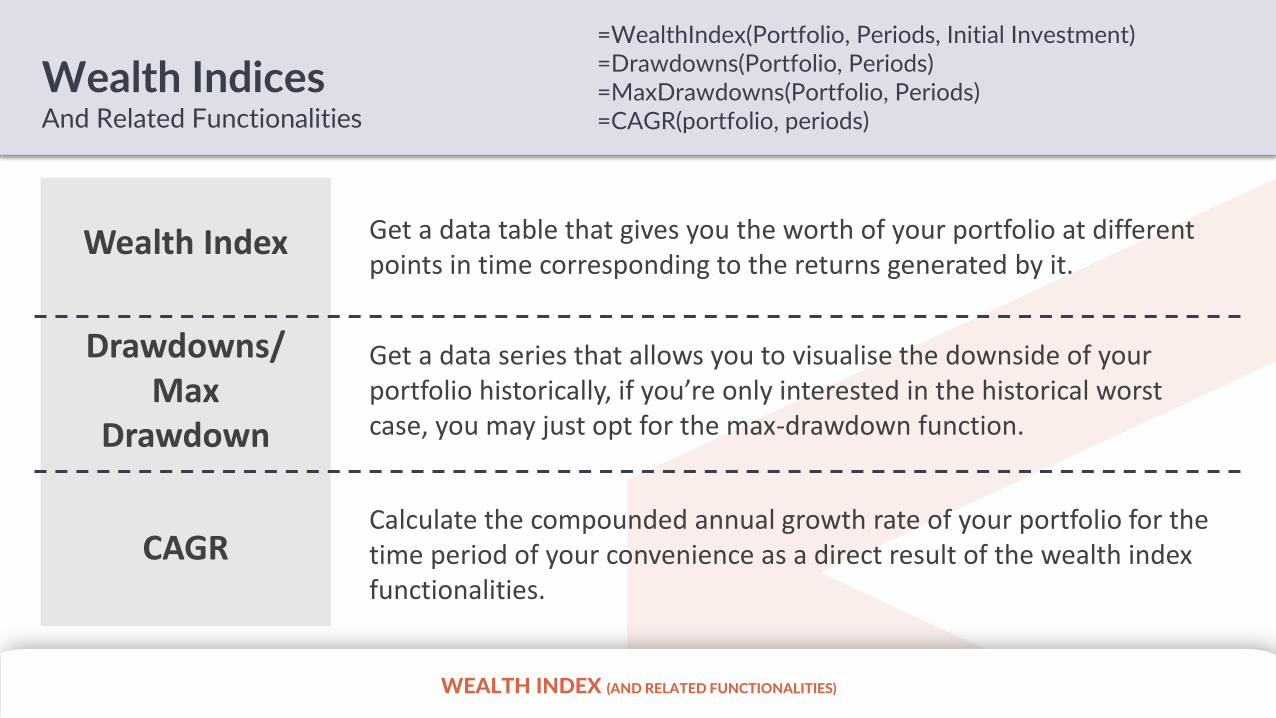
=WealthIndex(Portfolio, Periods, Initial Investment)=Drawdowns(Portfolio, Periods)=MaxDrawdowns(Portfolio, Periods)=CAGR(portfolio, periods)
Wealth Index Get a data table that gives you the worth of your portfolio at different points in time corresponding to the returns generated by it.
Drawdowns/Max
Drawdown
CAGR
Get a data series that allows you to visualise the downside of your portfolio historically, if you’re only interested in the historical worst case, you may just opt for the max-drawdown function.
Calculate the compounded annual growth rate of your portfolio for the time period of your convenience as a direct result of the wealth index functionalities.
WEALTH INDEX (AND RELATED FUNCTIONALITIES)
Optimisation &
Simulation
Efficient Portfolio Frontier
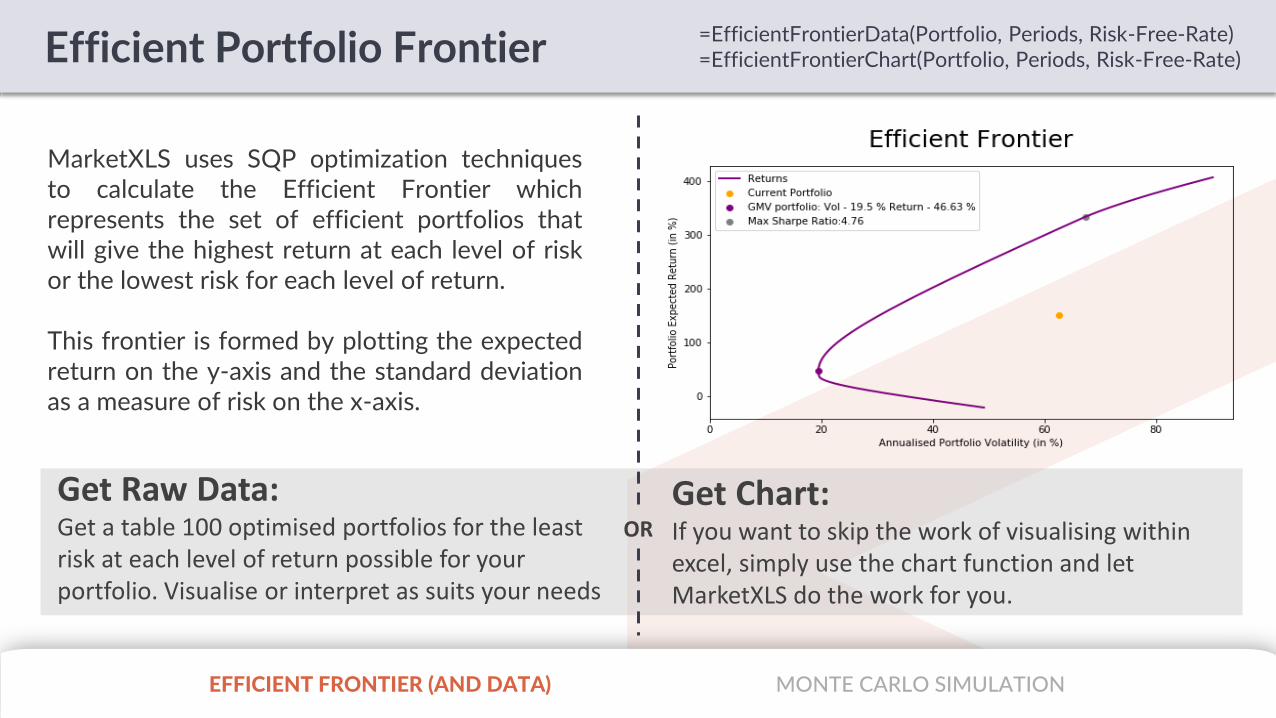
MarketXLS uses SQP optimization techniquesto calculate the Efficient Frontier whichrepresents the set of efficient portfolios thatwill give the highest return at each level of riskor the lowest risk for each level of return.
This frontier is formed by plotting the expectedreturn on the y-axis and the standard deviationas a measure of risk on the x-axis.
EFFICIENT FRONTIER (AND DATA) MONTE CARLO SIMULATION
=EfficientFrontierData(Portfolio, Periods, Risk-Free-Rate)=EfficientFrontierChart(Portfolio, Periods, Risk-Free-Rate)
Get Raw Data:Get a table 100 optimised portfolios for the least risk at each level of return possible for your portfolio. Visualise or interpret as suits your needs
Get Chart:If you want to skip the work of visualising within excel, simply use the chart function and let MarketXLS do the work for you.
OR
EFFICIENT FRONTIER (AND DATA) MONTE CARLO SIMULATION
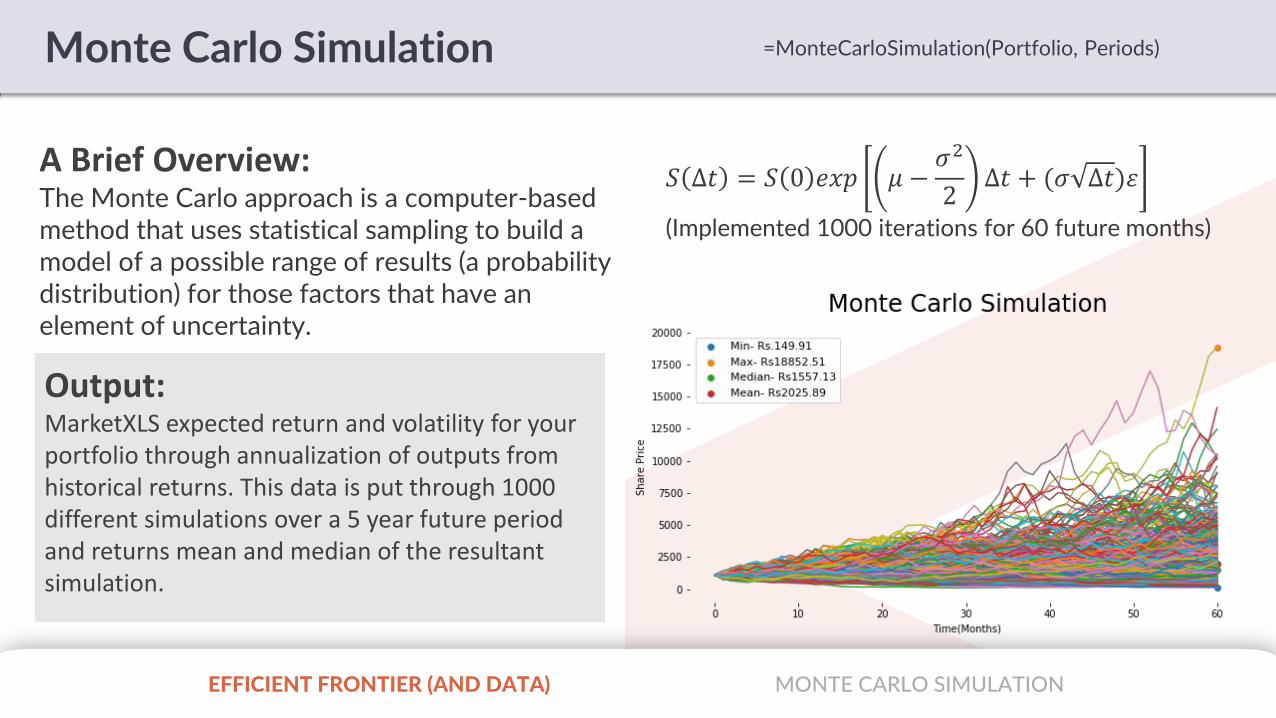
Monte Carlo Simulation =MonteCarloSimulation(Portfolio, Periods)
A Brief Overview:The Monte Carlo approach is a computer-based method that uses statistical sampling to build a model of a possible range of results (a probability distribution) for those factors that have an element of uncertainty.
𝑆 ∆𝑡 = 𝑆 0 𝑒𝑥𝑝 𝜇 −𝜎2
2∆𝑡 + (𝜎 ∆𝑡)𝜀
(Implemented 1000 iterations for 60 future months)
Output:MarketXLS expected return and volatility for your portfolio through annualization of outputs from historical returns. This data is put through 1000 different simulations over a 5 year future period and returns mean and median of the resultant simulation.