Poisson’s ratio (μ) = -transverse strain/axial strain · • Poisson’s ratio ... Signals...
27
-
Upload
nguyenmien -
Category
Documents
-
view
227 -
download
7
Transcript of Poisson’s ratio (μ) = -transverse strain/axial strain · • Poisson’s ratio ... Signals...

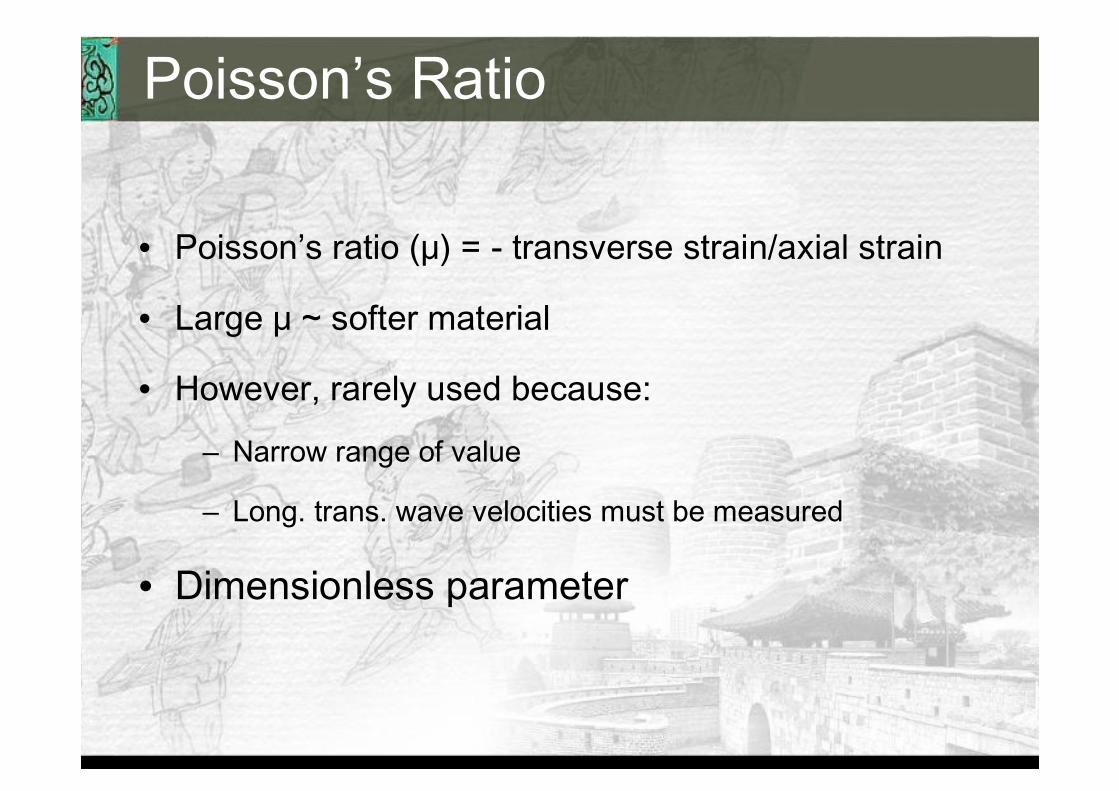
• Poisson’s ratio (μ) = - transverse strain/axial strain
• Large μ ~ softer material
• However, rarely used because:
– Narrow range of value
– Long. trans. wave velocities must be measured
• Dimensionless parameter
Poisson’s Ratio
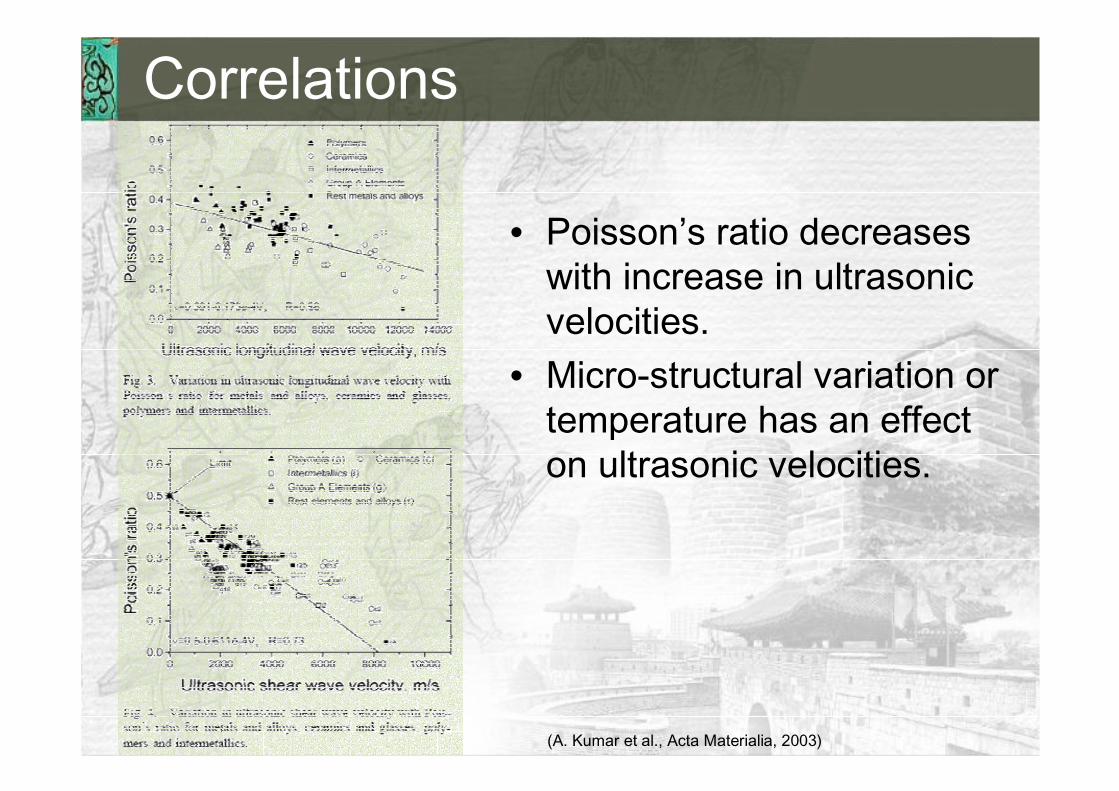
• Poisson’s ratio decreases with increase in ultrasonic velocities.
• Micro-structural variation or temperature has an effect on ultrasonic velocities.
Correlations
(A. Kumar et al., Acta Materialia, 2003)
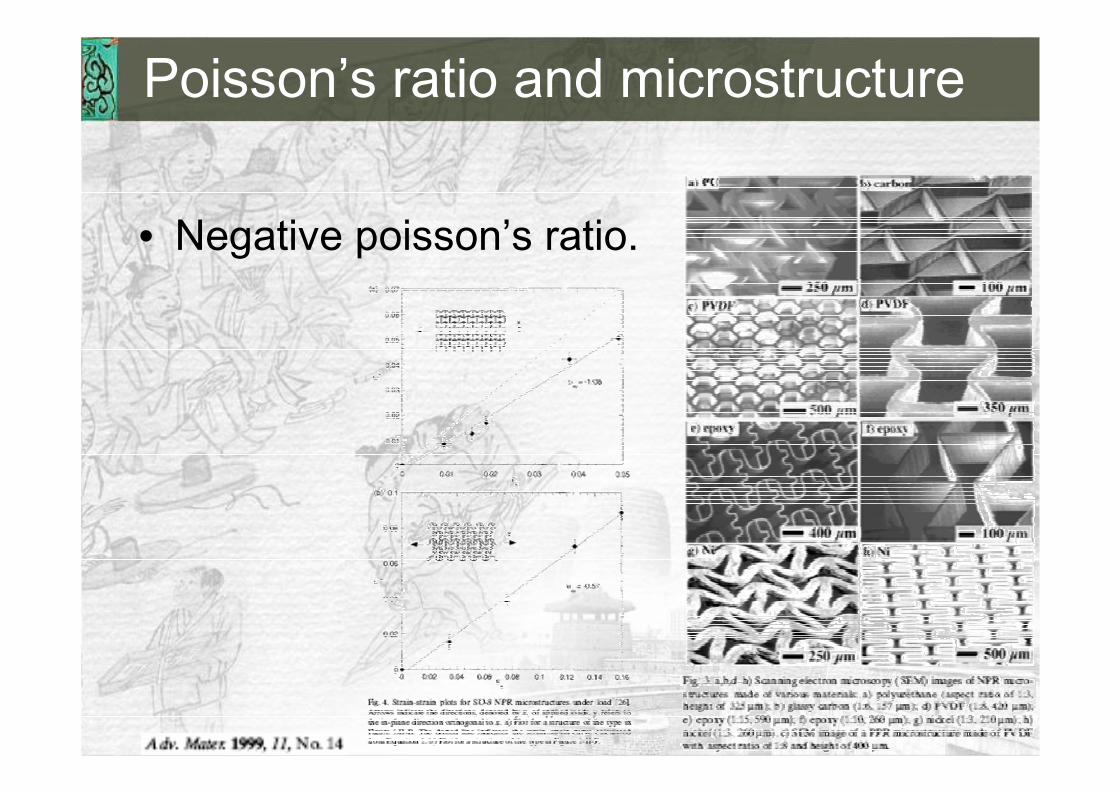
• Negative poisson’s ratio.
Poisson’s ratio and microstructure
• Destructive testing– Tensile test
• Nondestructive testing– Contact method– Noncontact method
How to measure Poisson’s ratio
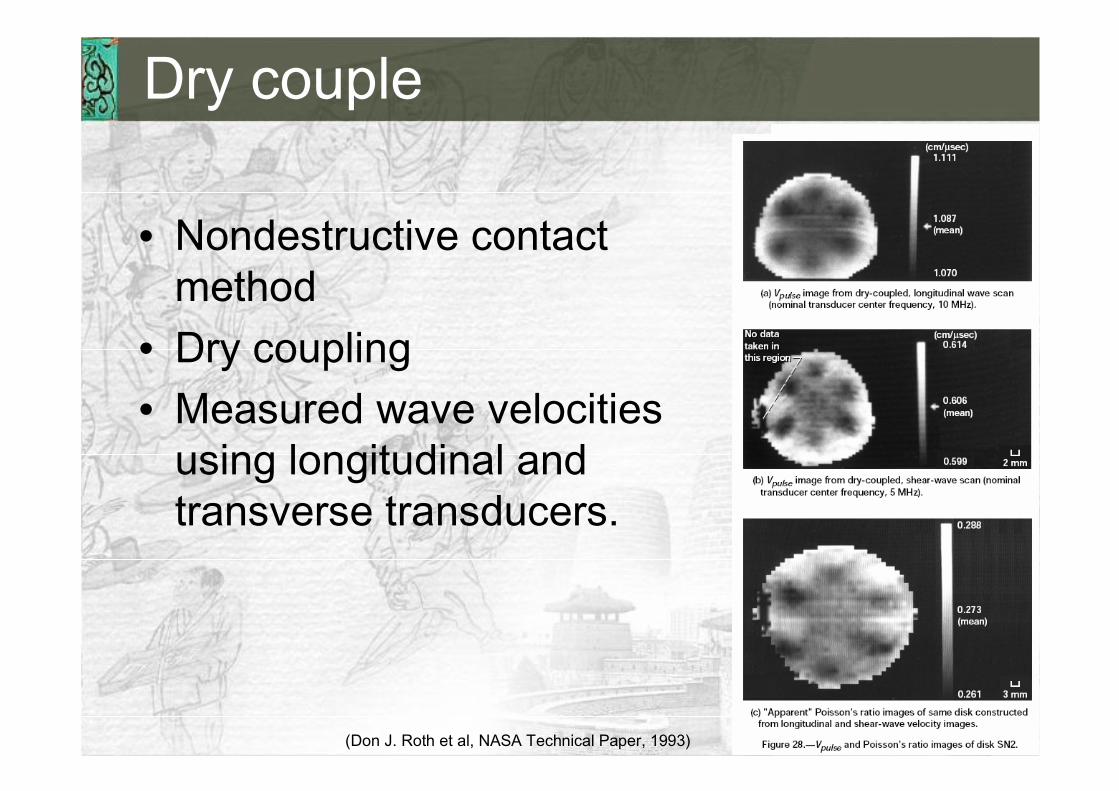
• Nondestructive contact method
• Dry coupling• Measured wave velocities
using longitudinal and transverse transducers.
Dry couple
(Don J. Roth et al, NASA Technical Paper, 1993)
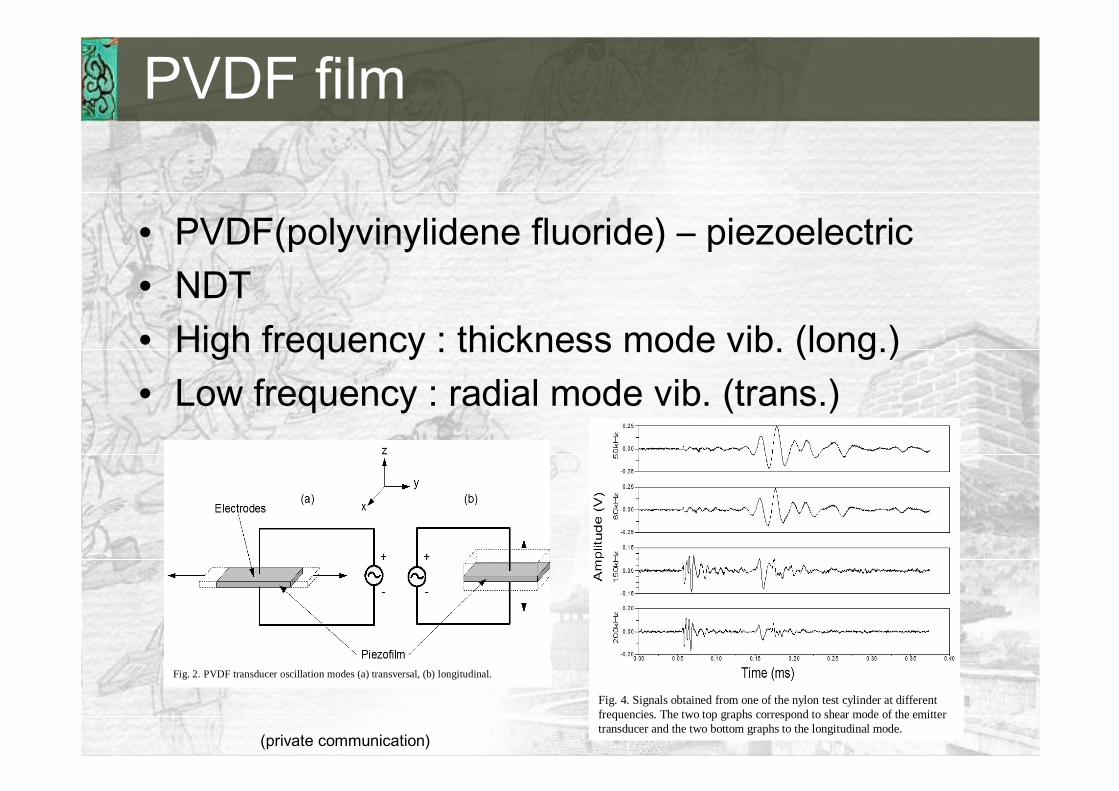
• PVDF(polyvinylidene fluoride) – piezoelectric• NDT• High frequency : thickness mode vib. (long.)• Low frequency : radial mode vib. (trans.)
PVDF film
(private communication)
Fig. 4. Signals obtained from one of the nylon test cylinder at different frequencies. The two top graphs correspond to shear mode of the emitter transducer and the two bottom graphs to the longitudinal mode.
Fig. 2. PVDF transducer oscillation modes (a) transversal, (b) longitudinal.
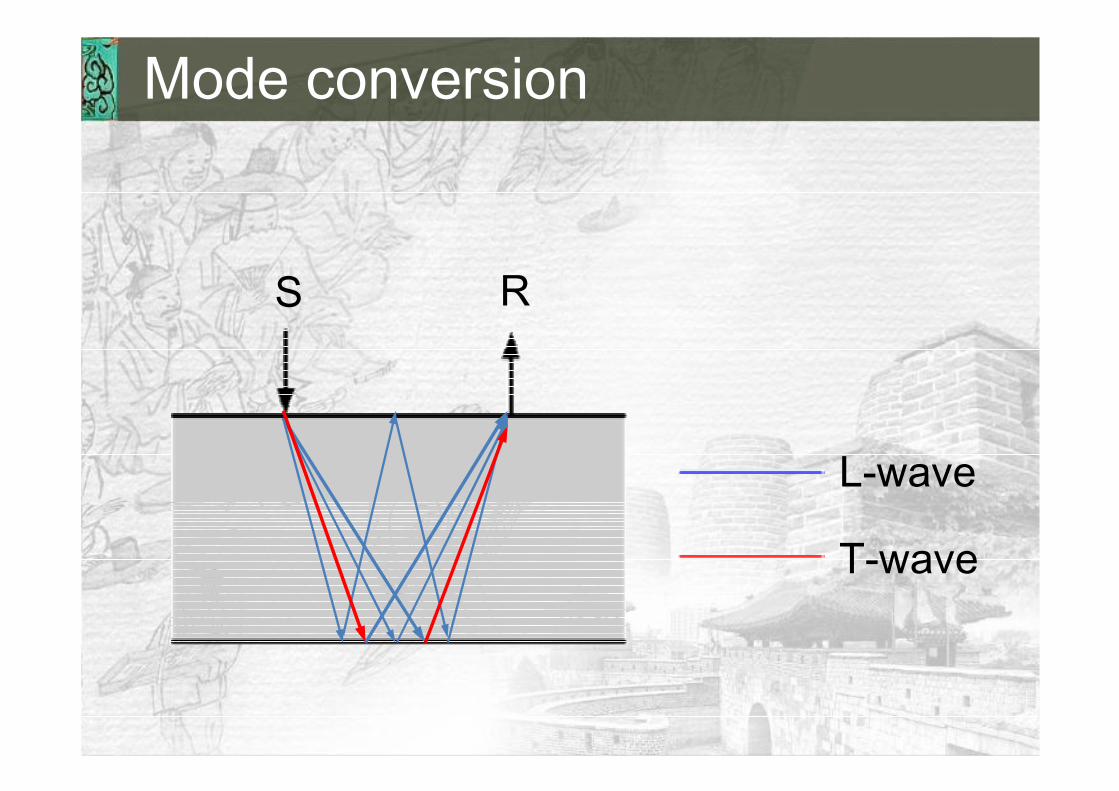
Mode conversion
S R
L-wave
T-wave
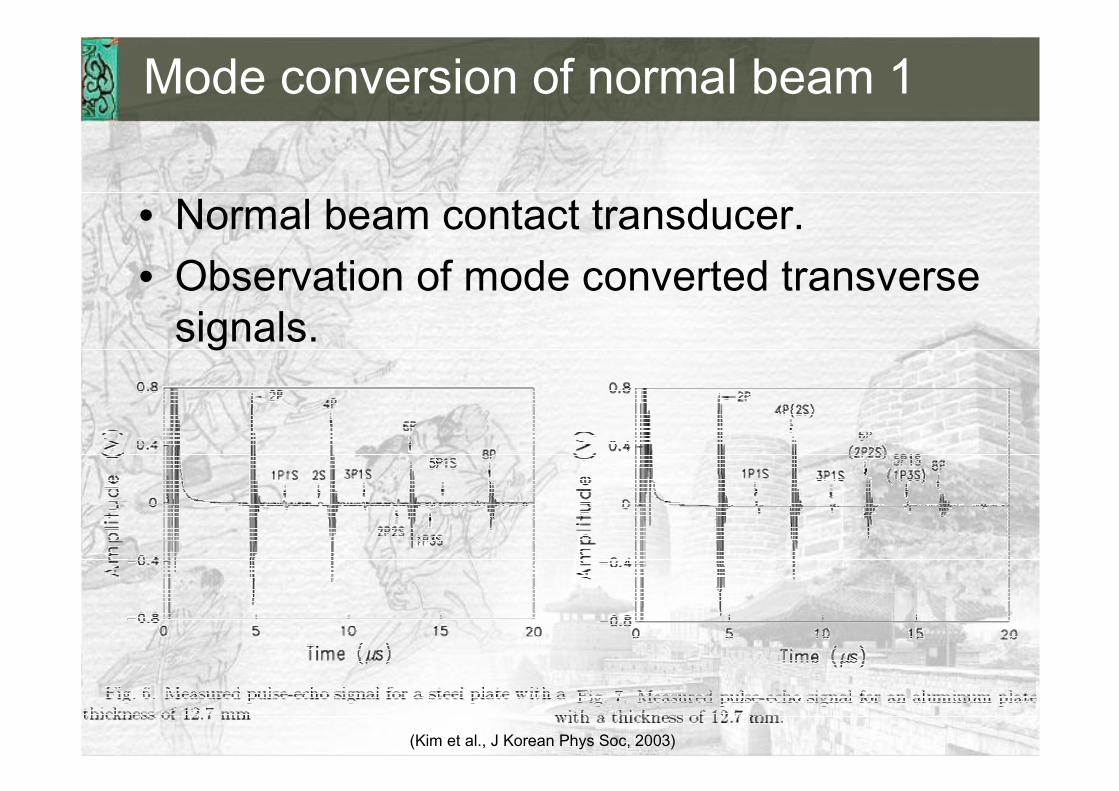
• Normal beam contact transducer.• Observation of mode converted transverse
signals.
Mode conversion of normal beam 1
(Kim et al., J Korean Phys Soc, 2003)
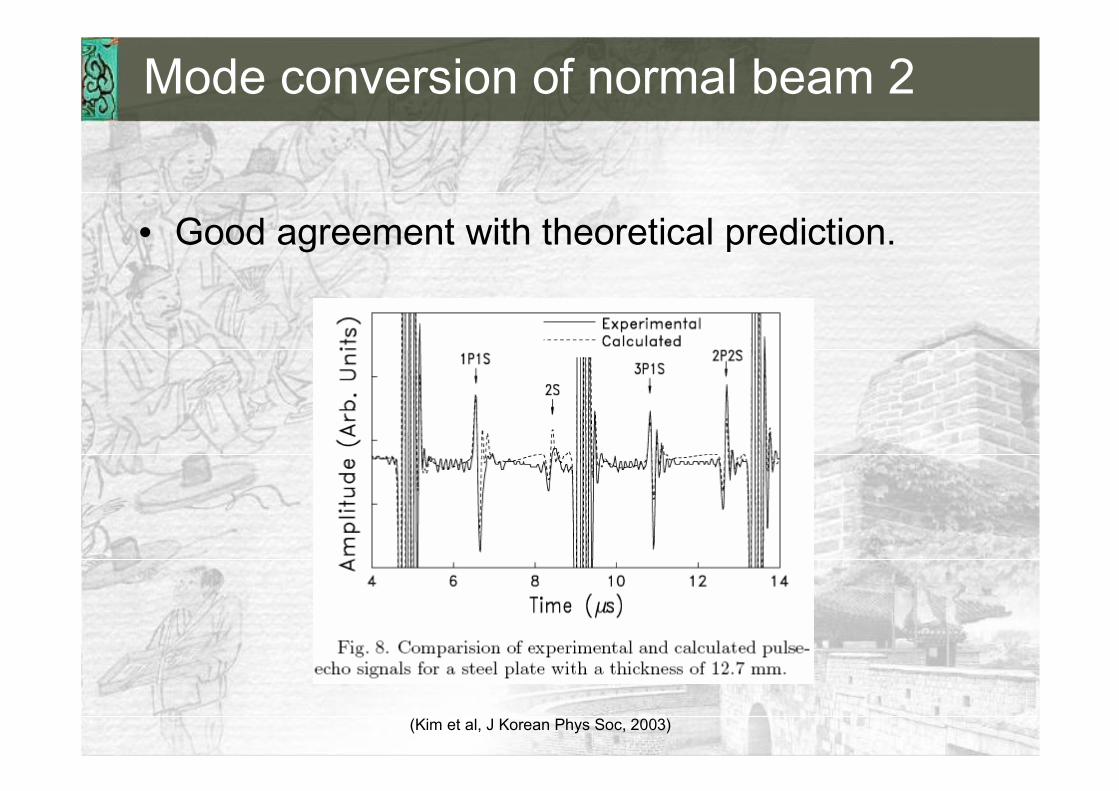
• Good agreement with theoretical prediction.
Mode conversion of normal beam 2
(Kim et al, J Korean Phys Soc, 2003)
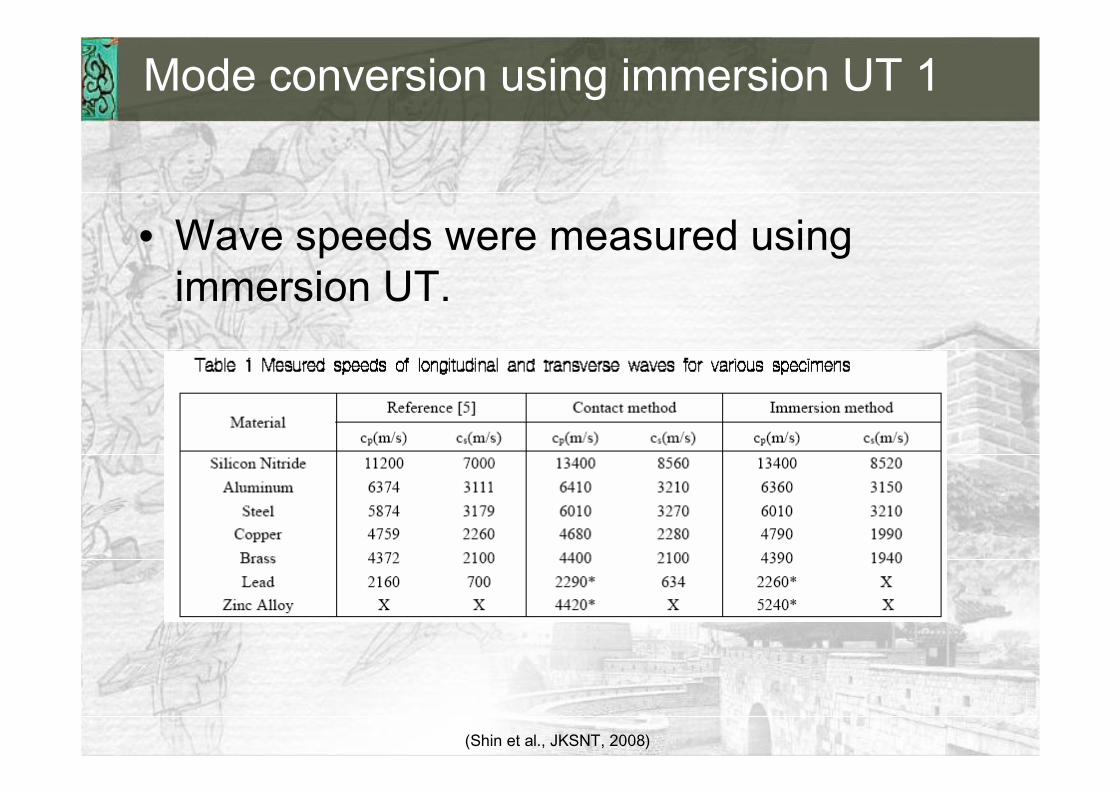
• Wave speeds were measured using immersion UT.
Mode conversion using immersion UT 1
(Shin et al., JKSNT, 2008)
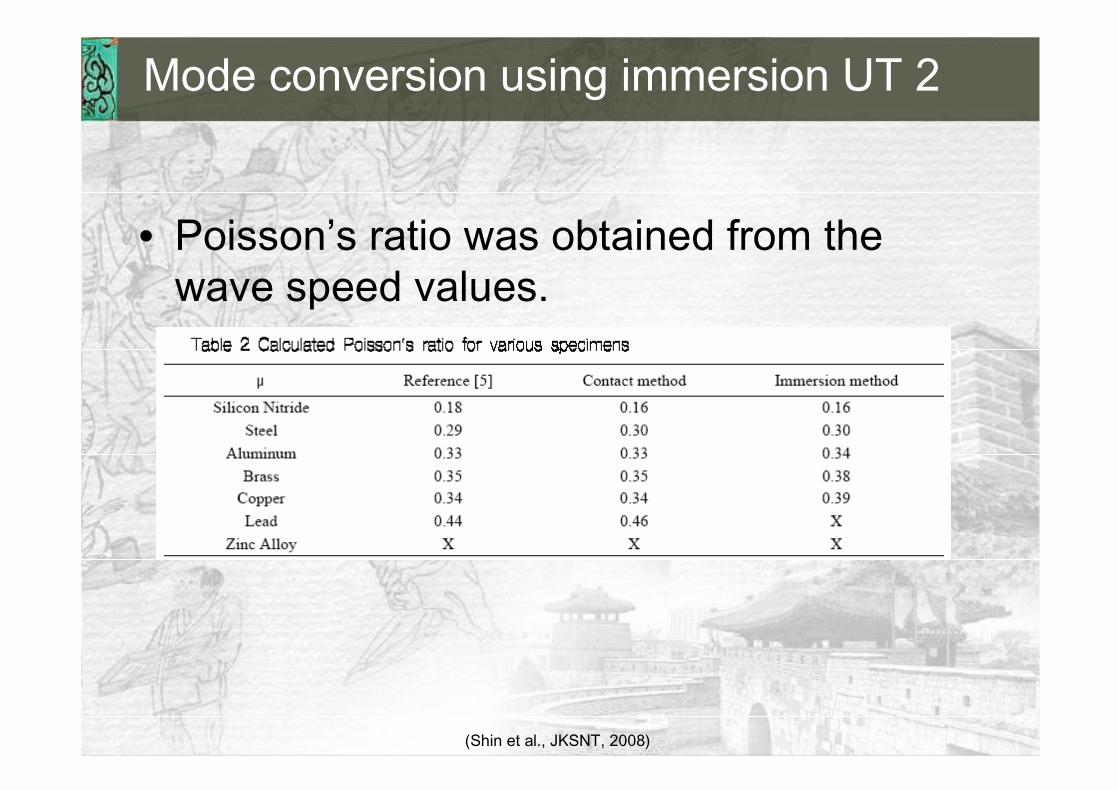
• Poisson’s ratio was obtained from the wave speed values.
Mode conversion using immersion UT 2
(Shin et al., JKSNT, 2008)
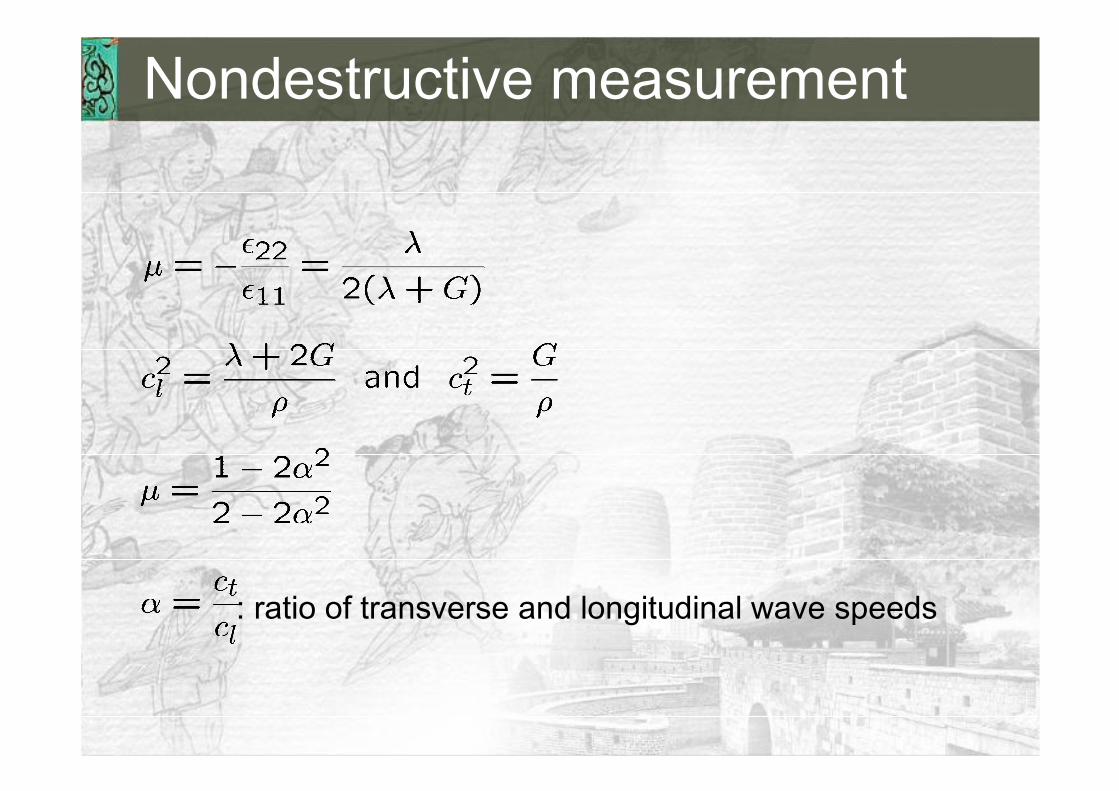
Nondestructive measurement
: ratio of transverse and longitudinal wave speeds
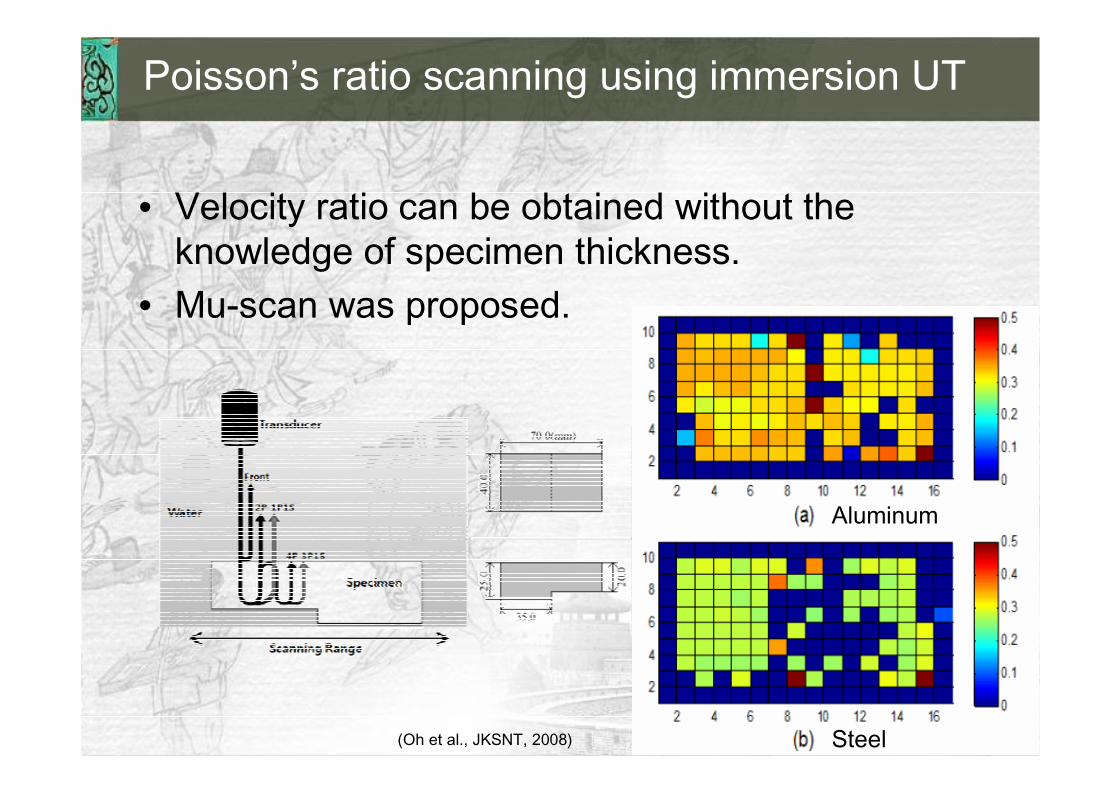
• Velocity ratio can be obtained without the knowledge of specimen thickness.
• Mu-scan was proposed.
Poisson’s ratio scanning using immersion UT
(Oh et al., JKSNT, 2008)
Aluminum
Steel
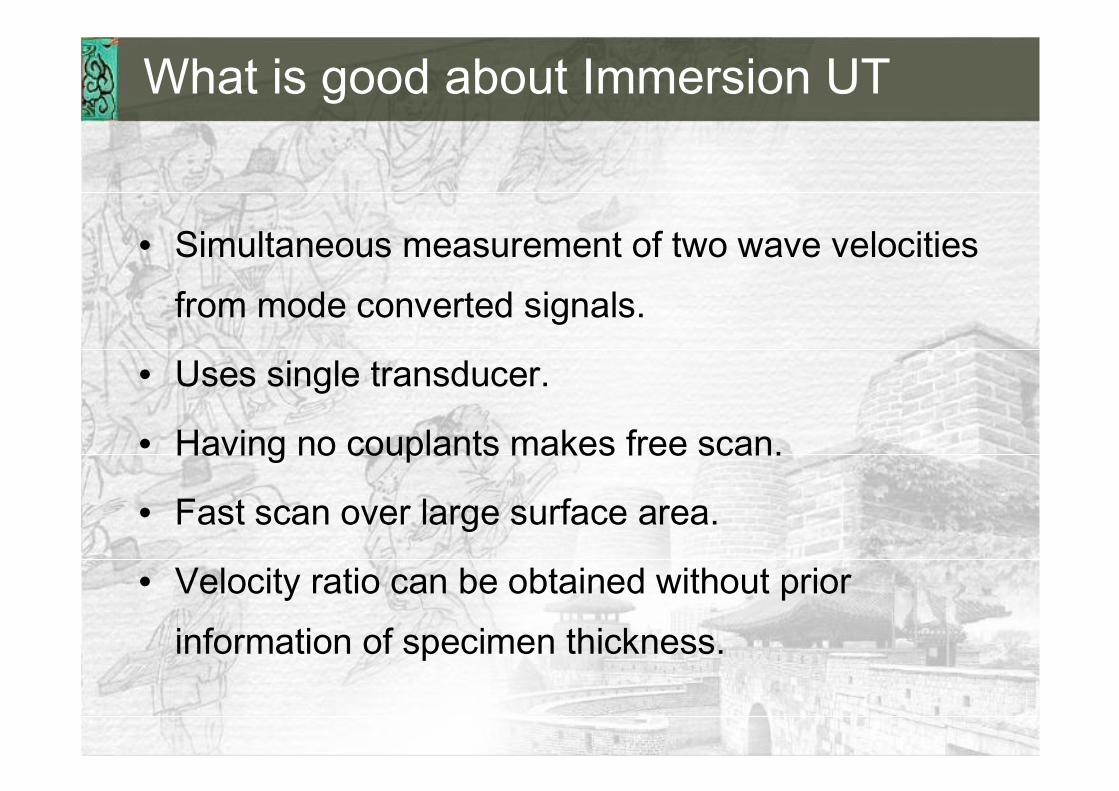
• Simultaneous measurement of two wave velocities from mode converted signals.
• Uses single transducer.
• Having no couplants makes free scan.
• Fast scan over large surface area.
• Velocity ratio can be obtained without prior information of specimen thickness.
What is good about Immersion UT
• Feasible study for field application of mu-scan.
• Poisson’s ratio reflects microstructure of materials.
• Mu scan applied to material characterization.
• Specimen was welded zone.
Work scope
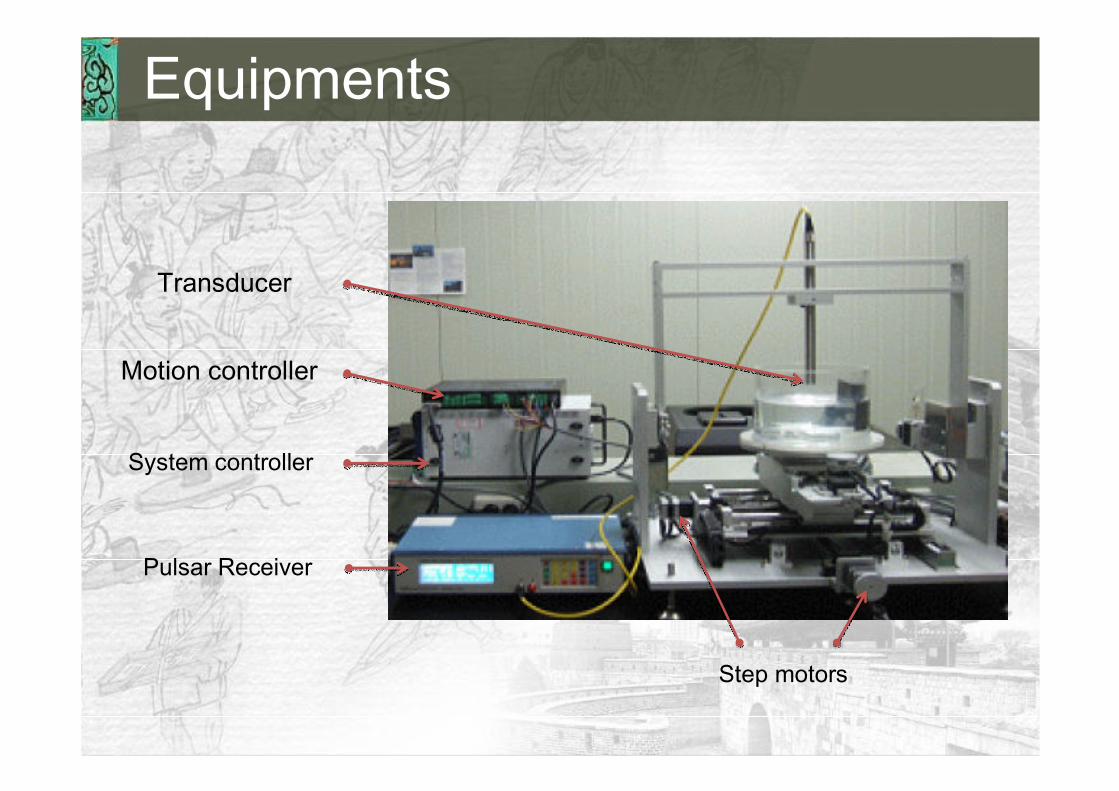
Equipments
Motion controller
Transducer
System controller
Pulsar Receiver
Step motors
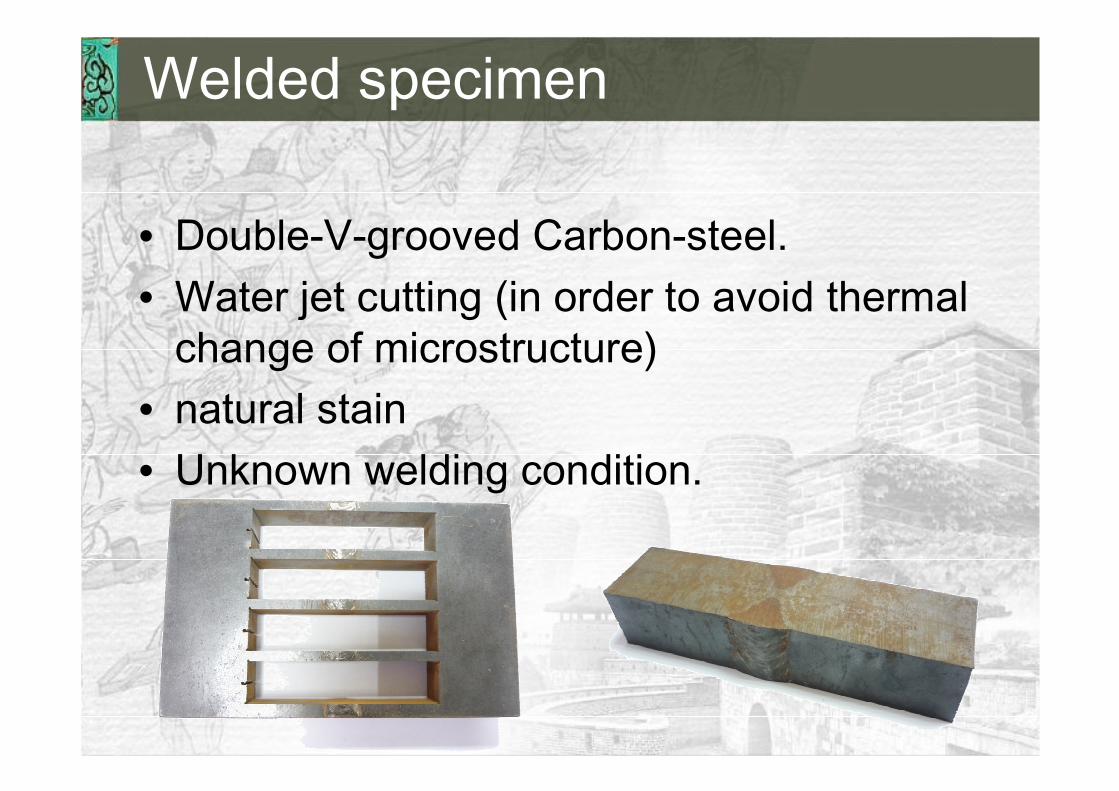
• Double-V-grooved Carbon-steel. • Water jet cutting (in order to avoid thermal
change of microstructure)• natural stain• Unknown welding condition.
Welded specimen
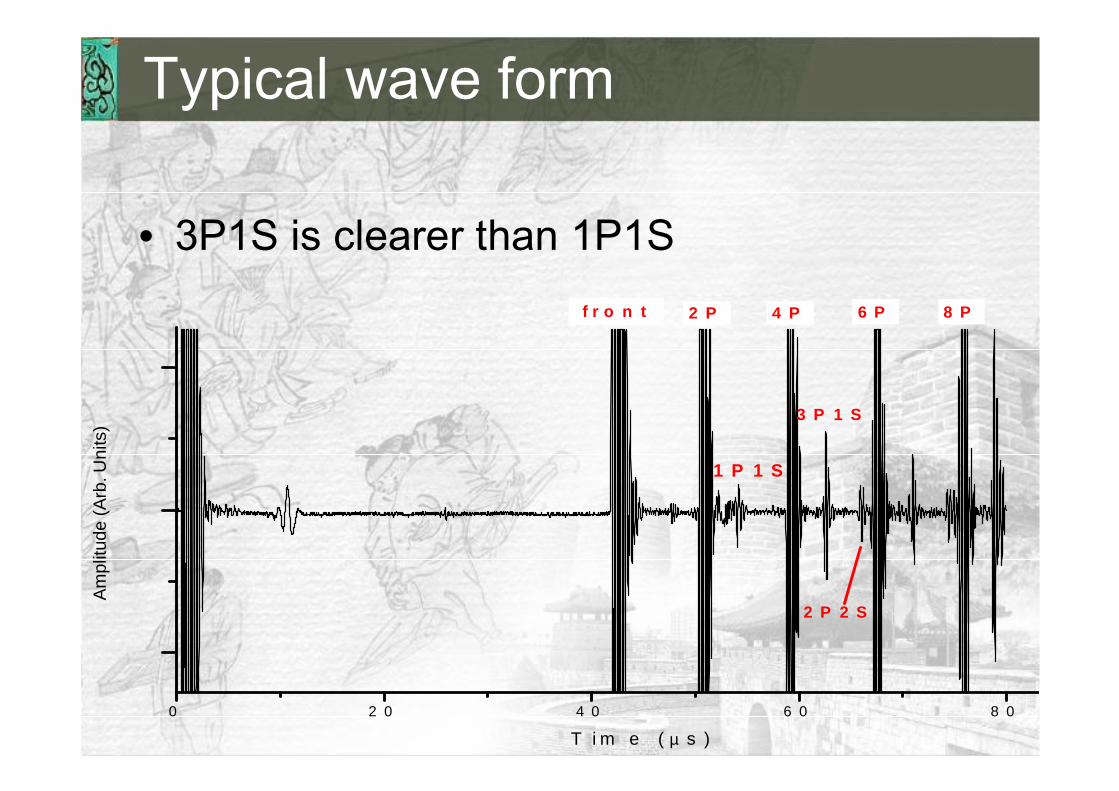
• 3P1S is clearer than 1P1S
0 2 0 4 0 6 0 8 0
Am
plitu
de (
Arb
. Uni
ts)
T i m e ( µ s )
f r o n t 2 P 4 P 6 P 8 P
3 P 1 S
1 P 1 S
2 P 2 S
Typical wave form
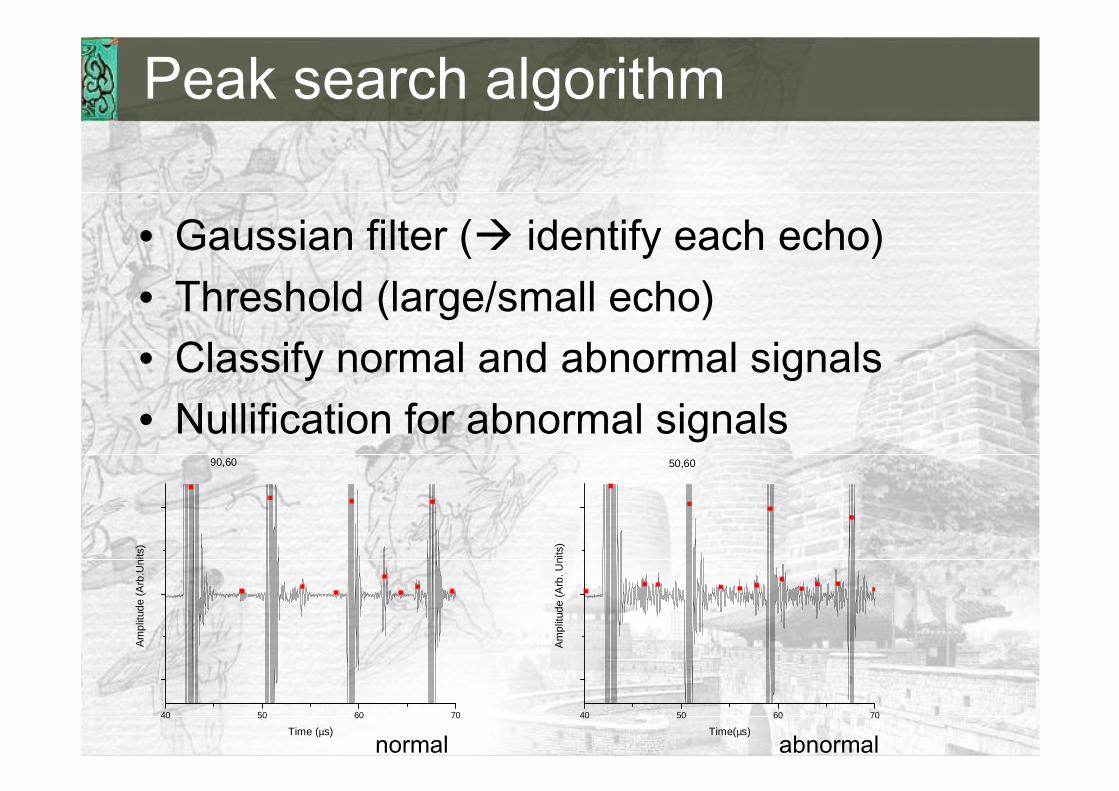
• Gaussian filter (� identify each echo)• Threshold (large/small echo)• Classify normal and abnormal signals• Nullification for abnormal signals
40 50 60 70
Am
plitu
de (
Arb
.Uni
ts)
Time (µs)
90,60
40 50 60 70
Am
plitu
de (
Arb
. Uni
ts)
Time(µs)
50,60
Peak search algorithm
normal abnormal

Range– 0.26~0.32 about 20% variation
Mu-scan of weldment 1
40 50 60 70
Am
plitu
de (
Arb
.Uni
ts)
Time (µs)
90,60
40 50 60 70
Am
plitu
de (
Arb
. Uni
ts)
Time(µs)
50,60
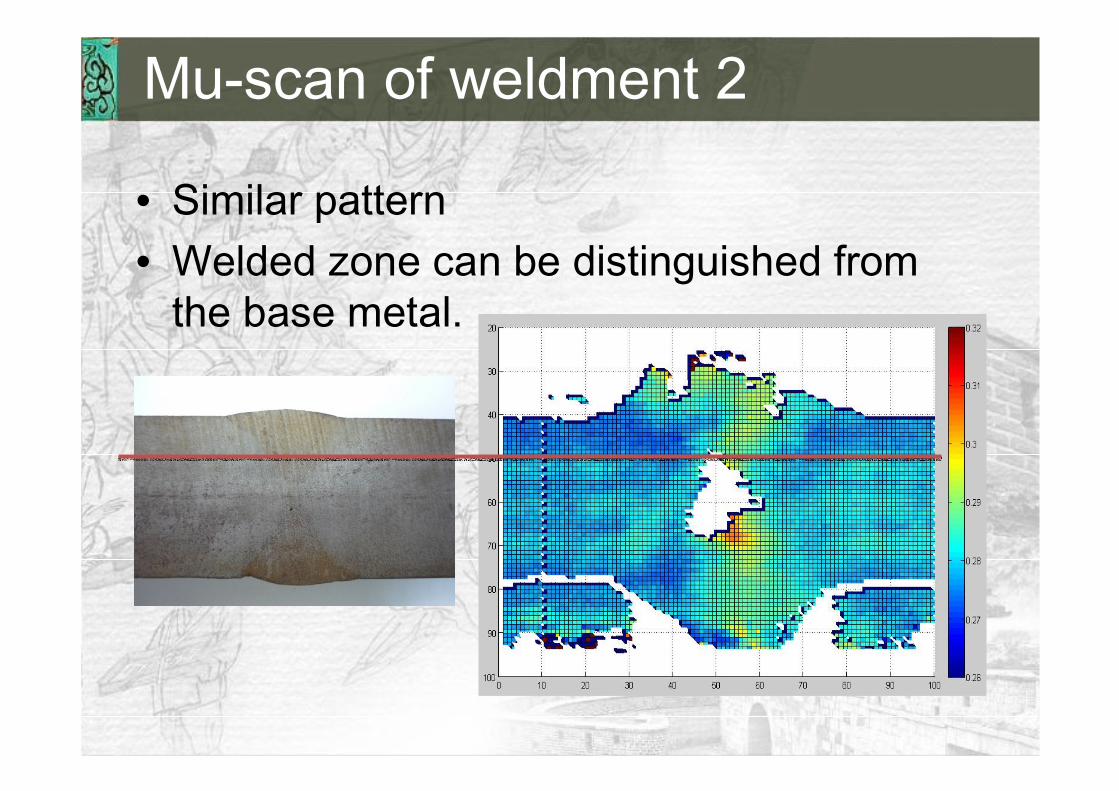
• Similar pattern• Welded zone can be distinguished from
the base metal.
Mu-scan of weldment 2
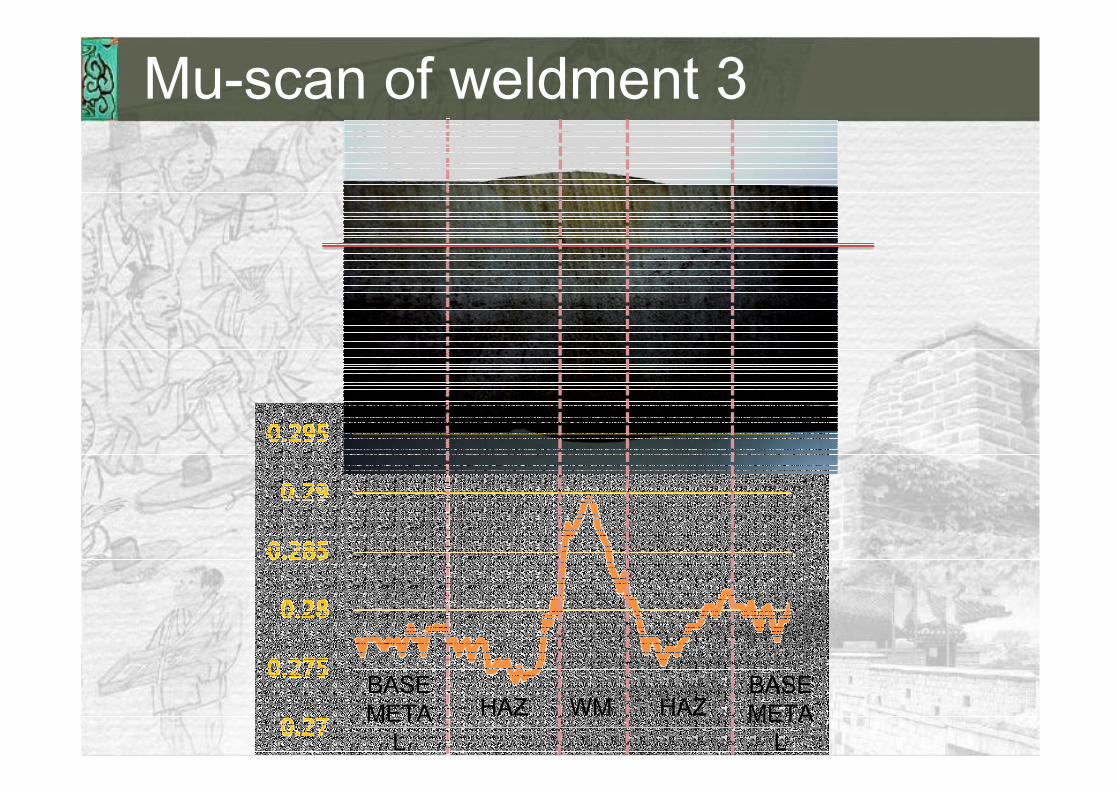
Mu-scan of weldment 3
HAZ HAZWMBASEMETA
L
BASEMETA
L
• 3P1S signal offers clearer information than 1P1S
signal.
• Welded zone is well distinguished from base
metal.
• Mu-scan shows high potential to characterize
materials.
Conclusions
• Comparison of mu-scan with microstructure and micro-
hardness test
• Why 3P1S? � theoretical analysis
• Relationship between mu-scan and test conditions, such as,
thickness of specimen, frequency, diameter of the transducer.
• Application to other materials
– Sintered ceramics uniformity testing.
Future works
1. Young H. Kim et al., 'Transverse-Wave Modes in the Pulse-Echo Signal of a Normal-Beam Longitudinal-Wave Mode Transducer', Journal of the Korean Physical Society, Vol. 42, No. 1. January 2003.
2. Yosub Shin, Yeo Ho Yoon and Young H. Kim, Measurement of Longitudinal and Transverse Wave Speed in Solid Materials Using Immersion Ultrasonic Testing, Journal of the Korean Society for Nondestructive Testing Vol. 28, No. 1. February 2008.
3. SeoYoung Oh, Young H. Kim, Yosub Shin and Hyun Joon Cho, Poisson’s Ratio Scanning Using Immersion Ultrasonic Testing, Journal of the Korean Society for Nondestructive Testing Vol. 28, No. 6. December 2008.
4. Kuhn, G. J. and Lutsch, A. , Elastic wave mode conversion at a solid boundary with transverse slip. J. Acoust. Soc. Am. 33. 1964.
5. J.Krautkramer, H.Krautkramer, Ultrasonic Testing of Materials, 4th edition, Springer 1990.6. Pollard, Sound Waves in Solids, Pion Ltd, London, pp. 15-25. 1977.7. Kumar, Jayakumar, Raj and Ray, Correlation between ultrasonic shear wave velocity and
Poisson’s ratio for isotropic solid materials, Acta Materialia 51, pp. 2417-2426, 2003.8. Don J. Roth et al., Quantitative Mapping of Pore Fraction Variations in Silicon Nitride
Using an Ultrasonic Contact Scan Technique, NASA technical paper 3377, 1993.9. S. Matsuoka et al., Young's Modulus and Poisson's Ratio on Low-Cycle Fatigue, Trans.
Japan Soc. Mech. Eng. 488, 1987.10. Jeffery T. Fong et al., Basic Questions in Fatigue, American Soc. for Testing and
Materials, pp.84-87, 1988
References