Physical Principles of Molecular Information Systems
41
U. Geneva – Physics Colloquium Physical Principles of Molecular Information Systems Physics Colloquium Weizmann (G. Brodsky Mol Cell 2010)
Transcript of Physical Principles of Molecular Information Systems
U. Geneva – Physics Colloquium
Physical Principles of Molecular Information Systems
Physics Colloquium
Weizmann
(G. Brodsky Mol Cell 2010)
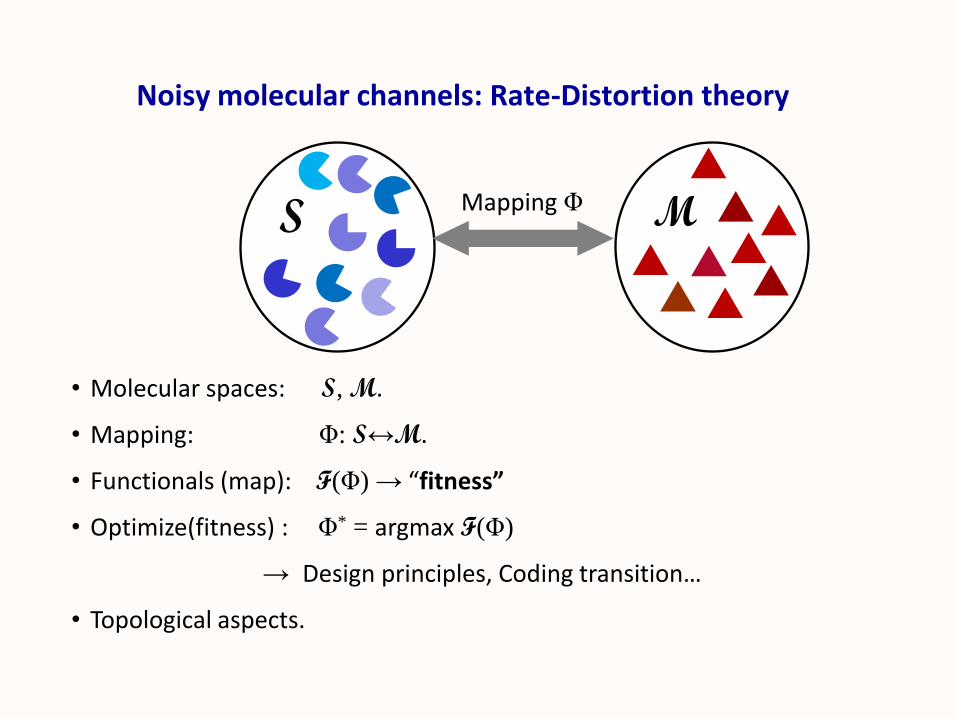
Noisy molecular channels: Rate-Distortion theory
• Molecular spaces: S, M.
• Mapping: Φ: S↔M.
• Functionals (map): F(Φ) → “fitness”
• Optimize(fitness) : Φ* = argmax F(Φ)
→ Design principles, Coding transition…
• Topological aspects.
S MMapping Φ
Photosynthesis
Molecular codes (genetic code)
Chromosome organization
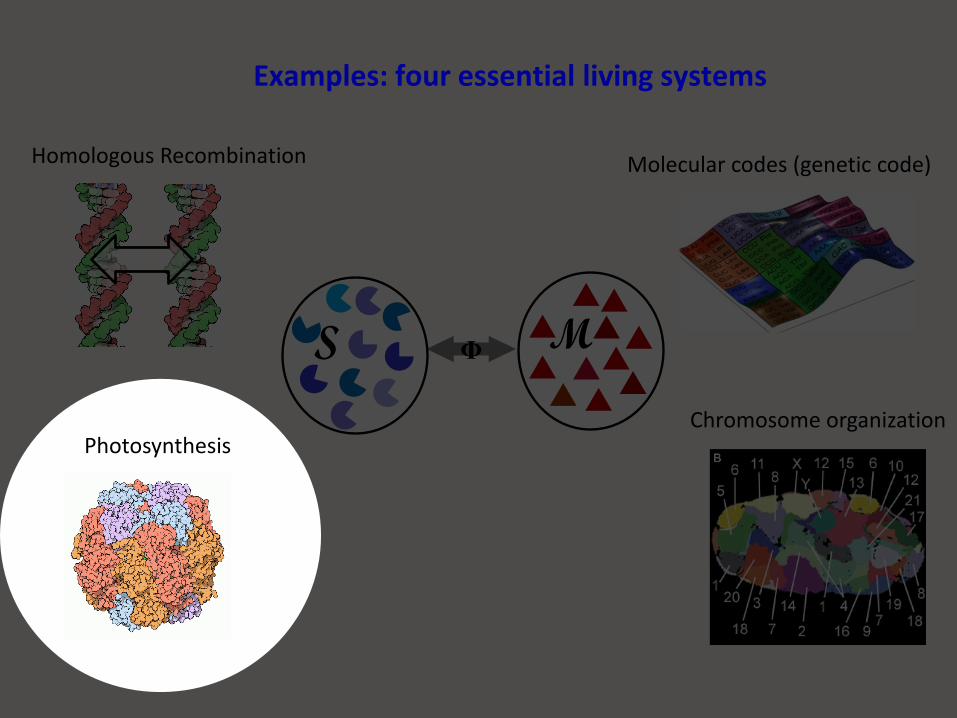
ΦS M
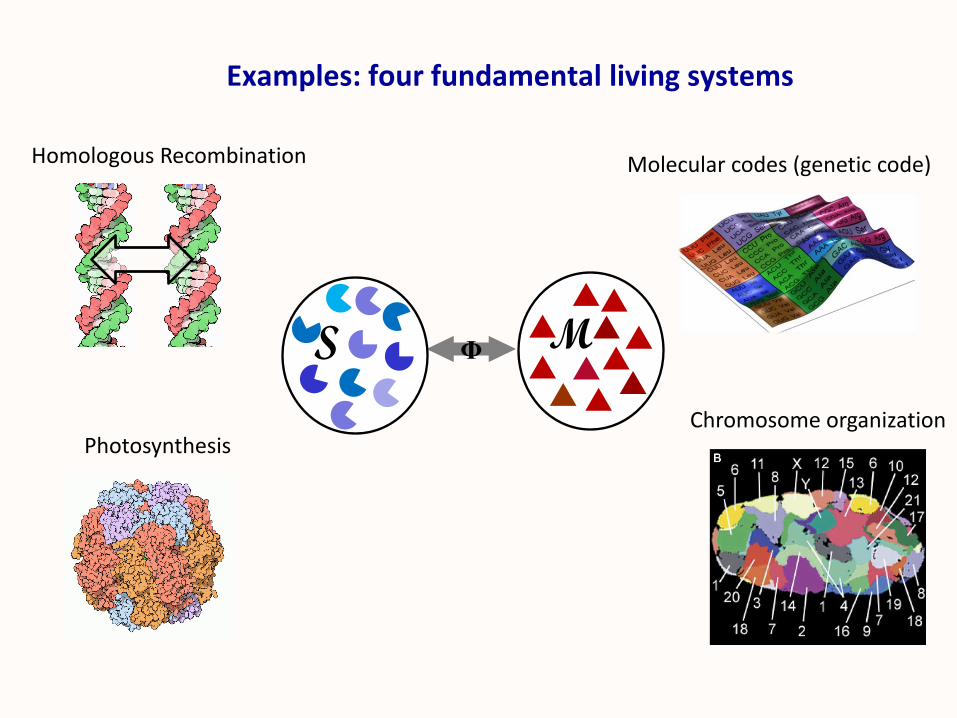
Examples: four fundamental living systems
Homologous Recombination
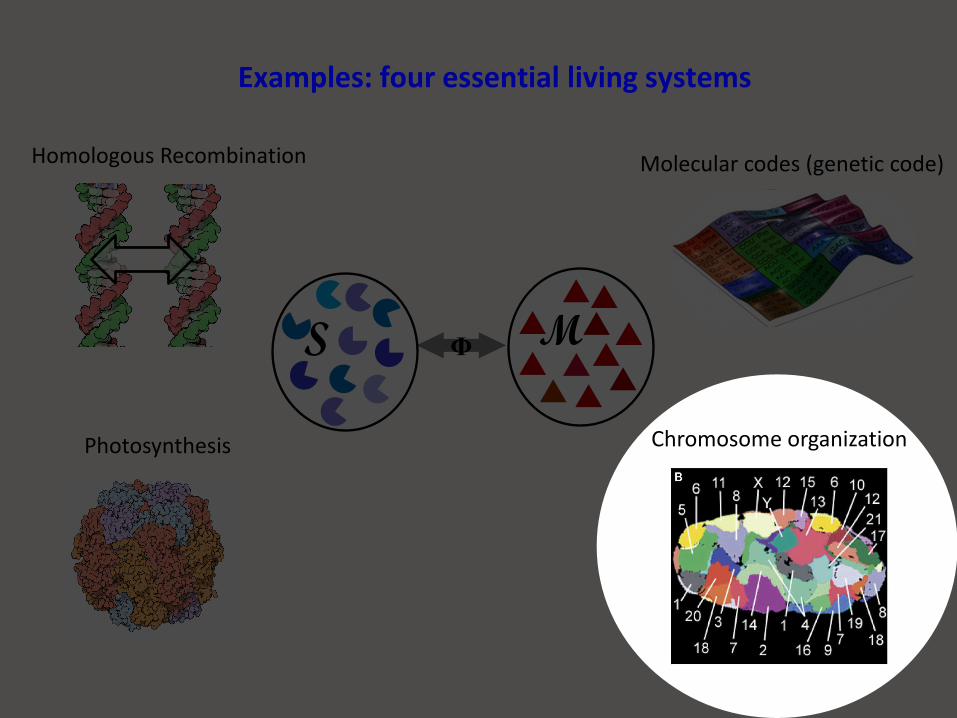
Photosynthesis
Molecular codes (genetic code)
Chromosome organization
ΦS M
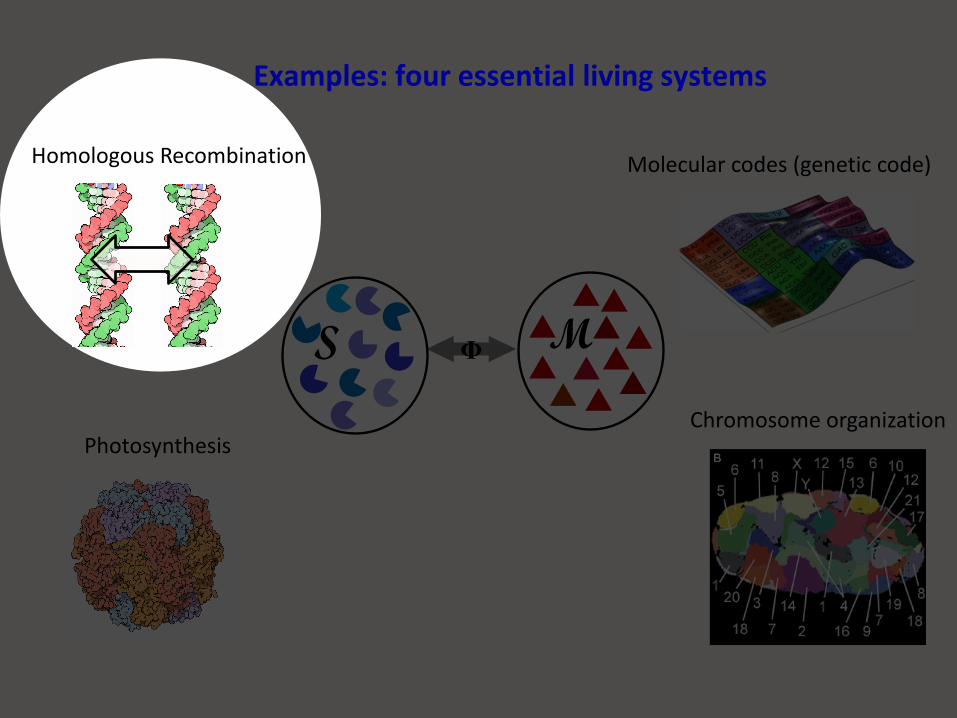
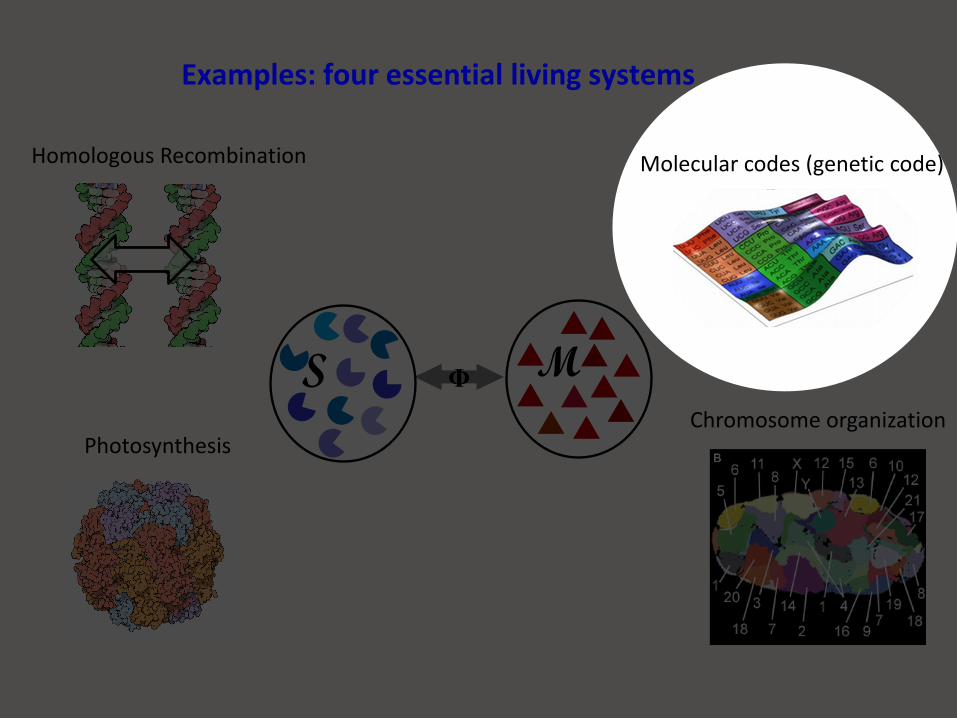
Examples: four essential living systems
Homologous Recombination
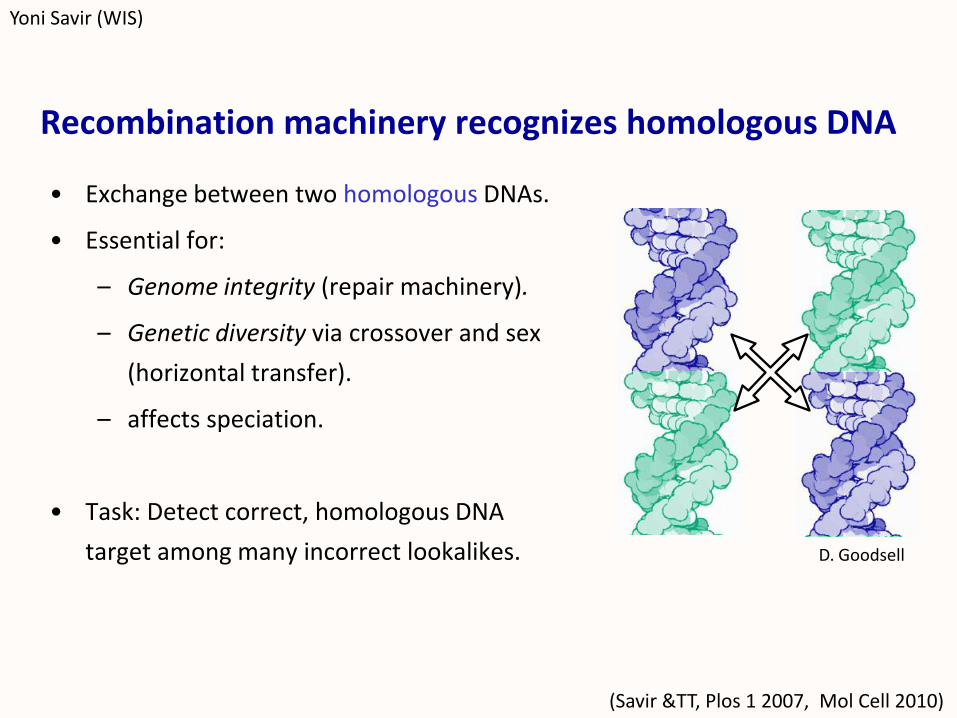
Recombination machinery recognizes homologous DNA
• Exchange between two homologous DNAs.
• Essential for:
– Genome integrity (repair machinery).
– Genetic diversity via crossover and sex
(horizontal transfer).
– affects speciation.
• Task: Detect correct, homologous DNA
target among many incorrect lookalikes.
(Savir &TT, Plos 1 2007, Mol Cell 2010)
Yoni Savir (WIS)
D. Goodsell
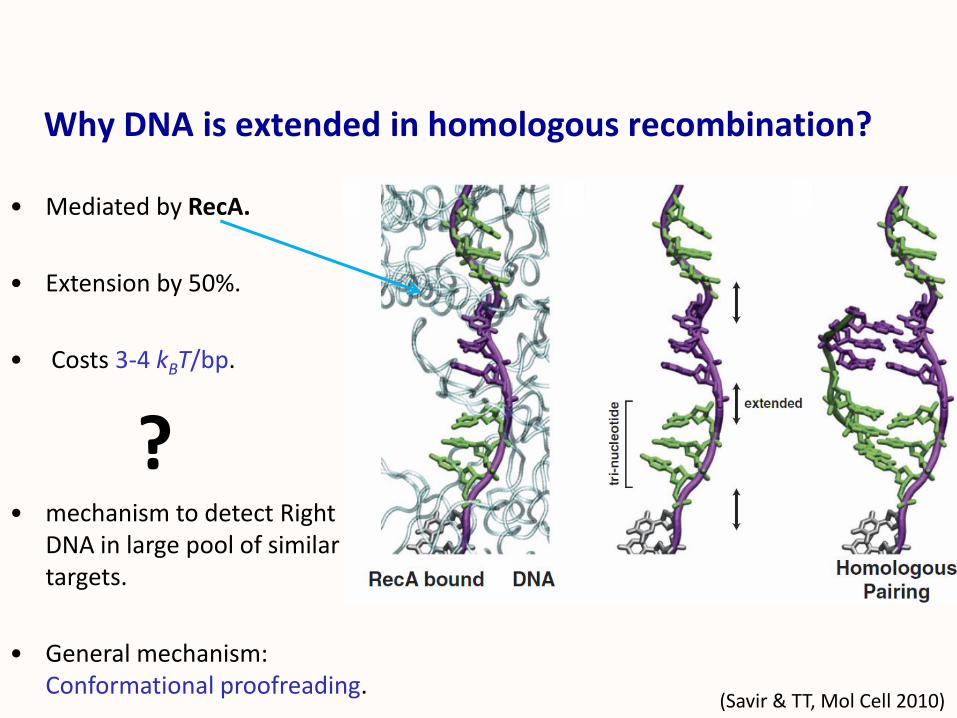
Why DNA is extended in homologous recombination?
(Savir & TT, Mol Cell 2010)
• Mediated by RecA.
• Extension by 50%.
• Costs 3-4 kBT/bp.
?• mechanism to detect Right
DNA in large pool of similar targets.
• General mechanism: Conformational proofreading.
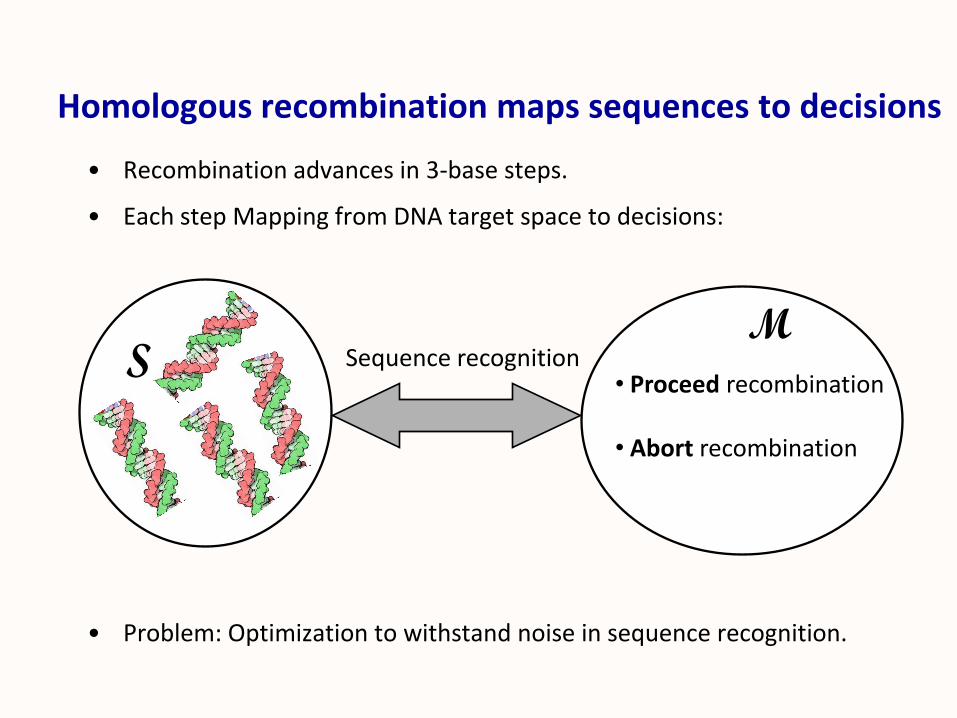
Homologous recombination maps sequences to decisions
• Recombination advances in 3-base steps.
• Each step Mapping from DNA target space to decisions:
• Problem: Optimization to withstand noise in sequence recognition.
S• Proceed recombination
• Abort recombination
MSequence recognition
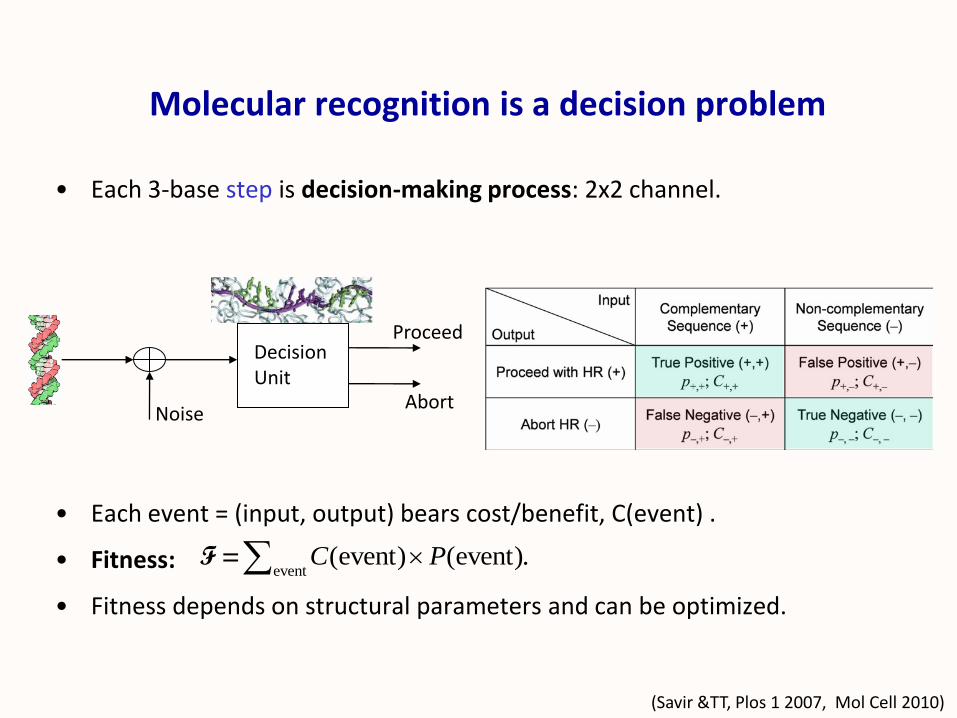
Molecular recognition is a decision problem
Abort
Proceed
Noise
DecisionUnit
(Savir &TT, Plos 1 2007, Mol Cell 2010)
• Each 3-base step is decision-making process: 2x2 channel.
• Each event = (input, output) bears cost/benefit, C(event) .
• Fitness:
• Fitness depends on structural parameters and can be optimized.
event(event) (event).C PF =
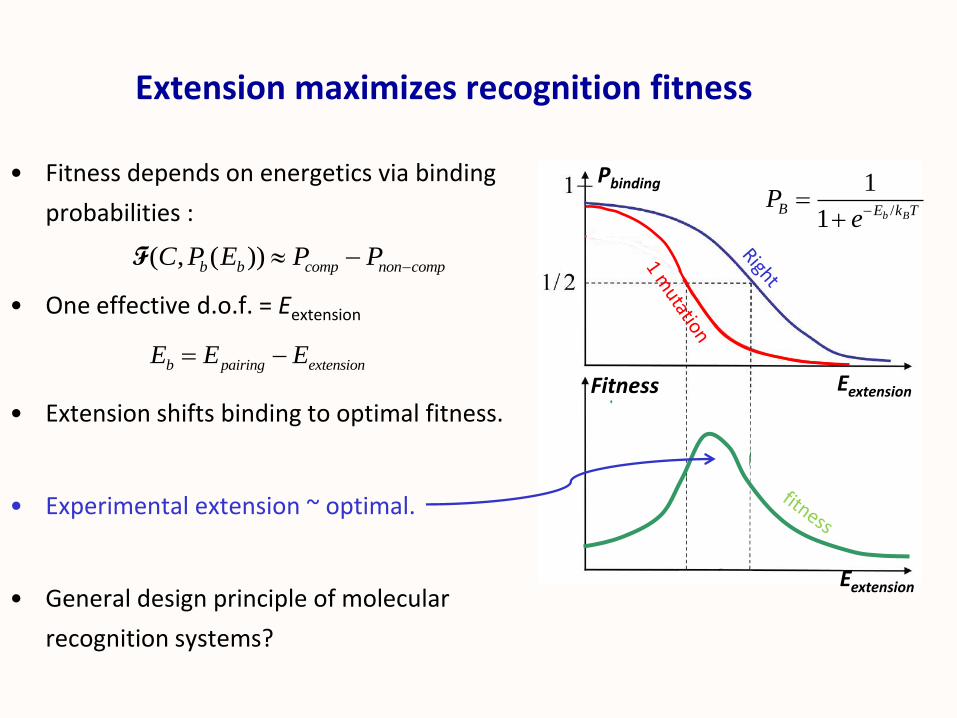
Extension maximizes recognition fitness
• Fitness depends on energetics via binding
probabilities :
• One effective d.o.f. = Eextension
• Extension shifts binding to optimal fitness.
• Experimental extension ~ optimal.
• General design principle of molecular
recognition systems?
Eextension
Eextension
Pbinding
Fitness
/
1
1 b BB E k T
Pe
( , ( ))b b comp non compC P E P P F
b pairing extensionE E E
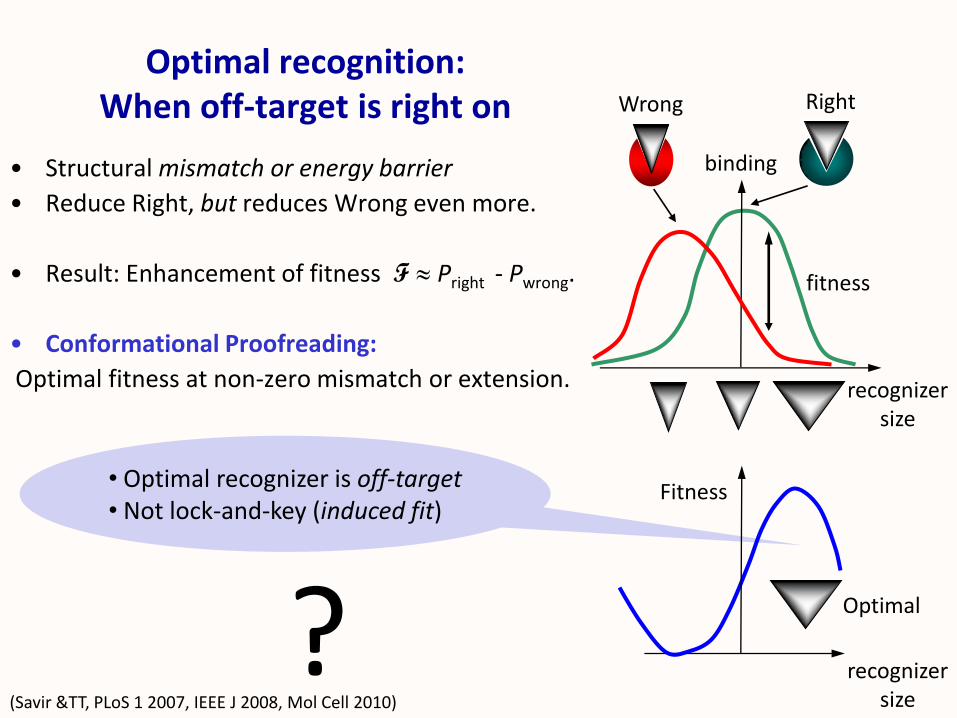
• Optimal recognizer is off-target• Not lock-and-key (induced fit)
Optimal recognition:When off-target is right on
• Structural mismatch or energy barrier
• Reduce Right, but reduces Wrong even more.
• Result: Enhancement of fitness F ≈ Pright - Pwrong.
• Conformational Proofreading:
Optimal fitness at non-zero mismatch or extension.
?
RightWrong
binding
recognizersize
Fitness
Optimal
recognizersize
fitness
(Savir &TT, PLoS 1 2007, IEEE J 2008, Mol Cell 2010)
Homologous Recombination Molecular codes (genetic code)
Chromosome organization
ΦS M
Examples: four essential living systems
Photosynthesis
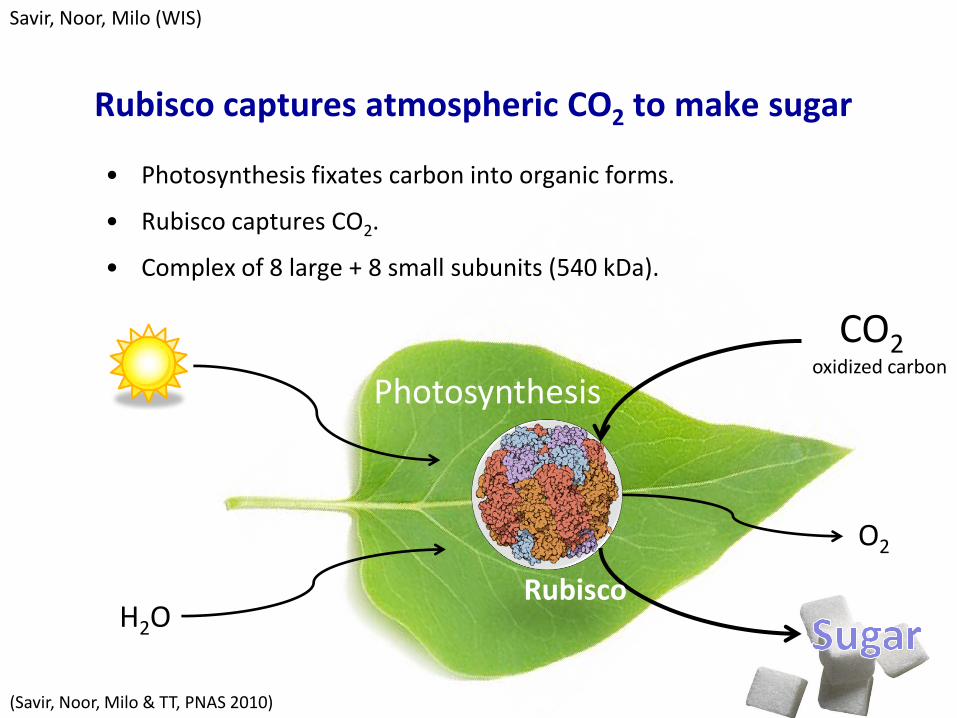
Rubisco captures atmospheric CO2 to make sugar
• Photosynthesis fixates carbon into organic forms.
• Rubisco captures CO2.
• Complex of 8 large + 8 small subunits (540 kDa).
H2O
CO2oxidized carbon
Photosynthesis
Rubisco
Savir, Noor, Milo (WIS)
O2
(Savir, Noor, Milo & TT, PNAS 2010)
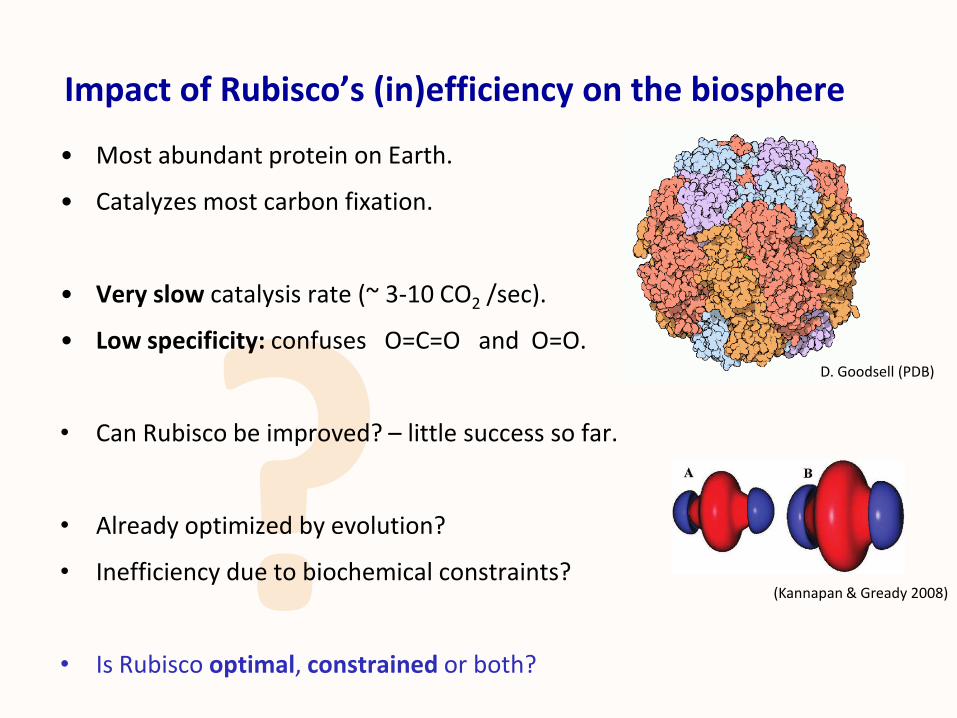
Impact of Rubisco’s (in)efficiency on the biosphere
• Most abundant protein on Earth.
• Catalyzes most carbon fixation.
• Very slow catalysis rate (~ 3-10 CO2 /sec).
• Low specificity: confuses O=C=O and O=O.
• Can Rubisco be improved? – little success so far.
• Already optimized by evolution?
• Inefficiency due to biochemical constraints?
• Is Rubisco optimal, constrained or both?
(Kannapan & Gready 2008)
(D. Goodsell (PDB)
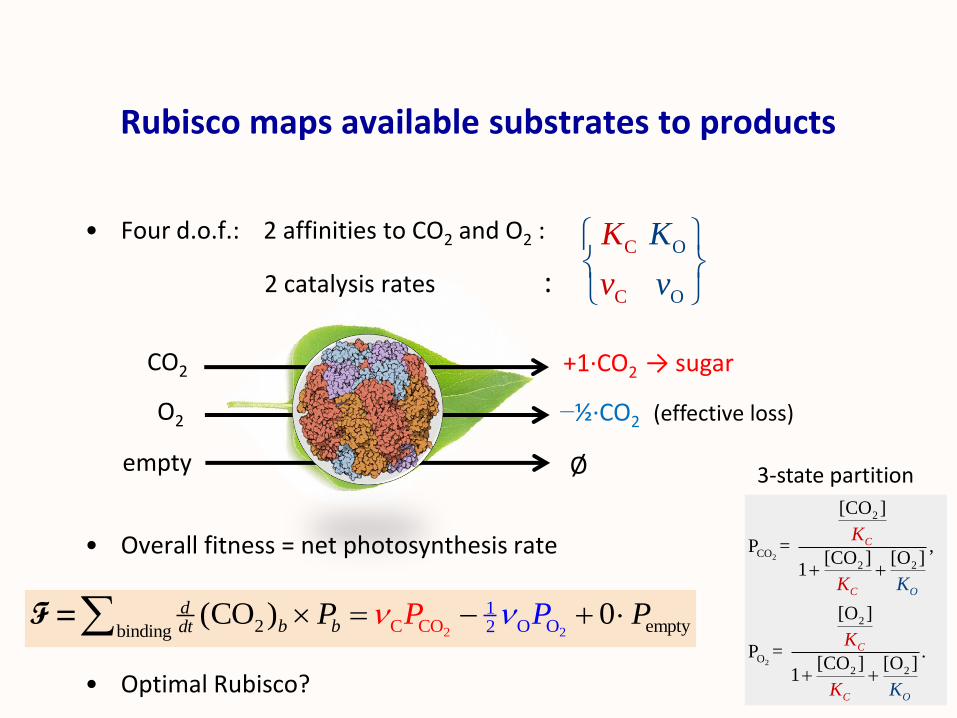
Rubisco maps available substrates to products
• Four d.o.f.: 2 affinities to CO2 and O2 :
2 catalysis rates :
• Overall fitness = net photosynthesis rate
• Optimal Rubisco?
C
C
O
O
K
v
K
v
CO2
O2
empty
+1·CO2 → sugar
−½·CO2 (effective loss)
Ø
222 emptybindi C 2CO1
O Ong(CO ) 0d
b bdtPP PP F =
2
2
2
CO2 2
2
O2 2
[CO ]
P = , [CO ] [O ]
1
[O ]
P = . [CO ] [O ]
1
C
C
C
O
OC
K
K
K
K
K K
3-state partition
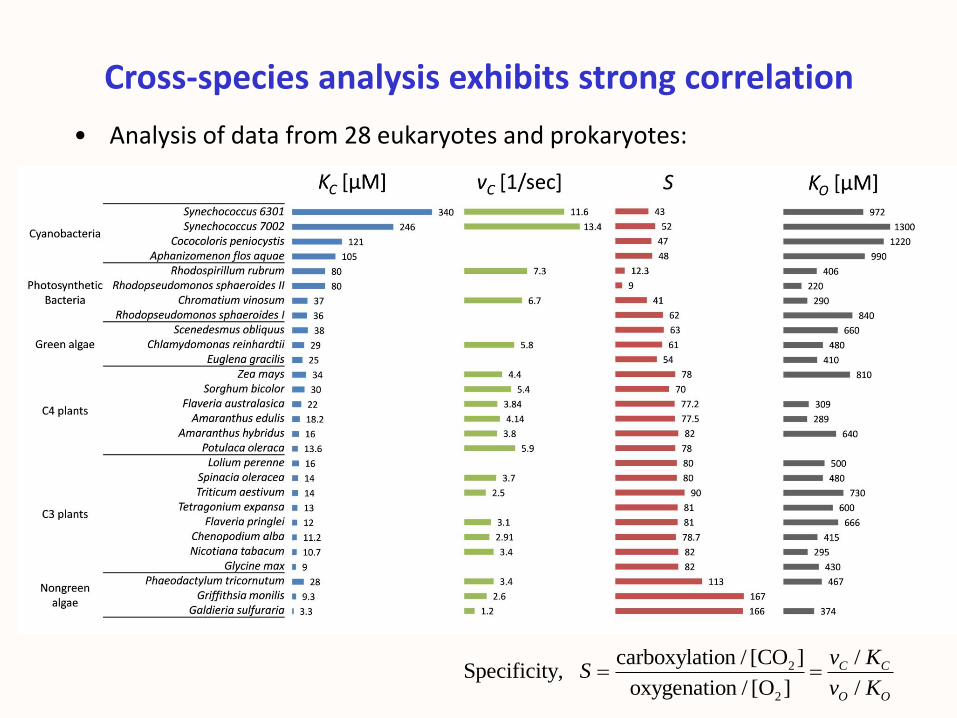
Cross-species analysis exhibits strong correlation
• Analysis of data from 28 eukaryotes and prokaryotes:
2
2
carboxylation / [CO ] /Specificity,
oxygenation / [O ] /
C C
O O
v KS
v K
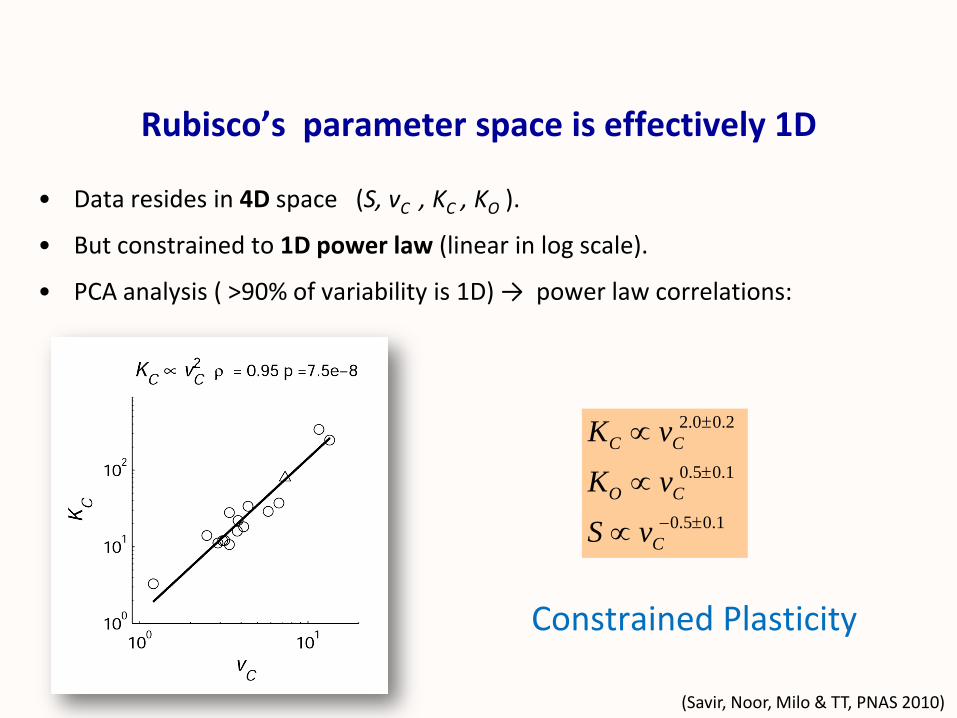
• Data resides in 4D space (S, vC , KC , KO ).
• But constrained to 1D power law (linear in log scale).
• PCA analysis ( >90% of variability is 1D) → power law correlations:
Rubisco’s parameter space is effectively 1D
2.0 0.2
0.5 0.1
0.5 0.1
C C
O C
C
K v
K v
S v
(Savir, Noor, Milo & TT, PNAS 2010)
Constrained Plasticity
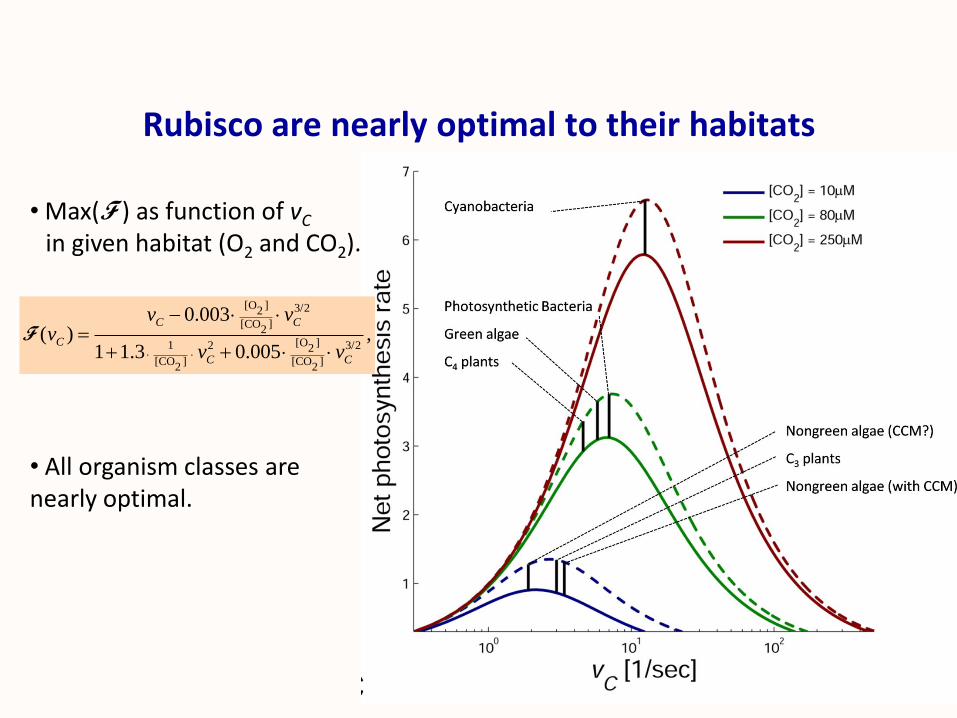
Rubisco are nearly optimal to their habitats
[O ] 3/22
[CO ]2
[O ]1 2 3/22
[CO ] [CO ]2 2
0.003( ) ,
1 1.3 0.005
C C
C
C C
v vv
v v
F
• Max(F ) as function of vC
in given habitat (O2 and CO2).
• All organism classes are nearly optimal.
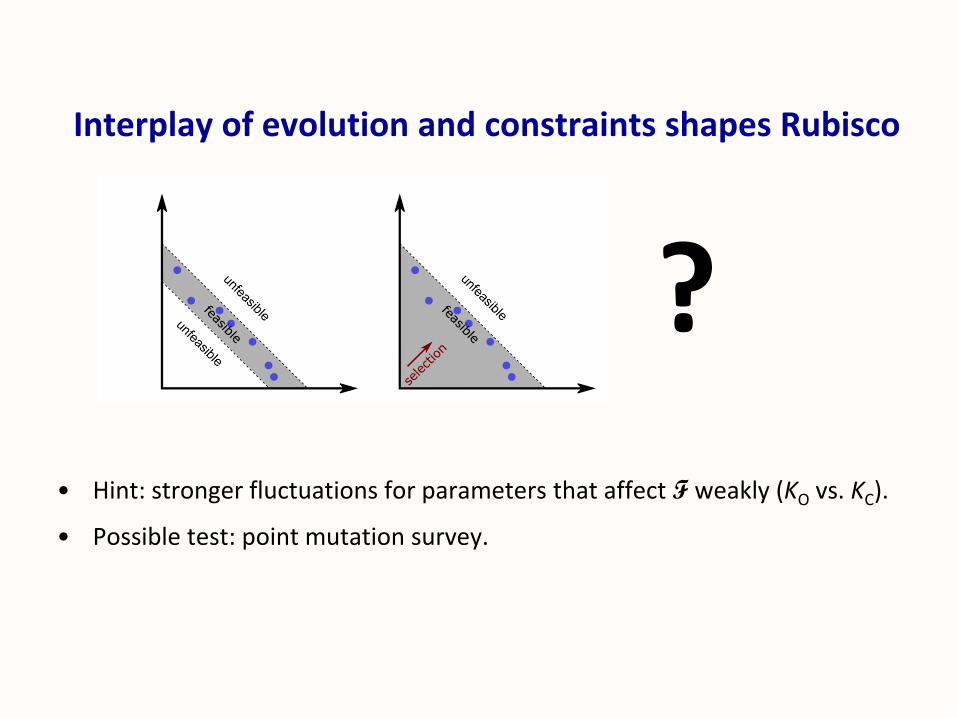
Interplay of evolution and constraints shapes Rubisco
• Hint: stronger fluctuations for parameters that affect F weakly (KO vs. KC).
• Possible test: point mutation survey.
?
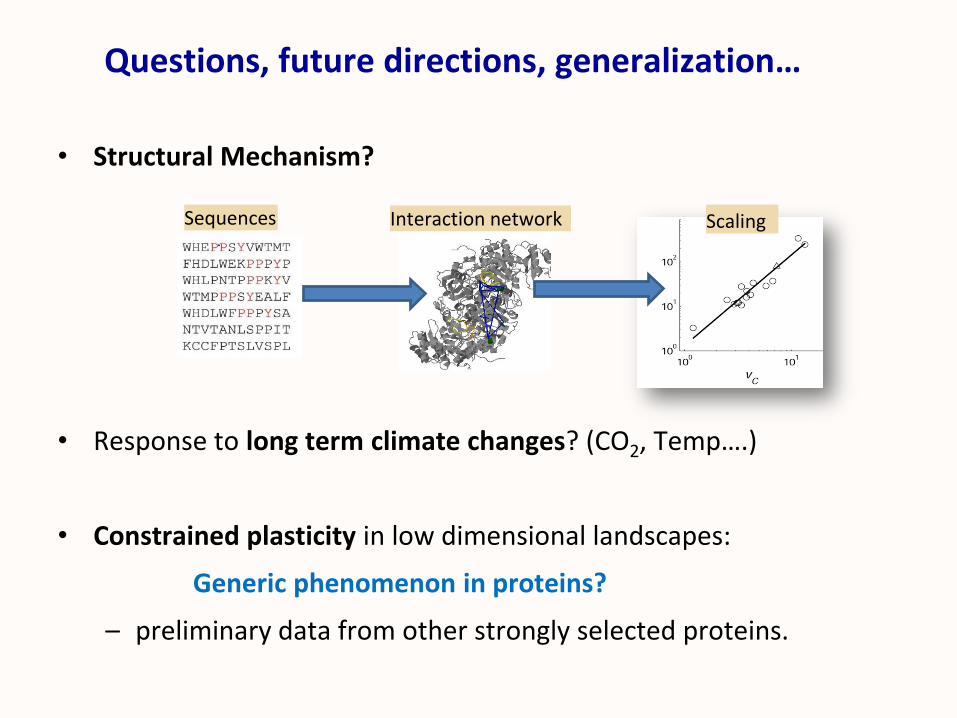
Questions, future directions, generalization…
• Structural Mechanism?
• Response to long term climate changes? (CO2, Temp….)
• Constrained plasticity in low dimensional landscapes:
Generic phenomenon in proteins?
– preliminary data from other strongly selected proteins.
ScalingInteraction networkSequences
Homologous Recombination
PhotosynthesisChromosome organization
ΦS M
Molecular codes (genetic code)
Examples: four essential living systems
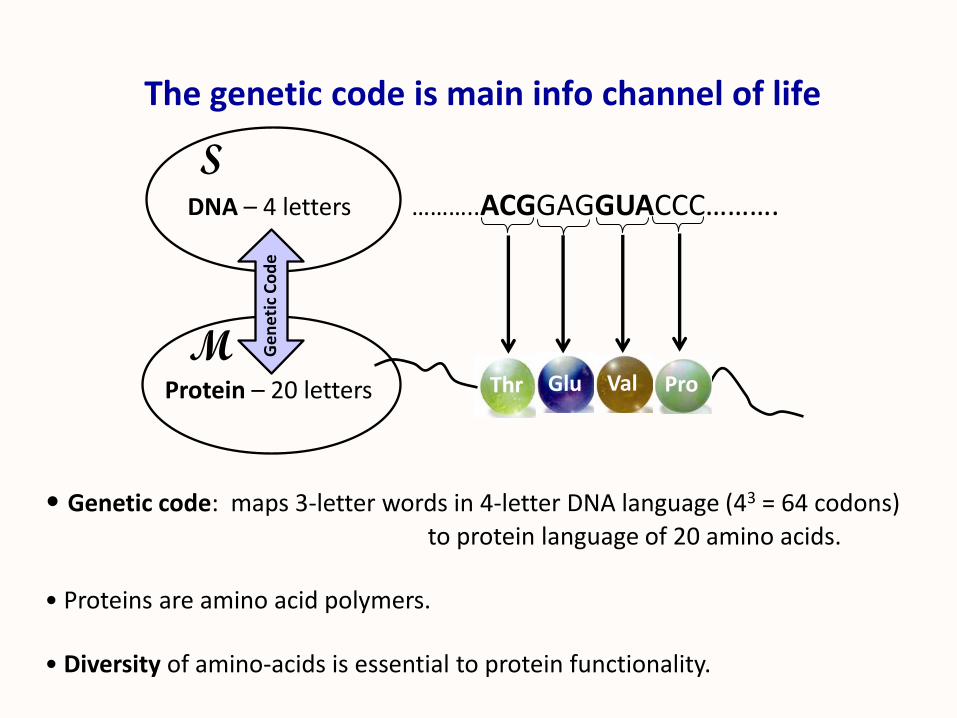
The genetic code is main info channel of life
• Genetic code: maps 3-letter words in 4-letter DNA language (43 = 64 codons)
to protein language of 20 amino acids.
• Proteins are amino acid polymers.
• Diversity of amino-acids is essential to protein functionality.
DNA – 4 letters ………..ACGGAGGUACCC……….
Protein – 20 letters Thr Glu Val Pro
Ge
net
icC
od
e
S
M
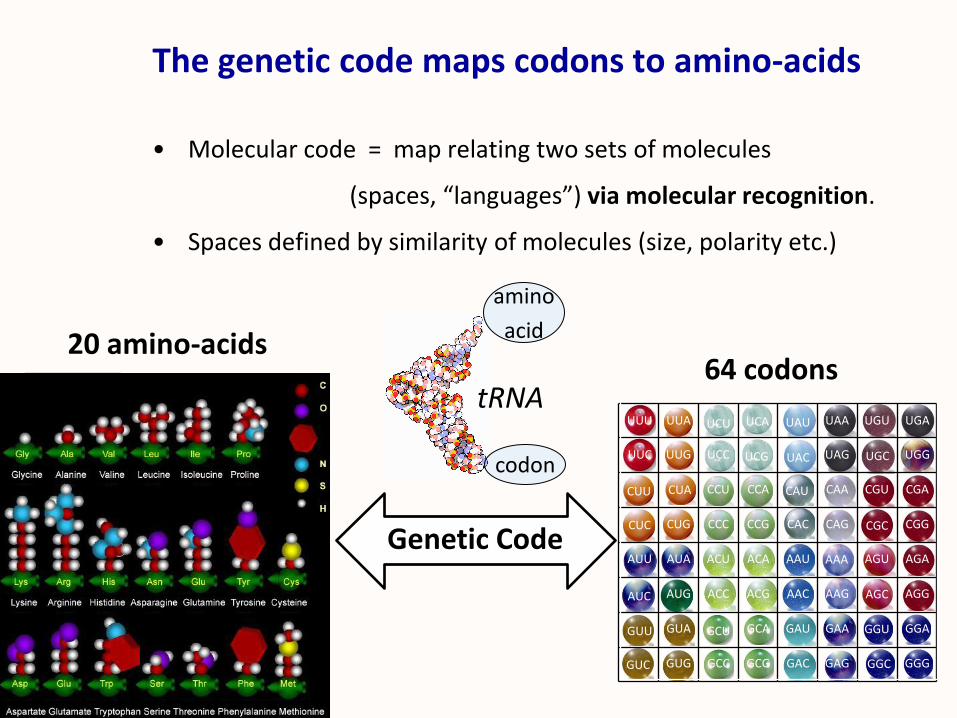
The genetic code maps codons to amino-acids
• Molecular code = map relating two sets of molecules
(spaces, “languages”) via molecular recognition.
• Spaces defined by similarity of molecules (size, polarity etc.)
64 codons20 amino-acids
Genetic Code
GGGGGCGAGGACGCGGCCGUGGUC
GGAGGUGAAGAUGCAGCUGUAGUU
AGGAGCAAGAACACGACCAUGAUC
AGAAGUAAAAAUACAACUAUAAUU
CGGCGCCAGCACCCGCCCCUGCUC
CGACGUCAACAUCCA CCU
UCAUCU
UGGUGCUAGUACUCGUCCUUGUUC
UGAUGUUAAUAU
CUACUU
UUAUUU
tRNA
amino
acid
codon
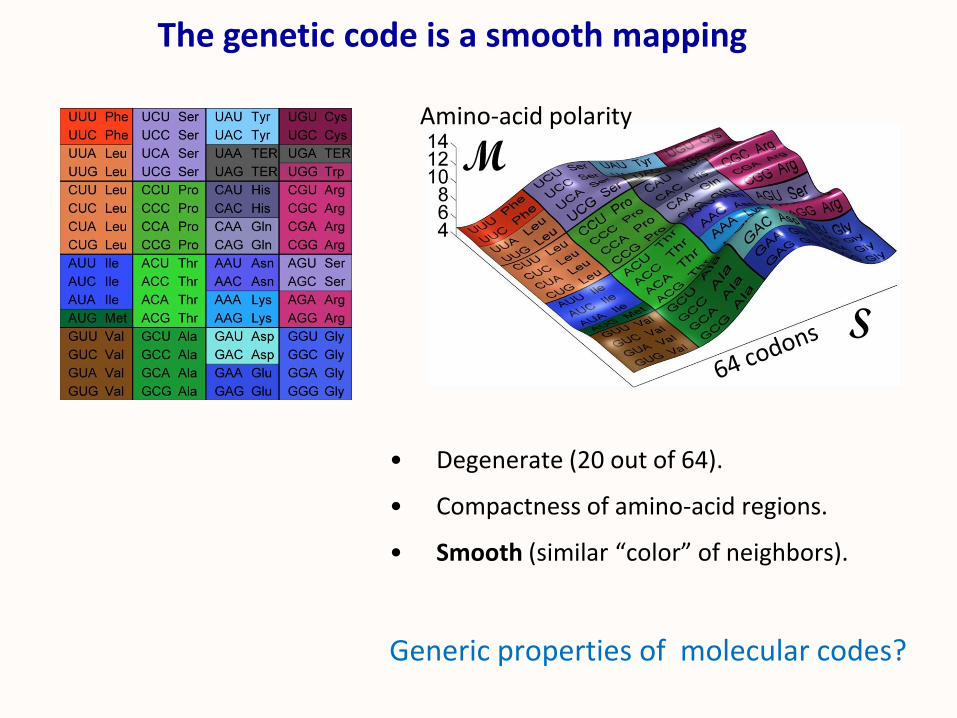
• Degenerate (20 out of 64).
• Compactness of amino-acid regions.
• Smooth (similar “color” of neighbors).
Generic properties of molecular codes?
The genetic code is a smooth mapping
Amino-acid polarity
S
M
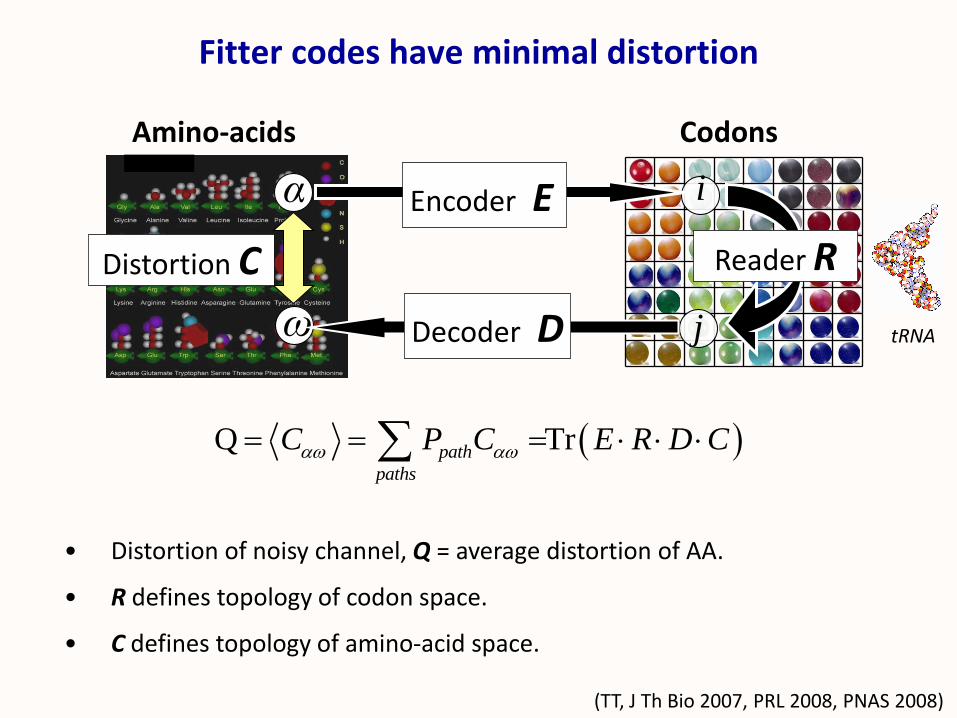
• Distortion of noisy channel, Q = average distortion of AA.
• R defines topology of codon space.
• C defines topology of amino-acid space.
Fitter codes have minimal distortion
Q Trpath
paths
C P C E R D C
,
CodonsAmino-acids
i
j
(TT, J Th Bio 2007, PRL 2008, PNAS 2008)
ω
α
tRNA
Encoder E
Decoder D
Reader RDistortion C
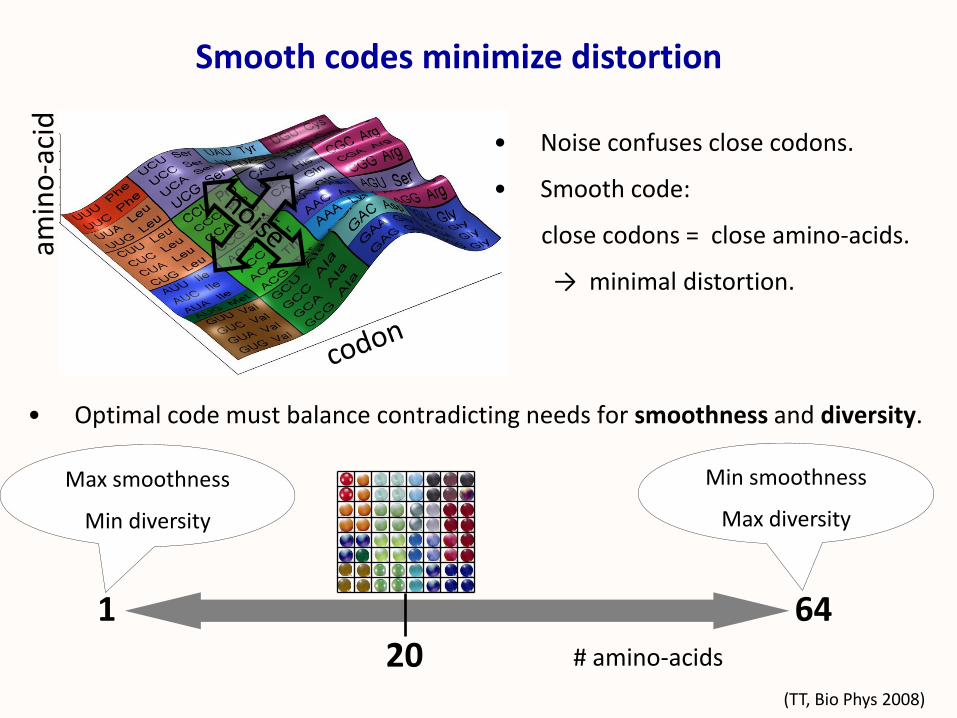
• Optimal code must balance contradicting needs for smoothness and diversity.
Smooth codes minimize distortionam
ino
-aci
d
• Noise confuses close codons.
• Smooth code:
close codons = close amino-acids.
→ minimal distortion.
20 # amino-acids
1 64
Max smoothness
Min diversity
Min smoothness
Max diversity
(TT, Bio Phys 2008)
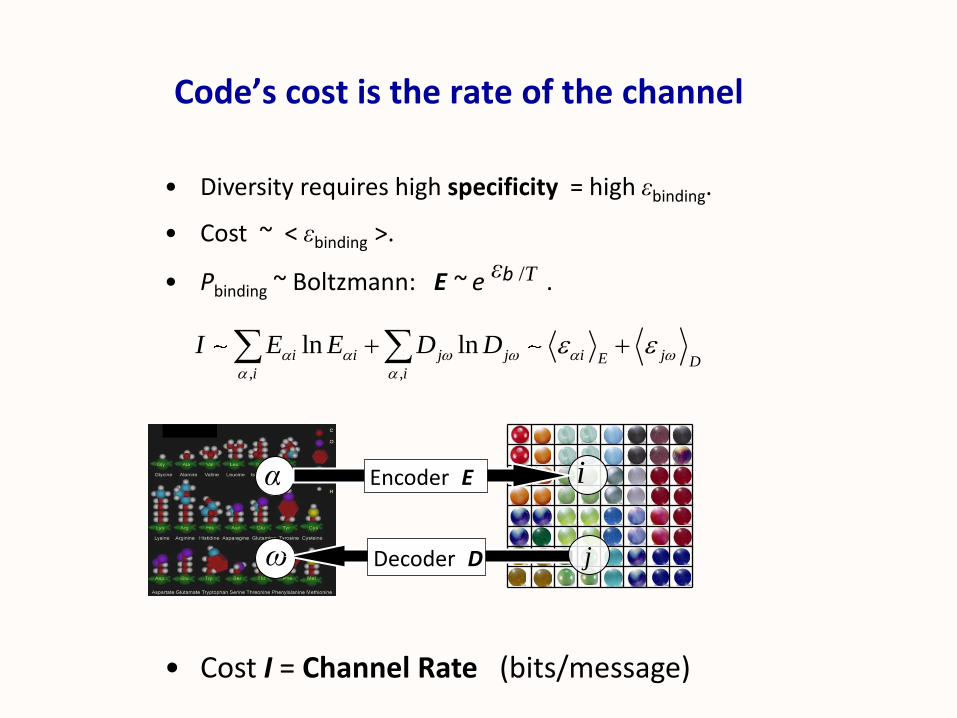
• Diversity requires high specificity = high εbinding.
• Cost ~ < εbinding >.
• Pbinding ~ Boltzmann: E ~ e εb /T .
• Cost I = Channel Rate (bits/message)
Code’s cost is the rate of the channel
, ,
ln lni i j j i jE Di i
I E E D D
α Encoder E
ω Decoder D j
i
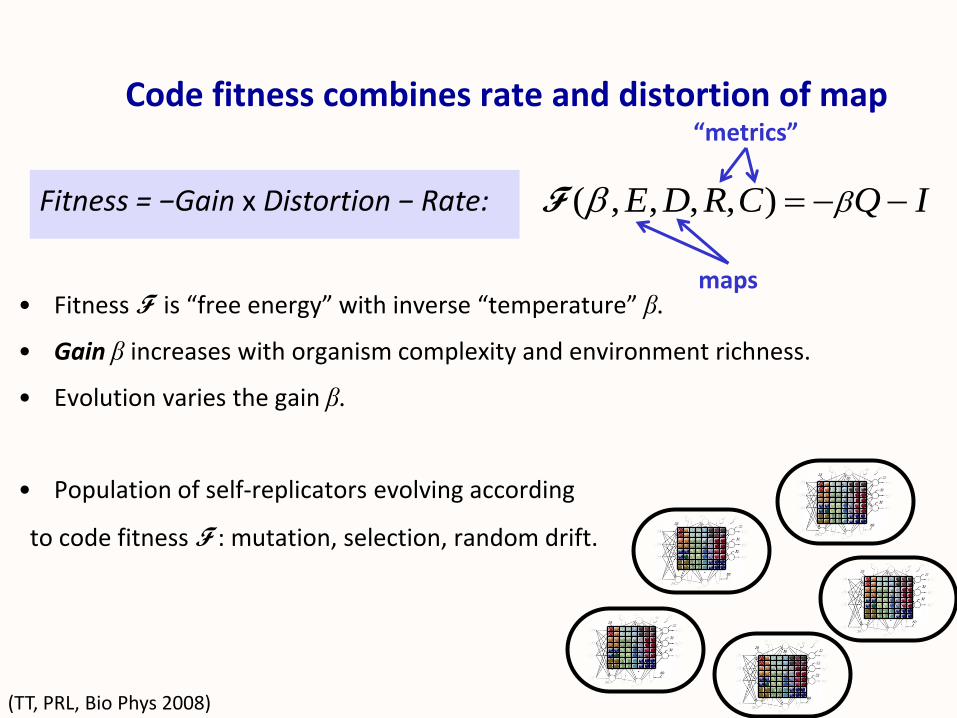
Code fitness combines rate and distortion of map
• Fitness F is “free energy” with inverse “temperature” β.
• Gain β increases with organism complexity and environment richness.
• Evolution varies the gain β.
• Population of self-replicators evolving according
to code fitness F : mutation, selection, random drift.
( , , , , )E D R C Q I FFitness = −Gain x Distortion − Rate:
(TT, PRL, Bio Phys 2008)
maps
“metrics”
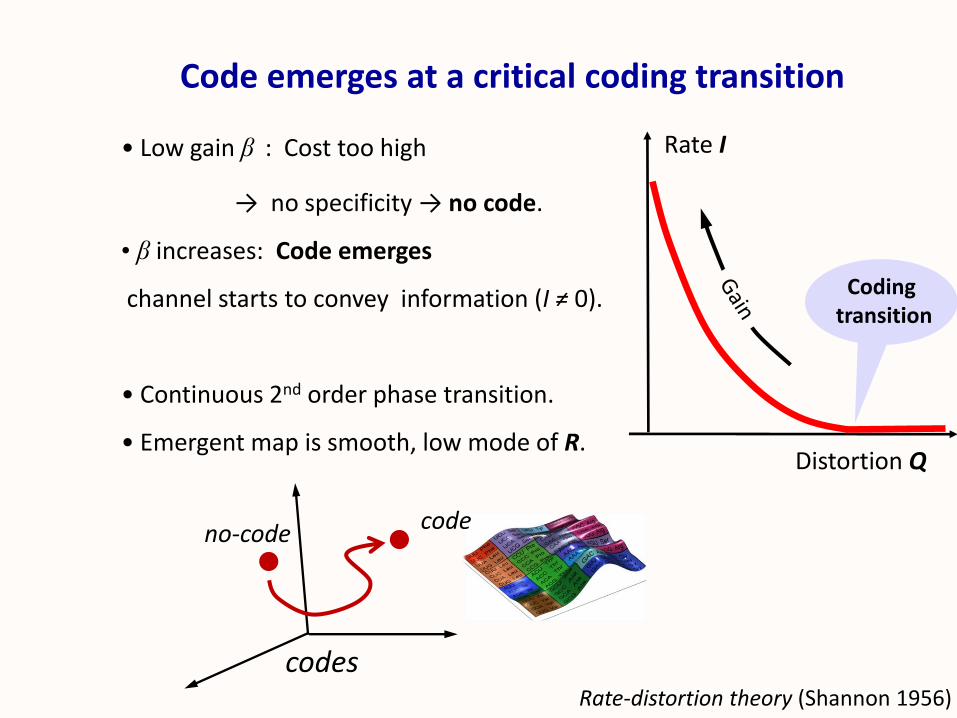
• Low gain β : Cost too high
→ no specificity → no code.
• β increases: Code emerges
channel starts to convey information (I ≠ 0).
• Continuous 2nd order phase transition.
• Emergent map is smooth, low mode of R.
Code emerges at a critical coding transition
Distortion Q
Rate I
Codingtransition
codes
no-code code
Rate-distortion theory (Shannon 1956)
AAA
AGA
AAG
CAA
ACA
AAT
AAC GAA
ATA
TAA
CCA
ACT
GAT
AGAC
ATC
TTA
TGA
AGG CAG
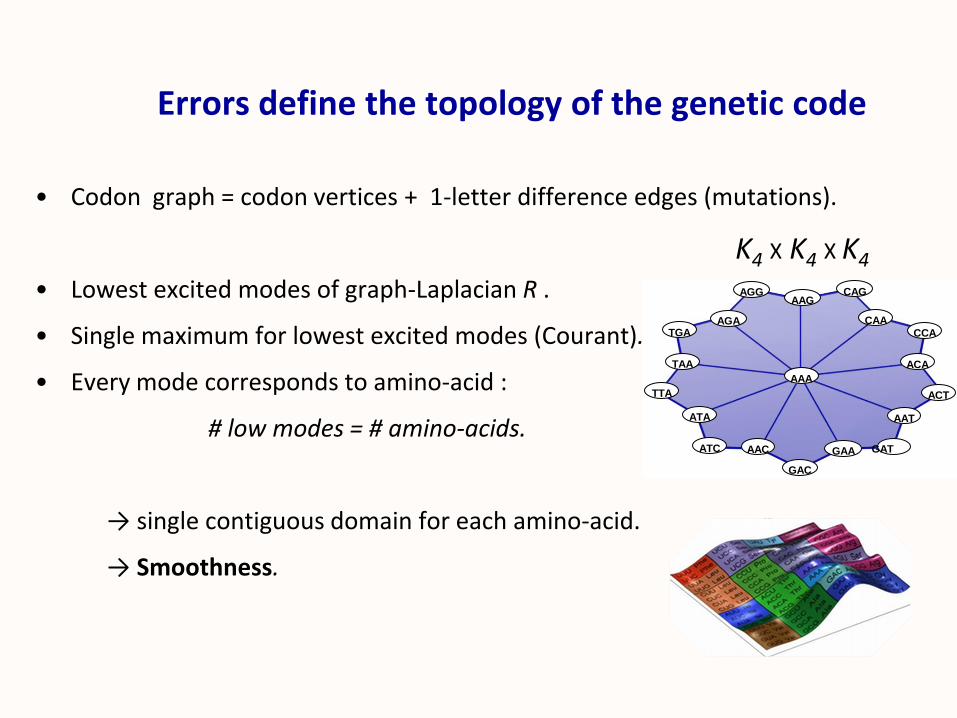
Errors define the topology of the genetic code
• Codon graph = codon vertices + 1-letter difference edges (mutations).
• Lowest excited modes of graph-Laplacian R .
• Single maximum for lowest excited modes (Courant).
• Every mode corresponds to amino-acid :
# low modes = # amino-acids.
→ single contiguous domain for each amino-acid.
→ Smoothness.
K4 X K4 X K4
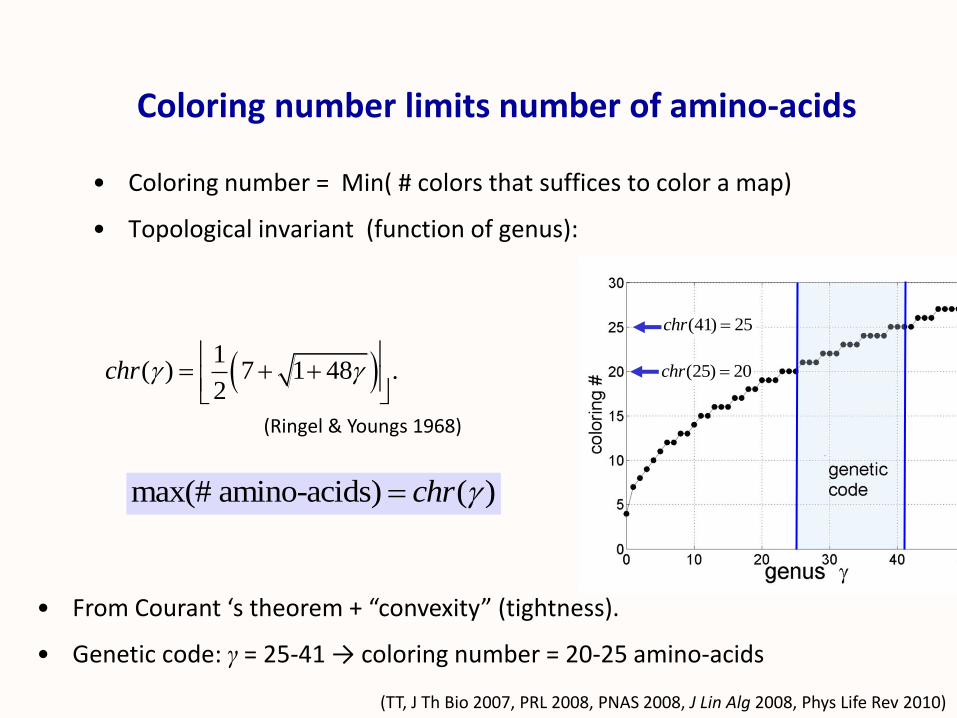
Coloring number limits number of amino-acids
• Coloring number = Min( # colors that suffices to color a map)
• Topological invariant (function of genus):
1( ) 7 1 48 .
2chr
max(# amino-acids) ( )chr
• From Courant ‘s theorem + “convexity” (tightness).
• Genetic code: γ = 25-41 → coloring number = 20-25 amino-acids
(41) 25chr
(25) 20chr
(Ringel & Youngs 1968)
(TT, J Th Bio 2007, PRL 2008, PNAS 2008, J Lin Alg 2008, Phys Life Rev 2010)
Molecular codes (genetic code)Homologous Recombination
Photosynthesis
ΦS M
Examples: four essential living systems
Chromosome organization
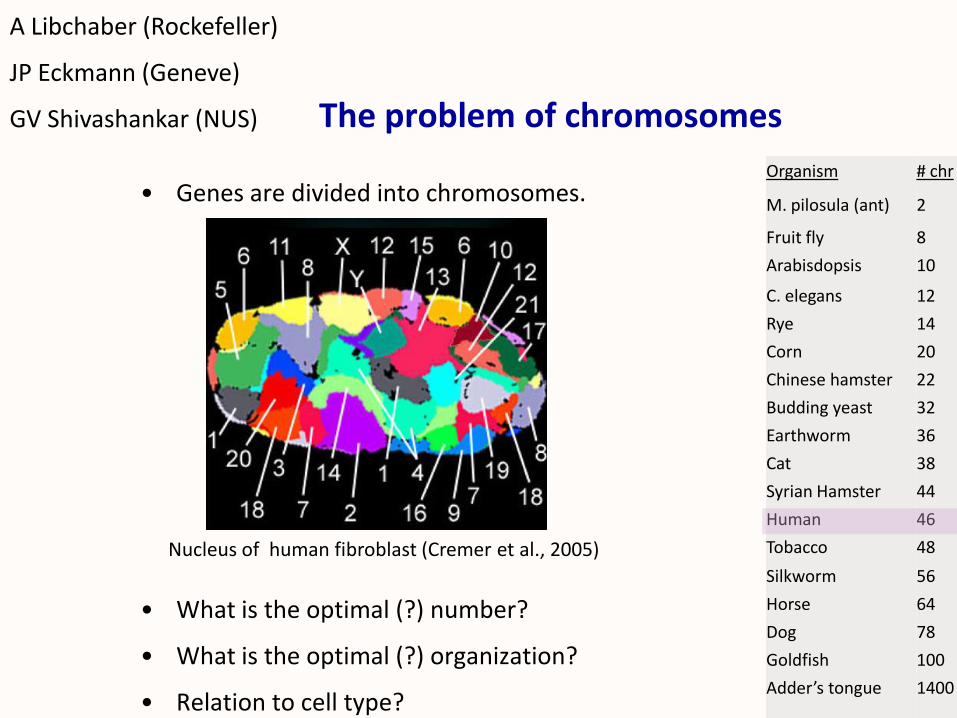
The problem of chromosomes
• Genes are divided into chromosomes.
• What is the optimal (?) number?
• What is the optimal (?) organization?
• Relation to cell type?
Organism # chr
M. pilosula (ant) 2
Fruit fly 8
Arabisdopsis 10
C. elegans 12
Rye 14
Corn 20
Chinese hamster 22
Budding yeast 32
Earthworm 36
Cat 38
Syrian Hamster 44
Human 46
Tobacco 48
Silkworm 56
Horse 64
Dog 78
Goldfish 100
Adder’s tongue 1400
Nucleus of human fibroblast (Cremer et al., 2005)
A Libchaber (Rockefeller)
JP Eckmann (Geneve)
GV Shivashankar (NUS)
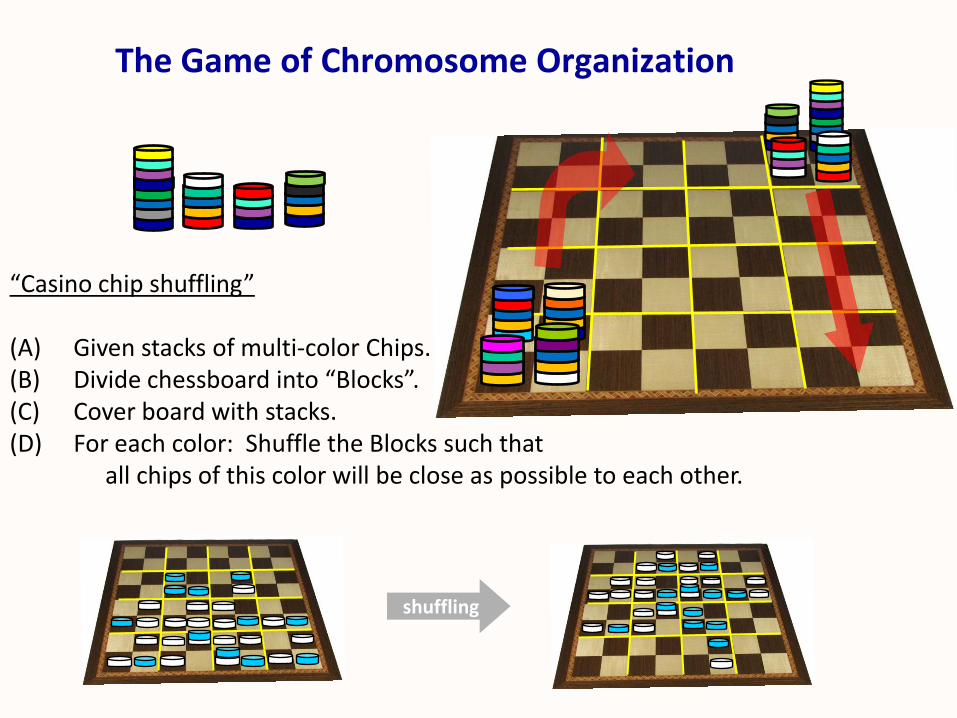
The Game of Chromosome Organization
“Casino chip shuffling”
(A) Given stacks of multi-color Chips.(B) Divide chessboard into “Blocks”.(C) Cover board with stacks. (D) For each color: Shuffle the Blocks such that
all chips of this color will be close as possible to each other.
shuffling
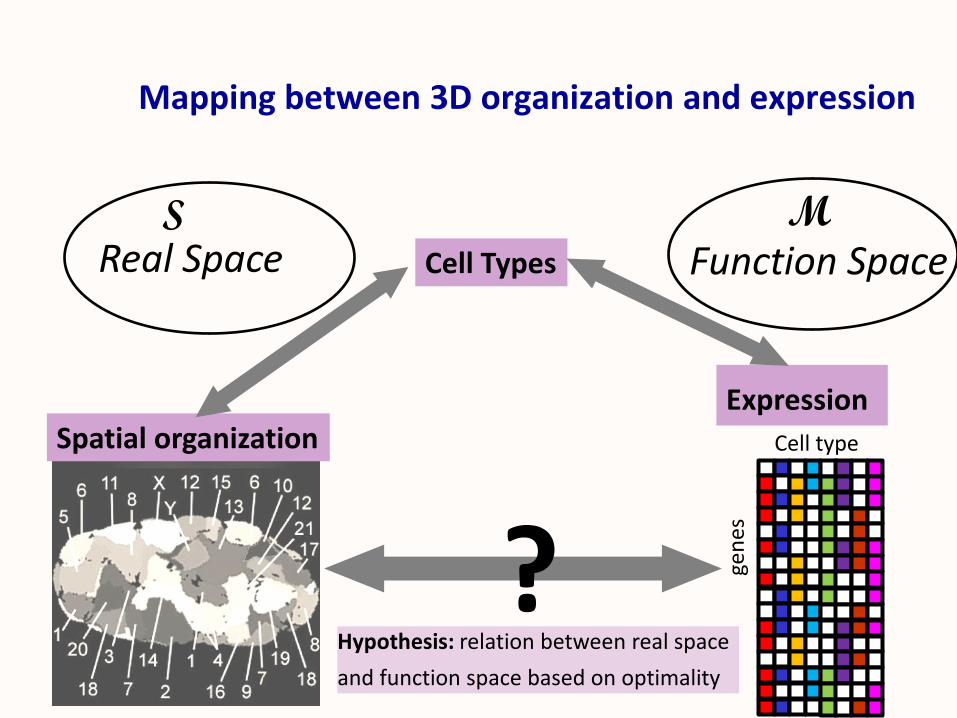
Mapping between 3D organization and expression
Cell Types
Spatial organizationExpression
Cell type
gen
es
?
Real Space Function Space
Hypothesis: relation between real space
and function space based on optimality
S M
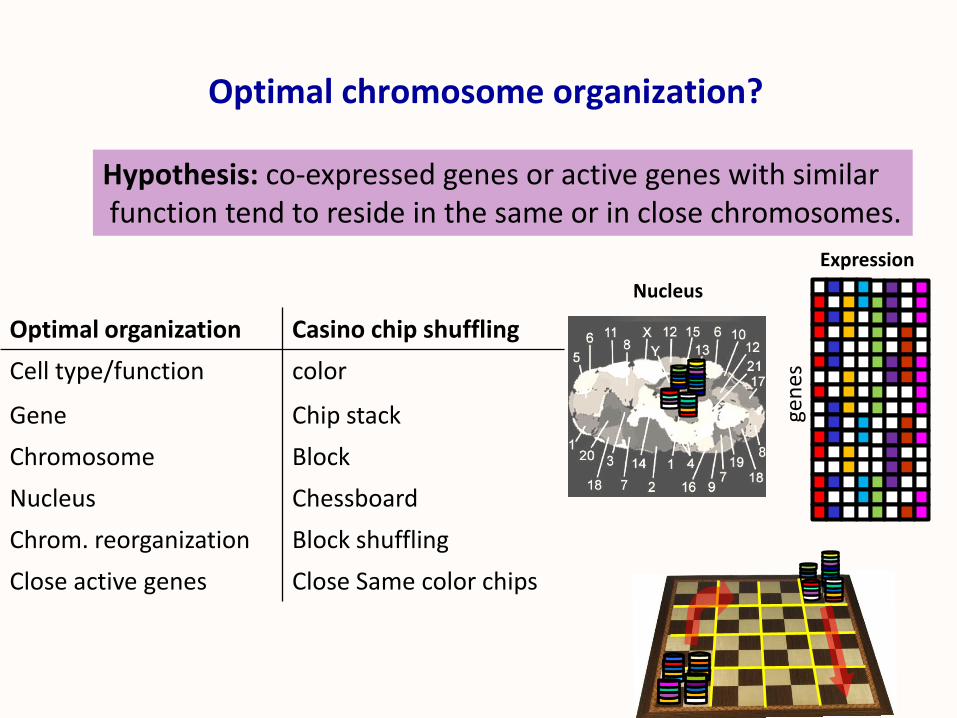
Optimal chromosome organization?
Hypothesis: co-expressed genes or active genes with similarfunction tend to reside in the same or in close chromosomes.
Optimal organization Casino chip shuffling
Cell type/function color
Gene Chip stack
Chromosome Block
Nucleus Chessboard
Chrom. reorganization Block shuffling
Close active genes Close Same color chips
Expression
Nucleus
gen
es
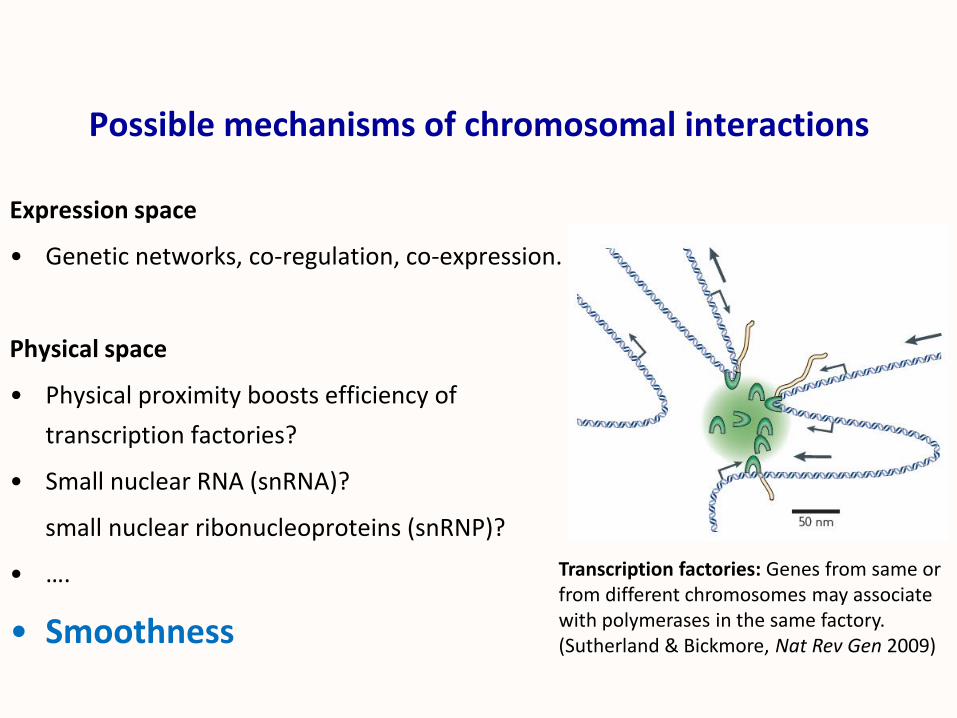
Possible mechanisms of chromosomal interactions
Expression space
• Genetic networks, co-regulation, co-expression.
Physical space
• Physical proximity boosts efficiency of
transcription factories?
• Small nuclear RNA (snRNA)?
small nuclear ribonucleoproteins (snRNP)?
• ….
• Smoothness
Transcription factories: Genes from same or from different chromosomes may associate with polymerases in the same factory.(Sutherland & Bickmore, Nat Rev Gen 2009)
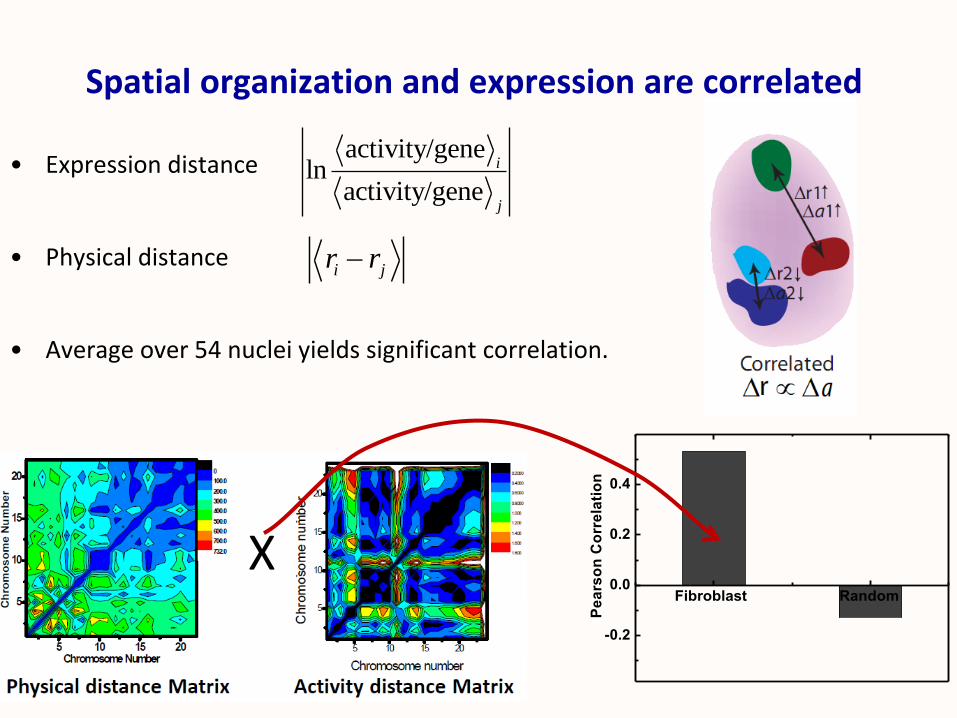
Spatial organization and expression are correlated
• Expression distance
• Physical distance
• Average over 54 nuclei yields significant correlation.
X
activity/geneln
activity/gene
i
j
i jr r
Fibroblast Random
-0.2
0.0
0.2
0.4
Pe
ars
on
Co
rre
lati
on
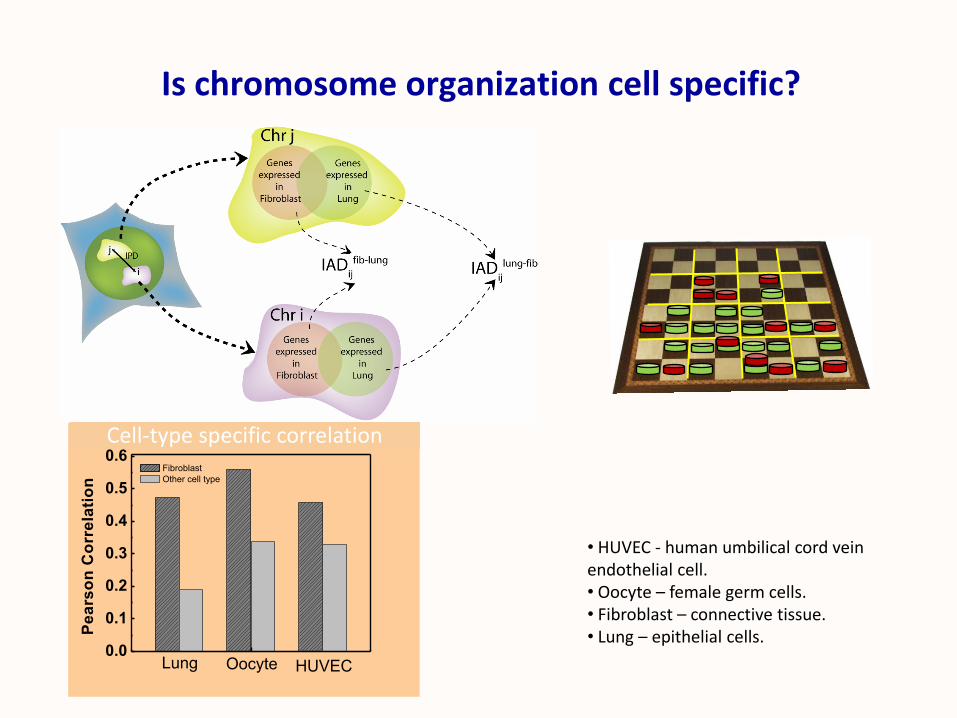
Is chromosome organization cell specific?
• HUVEC - human umbilical cord vein endothelial cell.• Oocyte – female germ cells.• Fibroblast – connective tissue. • Lung – epithelial cells.
0.0
0.1
0.2
0.3
0.4
0.5
0.6
Pe
ars
on
Co
rre
lati
on
Fibroblast
Other cell type
Lung Oocyte HUVEC
Cell-type specific correlation
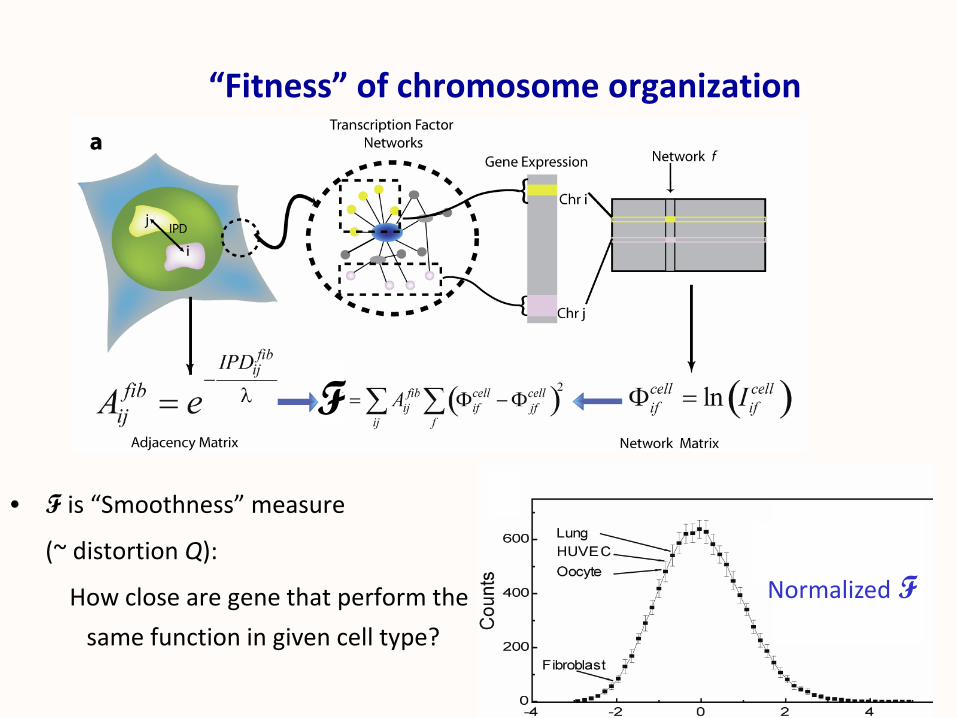
• F is “Smoothness” measure
(~ distortion Q):
How close are gene that perform the
same function in given cell type?
“Fitness” of chromosome organization
F
Normalized F
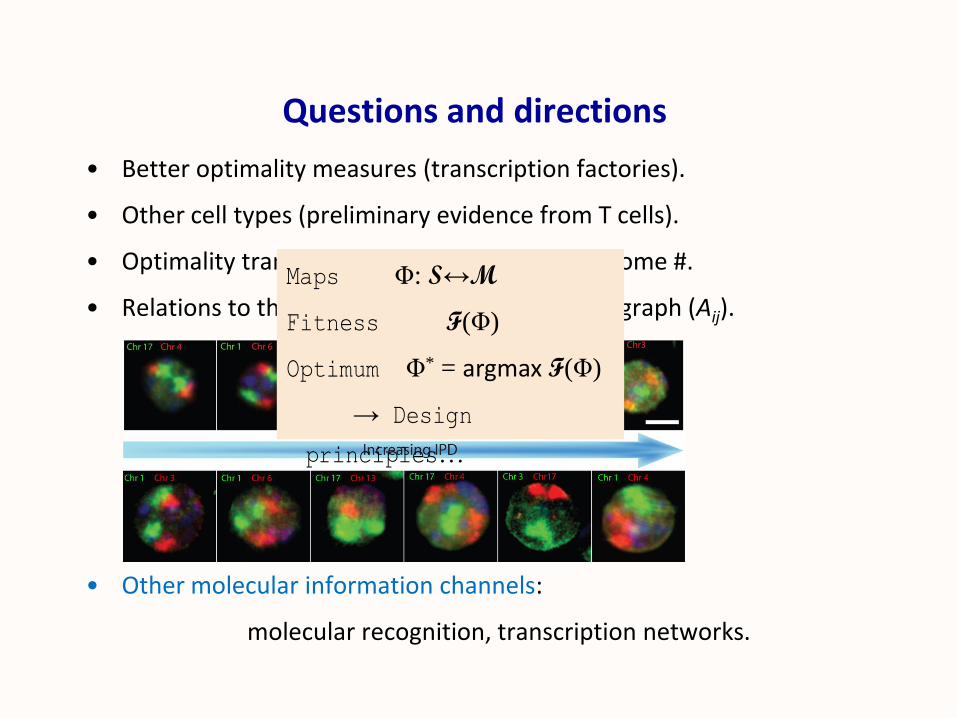
Questions and directions
• Better optimality measures (transcription factories).
• Other cell types (preliminary evidence from T cells).
• Optimality transition as a function of chromosome #.
• Relations to the topology of the chromosome graph (Aij).
• Other molecular information channels:
molecular recognition, transcription networks.
Maps Φ: S↔M
Fitness F(Φ)
Optimum Φ* = argmax F(Φ)
→ Design
principles…
THANKS
more: www.weizmann.ac.il\complex\tlusty