Photoluminescent π-Conjugated Polymer Nanoparticles ...
41
1 Influence of Surfactant Structure on Photoluminescent π-Conjugated Polymer Nanoparticles: Interfacial Properties and Protein Binding Laura Urbano a , Luke Clifton c , Hoi Ki Ku a , Hannah Kendall-Troughton a , Kalliopi-Kelli A. Vandera a , Bruno F.E. Matarese g , Thais Abelha a , Peixun Li c , Tejal Desai b , Cécile A. Dreiss a , Robert D. Barker d , Mark A. Green e , Lea Ann Dailey* f , Richard D. Harvey f KEYWORDS Conjugated polymer nanoparticles, protein corona, PEG, surfactants, albumin binding ABSTRACT Π-conjugated polymer nanoparticles (CPNs) are under investigation as photoluminescent agents for diagnostics and bioimaging. To determine whether the choice of surfactant can improve CPN properties and prevent protein adsorption, five non-ionic polyethylene glycol alkyl ether surfactants were used to produce CPNs from three representative π-conjugated polymers. The surfactant structure did not influence size or yield, which were dependent on the nature of the
Transcript of Photoluminescent π-Conjugated Polymer Nanoparticles ...
1
Influence of Surfactant Structure on
Photoluminescent π-Conjugated Polymer
Nanoparticles: Interfacial Properties and Protein
Binding
Laura Urbanoa, Luke Cliftonc, Hoi Ki Kua, Hannah Kendall-Troughtona, Kalliopi-Kelli A.
Vanderaa, Bruno F.E. Matareseg, Thais Abelhaa, Peixun Lic, Tejal Desaib, Cécile A. Dreissa,
Robert D. Barkerd, Mark A. Greene, Lea Ann Dailey*f, Richard D. Harveyf
KEYWORDS
Conjugated polymer nanoparticles, protein corona, PEG, surfactants, albumin binding
ABSTRACT
Π-conjugated polymer nanoparticles (CPNs) are under investigation as photoluminescent agents
for diagnostics and bioimaging. To determine whether the choice of surfactant can improve CPN
properties and prevent protein adsorption, five non-ionic polyethylene glycol alkyl ether
surfactants were used to produce CPNs from three representative π-conjugated polymers. The
surfactant structure did not influence size or yield, which were dependent on the nature of the
2
conjugated polymer. Hydrophobic interaction chromatography, contact angle, quartz crystal
microbalance and neutron reflectivity studies were used to assess the affinity of the surfactant to
the conjugated polymer surface, and indicated that all surfactants were displaced by the addition
of a model serum protein. In summary, CPN preparation methods which rely on surface coating
of a conjugated polymer core with amphiphilic surfactants may produce systems with good yields
and colloidal stability in vitro, but may be susceptible to significant surface alterations in
physiological fluids.
3
INTRODUCTION
Conjugated polymer nanoparticles (CPNs) show promise as highly biocompatible optical
imaging systems, and have been the object of exploration for numerous biological applications1–6.
The preparation conditions can influence several parameters, including particle size, particle size
distribution, percentage product yield, colloidal stability, and optical properties6–8. Therefore, the
choice of production method and stabilizing excipients used is central to performance optimization
and industrial scale-up of CPNs. One of the major shortcomings in this rapidly expanding field is
the lack of published information regarding the impact of post-synthetic CPN fabrication
techniques on the final product. Much of the information on this topic is dispersed in the literature
and restricted to very specific polymers/formulations. Information, such as nanoparticle yield
values and optical stability, and the rationale behind the choice of production conditions are rarely
reported. When such values are published, they reveal major shortcomings, or at best a great
variability in current preparation techniques for CPNs9,10.
Another important issue insufficiently addressed in the literature is the stability of CPNs in
biological media. Currently, many studies investigating CPNs for bioimaging purposes utilize
core-shell nanoparticle systems, comprised of a conjugated polymer core surrounded by a shell of
adsorbed surfactant molecules that promotes colloidal stability of the particles, and is occasionally
further functionalized with a targeting moiety11–13,9. However, surface coatings which rely on
hydrophobic interactions between the conjugated polymer and the surfactant, can be destabilized
in biological fluids. Plasma proteins can easily displace a proportion of the surfactant from the
particle surface forming a protein corona14,15, thus compromising CPN functionality when
introduced into a biological environment. Hence, it is important to study the interactions of
4
surfactant chemistries used to coat CPN surfaces, to determine whether the stability of the coating
layer can be enhanced in the presence of biological fluids.
The aim of this study was to perform a systematic investigation to determine whether surfactant
structure can influence CPN properties and protein binding using three representative conjugated
polymers: F8BT, CN-PPV and PCPDTBT. The polymers were chosen either due to their high
quantum yield values (F8BT, CN-PPV) or their broad absorption/emission spectra (PCPDTBT)16–
19. Instead of comparing the widely disparate surfactant structures reported in the literature, a series
of high purity polyethylene glycol alkyl ether (CxEy) surfactants were chosen as model surfactants
to systematically investigate the impact of i) the lipophilic component of the surfactant (alkyl chain
length: C12-C18), ii) the hydrophilic component (PEG chain length: E6-E100) and/or iii) the overall
hydrophilic:lipophilic ratio (hydrophilic-lipophilic balance, HLB, values: 11.7-18.0) on the CPN
properties (Figure 1). CPNs were produced according to a modified nanoprecipitation method20
using 1 mM surfactant. The resulting percentage product yield, particle size distribution, optical
properties and protein binding of the systems were evaluated. Zeta potential, hydrodynamic
interaction chromatography (HIC), contact angle measurements, quartz crystal microbalance with
dissipation (QCM-D), and neutron reflectivity were employed to study the adsorption behaviour
and the formation of different interfacial structures of both surfactant and bovine serum albumin
(BSA) on the surface of the CPNs. BSA was chosen as a model protein, because of its abundance
in serum and its ability to interact with amphiphilic compounds of various nature21–25. Accordingly,
it was likely to interact easily with the PEGylated surfactants, competing with them to bind the
hydrophobic conjugated polymer forming the nanoparticle core. It was expected that surfactants
with higher lipophilicity (i.e. lower HLB value) would show a higher affinity to the hydrophobic
conjugated polymer core of the respective CPN systems, thus resulting in smaller nanoparticle
5
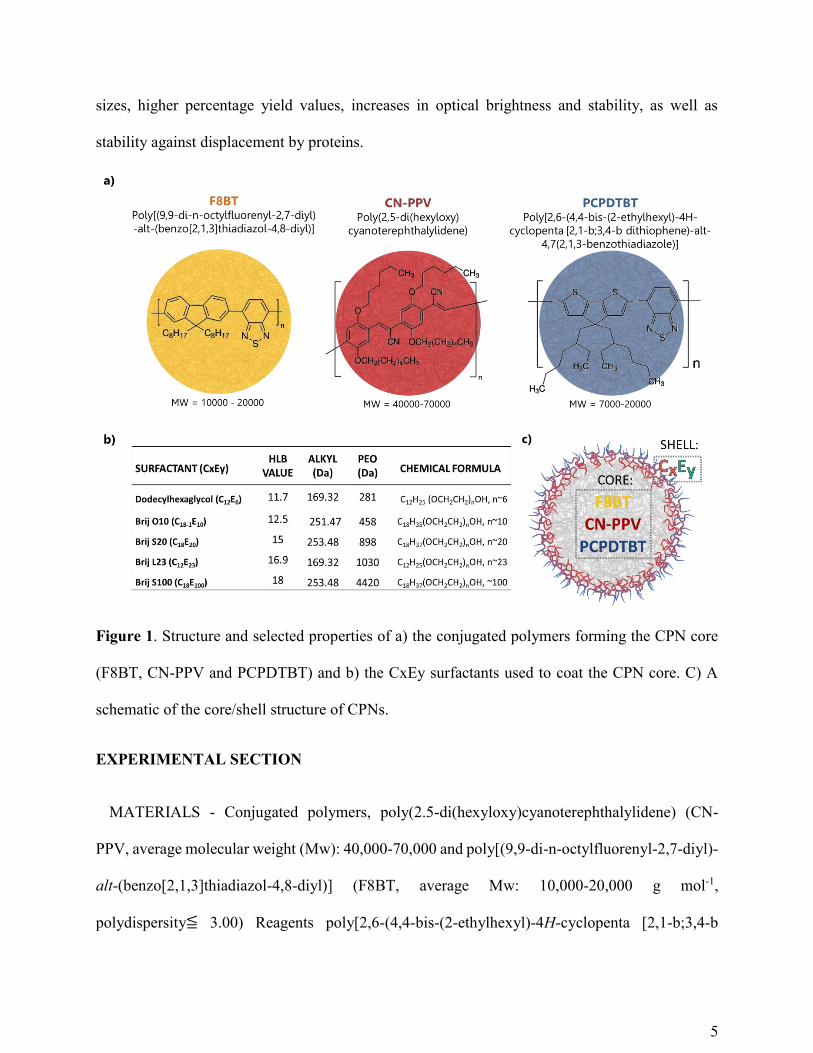
sizes, higher percentage yield values, increases in optical brightness and stability, as well as
stability against displacement by proteins.
Figure 1. Structure and selected properties of a) the conjugated polymers forming the CPN core
(F8BT, CN-PPV and PCPDTBT) and b) the CxEy surfactants used to coat the CPN core. C) A
schematic of the core/shell structure of CPNs.
EXPERIMENTAL SECTION
MATERIALS - Conjugated polymers, poly(2.5-di(hexyloxy)cyanoterephthalylidene) (CN-
PPV, average molecular weight (Mw): 40,000-70,000 and poly[(9,9-di-n-octylfluorenyl-2,7-diyl)-
alt-(benzo[2,1,3]thiadiazol-4,8-diyl)] (F8BT, average Mw: 10,000-20,000 g mol-1,
polydispersity≦ 3.00) Reagents poly[2,6-(4,4-bis-(2-ethylhexyl)-4H-cyclopenta [2,1-b;3,4-b
6
dithiophene)-alt-4,7(2,1,3-benzothiadiazole)] (PCPDTBT; Mw: 7,000-20,000 g mol-1) were
purchased from Sigma-Aldrich (UK). Polyoxyethylene (23) lauryl ether (Brij® S100, C12E100,
Mw: 1,198 g mol-1, Brij® L23 solution, C12E23, 30% (W/V) in H2O, Mw: 1,198 g mol-1, HLB
16.9), polyoxyethylene (20) stearyl ether (Brij® S20, C18E20, Mw: 1,150 g mol-1, HLB 15.3) and
polyoxyethylene (10) oleyl ether (Brij® O10, C18-1E10, Mw: 709 g mol-1, HLB 12.4), hexaethylene
glycol monododecyl ether (C12E6, HLB 11.6, Mw: 450.65 g mol-1), albumin from bovine serum
(fraction V, essentially protease free, ≥92% (GE)) and tetrahydrofuran (THF RegentPlus®,
≥99+%) were purchased from Sigma-Aldrich Corporation (UK). The d25C12E6 and C18E20
surfactants used for neutron reflectometry studies, were custom synthesized by the ISIS
Deuteration Facility at the Rutherford Appleton Laboratory (Science and Technology Facilities
Council, UK).
Surfactant characterisation
The adsorption of surfactants at the air-water surface was assessed by measuring the surface
pressure. A Langmuir trough (NIMA Technologies Ltd., Coventry, UK) equipped with a calibrated
NIMA PS4 pressure sensor and a Wilhelmy plate (Whatman, grade 1, chromatographic paper),
connected to a controlling computer with the NIMA IU4 interface unit software was used. For all
the experiments a PFA petri dish (Chemware®, Chemfluor® PFA, Petri Dish, Saint-Gobain
Performance Plastics, D1069544, Batch # G664) with diameter 50 mm, height 10 mm and volume
capacity 20 mL was placed over a magnetic stirring plate on the PTFE Langmuir trough top
surface. A subphase free from dust and contaminants (ultra-pure water, 18.2 MΩ⋅cm) was poured
into the petri dish and a clean Wilhelmy plate was suspended from the meter arm of the Langmuir
trough and submerged into the subphase. Each surfactant solution was injected (100 mL of 1 mg
mL-1) in the subphase while stirring. The adsorption of the drug on the surface causes changes in
7
surface pressure which are recorded over time under a constant surface area (21.3 A2 m-1) at 23°C.
Each sample was run in triplicate (n=3) and the changes in surface pressure were plotted against
time (P&A-Time isotherm). The P-Time isotherm was fitted with a sigmoidal model (Hill plot
with 3 parameters) using SigmaPlot 13.0 software in order to analyse the kinetics of the process.
The model is described by
Equation 1: 𝑓(𝑥) =𝛱∗𝑥𝑏
𝑡50%𝑏+𝑥𝑏
where Π is the maximum surface pressure reached at the plateau, b is the Hill coefficient of
sigmoidicity (hill slope at its midpoint) and t50% is the time for which 50% of maximum pressure
is obtained.
CPN production
Nanoparticles were produced via a modified nanoprecipitation method. Stock solutions of F8BT,
CN-PPV and PCPDTBT (1.5 mg mL-1) were prepared in THF. Aqueous surfactant dispersions
(C12E100, C12E23, C18E20, C18-1E10, C12E6; 1mM, 30 mL) were prepared and stirred for 10 minutes
prior to use. The polymer stock solution (1 mL) was added dropwise to the surfactant dispersion
whilst stirring, sonicated in an ultrasonic bath at 44Hz for 90 seconds (XUBA3 Ultrasonic bath
Grant, UK) remove incompletely formed and unstable aggregates, and to facilitate evaporation of
organic solvent present in nanosuspension26. Suspensions were further stirred overnight for
complete evaporation of the THF. Volumes were re-adjusted to 30 mL with distilled water prior
to use and CPN suspensions were stored at 4°C.
Dynamic light scattering
The average hydrodynamic diameter was measured (n=3 replicates) by dynamic light scattering
(DLS) using a Zetasizer Nano ZS (Malvern Instruments Ltd, Worcestershire, UK). Size was
8
measured at 25 °C, with backscatter detection at a measurement angle of 173° and a refractive
index of 1.59.
Percentage yield
The percentage yield was defined as the percentage of nanoparticles within a given batch with a
Stokes diameter < 500 nm. The threshold was chosen based on the extended definition of
nanoparticle size (limit 500 nm27). The Stokes diameter was chosen as an equivalent measure of
particle size, due to the ease of separating particles of different sizes based on sedimentation
velocity during centrifugation (see Supplementary Information for further details). Aliquots of
nanosuspension (1 mL; n=3 replicates for each formulation) were centrifuged at 5111g for 10
minutes (Heraeus™ Pico™ Microcentrifuge, Thermo Fisher Scientific, USA). The pellet and
supernatant were separated, and all samples were dried. THF (1mL) was added to each sample and
the concentration of conjugated polymer was determined using UV spectrophotometry (Lamba 2S,
Perkin Elmer Inc., USA). The percentage yield of nanoparticles with a Stoke’s diameter < 500 nm
(i.e. supernatant fraction) was calculated according to Equation 2:
Equation 2: 𝑃𝑒𝑟𝑐𝑒𝑛𝑡𝑎𝑔𝑒 𝑦𝑖𝑒𝑙𝑑 𝑜𝑓 𝑛𝑎𝑛𝑜𝑝𝑎𝑟𝑡𝑖𝑐𝑙𝑒𝑠 = [𝑆𝑢𝑝𝑒𝑟𝑛𝑎𝑡𝑎𝑛𝑡]
[𝑆𝑢𝑝𝑒𝑟𝑛𝑎𝑡𝑎𝑛𝑡]+[𝑝𝑒𝑙𝑙𝑒𝑡]× 100%
Photoluminescence and quantum yield
The photoluminescence of F8BT and CN-PPV CPN formulations (n=3 replicates) in water was
measured with a luminescence spectrometer (LS50B, PerkinElmer Ltd). F8BT and CN-PPV were
excited at 470 and 430 nm, respectively, and an emission scan was recorded from 500-800 nm
(ex/em slits 4 nm/4 nm). The photoluminescence of PCPDTBT CPN formulations (n=3 replicates)
in water was measured using a spectrofluorometer (Fluoromax-4, Horiba). PCPDTBT CPNs were
excited at 410, and an emission scan was recorded from 450-800 nm (ex/em slits 5 nm/5 nm). The
9
photoluminescence quantum yields (PLQYs) were measured using an absolute PLQY
spectrometer (C11347 Quantaurus-QY, Hamamatsu Photonics, Japan).
Hydrophobic interaction chromatography
Hydrophobic interaction chromatography28 was used to characterize surfactant affinity to the
conjugated polymer core, as well as protein adsorption to the particle surface using bovine serum
albumin (BSA) as a model protein. CPN suspensions (n = 3 individual batches) were prepared as
described above with either C12E6 or C18E20, and diluted to a concentration of 50 µg mL-1 in
distilled water with or without 1 mg mL-1 BSA then incubated for 1 hour at 37 °C. Non-particle
bound BSA and excess surfactant were removed by centrifugation, removal of the supernatant and
resuspension in PBS. The washing procedure was repeated twice. Suspensions (250 μL) were then
eluted with PBS through three different HiTrap™ substituted sepharose hydrophobic interaction
columns: butyl FF, phenyl FF (high substitution) and octyl FF (GE Healthcare Life Sciences, Little
Chalfont, UK). The eluent was collected in 8 fractions (1 mL) and analysed for particle content
via UV absorbance (SpectraMax 190, Molecular Devices, CA, USA; λ = 450 nm) 29. Particles
retained in the column were subsequently eluted using 1% Triton X-100, whereby the eluent was
collected in a further 8 fractions (1 mL). Absorbance values were plotted against elution volumes
and two area under the curve (AUC) values were calculated using Prism™ 6.0 software (Graphpad
Prism 5, CA, USA). The particle retention (%R) in each of the three columns was defined
according to Equation 3:
The HIC index value was calculated according to
Equation 4:
10
Whereby, 0.47, 0.94 and 2.05 represent the logP values of each column linker (butyl, phenyl and
octyl modified columns, respectively) as calculated using Marvin Sketch (version 5.5.0.1, Chem
Axon Limited). In the denominator, each logP value was multiplied by 100%, which represents
the theoretical case of 100% retention on each column achieved by a particle with maximum
hydrophobicity. HIC index values of 1.0 indicate maximum hydrophobicity and 0.0 minimum
hydrophobicity14.
Zeta potential
CPN suspensions were prepared as described above with either C12E6 or C18E20, diluted to a
concentration of 50 µg mL-1 in distilled water, with or without 1 mg/mL BSA, and incubated for
1 h at 37 °C. Non-particle bound BSA and excess surfactant were removed by centrifugation,
removal of the supernatant and resuspension in 5 mM NaCl. The washing procedure was repeated
two times. The zeta potential was measured (n=3 individual batches) using the Nanosizer in 5 mM
NaCl at 25 °C and Zetasizer Software 6.20 was used to analyse the data.
Contact angle measurements
Solutions of F8BT (2 mg/mL in chloroform), CN-PPV (2 mg/mL in chloroform), and PCPDTBT
(2 mg mL-1 in THF) were prepared for spin-coating of thin polymer films onto silicon wafers. Spin
coating was performed by flooding the wafer surface with polymer solution and rotating under a
nitrogen atmosphere at 4500 rpm (acc. 1500) for 30 s using a Süss MicroTec spin coater (Delta 6
RC TT, Süss MicroTec Lithography GmbH, Germany). The sessile droplet method was used to
measure the contact angle of six 10 µL droplets of purified water (18.2 MΩ) applied randomly
across a single thin film surface. The measures were performed over a total of 6 thin films (two
for each polymer) using a DP-M17 USB Digital Microscope (Conrad Electronics, UK). Three

11
films were subsequently submerged in 10 mL surfactant solution (1 mM C18E20, and C12E6,
respectively) and incubated at ambient room temperature for 15 minutes, followed by gentle
rinsing with purified water (5x) and drying under nitrogen prior to contact angle measurements of
six further 10 µL droplets of purified water. Surfactant-treated films were then submerged in 10
mL BSA solution (1 mg mL-1) and incubated at ambient room temperature for 15 minutes,
followed by gentle rinsing with purified water (5x) and drying under nitrogen prior to contact angle
measurements of six further 10 µL droplets of purified water. The contact angle was measured
based on image analysis, using ImageJ software with the plug-in Drop Shape Analysis based on
B-spline snakes algorithm30. Contact angle measurements were reported as the mean ± standard
deviation of n=6 droplets per film.
Quartz crystal microbalance
Conjugated polymer thin films were prepared by spin-coating onto gold-coated quartz crystals
(Q-Sense, Biolin Scientific, Stockholm, Sweden). Spin coating was performed as described above.
Quartz crystal microbalance with dissipation monitoring (QCM-D) experiments31 were conducted
on a Q-Sense E4 instrument (Q-Sense, Sweden). After stabilization of the baseline in deuterated
water, changes in resonant frequency Δf and energy dissipation ΔD were monitored as a function
of time using overtones 3 to 13 (15 to 65 MHz). Surfactant solution (d C12E6 or d C18E20, 1 mM)
was continuously injected in the chamber for 10 mins then allowed to adsorb for 5 min. The
chamber was then rinsed with D2O continuously injected for 10 mins and then allowed to rest for
5 min ensuring enough time for the F and D to stabilize. BSA solution 1 mg mL-1 was then injected
over for 10 mins then allowed to adsorb for 5 min. The chamber was then rinsed with D2O
continuously injected for 10 mins and then allowed to rest for 5 min ensuring enough time for the
F and D to stabilize Q-Tools software (Q-Sense AB, Gothenburg, Sweden) was used to analyse
12
the QCM data. For each condition, the experiments were repeated 3 times. The measurements were
found to be reproducible and a representative data set are presented.
Neutron reflectometry
Specular neutron reflectometry (NR) measurements were carried out using the white beam
INTER reflectometer32 at the Rutherford Appleton Laboratory (Oxfordshire, UK), employing
neutron wavelengths from 1.5 to 16 Å. The reflected intensity was measured at two glancing
angles, being 0.7° and 2.3°, as a function of the momentum transfer, Qz (Qz = (4π sin θ)/λ where
λ is wavelength and θ is the incident angle). This yielded data over a Qz range of ~0.01 to 0.3 Å-
1 with a resolution (dQ/Q) of 3.5% and a total illuminated length of 60 mm.
The samples were prepared by spin-coating F8BT polymer onto the polished surfaces of cleaned
50 × 100 × 10 mm silicon substrates (Crystran Ltd, Poole, UK). The surface of each substrate was
flooded with a 0.2% w/v solution of F8BT in chloroform and spun at 3000 rpm for 30 s under
vacuum. The resultant coated substrates were then secured into flow cells purpose built for analysis
of silicon-liquid interfaces, which were placed on a variable-angle sample stage in the NR
instrument. The inlets to the flow cells were connected to a liquid chromatography pump (L7100
HPLC pump, Merck, Hitachi) which allowed for easy exchange of the solution isotopic contrast
within each (3 mL volume) solid-liquid sample cell.
Three F8BT-coated silicon substrates were prepared, which were all characterised by NR in
three different solvent contrasts; D2O, H2O and silicon-matched water (SMW, a mixture of 62%
H2O and 38% D2O). One sample was exposed (via the HPCL pump) to a 1 mg mL-1 solution of
BSA in D2O and incubated for 1 hour, prior to flushing of the excess BSA and NR measurement.
The further two samples were first exposed to 1 mM surfactant solutions (either d25C12E6 or
C18C20) in H2O and incubated for 1 hour, prior to flushing of the excess surfactant and NR

13
measurement. The surfactant-coated F8BT samples were subsequently incubated with BSA (1 h)
before flushing of the excess protein and final NR measurements. After the initial characterisation
of the polymer films, four solvent contrasts were used; D2O, H2O, SMW and polymer-matched
water (PMW, a mixture of 76% H2O and 24% D2O with a scattering length density of 1.106 × 10-
6 Å-2, based on an estimated SLD for F8BT). All measurements were carried out at ambient
temperature (298 K).
The NR data were analysed using the in-house software, RasCal (A. Hughes, ISIS Spallation
Neutron Source, Rutherford Appleton Laboratory) which employs an optical matrix formalism
(described in detail by Born and Wolf33) to fit Abeles layer models to the interfacial structure. In
this approach the interface is described as a series of slabs, each of which is characterised by its
scattering length density (SLD), thickness and roughness, where the roughness parameter is
applied as a Gaussian smearing across the interface. The reflectivity for the model starting point
is then calculated and compared with the experimental data. A least squares minimisation is used
to adjust the fit parameters to reduce the differences between the model reflectivity and the data.
In all cases the simplest possible model (i.e. least number of layers), which adequately described
the data, was selected.
Statistics
Statistical analyses were conducted using Graph Pad Prism (San Diego, CA). p < 0.05 were
considered significant: * <0.05, ** <0.01, *** <0.001.
Results and Discussion
Effect of surfactant structure on CPN properties
Prior to their use in nanoparticle preparation, the five CxEy surfactants chosen for study (HLB:
11-18) were characterised with regard to their adsorption behaviour at the air-water interface using
14
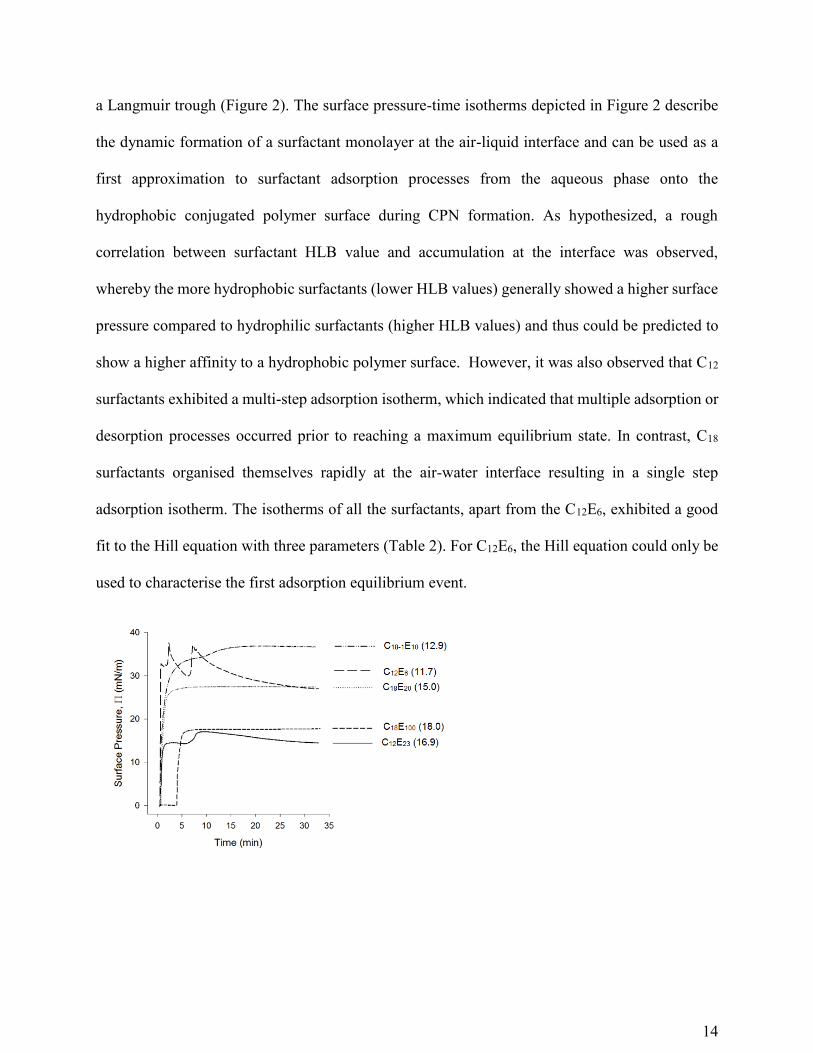
a Langmuir trough (Figure 2). The surface pressure-time isotherms depicted in Figure 2 describe
the dynamic formation of a surfactant monolayer at the air-liquid interface and can be used as a
first approximation to surfactant adsorption processes from the aqueous phase onto the
hydrophobic conjugated polymer surface during CPN formation. As hypothesized, a rough
correlation between surfactant HLB value and accumulation at the interface was observed,
whereby the more hydrophobic surfactants (lower HLB values) generally showed a higher surface
pressure compared to hydrophilic surfactants (higher HLB values) and thus could be predicted to
show a higher affinity to a hydrophobic polymer surface. However, it was also observed that C12
surfactants exhibited a multi-step adsorption isotherm, which indicated that multiple adsorption or
desorption processes occurred prior to reaching a maximum equilibrium state. In contrast, C18
surfactants organised themselves rapidly at the air-water interface resulting in a single step
adsorption isotherm. The isotherms of all the surfactants, apart from the C12E6, exhibited a good
fit to the Hill equation with three parameters (Table 2). For C12E6, the Hill equation could only be
used to characterise the first adsorption equilibrium event.
15
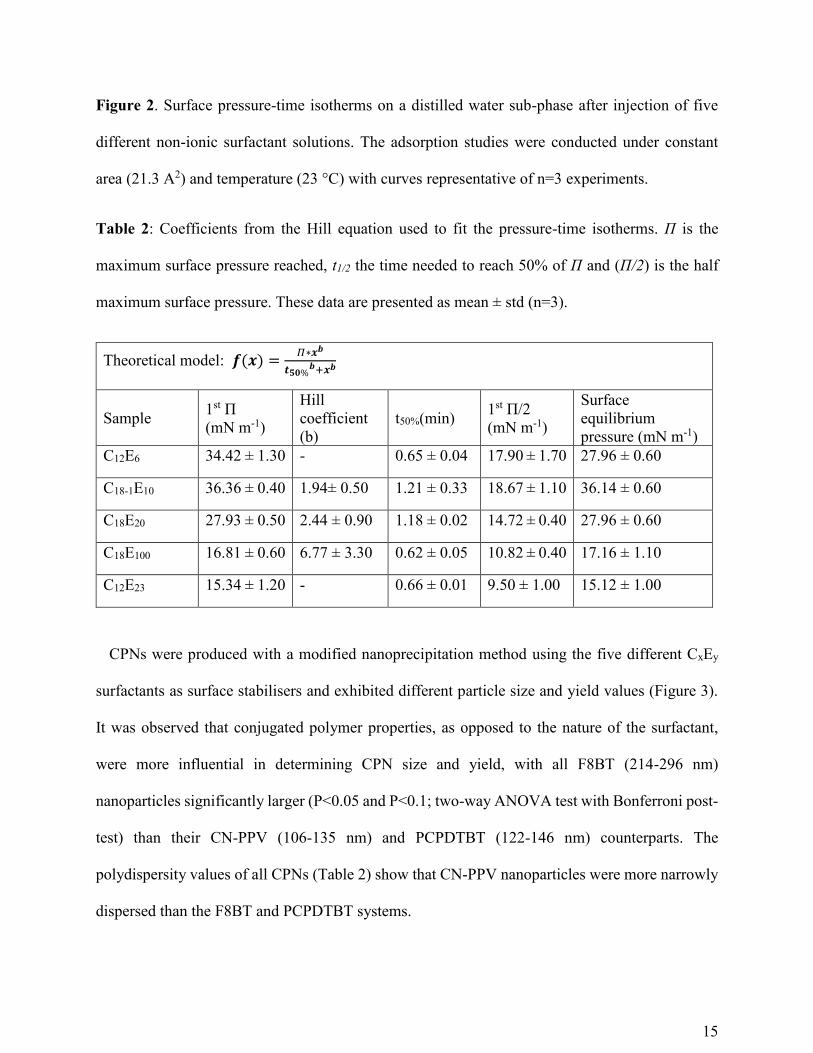
Figure 2. Surface pressure-time isotherms on a distilled water sub-phase after injection of five
different non-ionic surfactant solutions. The adsorption studies were conducted under constant
area (21.3 A2) and temperature (23 °C) with curves representative of n=3 experiments.
Table 2: Coefficients from the Hill equation used to fit the pressure-time isotherms. Π is the
maximum surface pressure reached, t1/2 the time needed to reach 50% of Π and (Π/2) is the half
maximum surface pressure. These data are presented as mean ± std (n=3).
Theoretical model: 𝒇(𝒙) =𝛱∗𝒙𝒃
𝒕𝟓𝟎%𝒃+𝒙𝒃
Sample 1st Π
(mN m-1)
Hill
coefficient
(b)
t50%(min) 1st Π/2
(mN m-1)
Surface
equilibrium
pressure (mN m-1)
C12E6 34.42 ± 1.30 - 0.65 ± 0.04 17.90 ± 1.70 27.96 ± 0.60
C18-1E10 36.36 ± 0.40 1.94± 0.50 1.21 ± 0.33 18.67 ± 1.10 36.14 ± 0.60
C18E20 27.93 ± 0.50 2.44 ± 0.90 1.18 ± 0.02 14.72 ± 0.40 27.96 ± 0.60
C18E100 16.81 ± 0.60 6.77 ± 3.30 0.62 ± 0.05 10.82 ± 0.40 17.16 ± 1.10
C12E23 15.34 ± 1.20 - 0.66 ± 0.01 9.50 ± 1.00 15.12 ± 1.00
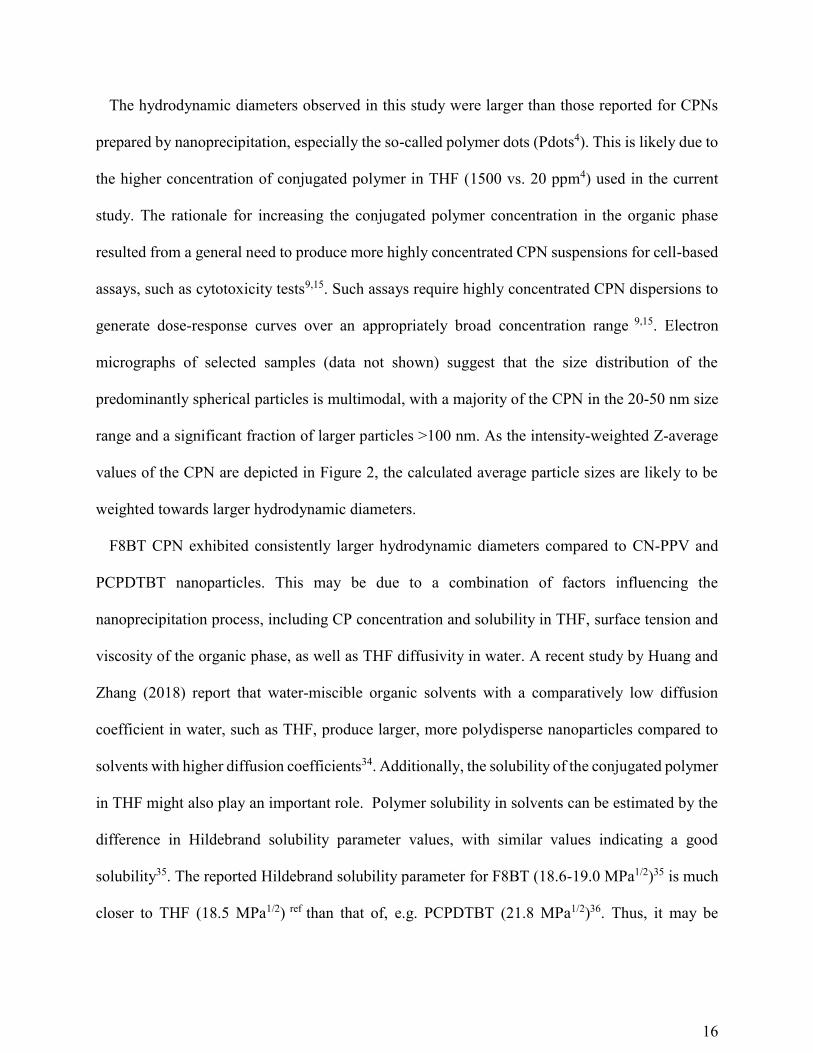
CPNs were produced with a modified nanoprecipitation method using the five different CxEy
surfactants as surface stabilisers and exhibited different particle size and yield values (Figure 3).
It was observed that conjugated polymer properties, as opposed to the nature of the surfactant,
were more influential in determining CPN size and yield, with all F8BT (214-296 nm)
nanoparticles significantly larger (P<0.05 and P<0.1; two-way ANOVA test with Bonferroni post-
test) than their CN-PPV (106-135 nm) and PCPDTBT (122-146 nm) counterparts. The
polydispersity values of all CPNs (Table 2) show that CN-PPV nanoparticles were more narrowly
dispersed than the F8BT and PCPDTBT systems.
16
The hydrodynamic diameters observed in this study were larger than those reported for CPNs
prepared by nanoprecipitation, especially the so-called polymer dots (Pdots4). This is likely due to
the higher concentration of conjugated polymer in THF (1500 vs. 20 ppm4) used in the current
study. The rationale for increasing the conjugated polymer concentration in the organic phase
resulted from a general need to produce more highly concentrated CPN suspensions for cell-based
assays, such as cytotoxicity tests9,15. Such assays require highly concentrated CPN dispersions to
generate dose-response curves over an appropriately broad concentration range 9,15. Electron
micrographs of selected samples (data not shown) suggest that the size distribution of the
predominantly spherical particles is multimodal, with a majority of the CPN in the 20-50 nm size
range and a significant fraction of larger particles >100 nm. As the intensity-weighted Z-average
values of the CPN are depicted in Figure 2, the calculated average particle sizes are likely to be
weighted towards larger hydrodynamic diameters.
F8BT CPN exhibited consistently larger hydrodynamic diameters compared to CN-PPV and
PCPDTBT nanoparticles. This may be due to a combination of factors influencing the
nanoprecipitation process, including CP concentration and solubility in THF, surface tension and
viscosity of the organic phase, as well as THF diffusivity in water. A recent study by Huang and
Zhang (2018) report that water-miscible organic solvents with a comparatively low diffusion
coefficient in water, such as THF, produce larger, more polydisperse nanoparticles compared to
solvents with higher diffusion coefficients34. Additionally, the solubility of the conjugated polymer
in THF might also play an important role. Polymer solubility in solvents can be estimated by the
difference in Hildebrand solubility parameter values, with similar values indicating a good
solubility35. The reported Hildebrand solubility parameter for F8BT (18.6-19.0 MPa1/2)35 is much
closer to THF (18.5 MPa1/2) ref than that of, e.g. PCPDTBT (21.8 MPa1/2)36. Thus, it may be
17
speculated that a higher amount of soluble F8BT enriches in the THF phase during the
comparatively slow solvent diffusion process, leading to larger polymer aggregates during
precipitation, as well as higher overall polydispersity values.
Figure 3. Particle size and percentage yield of (A,D) F8BT, (B,E) CN-PPV and (C, PCPDTBT
nanoparticles. Values represent the mean ± standard deviation of n=3 CPN batches *p < 0.05, **p
< 0.01, ***p < 0.001.
Table 3. Polydispersity index values of F8BT, CN-PPV and PCPDTBT nanoparticle size
distribution profiles. Values represent the mean ± standard deviation of n=3 CPN batches.
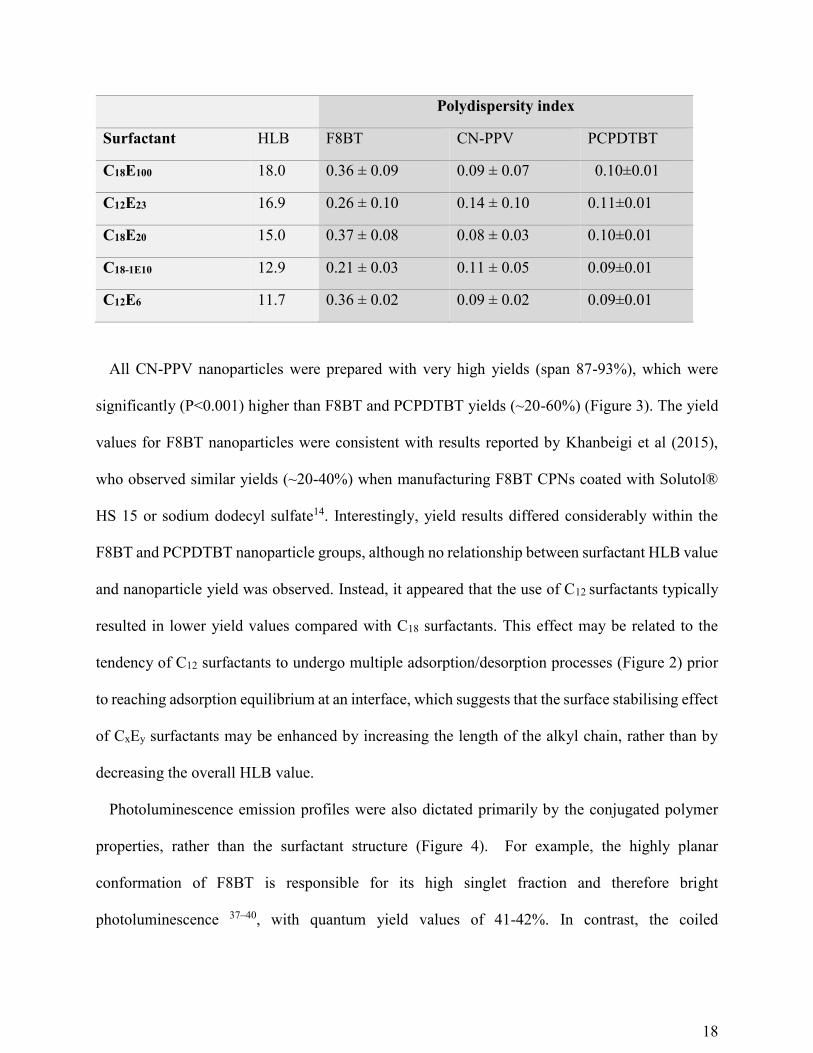
18
Polydispersity index
Surfactant HLB F8BT CN-PPV PCPDTBT
C18E100 18.0 0.36 ± 0.09 0.09 ± 0.07 0.10±0.01
C12E23 16.9 0.26 ± 0.10 0.14 ± 0.10 0.11±0.01
C18E20 15.0 0.37 ± 0.08 0.08 ± 0.03 0.10±0.01
C18-1E10 12.9 0.21 ± 0.03 0.11 ± 0.05 0.09±0.01
C12E6 11.7 0.36 ± 0.02 0.09 ± 0.02 0.09±0.01
All CN-PPV nanoparticles were prepared with very high yields (span 87-93%), which were
significantly (P<0.001) higher than F8BT and PCPDTBT yields (~20-60%) (Figure 3). The yield
values for F8BT nanoparticles were consistent with results reported by Khanbeigi et al (2015),
who observed similar yields (~20-40%) when manufacturing F8BT CPNs coated with Solutol®
HS 15 or sodium dodecyl sulfate14. Interestingly, yield results differed considerably within the
F8BT and PCPDTBT nanoparticle groups, although no relationship between surfactant HLB value
and nanoparticle yield was observed. Instead, it appeared that the use of C12 surfactants typically
resulted in lower yield values compared with C18 surfactants. This effect may be related to the
tendency of C12 surfactants to undergo multiple adsorption/desorption processes (Figure 2) prior
to reaching adsorption equilibrium at an interface, which suggests that the surface stabilising effect
of CxEy surfactants may be enhanced by increasing the length of the alkyl chain, rather than by
decreasing the overall HLB value.
Photoluminescence emission profiles were also dictated primarily by the conjugated polymer
properties, rather than the surfactant structure (Figure 4). For example, the highly planar
conformation of F8BT is responsible for its high singlet fraction and therefore bright
photoluminescence 37–40, with quantum yield values of 41-42%. In contrast, the coiled
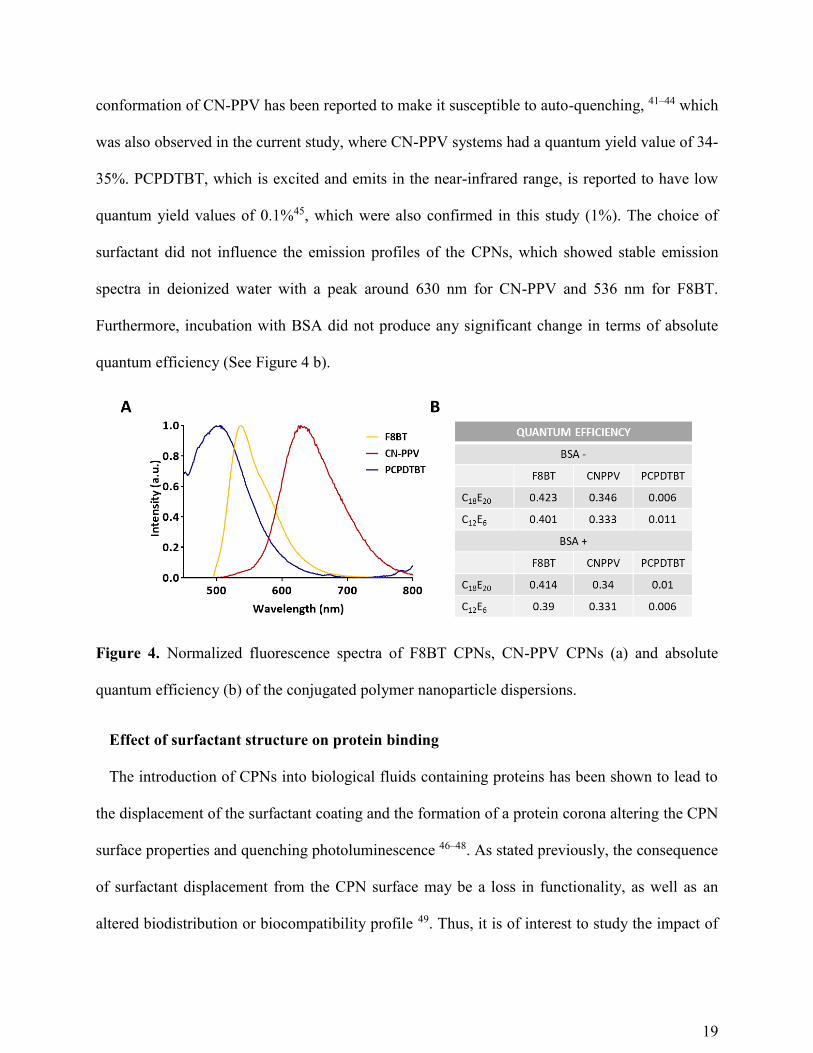
19
conformation of CN-PPV has been reported to make it susceptible to auto-quenching, 41–44 which
was also observed in the current study, where CN-PPV systems had a quantum yield value of 34-
35%. PCPDTBT, which is excited and emits in the near-infrared range, is reported to have low
quantum yield values of 0.1%45, which were also confirmed in this study (1%). The choice of
surfactant did not influence the emission profiles of the CPNs, which showed stable emission
spectra in deionized water with a peak around 630 nm for CN-PPV and 536 nm for F8BT.
Furthermore, incubation with BSA did not produce any significant change in terms of absolute
quantum efficiency (See Figure 4 b).
Figure 4. Normalized fluorescence spectra of F8BT CPNs, CN-PPV CPNs (a) and absolute
quantum efficiency (b) of the conjugated polymer nanoparticle dispersions.
Effect of surfactant structure on protein binding
The introduction of CPNs into biological fluids containing proteins has been shown to lead to
the displacement of the surfactant coating and the formation of a protein corona altering the CPN
surface properties and quenching photoluminescence 46–48. As stated previously, the consequence
of surfactant displacement from the CPN surface may be a loss in functionality, as well as an
altered biodistribution or biocompatibility profile 49. Thus, it is of interest to study the impact of
20
conjugated polymer and surfactant chemistry on protein binding. In the current study, several
complementary techniques were used to probe protein adsorption to CPNs, as well as the flat
surface conjugated polymers. Two surfactants, C12E6 (HLB: 11.7) and C18E20 (HLB: 15.0), were
selected for investigation in this phase of the study.
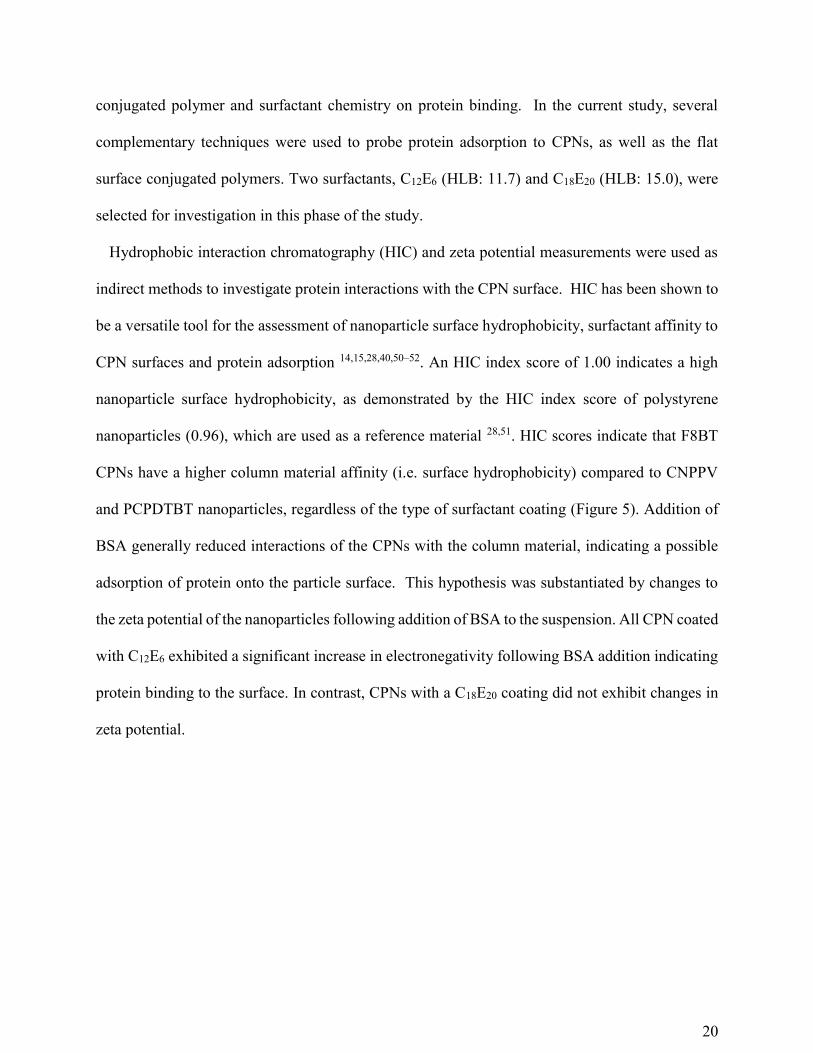
Hydrophobic interaction chromatography (HIC) and zeta potential measurements were used as
indirect methods to investigate protein interactions with the CPN surface. HIC has been shown to
be a versatile tool for the assessment of nanoparticle surface hydrophobicity, surfactant affinity to
CPN surfaces and protein adsorption 14,15,28,40,50–52. An HIC index score of 1.00 indicates a high
nanoparticle surface hydrophobicity, as demonstrated by the HIC index score of polystyrene
nanoparticles (0.96), which are used as a reference material 28,51. HIC scores indicate that F8BT
CPNs have a higher column material affinity (i.e. surface hydrophobicity) compared to CNPPV
and PCPDTBT nanoparticles, regardless of the type of surfactant coating (Figure 5). Addition of
BSA generally reduced interactions of the CPNs with the column material, indicating a possible
adsorption of protein onto the particle surface. This hypothesis was substantiated by changes to
the zeta potential of the nanoparticles following addition of BSA to the suspension. All CPN coated
with C12E6 exhibited a significant increase in electronegativity following BSA addition indicating
protein binding to the surface. In contrast, CPNs with a C18E20 coating did not exhibit changes in
zeta potential.
21
Figure 5. HIC index score (left panel) and zeta potential values (right panel) for A) F8BT, B) CN-
PPV and C) PCPDTBT CPNs prepared with 1 mM C12E6 and C18E20, respectively. Prior to
measurement, all systems were incubated 1 h at 37°C in either PBS or PBS supplemented with
BSA (1 mg mL-1), followed by a rigorous washing procedure to remove excess protein and
surfactant. HIC index scores and zeta potential values represent the mean ± standard deviation of
n=3 measurements. **p < 0.01, ***p < 0.001.
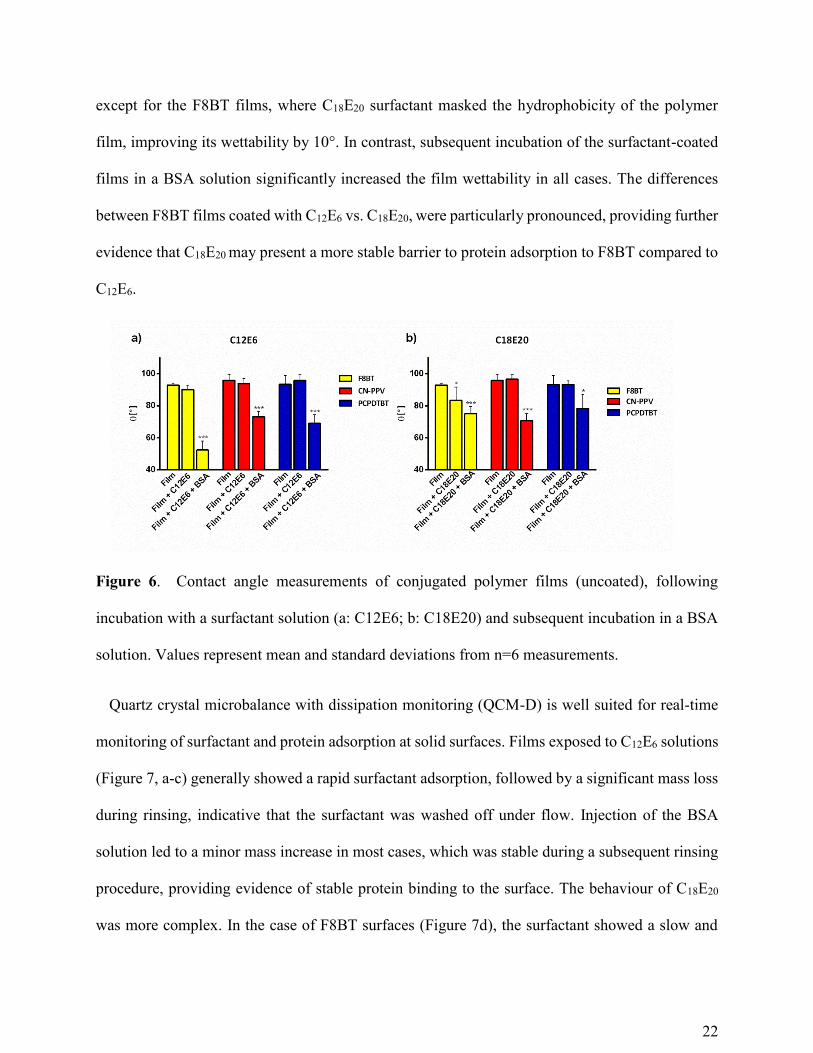
Contact angle analysis of uncoated F8BT, CN-PPV and PCPDTBT films revealed that the
relative hydrophobicity of the conjugated polymers did not differ dramatically. Contrary to
expectations, incubation with surfactant did not significantly improve the surface wettability,
22
except for the F8BT films, where C18E20 surfactant masked the hydrophobicity of the polymer
film, improving its wettability by 10°. In contrast, subsequent incubation of the surfactant-coated
films in a BSA solution significantly increased the film wettability in all cases. The differences
between F8BT films coated with C12E6 vs. C18E20, were particularly pronounced, providing further
evidence that C18E20 may present a more stable barrier to protein adsorption to F8BT compared to
C12E6.
Figure 6. Contact angle measurements of conjugated polymer films (uncoated), following
incubation with a surfactant solution (a: C12E6; b: C18E20) and subsequent incubation in a BSA
solution. Values represent mean and standard deviations from n=6 measurements.
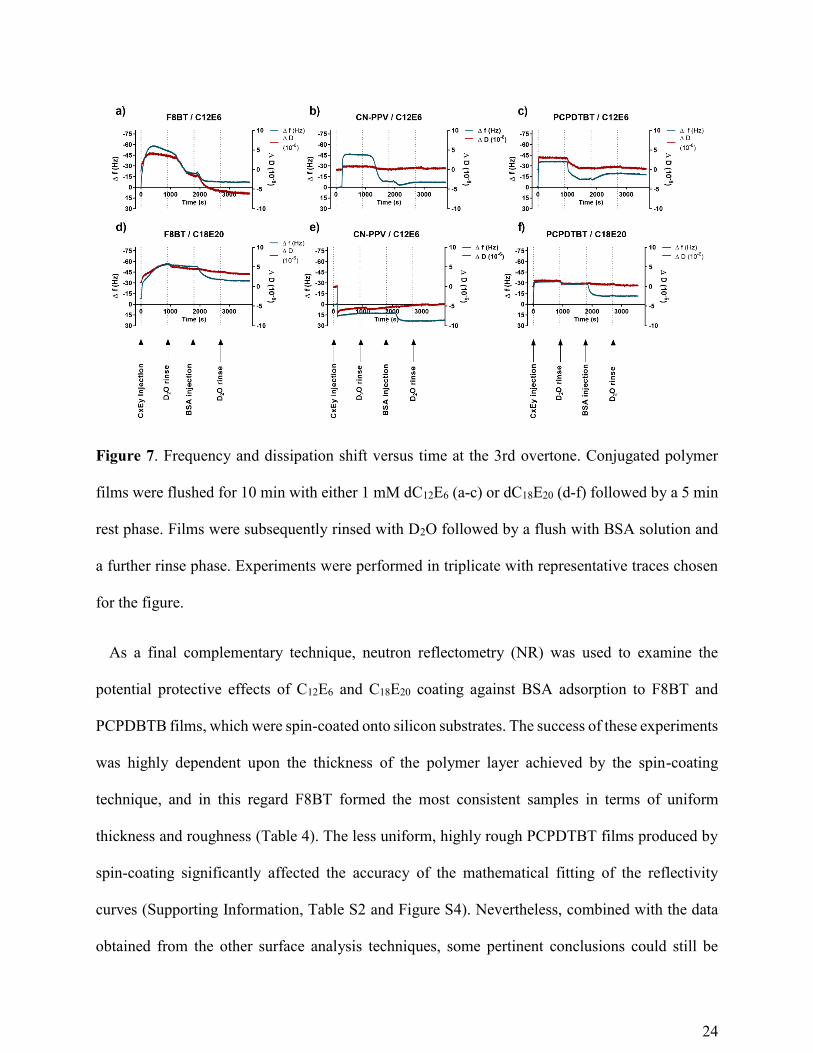
Quartz crystal microbalance with dissipation monitoring (QCM-D) is well suited for real-time
monitoring of surfactant and protein adsorption at solid surfaces. Films exposed to C12E6 solutions
(Figure 7, a-c) generally showed a rapid surfactant adsorption, followed by a significant mass loss
during rinsing, indicative that the surfactant was washed off under flow. Injection of the BSA
solution led to a minor mass increase in most cases, which was stable during a subsequent rinsing
procedure, providing evidence of stable protein binding to the surface. The behaviour of C18E20
was more complex. In the case of F8BT surfaces (Figure 7d), the surfactant showed a slow and

23
continuous deposition onto the film, with only a fraction of the deposited mass removed during
the rinsing step. The addition of BSA resulted in a rapid and significant mass loss, indicative of
the protein removing surfactant from the polymer surface, possibly through solubilization, without
a measurable mass increase due to protein adsorption. The addition of C18E20 to PCPDTBT films
showed a similar behaviour, although surfactant adsorption to the surface occurred much more
rapidly (Figure 7f). In contrast, the deposition of C18E20 onto CN-PPV films could not be
characterized as the surfactant solubilised the film itself, thereby constantly removing mass from
the system (Figure 7e).
Quantitative analysis of the QCM-D results to determine the adsorbed layer thickness53 was
challenging, because the analysis required the assumption of a coupled water content for each
layer, which was difficult to account for in such a complex substrate. The system would need to
be described as the combination of laterally homogeneous (conjugated polymer film) and
heterogeneous films (surfactant/solvent layer and surfactant/solvent/BSA layer), therefore the
quantitative interpretation of QCM data alone is severely limited54. For such reasons we chose not
to include a film thickness determination in this study. In the future, additional information might
be obtained by the combination of QCM with a method that can determine the mass of the
adsorbate per surface area55,56.
24
Figure 7. Frequency and dissipation shift versus time at the 3rd overtone. Conjugated polymer
films were flushed for 10 min with either 1 mM dC12E6 (a-c) or dC18E20 (d-f) followed by a 5 min
rest phase. Films were subsequently rinsed with D2O followed by a flush with BSA solution and
a further rinse phase. Experiments were performed in triplicate with representative traces chosen
for the figure.
As a final complementary technique, neutron reflectometry (NR) was used to examine the
potential protective effects of C12E6 and C18E20 coating against BSA adsorption to F8BT and
PCPDBTB films, which were spin-coated onto silicon substrates. The success of these experiments
was highly dependent upon the thickness of the polymer layer achieved by the spin-coating
technique, and in this regard F8BT formed the most consistent samples in terms of uniform
thickness and roughness (Table 4). The less uniform, highly rough PCPDTBT films produced by
spin-coating significantly affected the accuracy of the mathematical fitting of the reflectivity
curves (Supporting Information, Table S2 and Figure S4). Nevertheless, combined with the data
obtained from the other surface analysis techniques, some pertinent conclusions could still be
25
drawn from the PCPDTBT results (see Supplementary Information). To improve the resolution of
the NR data and thus the accuracy of the fitting, each experimental treatment was measured in at
least three different solvent contrasts, the results from which were fitted simultaneously (See
Supplementary Information Figures S1 to S3 for the full set of NR curves and fits for each sample
in the different contrasts).
In order to fit the NR data, the samples were modelled as layers stacked upon the silicon
substrate; a thin layer of silicon oxide on the substrate surface, the spin-coated conjugated polymer
film, the hydrophobic tails of any surfactant adsorbed to the polymer, their hydrophilic head
groups, and any adsorbed BSA contiguous with the bulk solvent. The simultaneous altering of the
thickness, roughness, scattering length density (SLD; analogous to a neutron refractive index of
the layer) and solvation of all these model layers, within physically reasonable limits, allowed
theoretical NR curves to be fitted to the experimentally-obtained ones. An overall Chi-squared
value obtained from the fitting software, together with the results of a bootstrapping error analysis
on the parameter values obtained for each layer (run 100 times with 1000 iterations per run), were
used to assess the closeness of the fits. In addition to obtaining theoretical NR curves, fitting also
allowed the construction of SLD profiles for each experimental treatment, allowing the
relationship between the thickness, solvation and roughness of each layer in the model to be
represented graphically. For the purposes of making clear comparisons between the results of the
various treatments, only the data obtained using D2O and H2O as bulk solvents are presented here
(Figure 8), since these were deemed to show the highest degree of contrast between the different
components of the samples.
For F8BT, exposure to BSA in the absence of a surfactant coating results in the formation of a
clearly defined adsorbed protein layer (Figure 8A) with a fitted thickness of ~25 Å (Table 4). The
26
apparently high solvation of the BSA layer (80%) implies that coverage is fairly sparse, and taking
this into account, the average thickness of the layer is consistent with that of BSA adsorbing to
and flattening out on the surface of the hydrophobic polymer film57.
The changes in the SLD profile observed upon addition of d25C12E6 to uncoated F8BT (Figure
8B), clearly indicates that the surfactant adsorbs to the surface of the polymer. The accompanying
decrease in F8BT hydration from 23% to 3 % (Table 4) suggests that the surface of the polymer
may have been pitted or contained small cracks, which were filled by the adsorbing surfactant,
thus displacing the solvent. This situation is the likely cause of the small peak in the H2O contrast
SLD profile which corresponds to the position of the surfactant chains, whereas a more discrete
layer of surfactant would have resulted in a broader peak (such as that observed in Figure 8C).
Overlap or intermixing between the alkyl chains and the PEG head group of the surfactant
molecules are thus the likely reason for the narrow chains peak. When the d25C12E6-coated F8BT
sample was challenged with BSA, the SLD profile indicates a significant ingress of protein into
the surfactant layers (seen most clearly from the H2O contrast), which would be consistent with
surfactant displacement and adsorption of the protein to the polymer, as was observed in both the
contact angle and QCM-D experiments.
The addition of C18E20 to an F8BT film resulted in a discrete layer of surfactant adsorbing to the
polymer surface, with little evidence of solvent displacement from surface irregularities (Table 4).
The alkyl chain region of the surfactant is clearly visible in the SLD profiles (Figure 8C),
suggesting very little overlap between the layers as indicated by the broad peak (H2O contrast) or
trough (D2O contrast) showing the position of the hydrogenated C18 chains. The negligible
solvation of the surfactant chains region (Table 4) suggests that these form an almost complete
coating of the polymer surface, what might be thought of as a waxy layer. The SLD profiles of the
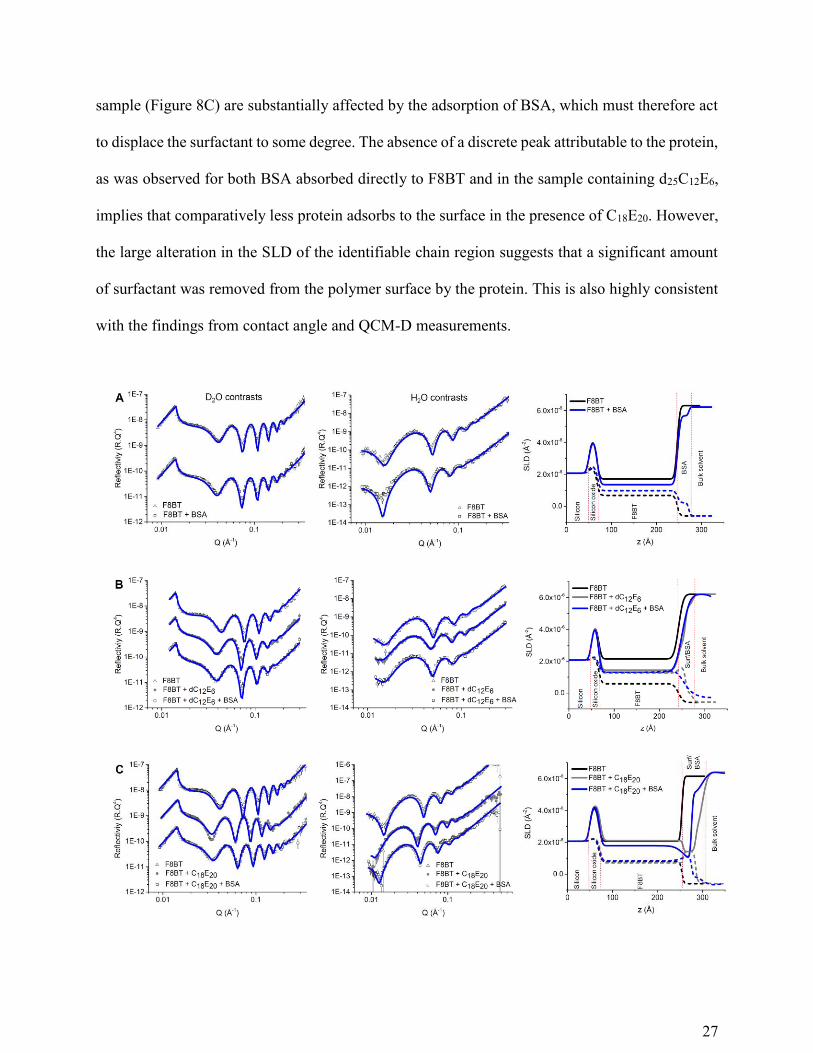
27
sample (Figure 8C) are substantially affected by the adsorption of BSA, which must therefore act
to displace the surfactant to some degree. The absence of a discrete peak attributable to the protein,
as was observed for both BSA absorbed directly to F8BT and in the sample containing d25C12E6,
implies that comparatively less protein adsorbs to the surface in the presence of C18E20. However,
the large alteration in the SLD of the identifiable chain region suggests that a significant amount
of surfactant was removed from the polymer surface by the protein. This is also highly consistent
with the findings from contact angle and QCM-D measurements.
28
Figure 8. Experimentally obtained neutron reflectivity curves (data points) and their theoretical
fits (blue curves) obtained in D2O (left) and H2O (centre) solvent contrasts, and their corresponding
derived (right) SLD profiles (solid lines denote the D2O contrast and dashed lines denote the H2O
contrast), comparing the sequential adsorption of surfactant and BSA onto F8BT-coated silicon
substrates. (A) Shows the adsorption of BSA alone onto F8BT. (B) Shows the adsorption of
d25C12E6 to F8BT, followed by the adsorption of BSA and (C) shows the adsorption of C18E20 to
F8BT, followed by the adsorption of BSA.
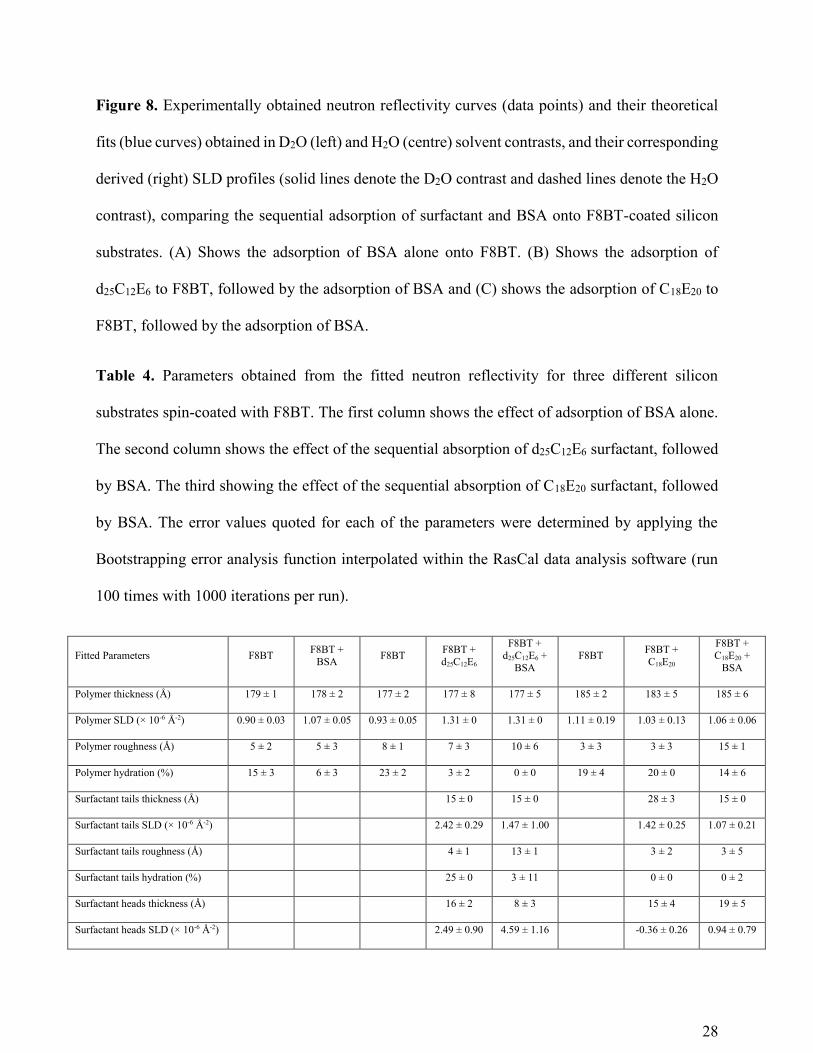
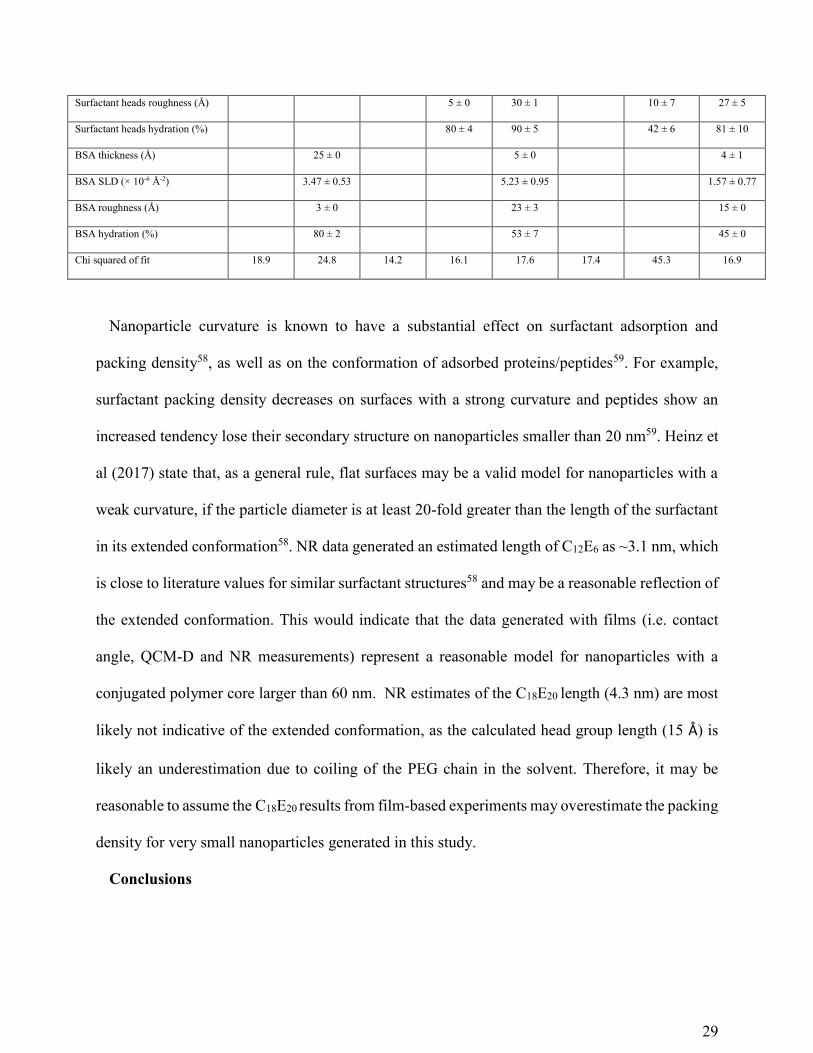
Table 4. Parameters obtained from the fitted neutron reflectivity for three different silicon
substrates spin-coated with F8BT. The first column shows the effect of adsorption of BSA alone.
The second column shows the effect of the sequential absorption of d25C12E6 surfactant, followed
by BSA. The third showing the effect of the sequential absorption of C18E20 surfactant, followed
by BSA. The error values quoted for each of the parameters were determined by applying the
Bootstrapping error analysis function interpolated within the RasCal data analysis software (run
100 times with 1000 iterations per run).
Fitted Parameters F8BT F8BT +
BSA F8BT
F8BT +
d25C12E6
F8BT +
d25C12E6 +
BSA
F8BT F8BT +
C18E20
F8BT +
C18E20 +
BSA
Polymer thickness (Å) 179 ± 1 178 ± 2 177 ± 2 177 ± 8 177 ± 5 185 ± 2 183 ± 5 185 ± 6
Polymer SLD (× 10-6 Å-2) 0.90 ± 0.03 1.07 ± 0.05 0.93 ± 0.05 1.31 ± 0 1.31 ± 0 1.11 ± 0.19 1.03 ± 0.13 1.06 ± 0.06
Polymer roughness (Å) 5 ± 2 5 ± 3 8 ± 1 7 ± 3 10 ± 6 3 ± 3 3 ± 3 15 ± 1
Polymer hydration (%) 15 ± 3 6 ± 3 23 ± 2 3 ± 2 0 ± 0 19 ± 4 20 ± 0 14 ± 6
Surfactant tails thickness (Å) 15 ± 0 15 ± 0 28 ± 3 15 ± 0
Surfactant tails SLD (× 10-6 Å-2) 2.42 ± 0.29 1.47 ± 1.00 1.42 ± 0.25 1.07 ± 0.21
Surfactant tails roughness (Å) 4 ± 1 13 ± 1 3 ± 2 3 ± 5
Surfactant tails hydration (%) 25 ± 0 3 ± 11 0 ± 0 0 ± 2
Surfactant heads thickness (Å) 16 ± 2 8 ± 3 15 ± 4 19 ± 5
Surfactant heads SLD (× 10-6 Å-2) 2.49 ± 0.90 4.59 ± 1.16 -0.36 ± 0.26 0.94 ± 0.79
29
Surfactant heads roughness (Å) 5 ± 0 30 ± 1 10 ± 7 27 ± 5
Surfactant heads hydration (%) 80 ± 4 90 ± 5 42 ± 6 81 ± 10
BSA thickness (Å) 25 ± 0 5 ± 0 4 ± 1
BSA SLD (× 10-6 Å-2) 3.47 ± 0.53 5.23 ± 0.95 1.57 ± 0.77
BSA roughness (Å) 3 ± 0 23 ± 3 15 ± 0
BSA hydration (%) 80 ± 2 53 ± 7 45 ± 0
Chi squared of fit 18.9 24.8 14.2 16.1 17.6 17.4 45.3 16.9
Nanoparticle curvature is known to have a substantial effect on surfactant adsorption and
packing density58, as well as on the conformation of adsorbed proteins/peptides59. For example,
surfactant packing density decreases on surfaces with a strong curvature and peptides show an
increased tendency lose their secondary structure on nanoparticles smaller than 20 nm59. Heinz et
al (2017) state that, as a general rule, flat surfaces may be a valid model for nanoparticles with a
weak curvature, if the particle diameter is at least 20-fold greater than the length of the surfactant
in its extended conformation58. NR data generated an estimated length of C12E6 as ~3.1 nm, which
is close to literature values for similar surfactant structures58 and may be a reasonable reflection of
the extended conformation. This would indicate that the data generated with films (i.e. contact
angle, QCM-D and NR measurements) represent a reasonable model for nanoparticles with a
conjugated polymer core larger than 60 nm. NR estimates of the C18E20 length (4.3 nm) are most
likely not indicative of the extended conformation, as the calculated head group length (15 Å) is
likely an underestimation due to coiling of the PEG chain in the solvent. Therefore, it may be
reasonable to assume the C18E20 results from film-based experiments may overestimate the packing
density for very small nanoparticles generated in this study.
Conclusions
30
This study contributes to the understanding of the structure and interactions at the interface of
core-shell CPNs, essential to the design of clinically relevant diagnostic and therapeutic agents. A
series of five non-ionic polyethylene glycol alkyl ether surfactants with varying HLB values were
used to produce CPNs from three representative π-conjugated polymers: F8BT, CN-PPV and
PCPDTBT. Contrary to the study hypothesis, the surfactant structure did not influence CPN size
or yield, which was dependent on the conjugated polymer properties. Surfactants with a longer
alkyl chain (C18> C12) showed a higher affinity to F8BT and PCPDTBT surfaces and were less
likely to be displaced from the polymer surface under simple flow conditions. Despite its higher
surface affinity, C18E20 was also actively removed from the polymer surface in the presence of the
serum protein, albumin. In vivo, this could result in a loss of CPN functionality or altered
biocompatibility/biodistribution. It should be noted that the results of this study do not exclude the
use of all amphiphilic molecules as coating agents for CPN production, but do encourage caution
in the choice of stabilizing agents, especially if they are modified with a targeting agent.
The data from this study highlight the advantages of alternative CPN structures, such as
crosslinking60,61 or encapsulation62–64. Our group is currently exploring structures whereby the
conjugated polymer is embedded within a matrix material (PEOlated di- and tri-block copolymers
with high molecular weight), thereby providing a better means of controlling CPN properties and
surface chemistry independent of the conjugated polymer properties10,65,66.
Supporting Information. Urbano et al, 2018 (PDF)
AUTHOR INFORMATION
31
Corresponding Author
*Lea Ann Dailey
E-mail: [email protected]
Present Addresses
a School of Cancer & Pharmaceutical Sciences, King’s College London, 150 Stamford Street,
London SE1 9NH, UK
b Department of Bioengineering and Therapeutic Sciences, University of California, San
Francisco, California 94158, United States
c ISIS Spallation Neutron Source, Rutherford Appleton Laboratory, Harwell Science and
Innovation Campus, Didcot, Oxfordshire OX11 0QX, United Kingdom
dSchool of Physical Sciences, University of Kent, Canterbury, Kent, CT2 7NH, UK
e King's College London, Department of Physics, Strand Campus, London, UK
g Department of Chemistry, Imperial College London, London, U.K.
fInstitut für Pharmazeutische Technologie und Biopharmazie, Martin-Luther-Universität Halle-
Wittenberg, Halle, Germany. E-mail: [email protected]
Funding Sources
Funding for this project was provided by the UK Engineering and Physical Sciences Research
Council (EP/K018876/1). The authors gratefully acknowledge the Science and Technology
Facilities Council (UK) for the allocation of beamtime (experiments RB 1400032 and RB
1500027) at the ISIS Neutron and Muon Source (Rutherford Appleton Laboratory) and the
32
Institut Laue Langevin (Grenoble, France) for the allocation of beamtime (experiment 9-12-385),
and the Partnership for Soft Condensed Matter at ILL for the use of sample preparation facilities.
REFERENCES
1. Feng, X. et al. Conjugated polymer nanoparticles for drug delivery and imaging. ACS Appl.
Mater. Interfaces 2, 2429–35 (2010).
2. Saranya, S. & Radha, K. V. Review of Nanobiopolymers for Controlled Drug Delivery.
Polym. Plast. Technol. Eng. 53, 1636–1646 (2014).
3. Li, J., Rao, J. & Pu, K. Recent progress on semiconducting polymer nanoparticles for
molecular imaging and cancer phototherapy. Biomaterials 155, 217–235 (2018).
4. Wu, C. & Chiu, D. T. Highly Fluorescent Semiconducting Polymer Dots for Biology and
Medicine. Angew. Chemie Int. Ed. 52, 3086–3109 (2013).
5. Yu, J., Rong, Y., Kuo, C.-T., Zhou, X.-H. & Chiu, D. T. Recent Advances in the
Development of Highly Luminescent Semiconducting Polymer Dots and Nanoparticles for
Biological Imaging and Medicine. Anal. Chem. 89, 42–56 (2017).
6. Braeken, Y., Cheruku, S., Ethirajan, A. & Maes, W. Conjugated Polymer Nanoparticles for
Bioimaging. Materials (Basel). 10, 1420 (2017).
7. Chen, H. et al. Highly absorbing multispectral near-infrared polymer nanoparticles from
one conjugated backbone for photoacoustic imaging and photothermal therapy.
Biomaterials 144, 42–52 (2017).
33
8. Vauthier, C. & Bouchemal, K. Methods for the Preparation and Manufacture of Polymeric
Nanoparticles. Pharmaceutical Research 26, 1025–1058 (2009).
9. Ahmad Khanbeigi, R. et al. Surface Chemistry of Photoluminescent F8BT Conjugated
Polymer Nanoparticles Determines Protein Corona Formation and Internalization by
Phagocytic Cells. Biomacromolecules 16, 733–742 (2015).
10. Abelha, T. F. et al. Bright conjugated polymer nanoparticles containing a biodegradable
shell produced at high yields and with tuneable optical properties by a scalable microfluidic
device. Nanoscale 9, 2009–2019 (2017).
11. Howes, P. et al. Magnetic conjugated polymer nanoparticles as bimodal imaging agents. J.
Am. Chem. Soc. 132, 9833–9842 (2010).
12. Dai, R., Wu, F., Xu, H. & Chi, Y. Anodic, Cathodic, and Annihilation
Electrochemiluminescence Emissions from Hydrophilic Conjugated Polymer Dots in
Aqueous Medium. ACS Appl. Mater. Interfaces 7, 15160–15167 (2015).
13. Behrendt, J. M. et al. Scalable synthesis of multicolour conjugated polymer nanoparticles
via Suzuki-Miyaura polymerisation in a miniemulsion and application in bioimaging. React.
Funct. Polym. 107, 69–77 (2016).
14. Ahmad Khanbeigi, R. et al. Surface Chemistry of Photoluminescent F8BT Conjugated
Polymer Nanoparticles Determines Protein Corona Formation and Internalization by
Phagocytic Cells. Biomacromolecules 16, 733–742 (2015).
15. Khanbeigi, R. A. et al. Interactions of stealth conjugated polymer nanoparticles with human
34
whole blood. J. Mater. Chem. B 3, 2463–2471 (2015).
16. Hashim, Z. et al. Gd-Containing Conjugated Polymer Nanoparticles: Bimodal nanoparticles
for Fluorescence and MRI Imaging. Nanoscale 6, 8376–8386 (2014).
17. Fernando, L. P. et al. Mechanism of cellular uptake of highly fluorescent conjugated
polymer nanoparticles. Biomacromolecules 11, 2675–2682 (2010).
18. Hashim, Z., Howes, P. & Green, M. Luminescent quantum-dot-sized conjugated polymer
nanoparticles—nanoparticle formation in a miniemulsion system. J. Mater. Chem. 21, 1797
(2011).
19. Zhu, H. et al. Regulating Near-Infrared Photodynamic Properties of Semiconducting
Polymer Nanotheranostics for Optimized Cancer Therapy. ACS Nano 11, 8998–9009
(2017).
20. Fessi H, Puisieux F, Devissaguet JP, A. N. Nanocapsule formation by interfacial polymer
deposition following solvent displacement. Int J Pharm 55, 1–4 (1989).
21. Liu, Y. et al. Understanding the Robust Physisorption between Bovine Serum Albumin and
Amphiphilic Polymer Coated Nanoparticles. ACS Appl. Mater. Interfaces 8, 2478–85
(2016).
22. Ojha, B. & Das, G. Role of hydrophobic and polar interactions for BSA-amphiphile
composites. Chem. Phys. Lipids 164, 144–50 (2011).
23. Ruso, J. M., Taboada, P., Varela, L. M., Attwood, D. & Mosquera, V. Adsorption of an
amphiphilic penicillin onto human serum albumin: characterisation of the complex.
35
Biophys. Chem. 92, 141–53 (2001).
24. Kim, J. & Somorjai, G. A. Molecular packing of lysozyme, fibrinogen, and bovine serum
albumin on hydrophilic and hydrophobic surfaces studied by infrared-visible sum frequency
generation and fluorescence microscopy. J. Am. Chem. Soc. 125, 3150–8 (2003).
25. Zunszain, P. A., Ghuman, J., Komatsu, T., Tsuchida, E. & Curry, S. Crystal structural
analysis of human serum albumin complexed with hemin and fatty acid. BMC Struct. Biol.
3, 6 (2003).
26. Chidambaram, M. & Krishnasamy, K. Modifications to the conventional nanoprecipitation
technique: an approach to fabricate narrow sized polymeric nanoparticles. Adv. Pharm. Bull.
4, 205–8 (2014).
27. McNaught, A. D. & Wilkinson, A. Compendium of Chemical Terminology: IUPAC
Recommendations. (Blackwell Science, 1997).
28. Jones, M. C. et al. Quantitative assessment of nanoparticle surface hydrophobicity and its
influence on pulmonary biocompatibility. J. Control. Release 183, 94–104 (2014).
29. Irache, J., Durrer, C., Ponchel, G. & Duchêne, D. Determination of particle concentration
in latexes by turbidimetry. Int. J. Pharm. 90, R9–R12 (1993).
30. Stalder, A. F., Kulik, G., Sage, D., Barbieri, L. & Hoffmann, P. A snake-based approach to
accurate determination of both contact points and contact angles. Colloids Surfaces A
Physicochem. Eng. Asp. 286, 92–103 (2006).
31. Rodahl, M., Hook, F., Krozer, A., Brzezinski, P. & Kasemo, B. Quartz crystal microbalance
36
setup for frequency and Q-factor measurements in gaseous and liquid environments. Rev.
Sci. Instrum. 66, 3924 (1995).
32. Webster, J., Holt, S. & Dalgliesh, R. INTER the chemical interfaces reflectometer on target
station 2 at ISIS. Phys. B Condens. Matter 385–386, 1164–1166 (2006).
33. Born, M. & Wolf, E. Principles of Optics. (Pergamon Press, Oxford, 1970).
34. Huang, W. & Zhang, C. Tuning the Size of Poly(lactic-co-glycolic Acid) (PLGA)
Nanoparticles Fabricated by Nanoprecipitation. Biotechnol. J. 13, 1700203 (2018).
35. Dovgolevsky, E. et al. Self-assembled conjugated polymer–surfactant–silica
mesostructures and their integration into light-emitting diodes. J. Mater. Chem. 18, 423–
436 (2008).
36. Zhang, C. et al. Understanding the correlation and balance between the miscibility and
optoelectronic properties of polymer–fullerene solar cells. J. Mater. Chem. A 5, 17570–
17579 (2017).
37. Dhoot, a. S. & Greenham, N. C. Triplet Formation In Polyfluorene Devices. Adv. Mater.
14, 1834–1837 (2002).
38. Zhan, X. & Zhu, D. Conjugated polymers for high-efficiency organic photovoltaics. Polym.
Chem. 1, 409 (2010).
39. Theander, M. et al. High luminescence from a substituted polythiophene in a solvent with
low solubility. Chem. Phys. Lett. 337, 277–283 (2001).
40. Tobío, M., Gref, R., Sánchez, A. et al. Stealth PLA-PEG Nanoparticles as Protein Carriers
37
for Nasal Administration. Pharm. Res. 15, 270–275 (1998).
41. Peters, M. et al. PPV-Based Conjugated Polymer Nanoparticles as a Versatile Bioimaging
Probe: A Closer Look at the Inherent Optical Properties and Nanoparticle–Cell Interactions.
Biomacromolecules 17, 2562–2571 (2016).
42. Gettinger, C. L., Heeger, a. J., Drake, J. M. & Pine, D. J. A photoluminescence study of
poly(phenylene vinylene) derivatives: The effect of intrinsic persistence length. J. Chem.
Phys. 101, 1673 (1994).
43. Mitschke, U. & Bäuerle, P. The electroluminescence of organic materials. J. Mater. Chem.
10, 1471–1507 (2000).
44. Schwartz, B. J. CONJUGATED POLYMERS AS MOLECULAR MATERIALS : How
Chain Conformation and Film Morphology Influence Energy Transfer and Interchain
Interactions. Annu. Rev. Phys. Chem. 54, 141–172 (2003).
45. Pu, K. et al. Semiconducting polymer nanoparticles as photoacoustic molecular imaging
probes in living mice. Nat. Nanotechnol. 9, 233–239 (2014).
46. Sudeep, P. K. & Emrick, T. Functional Si and CdSe quantum dots: synthesis, conjugate
formation, and photoluminescence quenching by surface interactions. ACS Nano 3, 4105–
9 (2009).
47. Tetin, S. Fluorescence Fluctuation Spectroscopy (FFS), pt. 2. (Elsevier Science, 2012).
48. Wolfram, J. et al. The nano-plasma interface: Implications of the protein corona. Colloids
Surfaces B Biointerfaces 124, 17–24 (2014).
38
49. Xia, X.-R., Monteiro-Riviere, N. a & Riviere, J. E. An index for characterization of
nanomaterials in biological systems. Nat. Nanotechnol. 5, 671–675 (2010).
50. Carstensen, H., Müller, B. W. & Müller, R. H. Adsorption of ethoxylated surfactants on
nanoparticles. I. Characterization by hydrophobic interaction chromatography. Int. J.
Pharm. 67, 29–37 (1991).
51. Staufenbiel, S. et al. Surface characterization and protein interaction of a series of model
poly[acrylonitrile-co-(N-vinyl pyrrolidone)] nanocarriers for drug targeting. Int. J. Pharm.
485, 87–96 (2015).
52. Beck-Broichsitter, M., Bohr, A. & Ruge, C. A. Poloxamer-Decorated Polymer
Nanoparticles for Lung Surfactant Compatibility. Mol. Pharm. 14, 3464–3472 (2017).
53. Jin, J., Jiang, W., Yin, J., Ji, X. & Stagnaro, P. Plasma proteins adsorption mechanism on
polyethylene-grafted poly(ethylene glycol) surface by quartz crystal microbalance with
dissipation. Langmuir 29, 6624–33 (2013).
54. Reviakine, I., Johannsmann, D. & Richter, R. P. Hearing what you cannot see and
visualizing what you hear: interpreting quartz crystal microbalance data from solvated
interfaces. Anal. Chem. 83, 8838–48 (2011).
55. Bingen, P., Wang, G., Steinmetz, N. F., Rodahl, M. & Richter, R. P. Solvation effects in the
quartz crystal microbalance with dissipation monitoring response to biomolecular
adsorption. A phenomenological approach. Anal. Chem. 80, 8880–90 (2008).
56. Johannsmann, D., Reviakine, I., Rojas, E. & Gallego, M. Effect of sample heterogeneity on
39
the interpretation of QCM(-D) data: comparison of combined quartz crystal
microbalance/atomic force microscopy measurements with finite element method
modeling. Anal. Chem. 80, 8891–9 (2008).
57. Cowsill, B. J. et al. Measurement of the thickness of ultra-thin adsorbed globular protein
layers with dual-polarisation interferometry: a comparison with neutron reflectivity. Soft
Matter 7, 7223 (2011).
58. Heinz, H. et al. Nanoparticle decoration with surfactants: Molecular interactions, assembly,
and applications. Surface Science Reports 72, 1–58 (2017).
59. Mandal, H. S. & Kraat, H. B. Effect of the surface curvature on the secondary structure of
peptides adsorbed on nanoparticles. J. Am. Chem. Soc. 129, 6356–6357 (2007).
60. Yu, J. et al. Stable Functionalization of Small Semiconducting Polymer Dots via Covalent
Cross-Linking and Their Application for Specific Cellular Imaging. Adv. Mater. 24, 3498–
3504 (2012).
61. Zhou, L., Geng, J., Wang, G., Liu, J. & Liu, B. Facile Synthesis of Stable and Water-
Dispersible Multihydroxy Conjugated Polymer Nanoparticles with Tunable Size by
Dendritic Cross-Linking. ACS Macro Lett. 1, 927–932 (2012).
62. Joshi, P. B. & Zhang, P. Facile capture of conjugated polymer nanodots in silica
nanoparticles to facilitate surface modification. J. Mater. Sci. 50, 3597–3603 (2015).
63. Changfeng Wu, Craig Szymanski, and & McNeill*, J. Preparation and Encapsulation of
Highly Fluorescent Conjugated Polymer Nanoparticles. (2006). doi:10.1021/LA060188L
40
64. Geng, J., Liu, J., Liang, J., Shi, H. & Liu, B. A general approach to prepare conjugated
polymer dot embedded silica nanoparticles with a SiO2@CP@SiO2 structure for targeted
HER2-positive cellular imaging. Nanoscale 5, 8593–601 (2013).
65. Abelha, T. F. et al. Bright conjugated polymer nanoparticles containing a biodegradable
shell produced at high yields and with tuneable optical properties by a scalable microfluidic
device. Nanoscale 9, 2009–2019 (2017).
66. Crossley, D. L. et al. Post-polymerization C–H Borylation of Donor–Acceptor Materials
Gives Highly Efficient Solid State Near-Infrared Emitters for Near-IR-OLEDs and
Effective Biological Imaging. ACS Appl. Mater. Interfaces 9, 28243–28249 (2017).
41
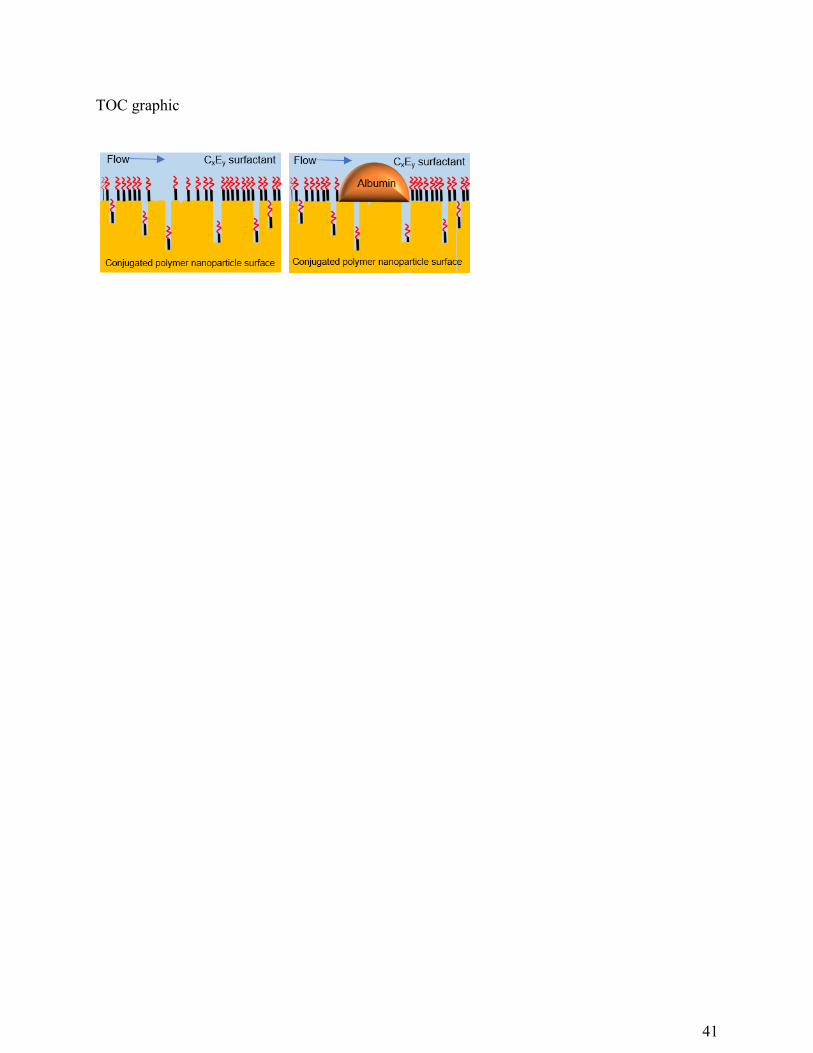
TOC graphic


![Technische Universität Chemnitz, Center for ...Preparation of aspheric copper nanoparticles Scheme 1: Synthesis of copper nanoparticles by thermolysis of copper(I) carboxylate 1 [7].](https://static.fdocument.org/doc/165x107/60fcc6b8e53c32273d090db6/technische-universitt-chemnitz-center-for-preparation-of-aspheric-copper.jpg)
![Novel Thieno[3,4-b]pyrazine Based π-Conjugated Polymers ...](https://static.fdocument.org/doc/165x107/627dccb84f1cae76452c1a83/novel-thieno34-bpyrazine-based-conjugated-polymers-.jpg)


![[pgr]-Conjugated Anions: From Carbon-Rich Anions to ...](https://static.fdocument.org/doc/165x107/62887182fd628c47fb7ebde3/pgr-conjugated-anions-from-carbon-rich-anions-to-.jpg)