
“High Brightness and High Polarization Electron Source for Electron Microscope”
THESIS FOR THE DEGREE OF DOCTOR OF PHILOSOPHY
PHOTOINDUCED ELECTRON AND ENERGY
TRANSFER IN Π‒CONJUGATED SYSTEMS
MÉLINA GILBERT GATTY
DEPARTMENT OF CHEMISTRY AND CHEMICAL ENGINEERING
CHALMERS UNIVERSITY OF TECHNOLOGY
GOTHENBURG, SWEDEN 2015
ii
Photoinduced Electron and Energy Transfer in Π‒Conjugated Systems
Mélina Gilbert Gatty
ISBN: 978-91-7597-219-0
© MÉLINA GILBERT GATTY, 2015
Doktorsavhandlingar vid Chalmers tekniska högskola
Ny serie nr 3900
ISSN 0346-718X
Department of Chemistry and Chemical Engineering
Chalmers University of Technology
SE-412 96 Gothenburg
Sweden
Telephone + 46 (0)31-772 1000
Front cover: Four different aspects of photoinduced electron and energy transfer in
π‒conjugated systems mimics of the natural photosynthetic complexes are covered in
this thesis. Going from the top left hand corner to the bottom right hand corner are
illustrations of: control of electron transfer in a porphyrin hexamer‒fullerene dyad, a
self‒assembled porphyrin tetramer‒fullerene dimeric array, electron transfer mediated
by a porphyrin bridge in a donor‒bridge‒acceptor system and a schematic structure of
an anthracene dendrimer model system for fast exciton migration.
Back cover: Photograph by Peter Sandin.
Printed by Chalmers Reproservice
Gothenburg, Sweden 2015

iii
A MES PARENTS, FRANÇOISE ET DIDIER,

iv
v
PHOTOINDUCED ELECTRON AND ENERGY TRANSFER
IN Π‒CONJUGATED SYSTEMS
MÉLINA GILBERT GATTY Department of Chemistry and Chemical Engineering
Chalmers University of Technology
ABSTRACT
Photosynthesis is a fascinating process that provides food and oxygen. In this thesis,
focus is on understanding and controlling the early processes of photosynthesis, namely
photoinduced energy and electron transfer. Indeed, mimicking these processes in
synthetic systems could open to a wide range of applications going from renewable
energy production to molecular devices for information exchange. In this work,
covalently linked π‒conjugated systems provide a means to get a better understanding
of the mechanisms and factors that govern transfer of charge and energy in molecular
systems.
Photoinduced electron transfer (ET) is investigated in series of donor‒acceptor dyads
Pn‒C60 and triads Fc‒Pn‒C60 employing butadiyne‒linked zinc porphyrin oligomers
denoted Pn (n = 1‒8) as photoactive electron donor and π‒conjugated bridging
structures (wires). In the triads, temperature dependence study of the recombination of
the long‒range charge separated state Fc•+
‒Pn‒C60•- provides new insights into the
mechanistic nature of the charge transport linked to its wire‒like behavior. At high
temperatures (> 280 K), the weakly distance‒dependent charge transport arises from
coherent electron tunneling for the entire series. At low temperatures, crossover to
incoherent hole hopping accompanied by a stronger distance dependence of the charge
transport is observed in long Fc‒Pn‒C60 (n = 2‒4). Being able to tune the ET rate in
donor‒acceptor systems is another property which is highly desirable for applications of
molecules in actual devices. Here, in the long Pn‒C60 (n = 4, 6) dyads, we demonstrate
the possibility of varying the rate of electron transfer between the photoexcited
porphyrin oligomer (1Pn
*) and the fullerene (C60) by either optical or chemical control
of the conformation of the porphyrin chain. Additionally, we show that temperature
could potentially be used to control the conformation of the porphyrin oligomer. Below
170 K, all studied systems Pn, Pn‒C60 and Fc‒Pn‒C60 spontaneously form
highly‒ordered planar aggregates.
The thesis also discusses photoinduced excitation energy transfer (EET) in the Pn
systems and two anthracene dendrimers. In the latter, despite weak through‒bond
electronic coupling, signs of an ultrafast EET between the anthracene dendrons are
observed by time‒resolved fluorescence anisotropy. For the Pn systems, pump
intensity‒dependent transient absorption measurements reveal at early times (< 30 ps)
singlet‒singlet annihilation that is the characteristic of partially coupled systems.
Keywords: electron transfer, energy transfer, exciton coupling, conformational
analysis, molecular wire, self‒assembly, conjugated porphyrin oligomers, anthracene
dendrimers, fs spectroscopy, ps spectroscopy, fluorescence anisotropy
vi
LIST OF PUBLICATIONS
The thesis is based on the work described in the following papers:
1
I. Hopping vs. Tunneling Mechanism for Long‒Range Electron Transfer in
Porphyrin Oligomer Bridged Donor‒Acceptor Systems
Mélina Gilbert Gatty, Axel Kahnt, Louisa J. Esdaile, Marie Hutin, Harry L. Anderson
and Bo Albinsson,
J. Phys. Chem B.2015, DOI: 10.1021/jp5115064.
II. Conformational Gating of Charge Separation in
Porphyrin‒Oligomer‒Fullerene Systems
Mélina Gilbert, Louisa J.Esdaile, Marie Hutin, Katsutoshi Sawada, Harry L. Anderson
and Bo Albinsson,
J. Phys. Chem C 2013, 117 (50), 26482‒26492.
III. Self‒Assembly of Linear Porphyrin Oligomers into Well‒Defined
Aggregates
Joakim Kärnbratt, Mélina Gilbert, Johannes K. Sprafke, Harry L. Anderson and Bo
Albinsson,
J. Phys. Chem C 2012, 116 (37), 19630‒19635.
IV. Conjugated Anthracene Dendrimers with Monomer‒Like Fluorescence
Karl Börjesson, Mélina Gilbert, Damir Dzebo, Bo Albinsson and Kasper Moth-Poulsen,
RSC Adv. 2014, 4, 19846‒19850.
V. Singlet‒Singlet Annihilation in Linear and Circular Butadiyne‒linked
Porphyrin Oligomers
Mélina Gilbert Gatty, Joakim Kärnbratt, Harry L. Anderson and Bo Albinsson,
Manuscript in preparation.
1 Papers are published before August 2014 with the name Mélina Gilbert and after 2014 with the
name Mélina Gilbert Gatty.
vii
CONTRIBUTION REPORT
Paper I. Performed the temperature‒dependent steady‒state fluorescence
measurements. Performed analysis and interpretation of the fluorescence and transient
absorption data. Wrote the paper.
Paper II. Designed and performed all experiments. Performed analysis and
interpretation of the fluorescence data. Wrote the paper.
Paper III. Performed some of the temperature‒dependent absorption measurements
and helped in writing in the paper.
Paper IV. Designed and performed the steady‒state and time‒resolved fluorescence
anisotropy measurements. Performed analysis and interpretation of the fluorescence
anisotropy data. Wrote the paper except the synthesis part.
Paper V. Designed and performed some of the power‒dependent femtosecond
transient absorption measurements. Performed analysis and interpretation of the
transient absorption data. Wrote the manuscript.
PUBLICATIONS NOT INCLUDED IN THIS THESIS
Photo‒induced Charge and Energy Transfer in Molecular Wires
Mélina Gilbert and Bo Albinsson,
Chem. Soc. Rev. 2015, 44, 845‒862.
Steady‒state and Time‒resolved Thioflavin‒T Fluorescence can report on
Morphological Differences in Amyloid Fibrils formed by Aβ (1‒40) and Aβ
(1‒42)
David J. Lindberg, Moa S. Wranne, Mélina Gilbert Gatty, Fredrik Westerlund and Elin
K. Esbjörner,
Biochem. Biophys. Res. Com. 2015, 458, 418‒423.
Opportunities in nanometer sized Si wires for PV Applications
Jaswinder Kaur Mann, Rufi Kurstjens, Geoffrey Pourtois, Mélina Gilbert, Frederic
Dross and Josef Poortmans,
Prog. Mater. Sci. 2013, 58, 1361–1387.

viii
ix
TABLE OF CONTENTS
1 INTRODUCTION 1
2 BEING INSPIRED BY NATURE 7
2.1 THE NATURAL PHOTOSYNTHESIS: A COMPLEX MACHINERY 8
2.2 AVOIDING COMPLEXITY BY CREATING SIMPLE MODEL SYSTEMS 11
2.2.1 Towards artificial photosynthesis 12
2.2.2 Towards molecular wires for long‒range electron and energy transfer 13
2.3 TAKING THE “NM TO MACROSCOPIC SCALES” STEP WITH MOLECULES USING
SELF‒ASSEMBLY 19
2.4 CONJUGATED PORPHYRIN OLIGOMERS 20
2.4.1 Motivation 20
2.4.2 Porphyrin‒based molecular wires 22
3 THEORY 27
3.1 LIGHT‒MATTER INTERACTIONS 28
3.2 THE ELECTRONIC EXCITED STATE AS A NEW MOLECULE 32
3.2.1 Excited‒state deactivations 32
3.2.2 Rates, lifetimes and quantum yields 34
3.3 ELECTRON TRANSFER THEORY 36
3.3.1 Marcus theory 36
3.3.2 Electron transfer in donor‒bridge‒acceptor systems 40
3.4 ENERGY TRANSFER THEORY 41
4 PUT THE THEORY TO WORK: IN PRACTICE 45
4.1 STEADY‒STATE ABSORPTION AND EMISSION SPECTROSCOPIES 46
4.1.1 Steady‒state absorption 46
4.1.2 Steady‒state emission 47
4.2 TIME‒RESOLVED SPECTROSCOPIES 49
4.2.1 Lasers 49
4.2.2 Transient absorption 50
4.2.3 Time‒resolved emission 53
4.3 FLUORESCENCE ANISOTROPY SPECTROSCOPY 56
4.4 DATA ANALYSIS 58
4.4.1 Individual fitting 59
4.4.2 Global decay fitting 59
5 PHOTOINDUCED ELECTRON TRANSFER IN PORPHYRIN
OLIGOMER‒BASED DONOR‒ACCEPTOR SYSTEMS 63
5.1 THE SYSTEM STUDIED: BUTADIYNE‒LINKED PORPHYRIN OLIGOMERS 65
5.2 IDENTIFYING THE CHARGE TRANSPORT MECHANISM BEHIND THE “WIRE‒LIKE”
PROPERTIES OF PORPHYRIN‒BRIDGED TRIADS 66
x
5.2.1 Direct versus stepwise charge separation in Fc‒Pn‒C60 67
5.2.2 Combining transient absorption with time‒resolved fluorescence to
investigate formation and decay of radical species 71
5.2.3 Hopping versus tunneling recombination mechanisms 73
5.2.4 Concluding remarks 74
5.3 CONFORMATIONAL CONTROL OF ELECTRON TRANSFER RATES AND EFFICIENCY IN
PORPHYRIN‒FULLERENE DYADS 75
5.3.1 Optical vs chemical vs physical control of conformation 75
5.3.2 Optical gating of electron transfer 77
5.3.3 Chemical gating of electron transfer 83
5.3.4 Temperature‒induced self‒assembly of Pn, Pn‒C60, Fc‒Pn‒C60 molecules 85
5.3.5 Concluding remarks 89
6 EXCITON ENERGY TRANSFER: A COMPARISON BETWEEN WEAKLY
AND STRONGLY CONJUGATED MULTICHROMOPHORE SYSTEMS 91
6.1 ANTHRACENE DENDRIMERS 93
6.2 INFLUENCE OF LINKER TOPOLOGY ON THE PHOTOPHYSICAL PROPERTIES:
ANTHRACENE DENDRIMERS VS PORPHYRINS OLIGOMERS 93
6.3 RESOLVING EXCITATION ENERGY TRANSFER IN ANTHRACENE DENDRIMERS AND
PORPHYRINS OLIGOMERS 96
6.3.1 Fluorescence anisotropy as a probe for energy migration in anthracene
dendrimers 96
6.3.2 Singlet‒singlet annihilation as a probe for energy migration in porphyrin
oligomers 101
6.3.3 Concluding remarks 104
7 CONCLUSION 105
8 ACKNOWLEDGEMENTS 109
9 REFERENCES 111

xi
LIST OF ABBREVIATIONS AND SYMBOLS
ET Electron Transfer
EET Excitation Energy Transfer
PET Photoinduced Electron Transfer
D‒A Donor‒Acceptor
D‒B‒A Donor‒Bridge‒Acceptor
RC Reaction Center
PSI Photosystem I
PSII Photosystem II
P Porphyrin
C Carotenoid
Q Quinone
OPE Oligo‒p‒Phenylene Ethynylene
fln Oligo‒p‒fluorene
phn Oligo‒p‒phenylene
xyn Oligo‒p‒xylene
Pn Butadiyne‒linked zinc porphyrin oligomers
C60 Fullerene
Fc Ferrocene
TA Transient Absorption
SYMBOLS IN SPECTROSCOPY λ Wavelength
ν Frequency
ν Wavenumber
c Speed of light
h Planck’s constant
ε Molar absorptivity
τ Lifetime
Φ Quantum yield
k Rate constant
SYMBOLS IN ELECTRON TRANSFER ∆G
0 Driving force
∆G≠ Activation energy
λ Reorganization energy
V Electronic coupling
kB Boltzmann’s constant
∆E Tunneling energy barrier
RDA Donor‒Acceptor separation distance
β Attenuation factor

xii

1
1 INTRODUCTION
2
nvironment and Energy are two main challenges of this 3rd
Millennium. While
both problems arise from the way we have produced and consumed energy, they
are now increasingly threatening the way we live, or even more, life and civilization on
Earth.
Today the annual world energy consumption is estimated to ca. 140 x 103
TWh and is
forecasted to reach 195 x 103
TWh by 2030.1 At present, most of this energy comes
from burning fossil fuels like oil and coal, which also generates 70 % of the carbon
dioxide (CO2) emissions that drive climate change. In the last twenty years, raising
concerns on the climate change, reflections on our place in the natural world and our
obligations to the generations to come, have come to the general agreement: we need
urgently environmentally friendly and carbon‒neutral energy sources to limit climate
change. This problem is not a new one and one could say that we have been slow to
respond to it. As featured by Richard Hamblyn in The Art of Science: A natural history
of ideas,2 already in 1895 in an address presented at the Royal Academy of Science,
Svante Arrhenius foresaw the effects of increasing concentration of atmospheric CO2 on
the greenhouse effect and on climate, i.e. upon the surface’s temperature of the Earth.
He estimated that doubling of the CO2 concentration in the atmosphere will raise the
earth’s temperature by 5 ºC.3 Arrhenius did not explicitly link the use of fossil fuels to
the climate change. It was only in the late 1980s that James E. Hansen affirmed publicly
at the United States Congress the causal association between excessive burning of fossil
fuels (i.e. build up of atmospheric CO2 and other gases) and global warming.4 His
statement at the Congress made the headline in the New York Times: “Global Warming
Has Begun, Expert Tells Senate”.5 Since then the use of polluting energy sources such
as fossil fuels has been frequently debated and gained attention of the public realm.
Fossil fuel resources are also not inexhaustible. Although it has taken millions of years
for natural photosynthesis to accumulate such sources, in only 100 years most of the
reserves have been consumed by mankind.
But we are lucky: the Earth is flooded everyday by a considerable amount of sunlight.
To give some numbers, the solar energy that hits the Earth corresponds to ca. 108 x 107
TWh per year. In comparison to our current energy use, this gives a ratio between the
annual solar flux and the current demand equal to ca. 7740. Solar light energy is clearly
enough to meet our current and future needs. Thus, one solution to our energy and
environmental problems would be to use sunlight to produce our fuels, i.e. solar fuels.
Here one of the challenges arises from the fact that sunlight is dispersed and hence
needs to be “captured” in an effective way. Moreover, while solar energy is “free”, the
development of systems which enable conversion of solar energy into other forms of
energy such as electrical, chemical or electrochemical comes with a certain cost. In the
last 20 years, multiple technologies have been developed to harvest solar energy and
convert it into electricity, such as semiconductor‒based solar cells6 (e.g. silicon or
gallium‒arsenide based ones) or dye‒sensitized solar cells7-9
(DSSCs). However, most
of them possess considerable drawbacks that hinder their global deployment. In short,
the higher energy cost of such technologies compared to fossil fuels and the lack of
E
3
storage systems for electricity either for mobile applications (e.g. cars) or during dark
periods are two main drawbacks that makes us still rely on the past photosynthesis (i.e.
biomass and fossil fuels). But we can be hopeful just at the time when the first
round‒the‒world solar flight, Solar Impulse®, is taking place.10
We are already able to
convert light‒to‒electricity and need to perform this conversion in a cheaper and more
efficient way while adding versatility in the nature of the outcome energy (e.g.
chemical, electrochemical).
Turning sunlight into other forms of energy is what Nature has been doing for millions
of years via the photosynthesis in green plants and bacteria. Any photosynthetic system
is able to convert sunlight into chemical energy. This conversion is realized via a series
of light triggered step‒wise energy and electron transfer processes between different
chromophores. The final outcome of this “chain” of reactions is a long‒lived
charge‒separated state with sufficient potential energy for water oxidation into
molecular oxygen and carbon dioxide reduction into sugar. All reactions rely on a rather
complex machinery which, in term of conversion efficiency, is also rather inefficient
(often less than 1%).11
But Nature can be an excellent source of inspiration for
production of solar fuels such as hydrogen gas H2. Indeed water oxidation produces not
only molecular oxygen but also hydrogen ions (i.e. protons) whose in an artificial
photosynthetic system could be further reduced to generate hydrogen gas. In that way,
hydrogen gas could be produced from water and sunlight, and could remain cheap to
produce. Part of the storage problem from which the already existing
light‒to‒electricity conversion technologies suffer (vide supra) could also be solved
since energy is then stored chemically (i.e. in the form of chemical bonds) in a synthetic
energy carrier, e.g. hydrogen. Finally, combustion of hydrogen only produces water.
Artificial photosynthesis has the potential to solve both the environmental and energy
challenges. Giacomo Ciamician, an Italian professor of Chemistry was among the first
to publicly express his beliefs in artificial photosynthesis for solar fuels’ production.
Although he had only his balcony to test his idea on photoinduced reactions, Giacomo
Ciamician saw the ingenuity in the green plants' photosynthesis and its technological
potential. In 1912, he gave a rather avant gardist lecture entitled “The Photochemistry of
the Future” in which some statements still holds today.12
After raising the problem of
limited reserves of coal (today fossil fuels), he proposed the production of fuels via
artificial photochemical reactions and pointed out a first problem “how to fix solar
energy through suitable photochemical reactions. To do this it would be sufficient to be
able to imitate the assimilating processes of plants” which is exactly the aim of
artificial photosynthesis. He also postulated the existence of photocatalyst that could
enable endo‒energetic processes such as the production of oxygen from a water and
carbon dioxide mixture. In 2015, more than hundred years after Ciamician’s lecture,
efficient artificial photosynthetic devices are yet not available.
Although we have now a much better understanding of the natural photosynthesis,13-16
designing molecular systems that mimic the natural sequence of energy and electron
transfer processes is not so simple to accomplish; and even more challenging is moving
4
to actual functioning artificial photosynthetic devices. The designed molecular systems
must (i) significantly absorb over the visible part of the solar spectrum (ii) possess good
electron donor and acceptor entities enabling the formation of a long‒lived
charge‒separated state and (iii) possess properties for integration in devices (e.g.
self‒assembly properties or covalent interactions with other materials). To fulfill all
these criteria, one relies on supramolecular (i.e. multicomponent) systems and
coordination compounds (e.g. ruthenium, platinum complexes).17-20
Thus, over the last
two decades, considerable efforts have been devoted to the synthesis of electron
donor‒acceptor (D‒A) mimics of the more complicated natural photosynthetic
system.17, 19, 21-22
Most of these D‒A systems have been primarily investigated with the
aim of creating charge separated states that live long enough to drive secondary redox
reactions.23-27
From a fundamental point of view, simple donor‒acceptor model systems
are also ideal systems to get more insights into excitation energy (EET) and electron
(ET) transfer processes, i.e. to sort out the molecular parameters (e.g. geometry,
electronic structure) that govern their kinetics and efficiencies. In the literature, a vast
variety of D‒A supramolecular systems has been reported employing e.g. porphyrins,28-
31 phthalocyanines,
32 phenotiazines,
33-36 coordination compounds
19-20, 37 as electron
donor and e.g. fullerenes,28, 38-42
graphene,43-44
perylene imides33-34
as electron acceptor.
Exploring how charge or energy moves in donor‒acceptor systems provides guideline
knowledge that not only applies to the design of efficient molecular systems for
artificial photosynthesis, but also the design of molecular scale electronics. The 20th
century may be seen as the golden era of the silicon‒based technology for information
processing. However, at the dawn of the 21st century, this technology seems to have
already reached some limitation in term of device size with the smallest transistor
reported at 22 nm (Intel® 22 nm Technology). It is difficult to decrease further the size
of a single transistor without the use of expensive technologies (e.g. e‒beam
lithography). Part of the size limitation lies in the approach used to produce such
structures, that is conventionally a top down approach namely photolithography. How to
go beyond the 22 nm? This question has attracted much interest since there are many
reasons why creating smaller devices will be advantageous. First, this allows confining
more devices in a smaller space, hence realizing more functions. Second, “constructing
smaller” means also using less material which saves natural resources. One answer to
the above question is to use molecules to replace components (e.g. wires,45
transistors,46
switches47-48
) in today’s electronics.49-52
Indeed the size of molecules is well beyond the
22 nm and ranges from few angstroms to several tens of angstroms. Even macroscopic
size can be achieved with polymers. The way molecules can be assembled is also of
interest. They assemble from the bottom up. In other words, assembling a
molecular‒based device will be similar to realizing a LEGO® construction. Even better,
what if these molecules could self-assemble (i.e. spontaneously come together)? Here
Nature is also inspiring in the way that all molecular components in the natural
photosynthetic system come together to realize rather complex functions.
5
Regardless of the targeted applications, either for artificial photosynthesis or molecular
electronics, of utmost importance is to understand how the donor and acceptor
components in supramolecular systems interact. It means identifying the molecular
properties that control the signal transmission between the donor and the acceptor, i.e.
how fast electrons or excitation energy move between the donor and acceptor.
Ultimately such studies, either theoretical or experimental, provide essential knowledge
for applied research on how to design controllable molecular systems in which one can
tune the flow of electrons or energy.
In this work, two series of multichromophoric systems have been investigated. In
particular, their photophysical properties have been characterized, and their ability to
mediate either electron and/or energy transport has been probed. In these systems, the
excitation energy (EET) and electron transfer (ET) reactions were triggered using light
excitation, and hence are so called photoinduced. The first series is a series of zinc
porphyrin oligomers linked at their meso positions by 1,3‒butadiyne denoted Pn,
spanning from monomer P1 (2.4 nm) to octamer P8 (12 nm). These conjugated
porphyrin oligomers have a rod‒like structure but are not strictly conformationally
constrained systems. The second series consists of two generations of conjugated
anthracene dendrimers denoted G1 and G2 containing 3 and 9 anthracene units,
respectively. In contrast to the linear conjugated porphyrin oligomers, these anthracene
dendrimers are structurally constrained 3D systems due to large steric hindrance. In
general, the objective of this thesis is to gain more insights on the relationship between
molecular properties (e.g. electronic structure, conformational distribution) and
electronic communication in multichromophoric systems.
The papers included in this thesis are presented in two acts. The first act discusses
Papers I-III and focuses on photoinduced electron transfer reactions in donor‒acceptor
systems employing conjugated porphyrin oligomers as the photoactive electron donor
(Chapter 5). Paper I introduces a series of donor‒bridge‒acceptor (D‒B‒A) systems,
Fc‒Pn‒C60, in which conjugated porphyrin oligomers Pn of different lengths (n = 1‒4,
6) bridge a ferrocene (Fc) donor group and a fullerene C60 acceptor group. Our aim was
to establish the causal relation between the observed wire‒like properties (i.e. weakly
distance‒dependent electron transfer rates) and the nature of the charge transport
mechanism (i.e. tunneling or hopping). Following Paper I, Papers II-III are discussed.
Both papers investigate conformational dynamics effects on the photophysical
properties of conjugated porphyrin oligomers. Common goal of these two papers was to
identify how such effects might be of use to control intra‒ or inter‒molecular processes:
electron transfer in long donor‒acceptor dyads (Pn‒C60) in Paper II and self-assembly of
Pn in Paper III, respectively. The second act is based on the results in Papers IV and V
and compares the photophysical properties of the linear conjugated porphyrin oligomers
with the ones of the anthracene dendrimers (Chapter 6). Special emphasis is put on
understanding the influence of the linker topology on inter‒chromophore
communication, i.e. how individual chromophores communicate electronically with
each other.

6

7
2 BEING INSPIRED BY NATURE
8
ature possesses remarkable machineries for conversion of solar energy into
chemical energy and hence, provides hints for fuel production based on solar
energy. Taking the green plants' photosynthesis as an example, this chapter attempts to
give first a brief description of the natural photosynthesis. We will see that
photosynthesis is a rather complex and interdisciplinary phenomenon that is triggered
by a multitude of photoinduced energy transfer coupled to electron transfer reactions.13
Since the natural photosystem is quite complex, approaches to avoid complexity in
mimicking molecular systems have been developed. The second part of this chapter
describes some of these approaches in view of applications in artificial photosynthesis
and molecular electronics. Further, self‒assembly is described as a tool to construct
artificial molecular devices, such as devices capable of artificial photosynthesis.
Finally, porphyrin‒based molecular wires are introduced as simple model systems for
photoinduced electron and energy transfer studies.
2.1 THE NATURAL PHOTOSYNTHESIS: A COMPLEX MACHINERY
In any natural photosynthetic systems, photosynthesis starts with absorption of light by
an antenna system, typically containing chlorophyll molecules which have high molar
absorptivity ~105 M
-1cm
-1. The energy stored in the excited states of these molecules is
then funneled by fast energy transfer to a reaction center (RC). This occurs in a stepwise
manner, i.e. the excitation energy moves from one chromophore to another, and reaches
the RC within 10‒100 ps.14-15, 53
In the reaction center, the excitation energy initiates a
cascade of electron transfer reactions which creates a long‒lived charge‒separated state.
Thus, it is in the RC that the electronic excitation is converted into an electrochemical
potential. The process then continues with the so‒called “dark” reactions of
photosynthesis generating a chemical potential. For oxygenic photosynthetic systems,
this refers to the oxidation of water into oxygen and protons and the reduction of carbon
dioxide to carbohydrates (or sugars) or other kinds of chemically stored energy.
The green plants' photosynthesis
In green plants' photosynthesis, water oxidation and carbon dioxide reduction require
two reactions centers, known as Photosystem I (PSI) and Photosystem II (PSII), to work
in series. In PSII, water oxidation occurs and generates molecular oxygen and protons,
while reduction of carbon dioxide into sugar is performed in PSI. The overall
photosynthetic process often called “Z‒scheme” is illustrated in Figure 2.1.
N
9
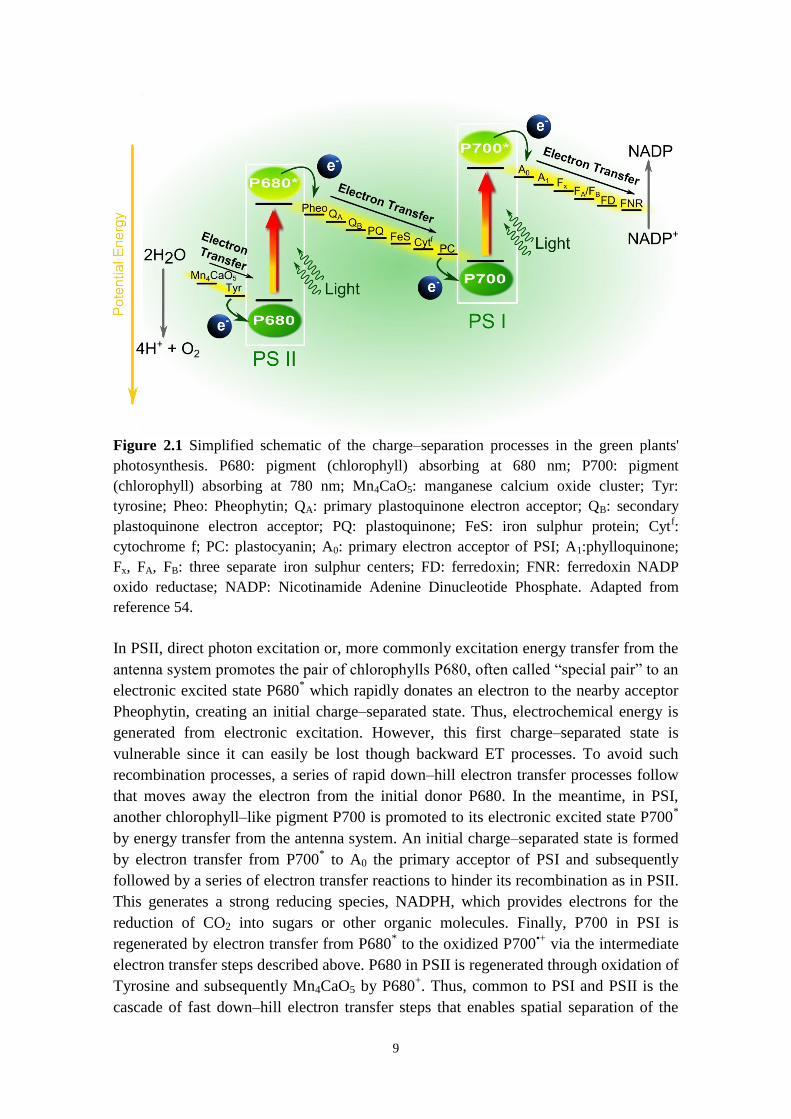
Figure 2.1 Simplified schematic of the charge‒separation processes in the green plants'
photosynthesis. P680: pigment (chlorophyll) absorbing at 680 nm; P700: pigment
(chlorophyll) absorbing at 780 nm; Mn4CaO5: manganese calcium oxide cluster; Tyr:
tyrosine; Pheo: Pheophytin; QA: primary plastoquinone electron acceptor; QB: secondary
plastoquinone electron acceptor; PQ: plastoquinone; FeS: iron sulphur protein; Cytf:
cytochrome f; PC: plastocyanin; A0: primary electron acceptor of PSI; A1:phylloquinone;
Fx, FA, FB: three separate iron sulphur centers; FD: ferredoxin; FNR: ferredoxin NADP
oxido reductase; NADP: Nicotinamide Adenine Dinucleotide Phosphate. Adapted from
reference 54.
In PSII, direct photon excitation or, more commonly excitation energy transfer from the
antenna system promotes the pair of chlorophylls P680, often called “special pair” to an
electronic excited state P680* which rapidly donates an electron to the nearby acceptor
Pheophytin, creating an initial charge‒separated state. Thus, electrochemical energy is
generated from electronic excitation. However, this first charge‒separated state is
vulnerable since it can easily be lost though backward ET processes. To avoid such
recombination processes, a series of rapid down‒hill electron transfer processes follow
that moves away the electron from the initial donor P680. In the meantime, in PSI,
another chlorophyll‒like pigment P700 is promoted to its electronic excited state P700*
by energy transfer from the antenna system. An initial charge‒separated state is formed
by electron transfer from P700* to A0 the primary acceptor of PSI and subsequently
followed by a series of electron transfer reactions to hinder its recombination as in PSII.
This generates a strong reducing species, NADPH, which provides electrons for the
reduction of CO2 into sugars or other organic molecules. Finally, P700 in PSI is
regenerated by electron transfer from P680* to the oxidized P700
•+ via the intermediate
electron transfer steps described above. P680 in PSII is regenerated through oxidation of
Tyrosine and subsequently Mn4CaO5 by P680+. Thus, common to PSI and PSII is the
cascade of fast down‒hill electron transfer steps that enables spatial separation of the
10
charges (electron and hole). To give a number, electrons and holes are separated by ~30
Å within less than 1 ns. This of course has an energy cost, but creates charge‒separated
states that live long enough to carry out the dark reactions of photosynthesis which are
typically slow (i.e. tens of seconds) due to their dependence on molecular diffusion.
Parts of the beauty of the natural photosynthesis lay in the way that energy transfer
reactions are coupled to electron transfer reactions to adjust the ultrafast dynamics of
light harvesting to the slow biological reactions. The natural chromophores not only
harvest light efficiently but are also compatible for interaction with the rest of the
systems.55
Here “compatible for interaction” refers to their specific arrangement that
enables efficient and directed energy transfer in the antenna system and down‒hill
electron transfer in the reaction center. For example, the groups of Van Grondelle,56-57
Scholes and Fleming16
have demonstrated that structural organization of the
chromophores in the antenna systems is one determining factor for the directionality
and the rates of energy transfer. Along with the large number of components involved,
all the structural requirements turn any natural photosynthetic system into a complex
machinery difficult to reproduce artificially. Further, one may wonder why such
complex machinery is required for photosynthesis.
The water oxidation reaction
On the PSII side, water oxidation into molecular oxygen and protons is a four‒electron
process (reaction 2.1). It involves two water molecules and implies the removal of four
electrons (i.e. two electrons per water molecule) and the transfer of four protons.
2H2O → O2 + 4H+ + 4e
- ; E
0 = + 0.82 eV vs NHE at pH 7 2.1
This means that at least four photons are required to reach sufficient electrochemical
potential, and hence drive the dark reactions in PSII. In other words, four successive
photoinduced charge separation should take place at a single reaction center. Once more
the natural photosynthetic system is remarkable, since the catalyst Mn4Ca cluster can be
oxidized stepwise by Tyr+
and the intermediates generated live long enough for oxygen
to be produced after four charge‒separation processes. It has also been shown that the
natural photosynthetic system is able to adapt the antenna size per reaction center
depending on the light conditions to guarantee an optimal rate of photo‒excitation of the
reaction center.58
Finally, it is interesting to have a look to the photosynthetic overall
efficiency. As mentioned earlier, PSI and PSII work in series, this means that in total,
eight photons are required to release one molecule of oxygen and reduce one carbon
dioxide molecule. Hence, for the formation of one glucose molecule C6H12O6, 48
photons need to be absorbed. Not only the number of absorbed photons matters,
formations of the photo-excited states P680* and P700
* impose also some conditions on
the energy of the absorbed photons which must exceed 1.83 eV (i.e. λexc < 680 nm) in
order to excite P680. In term of energy conversion efficiency, both the large number of
photons and the type of photon (i.e. photons of about 1.8 eV) required put considerable
11
limitations on the overall photosynthetic efficiency with a maximum of ~9 %.
Additional losses induced by photodamage and saturation (i.e. excessive excitation)
brings the energy‒conversion efficiency of the natural photosynthesis down to few
percent.11
Thus, considering the fact that photosynthesis only requires sunlight as power
and water and carbon dioxide as raw materials to produce fuels, it can be seen as a
successful system for energy production and storage. However, it is of low efficiency.
If artificial photosynthesis should become one viable solution for renewable energy
production, much simpler molecular systems need to be developed and a more efficient
light‒to‒chemical energy conversion needs to be achieved. Another important
difference is the reaction of interest which is the water splitting reaction not into protons
and molecular oxygen, but into molecular hydrogen and oxygen using sunlight (reaction
2.2).
2H2O 4 h c→ 2H2 O2 ; G
0 4. 2 e 2.2
If the electronic absorption spectrum of water and the solar spectrum did overlap,
dissociation of water could take place by direct absorption of sunlight. However, this is
not the case (“fortunately”): water absorbs significantly only in the far UV at
wavelengths shorter than 170 nm. The most convenient (or less energy costly) way to
realize reaction 2.2 using sunlight is via two multi‒electron processes,
2H2O + 2e- → H2 + 2OH
- ; E
0 = ‒ 0.41 eV vs NHE at pH 7 2.3
2H2O → O2 + 4H+ + 4e
- ; E
0 = + 0.82 eV vs NHE at pH 7 2.4
Here in reaction 2.4, one can recognize the water oxidation reaction that occurs in the
natural photosystem PSII. As it happens in PSII, four successive photoinduced charge
separations will be necessary. Reactions 2.3 and 2.4 put also some conditions on the
HOMO‒LUMO gap of the chromophore with a thermodynamic threshold of 1.23 eV.
Further, if we assume that each reaction has a driving force of 0.3 eV, chromophores
that have a HOMO‒LUMO gap of more than 1.83 eV (i.e. preferably absorbs in the
visible region of the electromagnetic spectrum at wavelengths below 677 nm) should be
ideal. Note that this last condition is fulfilled by the special pair P680 in PSII (vide
supra), hence the numerous studies on synthetic dyes which are P680‒like molecules.
2.2 AVOIDING COMPLEXITY BY CREATING SIMPLE MODEL
SYSTEMS
Althougth considerable knowledge on the structures of natural photosystems has been
acquired in the last 20 years, as illustrated by the number of papers on the crystal
structure of e.g. PSII presenting a continuous improvement in resolution,59-67
it remains
impossible to envisage an identical reproduction of the natural complexes using current
12
chemical synthesis. Nevertheless, as discussed above, the natural light‒harvesting
antenna and reaction center structures can be of inspiration for developing
light‒harvesting devices and photoinduced charge separation devices. Nature provides
proven examples of the utility of combining several molecular systems in an organized
architecture to realize different photoinduced reactions. Hence, considerable efforts
have been devoted to the construction of simpler multi‒component systems mimicking
of natural photosynthetic systems. These simpler systems not only provide means to
study the fundamentals of energy and electron transfer processes but also allow for
exploration of the different functions that can be photoinduced in molecules (e.g. wires,
switches and transistors) depending on how molecules make use of the photon energy.
In the design of electron donor‒acceptor systems, the sometimes called supramolecular
approach has been extensively used. This approach presents several advantages. By
linking covalently donor and acceptor molecular groups, one avoids the problem of
having diffusion limited EET and ET reactions and replaces intermolecular
communication by intramolecular communication. Another advantage is the sufficient
structural constraint that such D‒A molecules possess. This allows for control of both
donor‒acceptor distance and orientation.
2.2.1 TOWARDS ARTIFICIAL PHOTOSYNTHESIS
To mimic the charge‒separation function of the reaction center, a primary requirement
is an electron donor that absorbs efficiently in the visible region and a suitable electron
acceptor. The second requirement is the formation of a long‒lived charge‒separated
state in which electrochemical potential is stored for sufficiently long time to carry out
slower chemical reactions (vide supra). Among the first molecular systems mimicking
the initial charge separation step of photosynthesis was a simple donor‒acceptor dyad,
P‒Q, consisting of a porphyrin molecule (P) as electron donor covalently linked to a
quinone (Q).68
Upon photo‒excitation of the porphyrin, the charge‒separated state,
P•+
‒Q•-, was generated. This charge‒separated state could hold 1.4 eV, i.e. most of the
intrinsic energy of the porphyrin singlet excited state (1.9 eV). However, P•+
‒Q•- was
too short‒lived (τ = 100 ps) to carry out redox reactions. Recalling how in Nature
long‒lived charge separated state are generated, triad systems have been synthesized
that employ a secondary donor/acceptor to further separate spatially electrons and holes.
Such approach was first used by the groups of Gust and Moore who reported a
carotenoid‒porphyrin‒quinine triad (C‒P‒Q) obtained by appending to P‒Q an
additional electron donor, the carotenoid group (C).69
Upon photo‒excitation of the
porphyrin in C‒P‒Q, an initial charge‒separated state, C‒P•+
‒Q•-, forms and
subsequently undergoes charge‒shift creating the final long‒lived charge‒separated
state, C•+
‒P‒Q•-
(τ = 57 ns). They also demonstrated that further addition of electron
donors and acceptors to form tetrad (C‒P‒Q1‒Q2) and pentad (C‒ZnP‒P‒Q1‒Q2)
could lead charge‒separated states with lifetimes as long as 55 μs for the pentad with a
quantum yield of 0.83.23
Since these first reports, a large number of D‒A systems have
been reported in literature aiming at: generating long‒lived charge‒separated states
13
whose energy can be used to perform water oxidation;70-72
coupling artificial antenna
and reaction center functions within one molecular system;73-74
coupling electron
transfer and proton transfer;27, 75-77
coupling the one‒photon photoinduced charge
separation with the multi‒electron water splitting (reaction 2.4).18, 26, 78
2.2.2 TOWARDS MOLECULAR WIRES FOR LONG‒RANGE ELECTRON AND
ENERGY TRANSFER
Just as donor‒acceptor systems can be used in artificial reaction centers to convert light
into electrochemical potential, they can also be applied in molecular electronics for
information exchange. In this context, the simplest electronic component is probably the
wire whose function is to electrically interconnect two devices. Thus, it is not surprising
that researchers have first investigated the possibility of creating wires based on
molecules instead. By covalently linked a donor‒acceptor couple with a molecular
bridge (B), donor‒bridge‒acceptor (D‒B‒A) systems can be formed that are
comparable to an electrical circuit where D and A are the input/output components and
B represents the electrical interconnection. As in electrical circuitry, achieving the
desired output e.g. voltage or intensity requires an understanding of how the different
components operate not only individually but also when connected to each other. This
knowledge can be used to control the output. Likewise, the chromophores (D, B, A) can
be studied individually. When assembled in D‒B‒A, the weak coupling between the
donor and acceptor imposed by the bridge separation makes it possible to selectively
excite the donor or the acceptor. This may trigger electron or/and energy transfer
reactions. The final “output” is then either the formation of a long‒range
charge‒separated state D•+‒B‒A
•- in the case of electron/hole transfer or emission of a
photon by the acceptor in case of energy transfer.
In the viewpoint of molecular wire applications, the goals are slightly different from the
ones of artificial photosynthesis. A first goal is the ability to transport charge or energy
over long distances, i.e. few tens of nanometers with high efficiency. In this regard,
most studies aim at establishing knowledge on the appearance of weakly
distance‒dependent wire‒like charge (or energy) transport in molecules. In practice, the
distance dependence of ET or EET in D‒B‒A is investigating by measuring the rate of
ET or EET as a function of the donor‒acceptor distance, RD‒A. RD‒A is simply varied by
modifying the number of rigid repeating units composing the bridge, i.e. “the molecular
wire”. In the case of ET, the results of such distance dependence studies are often
presented in a plot of ln kET vs RD‒A and a single exponential decay constant in
agreement with the McConnell model (vide infra) called the attenuation factor β is
reported. The β‒values describe how fast the electron transfer rate decreases with the
distance; hence ideally values as close as to zero as possible are desirable as they would
enable charge transport over almost infinite distances. In the literature, a multitude of
D‒B‒A systems capable of electron transfer have been reported. Among them, D‒B‒A
systems employing π‒conjugated bridges consisting of identical repetitive molecular
14
motifs covalently connected have emerged as the most promising candidates for
long‒range energy/charge transport. For a list of D‒B‒A systems employing
π‒conjugated bridges, please see e.g. our recent review “Photo‒induced Charge and
Energy Transfer in Molecular Wires”.79
The β‒values in these D‒B‒A systems span a
wide range from 0.8 Å-1
to < 0.01 Å-1
.28-29, 33-34, 39, 80-87
However, it was realized quite
early that the information contained in these β‒values was of rather limited use when it
came to provide guidelines for designing molecular systems with pre‒defined
conduction properties. For the same bridge structure, several studies reported different
β‒values and hence revealing the non‒specificity of the β‒value to a particular bridge
structure and instead its dependence on the entire D‒B‒A ensemble.29, 34, 40, 82, 86, 88-89
The β‒values are not directly comparable to the conductivity (or resistance), i.e. the
material‒specific property used in electronic circuitry. Thus, in the last ten years, focus
has been put on understanding the role played by the molecular bridge in charge
transport, i.e. tunneling energy gap effects. A second goal that is seeked in molecular
wire applications is the possibility to control charge or energy transport. In this context,
conformational effects on electron energy transfer rates in D‒B‒A molecules have
attracted much interest. The following sections provide examples of D‒B‒A molecules
in which tunneling energy gap effects and conformational effects on charge and energy
transport could be investigated in a systematic way.
Tunneling energy gap effects in D‒B‒A molecules
Several groups have devoted much effort to the design of D‒B‒A systems that enables
to elucidate the role played by the bridge in charge transport. One important outcome of
these studies is the experimental evidence of tunneling energy gap effects that explain in
part why β‒values are not bridge‒specific. The bridge energetics does influence the
kinetics (i.e. distance dependence of charge transport) and the nature of the charge
transport between the donor and acceptor, in accordance with the prediction of the
McConnell model (equations 3.24 and 3.25). By bridge energetics, one designate the
tunneling energy gap between the donor and bridge for electron transfer ∆EDB (or
energy gap between the acceptor and the bridge for hole transfer ∆EBA). Different
experimental approaches have been taken to show the dependence of kET, hence β on
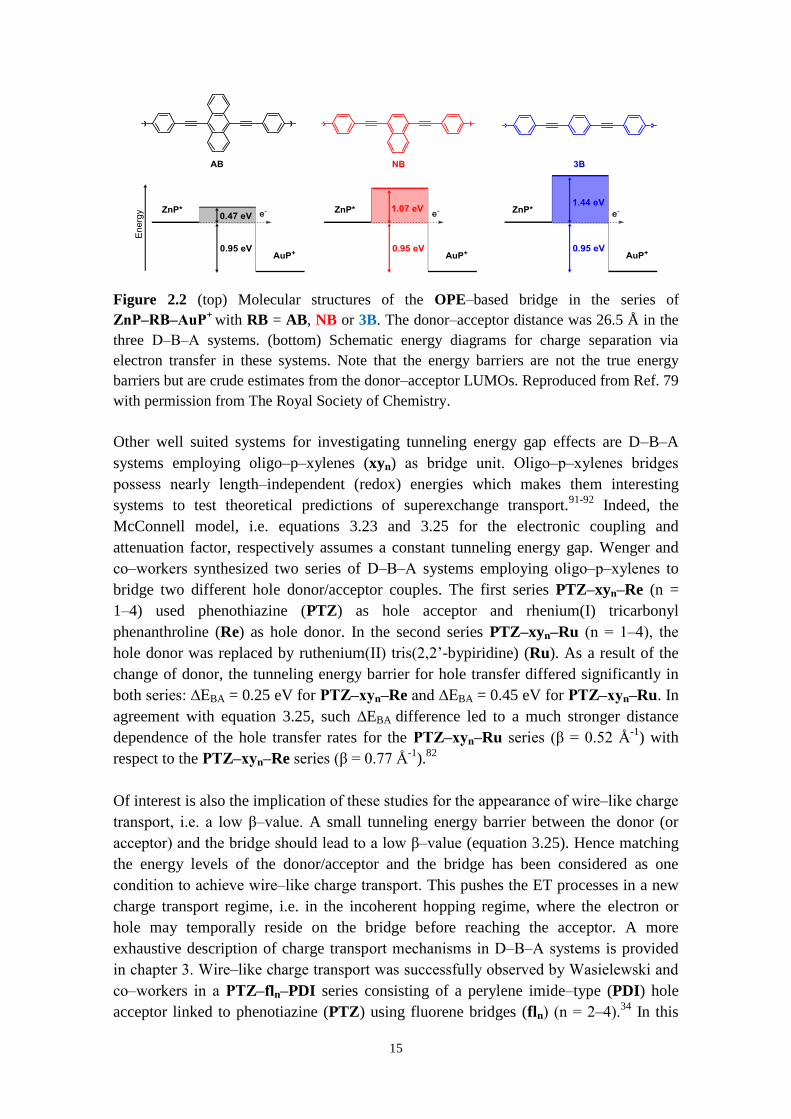
the tunneling energy gap, ∆E. For example, Albinsson and co‒workers designed a series
of D‒B‒A molecules ZnP‒RB‒AuP+
employing an oligo‒p‒phenylene ethynylene
(OPE)‒based bridge (RB) of constant length to link the porphyrin donor (ZnP) to the
electron acceptor (AuP+). They could tune the tunneling energy gap for charge
separation, ∆ECS, by replacing the central benzene of the OPE‒based bridge by either
naphathalene (NB) or anthracene (AB) while maintaining a constant RDA. As a result,
when going from anthracene (AB) to naphthalene (NB) to benzene (3B), ∆ECS increases
due to increasingly higher lying singlet excited state of the bridge unit (see Figure 2.2).
Very nicely, the measured ET rates also followed the same trend: kET = 2.54 x 10⁹ s
-1
for 3B, 4.48 x 10⁹ s
-1 for NB and 3.03 x 10
10 s
-1 for AB.
29, 81, 90
15
Figure 2.2 (top) Molecular structures of the OPE‒based bridge in the series of
ZnP‒RB‒AuP+ with RB = AB, NB or 3B. The donor‒acceptor distance was 26.5 Å in the
three D‒B‒A systems. (bottom) Schematic energy diagrams for charge separation via
electron transfer in these systems. Note that the energy barriers are not the true energy
barriers but are crude estimates from the donor‒acceptor LUMOs. Reproduced from Ref. 79
with permission from The Royal Society of Chemistry.
Other well suited systems for investigating tunneling energy gap effects are D‒B‒A
systems employing oligo‒p‒xylenes (xyn) as bridge unit. Oligo‒p‒xylenes bridges
possess nearly length‒independent (redox) energies which makes them interesting
systems to test theoretical predictions of superexchange transport.91-92
Indeed, the
McConnell model, i.e. equations 3.23 and 3.25 for the electronic coupling and
attenuation factor, respectively assumes a constant tunneling energy gap. Wenger and
co‒workers synthesized two series of D‒B‒A systems employing oligo‒p‒xylenes to
bridge two different hole donor/acceptor couples. The first series PTZ‒xyn‒Re (n =
1‒4) used phenothiazine (PTZ) as hole acceptor and rhenium(I) tricarbonyl
phenanthroline (Re) as hole donor. In the second series PTZ‒xyn‒Ru (n 1‒4), the
hole donor was replaced by ruthenium(II) tris(2,2’-bypiridine) (Ru). As a result of the
change of donor, the tunneling energy barrier for hole transfer differed significantly in
both series: ∆EBA = 0.25 eV for PTZ‒xyn‒Re and ∆EBA = 0.45 eV for PTZ‒xyn‒Ru. In
agreement with equation 3.25, such ∆EBA difference led to a much stronger distance
dependence of the hole transfer rates for the PTZ‒xyn‒Ru series (β 0.52 Å-1
) with
respect to the PTZ‒xyn‒Re series (β 0.77 Å-1
).82
Of interest is also the implication of these studies for the appearance of wire‒like charge
transport, i.e. a low β‒value. A small tunneling energy barrier between the donor (or
acceptor) and the bridge should lead to a low β‒value (equation 3.25). Hence matching
the energy levels of the donor/acceptor and the bridge has been considered as one
condition to achieve wire‒like charge transport. This pushes the ET processes in a new
charge transport regime, i.e. in the incoherent hopping regime, where the electron or
hole may temporally reside on the bridge before reaching the acceptor. A more
exhaustive description of charge transport mechanisms in D‒B‒A systems is provided
in chapter 3. Wire‒like charge transport was successfully observed by Wasielewski and
co‒workers in a PTZ‒fln‒PDI series consisting of a perylene imide–type (PDI) hole
acceptor linked to phenotiazine (PTZ) using fluorene bridges (fln) (n 2‒4).34
In this
16
D‒B‒A series, the energy level of the acceptor approximately coincided with the bridge
energy level and led to a nearly constant tunneling energy barrier that was small enough
(∆E ~ 0.15 eV) for hole transport to occur in the incoherent hopping regime. The hole
transport via incoherent hopping resulted in a very small β‒value (β 0.0 3 Å-1
).
However, the systematic implication of a wire‒like behavior in D‒B‒A systems with
charge transport in the incoherent hopping regime has recently been questioned. In
order to favor hopping charge transport, Wasielewski and co‒workers voluntarily
created a down‒hill energy gradient within a series of fluorenone‒bridged D‒B‒A
molecules.87
They effectively observed electron transfer in the hopping regime but this
unexpectedly did not preclude a strong distance dependence of the ET rates with β
0.34 Å-1
. Thus, designing D‒B‒A systems with pre‒defined wire‒like properties is not
so simple and remains quite a challenge.87, 93-94
In chapter 5, mechanistic criteria for the
appearance of wire‒like properties in a series of porphyrin oligomer‒bridged
donor‒acceptor systems Fc‒Pn‒C60 (n 1‒4, 6) are further discussed.
Conformational effects on ET and EET rates in D‒B‒A molecules
π‒conjugated bridged D‒B‒A molecules possess often sufficient structural constraint to
control the distance between the donor and the acceptor. However, the bridge in such
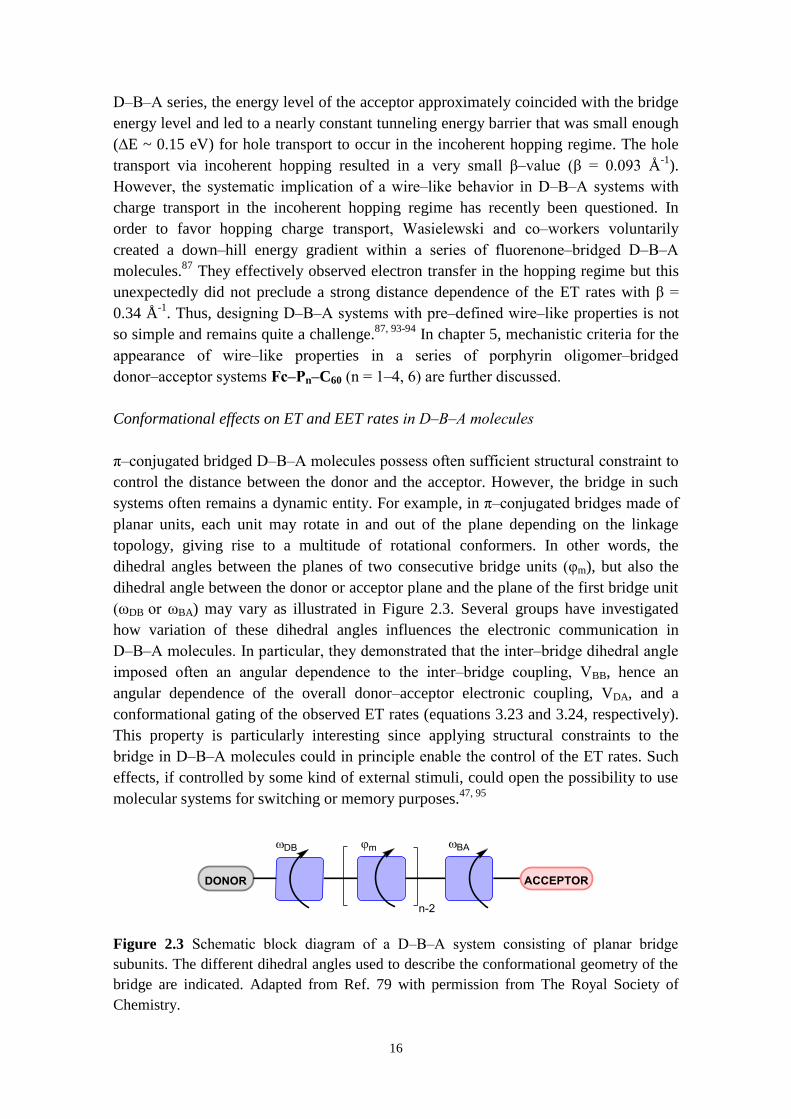
systems often remains a dynamic entity. For example, in π‒conjugated bridges made of
planar units, each unit may rotate in and out of the plane depending on the linkage
topology, giving rise to a multitude of rotational conformers. In other words, the
dihedral angles between the planes of two consecutive bridge units (φm), but also the
dihedral angle between the donor or acceptor plane and the plane of the first bridge unit
(ωDB or ωBA) may vary as illustrated in Figure 2.3. Several groups have investigated
how variation of these dihedral angles influences the electronic communication in
D‒B‒A molecules. In particular, they demonstrated that the inter‒bridge dihedral angle
imposed often an angular dependence to the inter‒bridge coupling, BB, hence an
angular dependence of the overall donor‒acceptor electronic coupling, VDA, and a
conformational gating of the observed ET rates (equations 3.23 and 3.24, respectively).
This property is particularly interesting since applying structural constraints to the
bridge in D‒B‒A molecules could in principle enable the control of the ET rates. Such
effects, if controlled by some kind of external stimuli, could open the possibility to use
molecular systems for switching or memory purposes.47, 95
Figure 2.3 Schematic block diagram of a D‒B‒A system consisting of planar bridge
subunits. The different dihedral angles used to describe the conformational geometry of the
bridge are indicated. Adapted from Ref. 79 with permission from The Royal Society of
Chemistry.
17
One challenge in conformational studies is that variation of dihedral angles (ωDB, φm or
ωBA) may affect several parameters, i.e. VBB and bridge energetics and hence tunneling
energy barriers. In addition, conformational effects are also solvent‒and
temperature‒dependent. This renders interpretation of the kinetics more difficult. For
example, Wasielewski and co‒workers investigated the influence that bridge dynamics
has on the ET rates in oligo‒p‒phenylenevinylene bridged D‒B‒A molecules with
tetracene as donor and pyromellitimide as acceptor.96
In these D‒B‒A molecules,
conformational effects led to a complex temperature dependence of the ET rates which
did not follow Marcus predictions (equation 3.20). They demonstrated that in all
D‒B‒A molecules, torsional motion in the excited state between the tetracene donor and
the first bridge phenyl ring governed the overall donor‒acceptor electronic coupling. In
the longer systems containing a vinyl group, the “picture” became even more complex
with additional intra‒bridge torsional motions between the vinyl group and the phenyls
contributing to the conformational gating of VDA and the ET rates. In a more simple
approach, Wenger et al. compared the ET rates of a series of D‒B‒A molecules
employing structurally similar bridges but with different intra‒bridge dihedral angles.97
The series of D‒B‒A molecules had a rhenium complex as hole donor and
phenothiazine as hole acceptor connected by either two phenyls (ph2), two xylenes (xy2)
or a fluorene group (fl1). RDA was identical in the three systems. However, they
measured an increase in hole transfer rates, kHT, when going from xy2 (kHT = 0.5 x 10⁸ s
-
1; ∆EDB = 0.25 eV) to ph2 (kHT = 2.6 x 10
8 s
-1; ∆EDB = 0.54 eV) to fl1 (kHT = 5.3 x 10
8 s
-
1; ∆EDB = 0.16 eV), that could not solely be explained by tunneling energy gap effects.
In fact, they found that variation of the dihedral angle between the two phenyl planes
(φph-ph = 65º for xy2, 35º for ph2, 6º for fl1) among the compared D‒B‒A molecules
strongly affected the electronic coupling between neighboring bridge sites, and hence
VDA and kHT (equations 3.23 and 3.24). They concluded that only the combined effects
of the tunneling energy gap and conformation of the bridge could explain the observed
kinetic trend in this series. Similar effects of the inter‒bridge dihedral angle on ET and
EET rates have been reported in oligo‒p‒phenylene‒bridged D‒B‒A systems by the
groups of Scandola98
and De Cola99
, respectively.
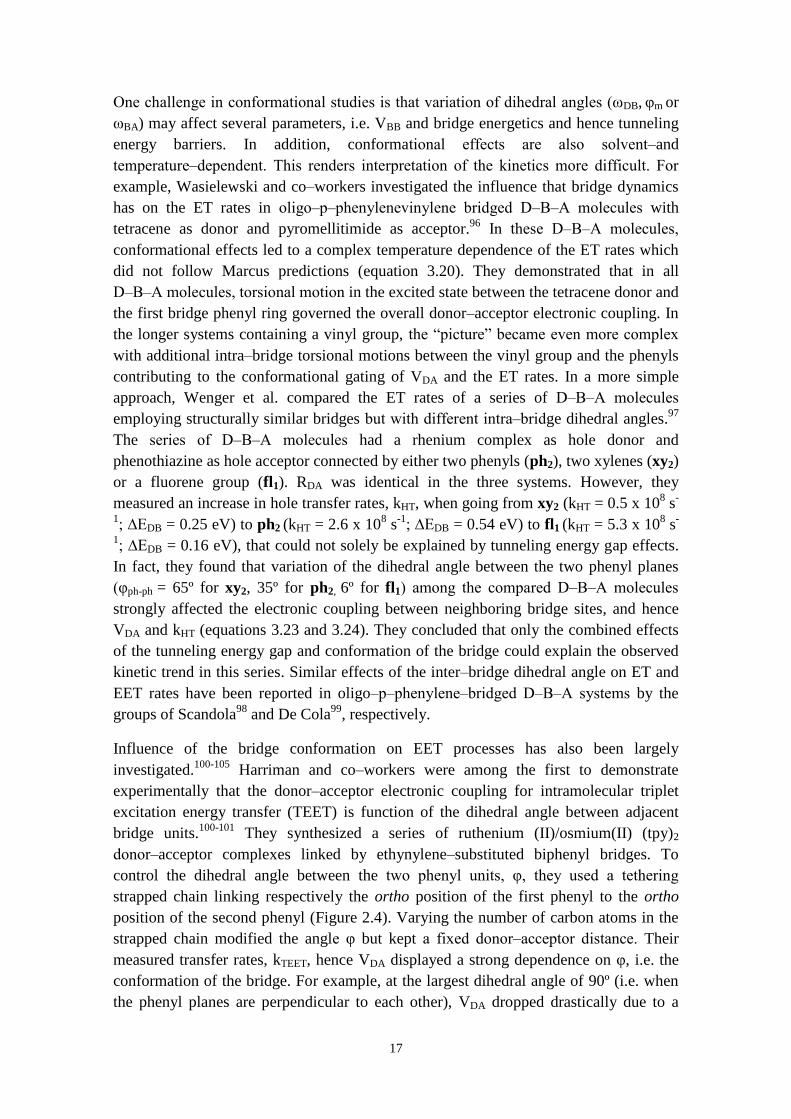
Influence of the bridge conformation on EET processes has also been largely
investigated.100-105
Harriman and co‒workers were among the first to demonstrate
experimentally that the donor‒acceptor electronic coupling for intramolecular triplet
excitation energy transfer (TEET) is function of the dihedral angle between adjacent
bridge units.100-101
They synthesized a series of ruthenium (II)/osmium(II) (tpy)2
donor‒acceptor complexes linked by ethynylene‒substituted biphenyl bridges. To
control the dihedral angle between the two phenyl units, φ, they used a tethering
strapped chain linking respectively the ortho position of the first phenyl to the ortho
position of the second phenyl (Figure 2.4). Varying the number of carbon atoms in the
strapped chain modified the angle φ but kept a fixed donor‒acceptor distance. Their
measured transfer rates, kTEET, hence VDA displayed a strong dependence on φ, i.e. the
conformation of the bridge. For example, at the largest dihedral angle of 90º (i.e. when
the phenyl planes are perpendicular to each other), VDA dropped drastically due to a
18
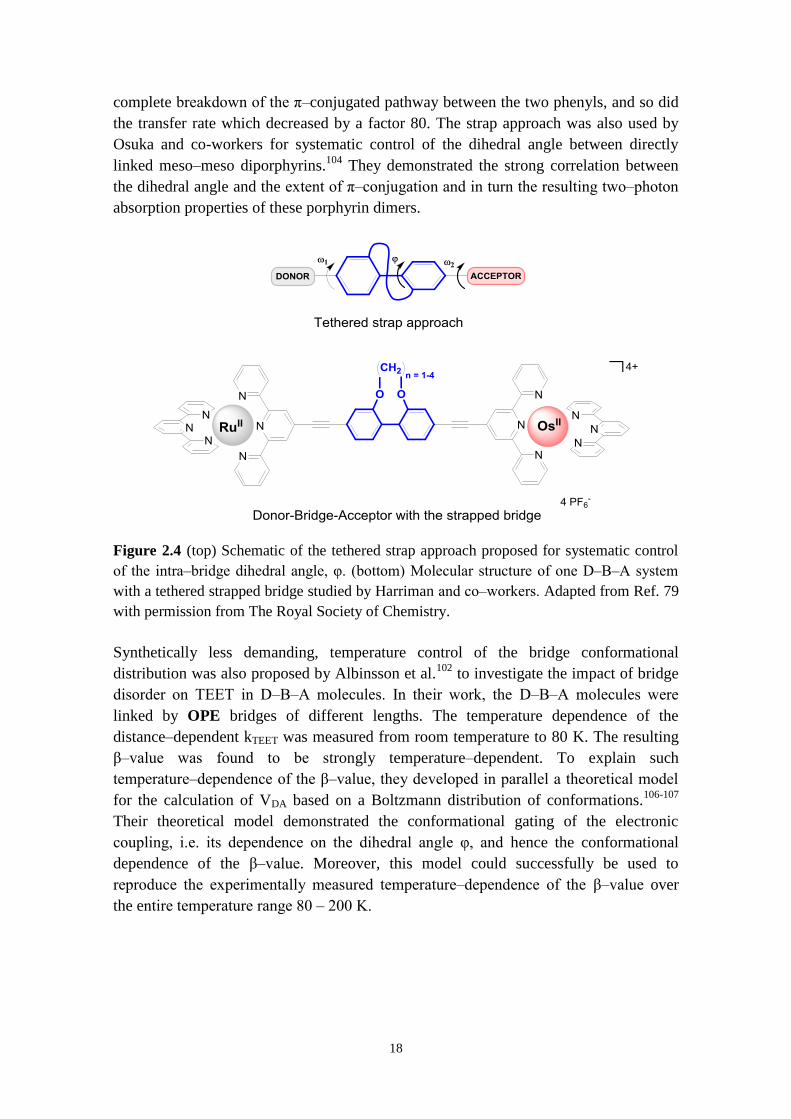
complete breakdown of the π‒conjugated pathway between the two phenyls, and so did
the transfer rate which decreased by a factor 80. The strap approach was also used by
Osuka and co-workers for systematic control of the dihedral angle between directly
linked meso‒meso diporphyrins.104
They demonstrated the strong correlation between
the dihedral angle and the extent of π‒conjugation and in turn the resulting two‒photon
absorption properties of these porphyrin dimers.
Figure 2.4 (top) Schematic of the tethered strap approach proposed for systematic control
of the intra‒bridge dihedral angle, φ. (bottom) Molecular structure of one D‒B‒A system
with a tethered strapped bridge studied by Harriman and co‒workers. Adapted from Ref. 79
with permission from The Royal Society of Chemistry.
Synthetically less demanding, temperature control of the bridge conformational
distribution was also proposed by Albinsson et al.102
to investigate the impact of bridge
disorder on TEET in D‒B‒A molecules. In their work, the D‒B‒A molecules were
linked by OPE bridges of different lengths. The temperature dependence of the
distance‒dependent kTEET was measured from room temperature to 80 K. The resulting
β‒value was found to be strongly temperature‒dependent. To explain such
temperature‒dependence of the β‒value, they developed in parallel a theoretical model
for the calculation of VDA based on a Boltzmann distribution of conformations.106-107
Their theoretical model demonstrated the conformational gating of the electronic
coupling, i.e. its dependence on the dihedral angle φ, and hence the conformational
dependence of the β‒value. Moreover, this model could successfully be used to
reproduce the experimentally measured temperature‒dependence of the β‒value over
the entire temperature range 80 ‒ 200 K.
19
2.3 TAKING THE “NM TO MACROSCOPIC SCALES” STEP WITH
MOLECULES USING SELF‒ASSEMBLY
We have seen that covalently‒linked D‒B‒A systems are useful model systems to study
the dependence of ET and EET rates on donor‒acceptor distance, electronic coupling
and orientation. However, such systems often cover distances of only few
nanometers.108
This limits their field of applications. Few exceptions have been reported
in the literature.109-113
For example, giant meso‒meso‒linked zinc porphyrin oligomers
with micrometer molecular length have been synthesized by Osuka et al.110
But the
resulting structures showed a high degree of conformational flexibility with the longest
oligomer (ca. 0.85 mm) adopting a snakelike bent structure. Likewise, most of the long
covalent systems reported in the literature suffer from a lack of rigidity that disrupts the
electronic communication along the chain.111
Further, they often required complex
synthetic chemistry. Despite powerful synthetic strategies recently developed to build
large supramolecules (e.g. template‒directed synthesis for long porphyrin oligomers and
iterative synthetic methods),110, 112-114
it remains difficult to synthesize
micrometer‒sized molecules containing various functional entities. One simpler
approach to build complex molecular architectures which can achieve microscopic size
is self‒assembly.115-116
By self‒assembly, the pre‒existing components in a “mixture”
spontaneously come together, i.e. are able to form more complex and ordered structures
by molecular recognition. The molecular components are hold together by non‒covalent
or weakly covalent interactions such as π‒π stacking, hydrogen bonds and metal
coordination bonds. Thus self‒assembly is less demanding in term of synthesis as it is
based on molecular recognition properties, i.e. geometrical (molecular shapes) and
chemical (intermolecular interactions) complementarities. Once more, Nature offers
several examples of self‒assembled systems.117-118
For example, the special pairs P680
and P700 in the RC of PSII and PSI, respectively possess a dimer structure that relies on
π‒π stacking interactions between two chlorophyll a macrocycles.62, 117
In synthetic
self‒assembled molecular ensembles, for the “molecular‒legos” to spontaneously
organize themselves the way we want, one need to have the appropriate molecular
recognition properties. Hence it initially requires a smart design of the different
molecular‒legos. The idea is to start with the synthesis of functional building blocks as
simple as possible (i.e. involving a minimum number of covalent bonds) which possess
the appropriate molecular recognition property for self‒assembly. In regard to the
production of functional devices, self‒assembly is one practical strategy proposed for
coupling energy and electron transfer in artificial photosynthetic devices and for
generating molecular ensembles capable to sustain charge and energy transport over
micrometer distances. In this context, a fundamental question needs to be addressed:
Can charge and energy transport between non‒covalent molecular structures occur as
efficiently as in covalent structures? Wasielewski and co‒workers have addressed this
question and investigated ET and EET in several self‒assembled molecular
ensembles.119
As “molecular‒legos”, they used primarily perylene‒dicarboximide (PDI)
and its derivatives. For example, they synthesized a light harvesting block consisting of
20
a central PDI chromophore appended with four peripheral PDI chromophores that
self‒assembled into ordered dimers via π‒π stacking.120
More interestingly, they
demonstrated efficient energy transfer between the stacked monomers occuring on a
time scale (ca. 5 ps) comparable to the one observed in the light harvesting systems of
green plants. To create functional artificial photosynthetic systems, one requirement is
the ability to perform in series the light harvesting and charge separation functions
within in a single molecular ensemble. This can be achieved by self‒assembly as
demonstrated by the groups of Gust74
and Wasielewski.121
Gust et al. constructed an
antenna/reaction center heptad complex consisting of two components, i.e. a circular
hexad antenna system bearing two zinc porphyrins and a fullerene electron acceptor
bearing pyridil groups.74
Both components spontaneously come together by
metal‒ligand interactions between the zinc porphyrins and the fullerene acceptor. The
excitation energy was found to funnel very efficiently from the antenna system to the
porphyrins, where charge separation subsequently occurred by donation of an electron
to the fullerene. In the work of the Wasielewski group,121
the self‒assembly of the light
harvesting system and the reaction center arose from π‒π interactions between
monomers consisting of a PDI derivative core decorated by four PDI molecules. Such
monomers form spontaneously a π‒stacked dimer, in which the peripheral PDI array
acts as an antenna and the PDI derivative core dimer bio‒mimics the “special pair” of
the RC. As in the natural reaction center, they also showed that charge separation only
occurred in the dimeric system.
2.4 CONJUGATED PORPHYRIN OLIGOMERS
2.4.1 MOTIVATION
In this work, porphyrins are used as covalent building blocks to the formation of
multiporphyrin systems. Porphyrins are planar 18π‒electron conjugated macrocycles
formed by four pyrrole units and four methine carbons. They are analogous to the
chlorophyll molecules present in the natural photosynthetic antenna and reaction center
but their structure is simpler and so is their synthesis (Figure 2.5).
21
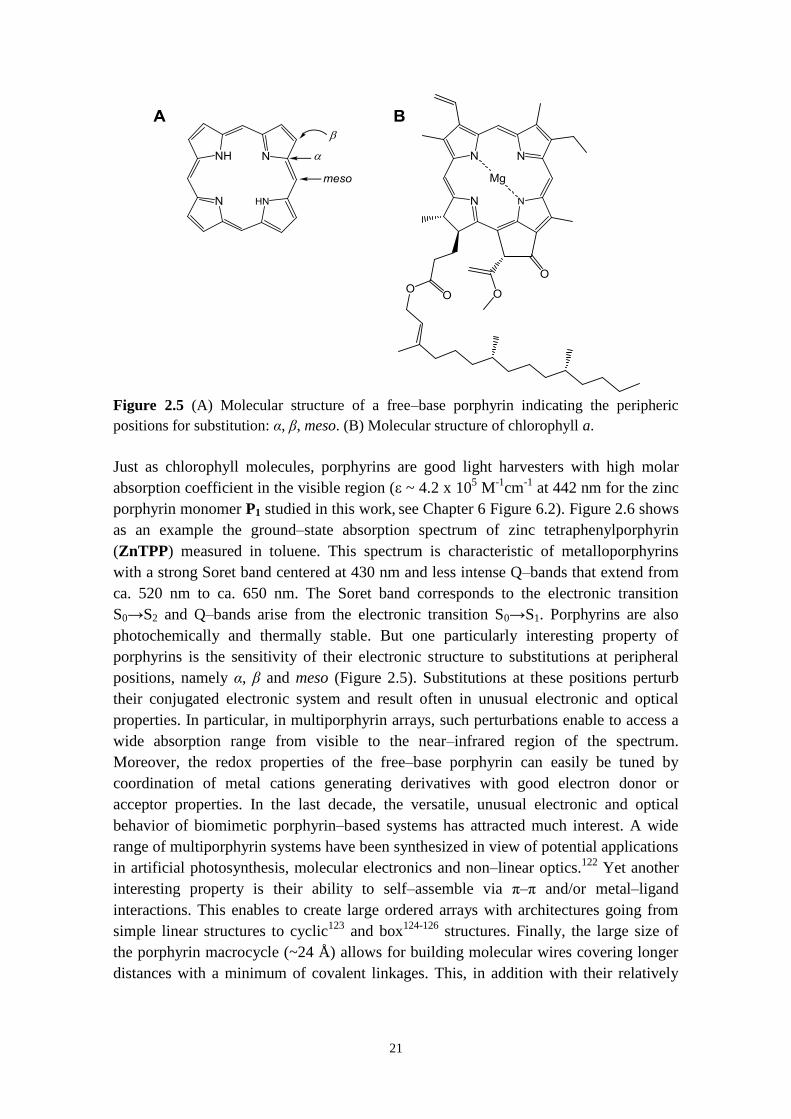
Figure 2.5 (A) Molecular structure of a free‒base porphyrin indicating the peripheric
positions for substitution: α, β, meso. (B) Molecular structure of chlorophyll a.
Just as chlorophyll molecules, porphyrins are good light harvesters with high molar
absorption coefficient in the visible region (ε ~ 4.2 x 10⁵ M
-1cm
-1 at 442 nm for the zinc
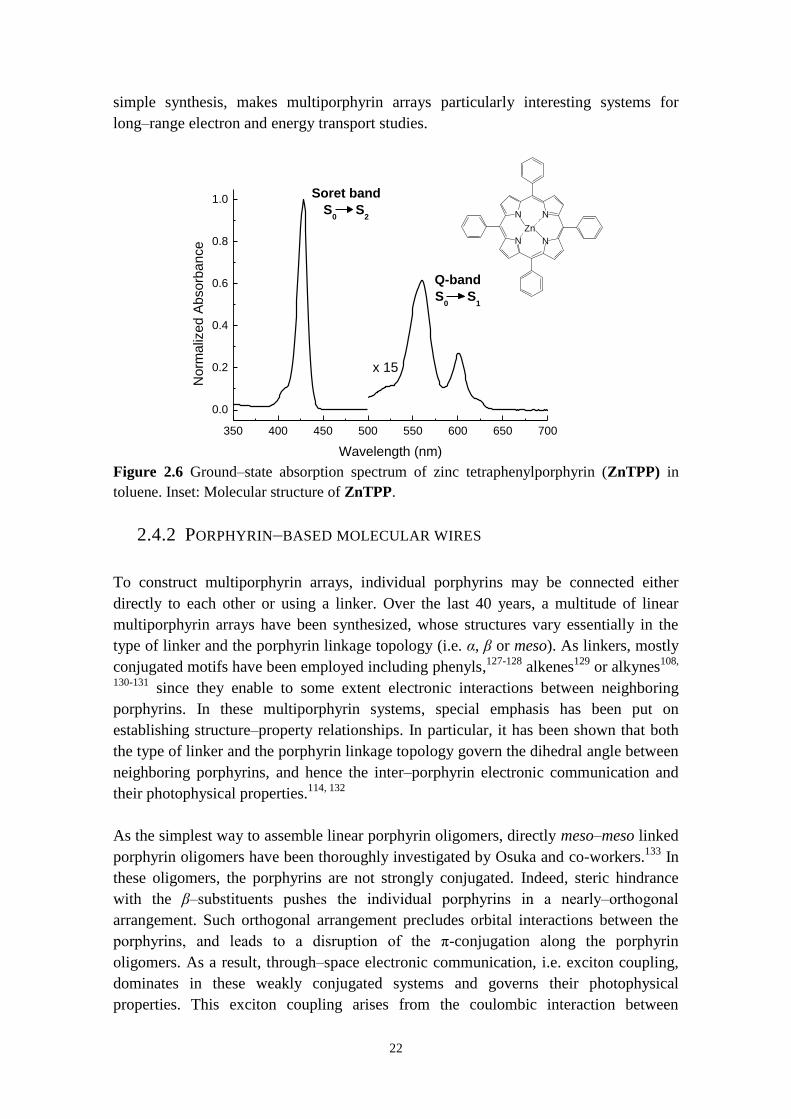
porphyrin monomer P1 studied in this work, see Chapter 6 Figure 6.2). Figure 2.6 shows
as an example the ground‒state absorption spectrum of zinc tetraphenylporphyrin
(ZnTPP) measured in toluene. This spectrum is characteristic of metalloporphyrins
with a strong Soret band centered at 430 nm and less intense Q‒bands that extend from
ca. 520 nm to ca. 650 nm. The Soret band corresponds to the electronic transition
S0→S2 and Q‒bands arise from the electronic transition S0→S1. Porphyrins are also
photochemically and thermally stable. But one particularly interesting property of
porphyrins is the sensitivity of their electronic structure to substitutions at peripheral
positions, namely α, β and meso (Figure 2.5). Substitutions at these positions perturb
their conjugated electronic system and result often in unusual electronic and optical
properties. In particular, in multiporphyrin arrays, such perturbations enable to access a
wide absorption range from visible to the near‒infrared region of the spectrum.
Moreover, the redox properties of the free‒base porphyrin can easily be tuned by
coordination of metal cations generating derivatives with good electron donor or
acceptor properties. In the last decade, the versatile, unusual electronic and optical
behavior of biomimetic porphyrin‒based systems has attracted much interest. A wide
range of multiporphyrin systems have been synthesized in view of potential applications
in artificial photosynthesis, molecular electronics and non‒linear optics.122
Yet another
interesting property is their ability to self‒assemble via π‒π and/or metal‒ligand
interactions. This enables to create large ordered arrays with architectures going from
simple linear structures to cyclic123
and box124-126
structures. Finally, the large size of
the porphyrin macrocycle (~24 Å) allows for building molecular wires covering longer
distances with a minimum of covalent linkages. This, in addition with their relatively
22
simple synthesis, makes multiporphyrin arrays particularly interesting systems for
long‒range electron and energy transport studies.
Figure 2.6 Ground‒state absorption spectrum of zinc tetraphenylporphyrin (ZnTPP) in
toluene. Inset: Molecular structure of ZnTPP.
2.4.2 PORPHYRIN‒BASED MOLECULAR WIRES
To construct multiporphyrin arrays, individual porphyrins may be connected either
directly to each other or using a linker. Over the last 40 years, a multitude of linear
multiporphyrin arrays have been synthesized, whose structures vary essentially in the
type of linker and the porphyrin linkage topology (i.e. α, β or meso). As linkers, mostly
conjugated motifs have been employed including phenyls,127-128
alkenes129
or alkynes108,
130-131 since they enable to some extent electronic interactions between neighboring
porphyrins. In these multiporphyrin systems, special emphasis has been put on
establishing structure‒property relationships. In particular, it has been shown that both
the type of linker and the porphyrin linkage topology govern the dihedral angle between
neighboring porphyrins, and hence the inter‒porphyrin electronic communication and
their photophysical properties.114, 132
As the simplest way to assemble linear porphyrin oligomers, directly meso‒meso linked
porphyrin oligomers have been thoroughly investigated by Osuka and co-workers.133
In
these oligomers, the porphyrins are not strongly conjugated. Indeed, steric hindrance
with the β‒substituents pushes the individual porphyrins in a nearly‒orthogonal
arrangement. Such orthogonal arrangement precludes orbital interactions between the
porphyrins, and leads to a disruption of the π-conjugation along the porphyrin
oligomers. As a result, through‒space electronic communication, i.e. exciton coupling,
dominates in these weakly conjugated systems and governs their photophysical
properties. This exciton coupling arises from the coulombic interaction between
350 400 450 500 550 600 650 700
0.0
0.2
0.4
0.6
0.8
1.0
x 15
No
rma
lize
d A
bsorb
an
ce
Wavelength (nm)
Soret band
S0 S
2
Q-band
S0 S
1
N N
NN
Zn
23
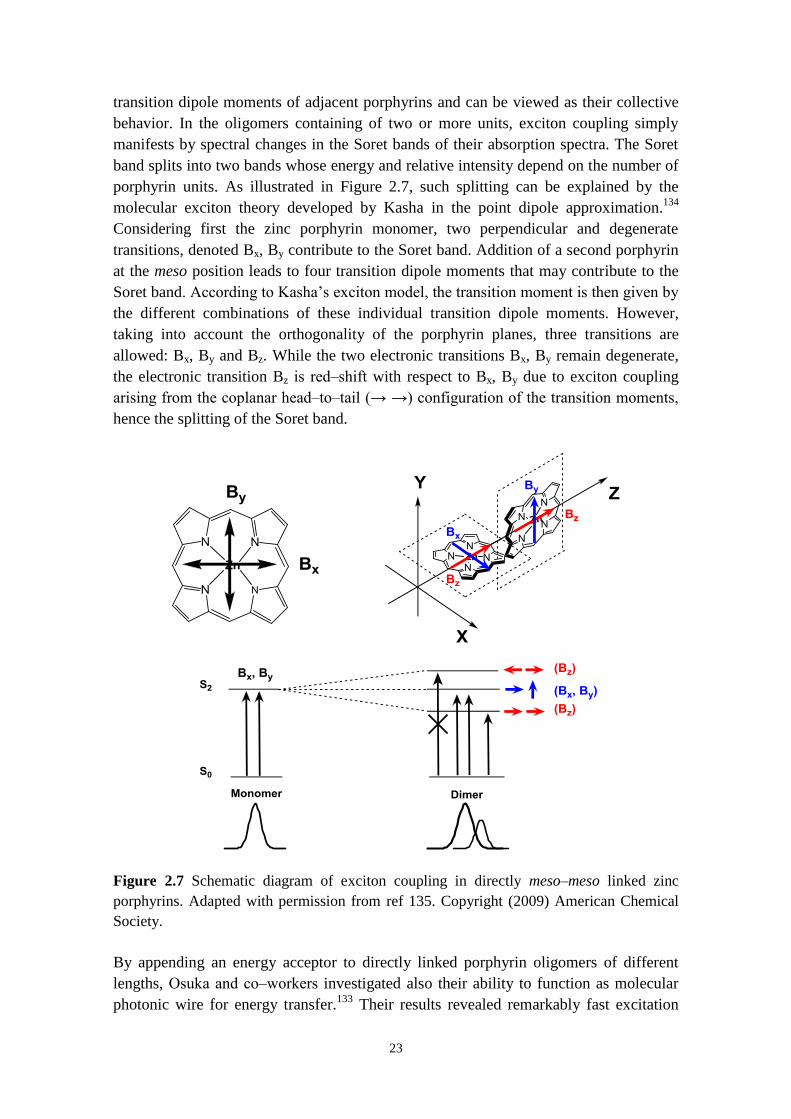
transition dipole moments of adjacent porphyrins and can be viewed as their collective
behavior. In the oligomers containing of two or more units, exciton coupling simply
manifests by spectral changes in the Soret bands of their absorption spectra. The Soret
band splits into two bands whose energy and relative intensity depend on the number of
porphyrin units. As illustrated in Figure 2.7, such splitting can be explained by the
molecular exciton theory developed by Kasha in the point dipole approximation.134
Considering first the zinc porphyrin monomer, two perpendicular and degenerate
transitions, denoted Bx, By contribute to the Soret band. Addition of a second porphyrin
at the meso position leads to four transition dipole moments that may contribute to the
Soret band. According to Kasha’s exciton model, the transition moment is then given by
the different combinations of these individual transition dipole moments. However,
taking into account the orthogonality of the porphyrin planes, three transitions are
allowed: Bx, By and Bz. While the two electronic transitions Bx, By remain degenerate,
the electronic transition Bz is red‒shift with respect to Bx, By due to exciton coupling
arising from the coplanar head‒to‒tail (→ →) configuration of the transition moments,
hence the splitting of the Soret band.
Figure 2.7 Schematic diagram of exciton coupling in directly meso‒meso linked zinc
porphyrins. Adapted with permission from ref 135. Copyright (2009) American Chemical
Society.
By appending an energy acceptor to directly linked porphyrin oligomers of different
lengths, Osuka and co‒workers investigated also their ability to function as molecular
photonic wire for energy transfer.133
Their results revealed remarkably fast excitation
24
energy transfer with rate constants varying from (2.5 ps)-1
for the monomer to (108 ps)-1
for the 24‒mer covering a distance of ~109 Å (~11 nm). In this regard, directly linked
porphyrin oligomers successfully resemble the natural antenna complexes where fast
excitation energy migration occurs despite negligible electronic delocalization due to a
lack of bonds between individual chromophores. Fast and efficient energy transfer in
multiporphyrin arrays due to excitonic interactions was also demonstrated by Lindsey
and co‒workers. They designed molecular photonic wires for energy transfer consisting
of meso‒meso diphenylethyne‒linked porphyrin oligomers.128, 136
Likewise directly
linked porphyrin arrays, adjacent porphyrins in these oligomers adopted an orthogonal
configuration that minimized electronic delocalization and prevented competitive
electron transfer quenching to occur.
Although weakly conjugated porphyrin oligomers are promising candidates for
molecular photonics applications, disruption of the π‒conjugation in these oligomers is
a considerable obstacle to long‒range charge transport. Electrons or holes are very
unlikely to travel long distance via through‒space interactions. Instead their transport
requires through‒bond electronic communication. Thus, porphyrin oligomers need to be
assembled using conjugated motifs that favor the extension the π‒conjugation over the
entire oligomer. In this effort, different strategies have been employed that again differ
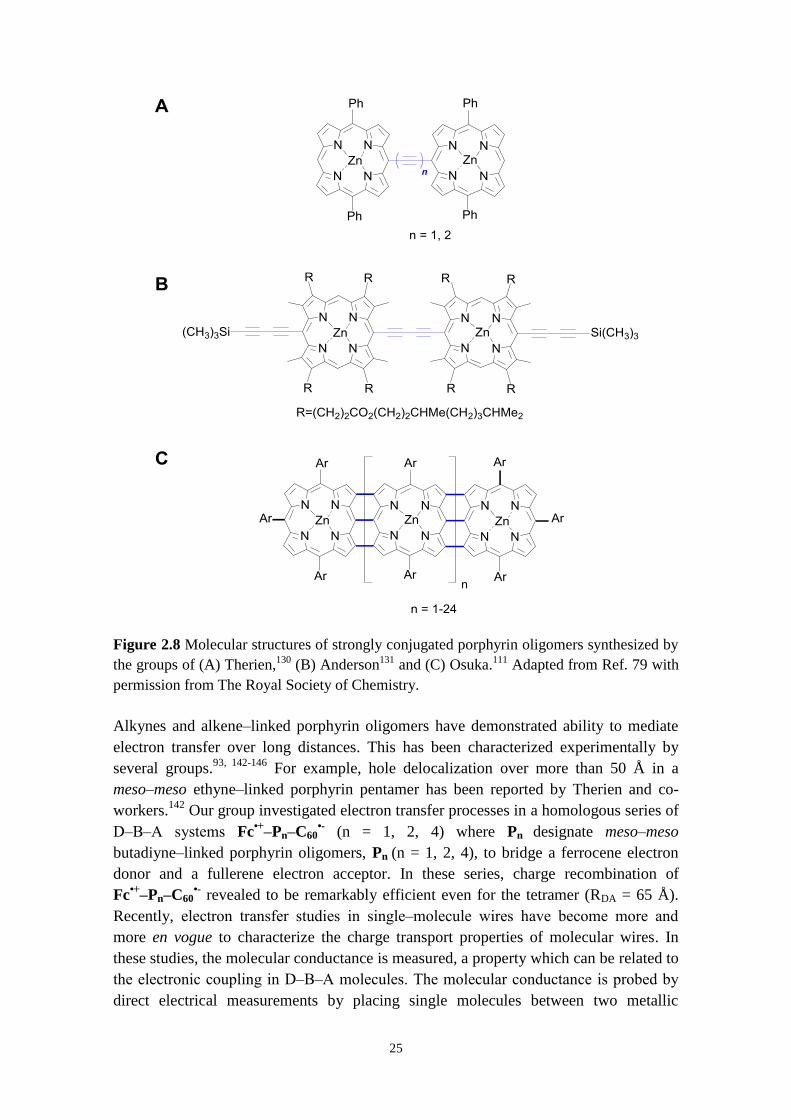
by the linker motif and the porphyrin linkage topology (β‒β, meso‒meso, meso‒β). For
example, the groups of Therien130
and Anderson131
synthesized zinc porphyrin dimers
linked at their meso position by ethyne and butadiyne linkers, respectively (Figures
2.8A and 2.8B). In both cases, this type of bond linkage allows a coplanar arrangement
of the porphyrin macrocycles, and hence merging of the π‒conjugated system of
individual components along the entire dimers. This leads to a strong interporphyrin
electronic coupling (i.e. electronic delocalization) in the ground state. Such electronic
delocalization effects manifest by a strong alteration of the Q‒band in the ground‒state
absorption spectra of these oligomers. Upon lengthening of the oligomer, the Q‒band
gradually red-shifts and intensifies.132
In the excited state, electronic delocalization is
further enhanced due, to on average, more planar conformation of the oligomers with
respect to their ground state.137-138
Influence of the porphyrin linkage topology on the
electronic coupling in ethyne‒and butadiyne‒linked porphyrin dimers was also
investigated by Therien et al., which demonstrated that the meso‒meso connectivity
always offered larger π‒overlap, hence maximal electronic coupling.132
Other strategies
used to form strongly conjugated porphyrin oligomers consist in fusing individual
porphyrins either directly by triple meso–meso, β–β, β–β bonds139
or via an aromatic
linker.140-141
In the literature, these porphyrin oligomers are often referred as to
“porphyrin tapes”. In particular triply linked meso–meso, β–β, β–β porphyrin arrays
have been synthesized and investigated by the group of Osuka (Figure 2.8C). In contrast
to alkyne-linked porphyrin oligomers, porphyrin tapes, as their name implies, are
strictly planar oligomers and displayed even stronger electronic delocalization with
Q‒bands red‒shifted up to ca. 3000 nm for a 12‒mer fused array.
25
Figure 2.8 Molecular structures of strongly conjugated porphyrin oligomers synthesized by
the groups of (A) Therien,130 (B) Anderson131 and (C) Osuka.111 Adapted from Ref. 79 with
permission from The Royal Society of Chemistry.
Alkynes and alkene‒linked porphyrin oligomers have demonstrated ability to mediate
electron transfer over long distances. This has been characterized experimentally by
several groups.93, 142-146
For example, hole delocalization over more than 50 Å in a
meso‒meso ethyne‒linked porphyrin pentamer has been reported by Therien and co-
workers.142
Our group investigated electron transfer processes in a homologous series of
D‒B‒A systems Fc•+
‒Pn‒C60•- (n = 1, 2, 4) where Pn designate meso‒meso
butadiyne‒linked porphyrin oligomers, Pn (n = 1, 2, 4), to bridge a ferrocene electron
donor and a fullerene electron acceptor. In these series, charge recombination of
Fc•+
‒Pn‒C60•- revealed to be remarkably efficient even for the tetramer (RDA = 65 Å).
Recently, electron transfer studies in single‒molecule wires have become more and
more en vogue to characterize the charge transport properties of molecular wires. In
these studies, the molecular conductance is measured, a property which can be related to
the electronic coupling in D‒B‒A molecules. The molecular conductance is probed by
direct electrical measurements by placing single molecules between two metallic

26
contacts, typically an STM tip and a metal surface.147-148
In particular, Nichols and
co‒workers have measured the conductance of single butadiyne‒linked porphyrin
oligomers and demonstrated their wire‒like behavior (β = 0.04 Å-1
).143-144
In a similar
work, the group of Therien have shown the quasi‒ohmic behavior of ethyne‒linked
porphyrin oligomers.146
Although this type of electron transfer studies have shown some
similarities with photo‒induced electron transfer studies in the parameters influencing
charge transport (i.e. tunneling energy barrier and conformational orientation), electron
transfer in single‒molecules wires remains a distinct subject with its own challenges.149-
150

27
3 THEORY
28
he World would be rather bland without color. Absorption and reflection of light
by objects shape daily our vision of the world. Light‒matter interactions are also
essential to life; as we have seen in chapter 2, the natural photosynthesis is initially
triggered by light absorption. In this chapter, focus is on how light interacts with matter
and on the processes that may follow light absorption. By light, I designate radiated
energy that can cause electronic excitation, i.e. promote a molecule from its electronic
ground state to one of its electronic excited states. In terms of wavelength, λ, this
corresponds to the region that extends from the near UV to the visible region to the
near IR, i.e. λ between 200 nm and 1000 nm. First, the criteria for absorption are
briefly stated, and then the fate of electronically excited states is discussed. Finally, a
short introduction to electron and energy transfer theory is given. For a more in‒depth
description of concepts in photophysics and the energy and electron transfer theories,
please see e.g. the text‒books by Hollas,151
Atkins152
and Balzani.153-154
3.1 LIGHT‒MATTER INTERACTIONS
Absorption of light by a molecule A in its electronic ground state, can be described by
the following reaction,
A hc λ → A* 3.1
where A* represents the molecule in an electronically excited state. The absorbed
photon is represented by its energy given by λ, where h is the Planck’s constant, c
the speed of light and λ the wavelength. For reaction 3.1 to occur, several criteria need
to be fulfilled.
Molecules consists of atoms, which themselves consist of nuclei and electrons. By
treating molecules quantum mechanically, their electronic configuration can be
described by a set of stationary electronic states with discrete energy. Associated to each
of these stationary states is a wave function Ψi. Solving the Schrödinger’s equation
(equation 3.2), i.e. determining Ψi, gives access to the energy of each stationary state.
Ĥ0 Ψi (r) E Ψi (r) 3.2
where Ĥ0 is the energy or Hamiltonian operator and represents the sum of the kinetic
and potential energies of both electrons and nuclei of the molecule. This distribution of
electrons into discrete energy levels leads to the first criterion for light absorption
(equation 3.3): the energy of the incident photon must match the energy difference
between an initial (i) and a final state (f) of the molecule. This first criterion is often
referred to as the Einstein‒Bohr’s frequency condition or resonance condition.
hc/λ = ∆E = Ef ‒ Ei 3.3
T
29
where Ei and Ef designate the energies of an initial (i) and a final state (f) of the
molecule, respectively. This first criterion gives the energy of the electronic transition or
wavelength at which the measured absorption spectrum of the molecule may display an
absorption band (vide infra). It also explains why increasing light intensity does not
affect the wavelength of absorption. While this condition is necessary, it solely does not
suffice for light absorption. Further, it does not provide any information on the
probability for the electronic transition to occur (i.e. intensity of the transition). In other
words, it lacks explanation on why some transitions are strong (i.e. allowed) and why
some transitions are barely observable (i.e. forbidden).
In reaction 3.1, light is considered as a flow of individual photons. Considering now its
undulating nature, light is described as a continuum of waves or electromagnetic
radiation characterized by an electric (E and magnetic (B field oscillating in time and
space in directions perpendicular to each other and to the direction of light propagation.
Light can through its electrical component strongly interact with distribution of charged
particles such as loosely bonded valence electrons (i.e. outer electrons) in molecules.
This may result in a distribution of charges that differs from the one in absence of light,
leaving the molecule with a different overall electronic configuration. Such small
perturbation of the charge distribution induced by light can be described using
time‒dependent perturbation theory. Light absorption is approximated by applying a
small perturbation to the system and equation 3.2 can be re‒written with an additional
perturbation operator Ĥ´.
(Ĥ0 + Ĥ´)Ψi (r, t) = E Ψi (r, t) 3.4
The wave‒function Ψi (r, t) describing the electronic state of the molecule is now
time‒dependent. The perturbation operator Ĥ´ is expressed as a scalar product of E (t)
and the dipole moment operator μ which represents the spatial charge distribution of the
molecule according to equation 3.6.
Ĥ´ E (t) μ 3.5
μ e qj rj
N
j
3.6
where qj is the charge of the particle and r j its position vector distance. From equations
3.5 and 3.6, one can state the second criterion for light absorption: the probability of the
transition to occur is maximal when the electric field component of the incident light
and the dipole operator of the molecule (i.e. dipole induced by light in the molecule)
point towards the same direction.
Here the perturbation, i.e. the electric field, disturbs rather weakly the system that is the
energies of the stationary electronic states remain unaffected. As a result, the
30
time‒dependent wave function may be expressed as a linear combination of the wave
functions of the unperturbed system, as shown in equation 3.7,
Ψ r, t ak (t) Ψi r 3.7
where the coefficients ak (t) “carry” the time‒dependence. When the perturbation is
removed, the system may occupy an electronic final state Ψf (r) which differs from the
initial one described by Ψi (r) (i.e. before perturbation). The probability Pfi to find the
system in a final state Ψf (r) is given by the square of the corresponding coefficients
af (t) 2, which is proportional to the square of the integral Ψf r μ Ψi (r) τ taken
over all space.
Pfi Ψf r μ Ψi (r) dτ
μ fi 3.8
In equation 3.8, the integral is the so‒called transition dipole moment which can be
viewed as a dipole induced by light represented by a vector aligned in the direction of
the electron flow. From equation 3.8, the third criterion for a transition to occur can be
derived, that is the integral Ψf r μ Ψi (r) τ (i.e. μ fi
) should be non‒zero.
Mathematically, it can be shown that this integral over all space will vanish if the
product under the integral is an antisymmetric function and will not vanish for a
symmetric function. Here, for electronic transitions, the symmetry of Ψf r and Ψ r
is related to the symmetry of the orbitals, which can be determined using Group Theory.
Moreover, since the dipole moment operator μ is a vector in the x or y or z directions,
all its components are antisymmetric functions. Thus, based on the symmetry of the
overall product Ψf r μ Ψ r , it is possible to determine if a transition is allowed or
forbidden. In addition, if the integral Ψf r μ Ψi (r) τ is large, the transition will be
highly probable (i.e. strong), while barely observable for a small overlap of its three
components.
From the above discussion, three criteria have been identified as governing the
probability for an electronic transition to occur, i.e. intensity of absorption band. Taking
solely these criteria into account, this leads to all the intensity of a transition
concentrated in a sharp band. However, this is generally not what is observed in
molecules. Instead, the absorption bands have often their intensity spread out over a
wide range of wavelength. This can be understood by introducing the Franck‒Condon
factor. In between the electronic stationary states lie also more closely spaced levels,
namely the vibrational levels of the molecules (see the Jablonski diagram in Figure 3.1).
At room temperature, the molecules populate mainly the lowest vibrational level of the
ground state. However, upon light absorption, the energy of the photon is sufficient
enough that molecules are not only promoted to higher electronic states but also to
higher vibrational levels in the excited state. This means that in the expression of the
transition dipole moment (equation 3.8), the overlap between the vibrational (nuclear)
wave functions of the two states involved in the transition must also be taken into
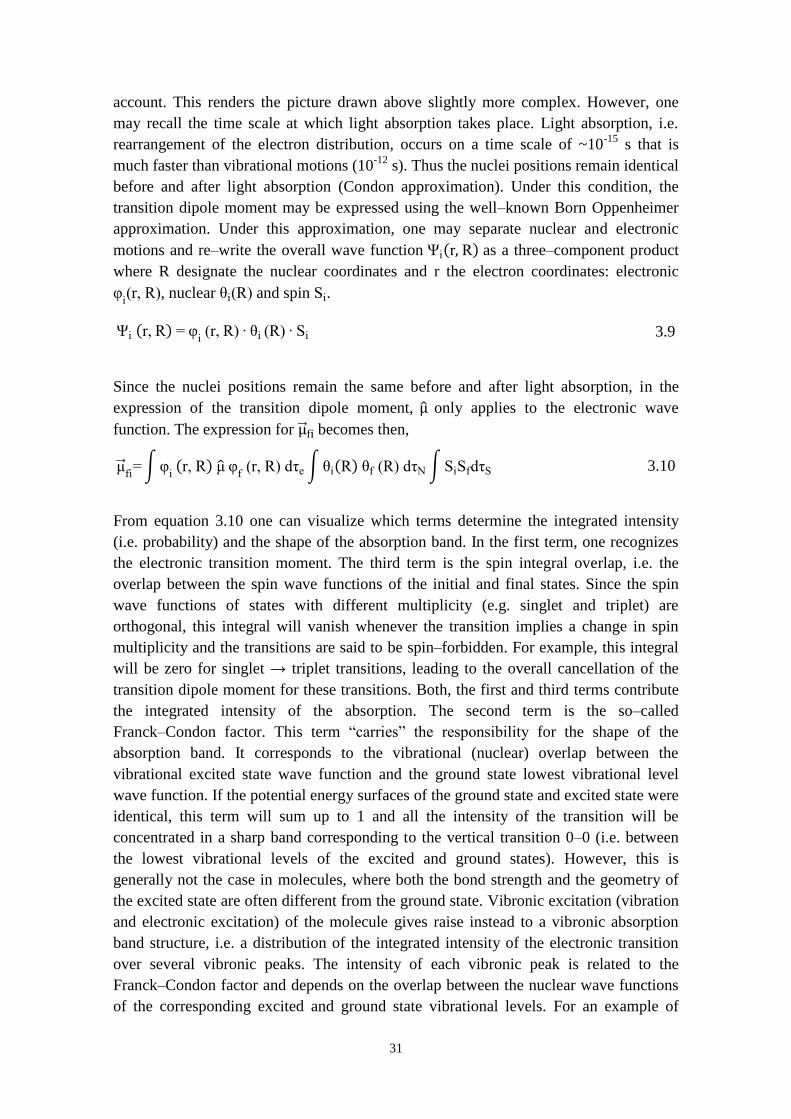
31
account. This renders the picture drawn above slightly more complex. However, one
may recall the time scale at which light absorption takes place. Light absorption, i.e.
rearrangement of the electron distribution, occurs on a time scale of ~10-15
s that is
much faster than vibrational motions (10-12
s). Thus the nuclei positions remain identical
before and after light absorption (Condon approximation). Under this condition, the
transition dipole moment may be expressed using the well‒known Born Oppenheimer
approximation. Under this approximation, one may separate nuclear and electronic
motions and re‒write the overall wave function Ψi r as a three‒component product
where R designate the nuclear coordinates and r the electron coordinates: electronic
φi(r, ), nuclear i( ) and spin Si.
Ψi r, φi (r, ) i ( ) Si 3.9
Since the nuclei positions remain the same before and after light absorption, in the
expression of the transition dipole moment, only applies to the electronic wave
function. The expression for becomes then,
μ fi φ
i r, μ φ
f (r, ) dτe i f ( ) dτN SiSfdτS 3.10
From equation 3.10 one can visualize which terms determine the integrated intensity
(i.e. probability) and the shape of the absorption band. In the first term, one recognizes
the electronic transition moment. The third term is the spin integral overlap, i.e. the
overlap between the spin wave functions of the initial and final states. Since the spin
wave functions of states with different multiplicity (e.g. singlet and triplet) are
orthogonal, this integral will vanish whenever the transition implies a change in spin
multiplicity and the transitions are said to be spin‒forbidden. For example, this integral
will be zero for singlet → triplet transitions, leading to the overall cancellation of the
transition dipole moment for these transitions. Both, the first and third terms contribute
the integrated intensity of the absorption. The second term is the so‒called
Franck‒Condon factor. This term “carries” the responsibility for the shape of the
absorption band. It corresponds to the vibrational (nuclear) overlap between the
vibrational excited state wave function and the ground state lowest vibrational level
wave function. If the potential energy surfaces of the ground state and excited state were
identical, this term will sum up to 1 and all the intensity of the transition will be
concentrated in a sharp band corresponding to the vertical transition 0‒0 (i.e. between
the lowest vibrational levels of the excited and ground states). However, this is
generally not the case in molecules, where both the bond strength and the geometry of
the excited state are often different from the ground state. Vibronic excitation (vibration
and electronic excitation) of the molecule gives raise instead to a vibronic absorption
band structure, i.e. a distribution of the integrated intensity of the electronic transition
over several vibronic peaks. The intensity of each vibronic peak is related to the
Franck‒Condon factor and depends on the overlap between the nuclear wave functions
of the corresponding excited and ground state vibrational levels. For an example of
32
absorption spectra showing clear vibronic structure of the absorption band, see e.g. the
absorption spectra of the anthracene dendrimers (Figure 6.2). Note that such a vibronic
structure of the absorption band often vanishes due to temperature and solvent effects.
Finally, some forbidden transitions may have a substantial intensity due to break down
of the Condon approximation and vibronic coupling.
3.2 THE ELECTRONIC EXCITED STATE AS A NEW MOLECULE
The electronic excited state is energy‒rich compared to the ground state. To have an
idea of the energy gain in the excited state, it is useful to look at the photon energy. The
photon energy ranges from 4.41 x 10⁻¹⁹
J to 2.36 x 10⁻¹⁹
J for the excitation wavelength
range 450‒840 nm used in this work. For comparison to chemical bond energies, one
may express the photon energy in kJ per mole of photons. This corresponds to 266
kJ/mol at 450 nm and to 142 kJ/mol at 840 nm. Such energies are of the same order of
magnitude as bond energies, e.g. 413 kJ/mol for C‒H, 348 kJ/mol for C‒C, 293 kJ/mol
for C‒N. Thus it is no surprise that the behavior of the excited state may strongly differ
from the ground state. In regard to its different charge distribution and high energy
content, the electronic excited state can be viewed as a new molecule with distinct
photo‒physical (e.g. absorption spectrum), reactivity (e.g. association) and redox
properties. The high energy content of excited states also renders excited states
molecules much less stable than ground‒state molecules. They can deactivate by several
photochemical and/or photophysical processes. According to the gold book of IUPAC,
photochemical processes refer to chemical reactions that occur in the electronically
excited states (e.g. isomerization) and are caused by light absorption while
photophysical processes designate processes in which relaxation of the excited state
occurs through radiation and/or radiationless transitions without any chemical
change.155
In my work, deactivation of the electronic excited states mostly occurs via
photophysical processes, while quenching (i.e. electron transfer) is classified as a
photochemical process. The following section only presents photophysical deactivation
processes, while keeping in mind that electron transfer may compete with these
processes depending on the system studied.
3.2.1 EXCITED‒STATE DEACTIVATIONS
A common way to present photophysical deactivation pathways of electronically
excited states is using a schematic energy‒level diagram, so‒called Jablonski diagram
(Figure 3.1).156
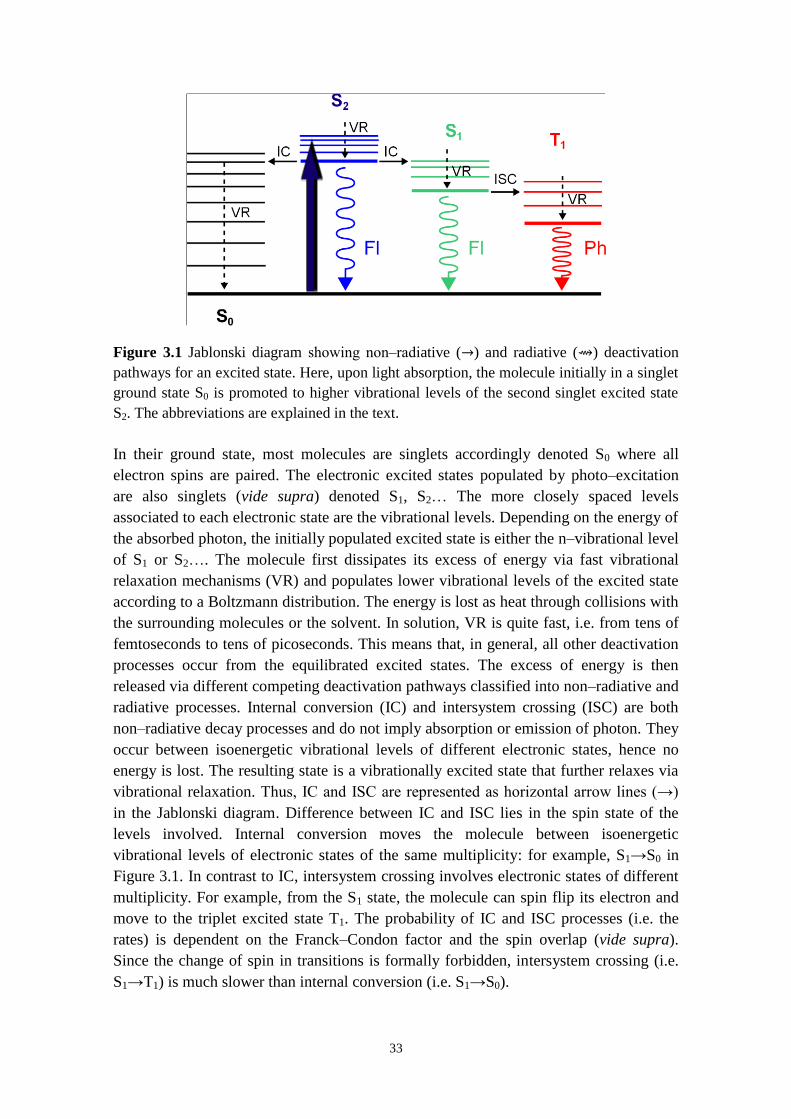
33
Figure 3.1 Jablonski diagram showing non‒radiative ( ) and radiative ( ) deactivation
pathways for an excited state. Here, upon light absorption, the molecule initially in a singlet
ground state S0 is promoted to higher vibrational levels of the second singlet excited state
S2. The abbreviations are explained in the text.
In their ground state, most molecules are singlets accordingly denoted S0 where all
electron spins are paired. The electronic excited states populated by photo‒excitation
are also singlets (vide supra) denoted S1, S2… The more closely spaced levels
associated to each electronic state are the vibrational levels. Depending on the energy of
the absorbed photon, the initially populated excited state is either the n‒vibrational level
of S1 or S2…. The molecule first dissipates its excess of energy via fast vibrational
relaxation mechanisms (VR) and populates lower vibrational levels of the excited state
according to a Boltzmann distribution. The energy is lost as heat through collisions with
the surrounding molecules or the solvent. In solution, VR is quite fast, i.e. from tens of
femtoseconds to tens of picoseconds. This means that, in general, all other deactivation
processes occur from the equilibrated excited states. The excess of energy is then
released via different competing deactivation pathways classified into non‒radiative and
radiative processes. Internal conversion (IC) and intersystem crossing (ISC) are both
non‒radiative decay processes and do not imply absorption or emission of photon. They
occur between isoenergetic vibrational levels of different electronic states, hence no
energy is lost. The resulting state is a vibrationally excited state that further relaxes via
vibrational relaxation. Thus, IC and ISC are represented as horizontal arrow lines (→)
in the Jablonski diagram. Difference between IC and ISC lies in the spin state of the
levels involved. Internal conversion moves the molecule between isoenergetic
vibrational levels of electronic states of the same multiplicity: for example, S1→S0 in
Figure 3.1. In contrast to IC, intersystem crossing involves electronic states of different
multiplicity. For example, from the S1 state, the molecule can spin flip its electron and
move to the triplet excited state T1. The probability of IC and ISC processes (i.e. the
rates) is dependent on the Franck‒Condon factor and the spin overlap (vide supra).
Since the change of spin in transitions is formally forbidden, intersystem crossing (i.e.
S1→T1) is much slower than internal conversion (i.e. S1→S0).
S2
S1 T1
S0
IC
ISC
34
Competing with the non‒radiative IC and ISC are radiative processes that lead to
emission of photons. Radiative processes involve vertical transitions ( ) between
electronic excited states and the ground state. The excess energy is released in the form
of photons with energy matching the energy difference between the two electronic
states. Once more, one distinguishes photon emission from transitions between states of
same spin multiplicity and different spin multiplicity. Singlet emission such as e.g.
S1 S0 is called fluorescence (Fl) and takes place on the nanosecond time scale. Photon
emission occurring from a triplet state, such as T1 S0 is called phosphorescence (Ph).
Similar to intersystem crossing (vide supra), triplet emission is a spin‒forbidden
transition, hence less probable and much slower (i.e. typically microseconds to
milliseconds or even seconds for organic molecules). In Figure 3.1, note that photon
emission is voluntarily represented as potential deactivation pathway only from S1 and
T1. Indeed, due to usually fast internal conversion processes within each high excited
state (Sn, Tn, n> 1) and fast vibrational relaxation, the emitting level of a given
multiplicity is the lowest excited level of that multiplicity (Kasha’s rule157
). While most
molecules obey this rule, exceptions exist, e.g. azulene,158
some porphyrins159
and some
phthalocyanines160
for which emission from the S2 state is observed.
In the special case of a donor‒acceptor couple, the donor excited state may be quenched
via energy and/or electron transfer to the acceptor. In that sense, the excess energy
stored in the excited state may be used to perform reactions which thermodynamically
will not be possible from the ground state. For example, in the natural photosynthesis,
the energy stored in the excited states triggers a cascade of electron transfer steps that
ultimately results in a charge‒separated state with sufficient energy for water splitting
and carbon dioxide reduction (vide supra).
3.2.2 RATES, LIFETIMES AND QUANTUM YIELDS
We have seen that Jablonski diagrams are particularly useful to map the different
pathways that deactivate electronically excited states. Highlighted by such energy level
diagrams is also the competition between these pathways. Whether the excited state will
follow a particular pathway i will depend on the relative probability of this pathway
with respect to the others. For an ensemble of molecules, this is the rate constant of
the pathway i with respect to others that tells us about the probability of this pathway to
occur (i.e. a transition). Intimately linked to the rate constants of the different
deactivation pathways is the lifetime τ of the excited state.
All deactivation pathways presented in Figure 3.1 are intramolecular reactions, hence
assuming first‒order decay of the excited state population N(t) as in equation 3.11 is
appropriate.
dN(t)
dt ‒ kj
j
N t ‒ N(t)
τ 3.11
35
kjj is the sum over all the rate constants that depopulate the excited state. According
to equation 3.11, the lifetime τ can be expressed as
τ 1
kjj
1
kf knr
1
kf kIC kISC 3.12
In equation 3.12, kf is the fluorescence rate constant. knr represents the sum over the
rate constants of non‒radiative processes. In Figure 3.1, this sum consists of kIC the rate
constant of internal conversion and kISC the rate constant of intersystem crossing. The
probability of the excited state to deactivate through the given process i, i.e. quantum
yield of the deactivation process i, denoted Φi, is then given by,
Φi ki
kjj
ki τ 3.13
Most non‒radiative processes have rate constants and quantum yields that are not
directly accessible experimentally. In constrast, radiative processes, i.e. fluorescence
and phosphorescence can be experimentally measured. Photon emitted from
electronically excited states can not only be detected but also counted using different
experimental techniques named fluorescence spectroscopy. Further experimental details
on fluorescence spectroscopy are given in chapter 4. From such experiments, two
quantities are often determined: the fluorescence lifetime τf and the fluorescence
quantum yield Φf. τf describes how fast the fluorescence intensity of an ensemble of
molecules decays over time, while Φf represents the number of photons emitted per
photons absorbed. Both are directly related to the radiative rate constants and the sum of
the non‒radiative rate constants through equations 3.14 and 3.15. Combining both
equations enable to evaluate kf and knr from the experimental values of Φf and τf,
according to equations 3.16 and 3.17, respectively.
Φf kf
kjj
kf
kf knr 3.14
τf 1
kf knr 3.15
kf Φf
τf 3.16
knr (1 ‒ Φ
f)
τf 3.17
Indirectly fluorescence spectroscopy can also provide valuable information on electron
and energy transfer processes in donor‒acceptor systems. The excited state is then
further depopulated by energy or electron transfer. In equations 3.14 and 3.15, knr
increases due to the additional reaction rates associated to energy or electron transfer. It
results in both a lower fluorescence quantum yield and a shorter fluorescence lifetime
compared to the same molecular system without acceptor group.
36
3.3 ELECTRON TRANSFER THEORY
The electron transfer (ET) reactions described in this thesis are intramolecular electron
transfer reactions. In electron donor‒acceptor (D‒A) systems, this reaction consists of
the transfer of an electron between the electron donating (D) and accepting (A) parts of
the molecular system. In this work, ET reactions are triggered using light excitation by
selectively exciting either the donor or the acceptor. These reactions are called
photoinduced electron transfer reactions and can be described by the following reaction,
D‒A hc λ → D ‒A kET D ‒A
‒ 3.18
Here, the donor is initially excited and the ET reaction is the transfer of an electron from
the donor excited state D* to the ground state acceptor A. The product of the ET reaction
is the charge‒separated state, D• ‒A
•-.
3.3.1 MARCUS THEORY
Just as chemical reactions, electron transfer reactions can be described by motion of
atoms along potential energy surfaces. Here, the potential energy surfaces are the ones
of the photo‒excited reactant D*‒A and the ET product D
• ‒A
•- (reaction 3.18) as
function of the reaction coordinate (Figure 3.2). The reaction coordinates include the
vibrational (nuclear) coordinates of the reacting molecules and the position and
orientation of the solvent molecules. Since electron transfer is a dark reaction, it will
only occur at the configuration of the reacting system (reaction coordinate/potential
energy) that satisfies both energy conservation and Franck‒Condon conditions. These
conditions are fulfilled at the crossing point between the two surfaces, the so‒called
transition state TS. Indeed at the TS, both the reactant and the product have classically
the same energy. Moreover, the transfer occurs at fixed positions of the atoms, and
hence the Franck‒Condon principle is also satisfied. At the transition state, the
electronic coupling between the donor and the acceptor, VDA causes a splitting of the
two surfaces (Figure 3.2). The extent of this splitting, i.e. the electronic coupling will in
part determine the probability of D*‒A to cross over the “mountain pass” and form
D• ‒A
•-. Other factors intervene in an electron transfer “journey”. At the beginning of
the ET journey, the reacting D*‒A is in a valley (the lower left region of Figure 3.2).
Hence to reach TS, D*‒A needs to first distort along the reaction coordinate from its
equilibrium position to the transition state, i.e. changes in bond lengths. This requires
energy called activation energy, ∆G≠. Formation of D
• ‒A
•- is also characterized by a
change in dipole moment with respect D*‒A. As pointed out first by Libby,
161 this
charge‒separated state is formed initially in a “unsuitable” solvent environment, i.e. the
surrounding solvent molecules do not have time to rearrange on the short time scale of
ET to accommodate the changes in polarization. Reorganization of the solvent
molecules to bring D• ‒A
•- to its equilibrium state again requires energy that is involved
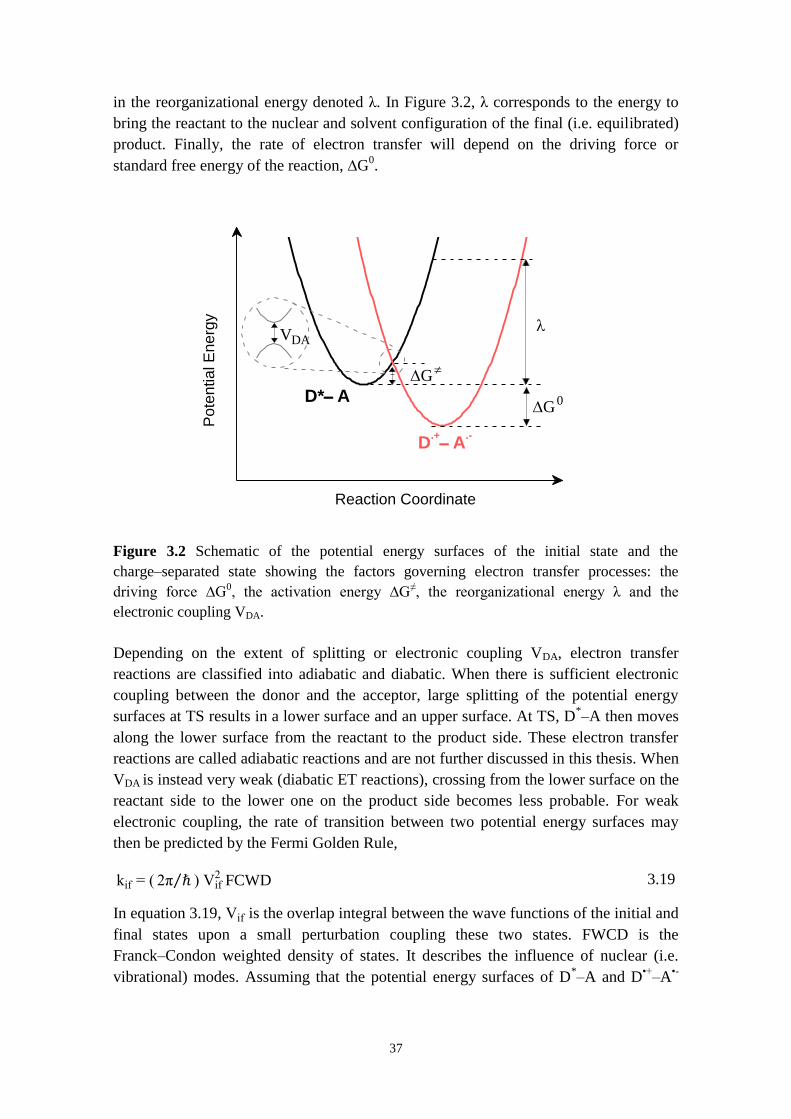
37
in the reorganizational energy denoted λ. In Figure 3.2, λ corresponds to the energy to
bring the reactant to the nuclear and solvent configuration of the final (i.e. equilibrated)
product. Finally, the rate of electron transfer will depend on the driving force or
standard free energy of the reaction, ∆G0.
Figure 3.2 Schematic of the potential energy surfaces of the initial state and the
charge‒separated state showing the factors governing electron transfer processes: the
driving force ∆G0, the activation energy ∆G≠, the reorganizational energy λ and the
electronic coupling VDA.
Depending on the extent of splitting or electronic coupling VDA, electron transfer
reactions are classified into adiabatic and diabatic. When there is sufficient electronic
coupling between the donor and the acceptor, large splitting of the potential energy
surfaces at TS results in a lower surface and an upper surface. At TS, D*‒A then moves
along the lower surface from the reactant to the product side. These electron transfer
reactions are called adiabatic reactions and are not further discussed in this thesis. When
VDA is instead very weak (diabatic ET reactions), crossing from the lower surface on the
reactant side to the lower one on the product side becomes less probable. For weak
electronic coupling, the rate of transition between two potential energy surfaces may
then be predicted by the Fermi Golden Rule,
kif ( 2π ) if 2 FCWD 3.19
In equation 3.19, if is the overlap integral between the wave functions of the initial and
final states upon a small perturbation coupling these two states. FWCD is the
Franck‒Condon weighted density of states. It describes the influence of nuclear (i.e.
vibrational) modes. Assuming that the potential energy surfaces of D*‒A and D
• ‒A
•-
D.+A
.-
DAV
0G
Pote
ntial E
nerg
y
Reaction Coordinate
D*A
G
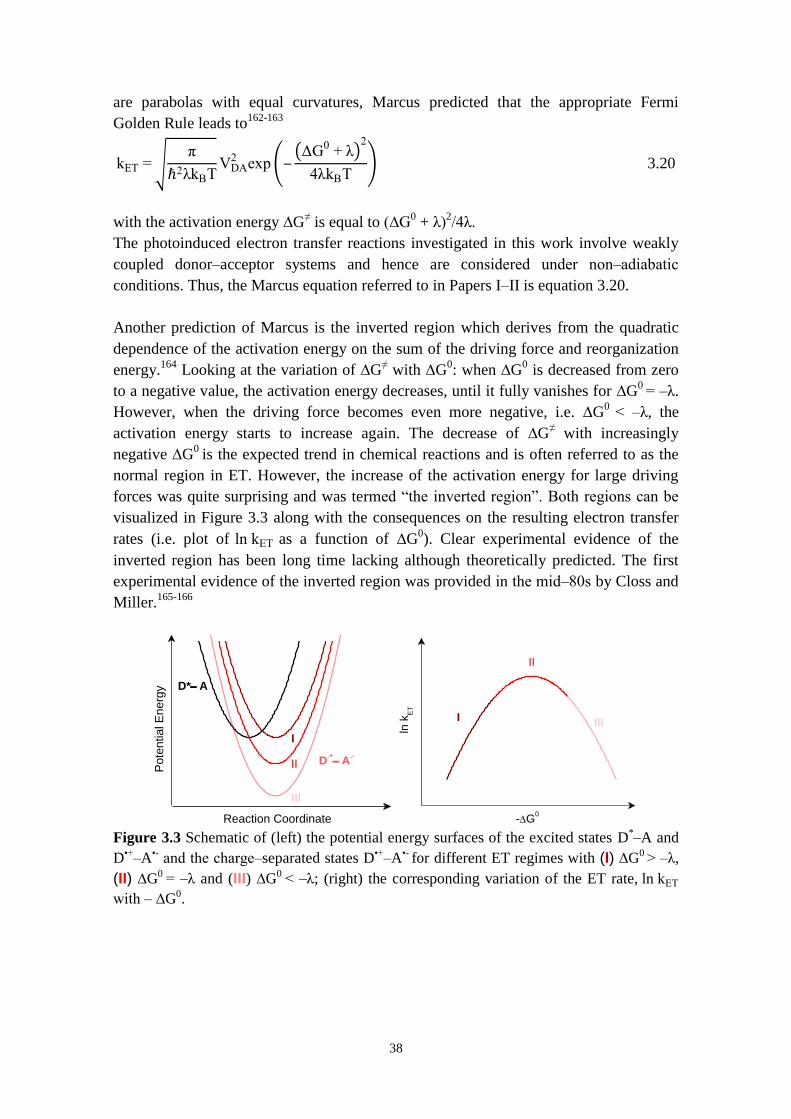
38
are parabolas with equal curvatures, Marcus predicted that the appropriate Fermi
Golden Rule leads to162-163
kET π
2λkBT DA
2 exp G0 λ
2
4λkBT 3.20
with the activation energy ∆G≠ is equal to (∆G
0 + λ)
2 4λ.
The photoinduced electron transfer reactions investigated in this work involve weakly
coupled donor‒acceptor systems and hence are considered under non‒adiabatic
conditions. Thus, the Marcus equation referred to in Papers I‒II is equation 3.20.
Another prediction of Marcus is the inverted region which derives from the quadratic
dependence of the activation energy on the sum of the driving force and reorganization
energy.164
Looking at the variation of ∆G≠ with ∆G
0: when ∆G
0 is decreased from zero
to a negative value, the activation energy decreases, until it fully vanishes for ∆G0 ‒λ.
However, when the driving force becomes even more negative, i.e. ∆G0 < ‒λ, the
activation energy starts to increase again. The decrease of ∆G≠ with increasingly
negative ∆G0
is the expected trend in chemical reactions and is often referred to as the
normal region in ET. However, the increase of the activation energy for large driving
forces was quite surprising and was termed “the inverted region”. Both regions can be
visualized in Figure 3.3 along with the consequences on the resulting electron transfer
rates (i.e. plot of ln kET as a function of ∆G0). Clear experimental evidence of the
inverted region has been long time lacking although theoretically predicted. The first
experimental evidence of the inverted region was provided in the mid‒80s by Closs and
Miller.165-166
Figure 3.3 Schematic of (left) the potential energy surfaces of the excited states D*‒A and
D• ‒A•- and the charge‒separated states D• ‒A•- for different ET regimes with (I) ∆G0 > ‒λ,
(II) ∆G0 ‒λ and (III) ∆G0 < ‒λ; (right) the corresponding variation of the ET rate, ln kET
with ‒ ∆G0.
D.+A
.-
D*A
III
II
Reaction Coordinate
Pote
ntial E
nerg
y
I
-G0
III
II
I
ln k
ET
39
The driving force
As illustrated in Figure 3.2, the driving force, ∆G0
corresponds to the energy difference
between the lowest vibronic levels of the donor excited state D*‒A and the charge
separated state D• ‒A
•-. Forming D
• ‒A
•- from D
*‒A is downhill in energy. The system
loses energy (∆G0
< 0), and hence ET is thermodynamically favorable from
photoexcited states. In contrast, the same reaction from the ground state will be highly
unlikely to occur. ∆G0 may be estimated from the redox potentials of the donor/acceptor
couple and from the energy stored in the excited state using the Rehm‒Weller
equation,167
∆G0 e Eox ‒ Ered ‒ E0‒0
e2
4πε0 DA
e2
4πε0 1
εS ‒
1
εSref
1
2 D
1
2 A
3.21
where Eox is the oxidation potential of the donor and Ered is the reduction potential of the
acceptor. E0‒0 is the energy of the 0‒0 transition of the donor, i.e. the energy difference
between the thermally relaxed excited state and ground state of the donor. The oxidation
and reduction potentials can be experimentally determined by e.g. cyclic voltammetry.
E0‒0 can be estimated spectroscopically, preferably from the wavelength corresponding
to the intersection of the normalized absorption and emission spectra. The third term in
equation 3.21 is a coulombic stabilization term, and hence a function of the inverse of
the donor‒acceptor distance, RDA. Finally, the fourth term is a correction factor that may
be used when electrochemical and spectroscopic measurements are carried out in
different solvents. εS and εSref are the dielectric constants of the solvent in which the
spectroscopic and electrochemical measurements were conducted, respectively. RD and
RA are the radii of the donor and acceptor, respectively.
The reorganization energy
Both the reactant and solvent nuclear modes contribute to the reorganization energy, λ,
which can then be expressed as the sum of two independent parts, i.e. λin and λout,
λ λin λout λin e2
4πε0
1
2 D
1
2 A
‒ 1
DA
1
n2 ‒
1
εS 3.22
λin represents the reorganization of the inner (reactant) nuclear modes, i.e. changes in
bond lengths and bond angles that D*‒A undergoes when moving from the reactant to
the product nuclear configuration. λout involves the reorganization of the outer (solvent)
nuclear modes which accompany ET and accommodate changes in polarization around
the donor/acceptor couple. In most cases, in polar solvents, λout is the dominant term in
the expression of λ for electron transfer reactions. By approximating the donor and
acceptor to spheres, λout can be estimated from the refractive index and the dielectric
constant of the solvent εS.168
This expression for λout implies that λout will be particularly
large in polar solvents and when RDA is large.
40
3.3.2 ELECTRON TRANSFER IN DONOR‒BRIDGE‒ACCEPTOR SYSTEMS
In D‒B‒A systems, due to the large distance separating the donor/acceptor couple,
electron transfer occurs preferentially through‒bond, mediated by the bridge. Two
alternative mechanisms for through‒bond ET are generally proposed: namely the
coherent tunneling or incoherent hopping mechanism (Figure 3.4). In coherent
tunneling, electronic communication between the donor and acceptor is sustained by
interaction of the initial and final states of the system with high energy virtual states of
the bridges. Such electronic communication is often described by the superexchange
model (vide infra) which assumes donor and acceptor states energetically well separated
from the bridge states (i.e. large injection energy barrier ∆E).169-171
Thus, no bridge state
is ever populated during electron or hole transfer. In contrast, the incoherent hopping
mechanism implies real intermediate bridge states in the electron or hole transport
between the donor and acceptor. Thus, it is often observed for nearly resonant
donor/acceptor and bridge states (i.e. low ∆E) or downhill energy gradient within the
D‒B‒A system. Since bridge states are temporarily populated during transport, the
incoherent mechanism is often referred to as thermally activated hopping.172-173
In many
D‒B‒A systems, both mechanisms are expected to contribute to the transfer and this has
been observed experimentally by several groups.83, 90, 174
For the coherent electron tunneling mechanism, mixing of the donor/acceptor states
with virtual bridge states is described by the so‒called superexchange model.170-171, 175
For a bridge consisting of n identical subunits Bn as in Figure 3.4, this model relates the
total donor/acceptor electronic coupling DA to localized electronic interactions
between neighboring individual subunits according to equation 3.23,
DA DB BA
E BB
E n 1
3.23
where VDB and VBA are the electronic coupling of the bridge to the donor and acceptor,
respectively. VBB represents the interaction between adjacent bridge subunits and ∆E is
the injection energy barrier between the relevant donor/acceptor and bridge localized
states (Figure 3.4). The reciprocal dependence of the total electronic coupling on the
injection barrier was experimentally demonstrated by Albinsson and co‒workers by
treating the bridge in a series of OPE‒based bridge D‒B‒A systems as a single
chromophore.29
Moreover, if the electronic coupling between bridge subunits is small
compared to the injection energy barrier (i.e. VBB << ∆E) and the donor‒acceptor
distance is directly proportional to the length of one subunit R0 (i.e. RDA = nR0), an
exponential distance dependence of VDA and the rate kET is obtained,
kET k0 exp ‒ β DA 3.24
where k0 is the limiting rate at donor‒acceptor contact. is the so‒called attenuation
factor, that is, within this approximation, given by equation 3.25.
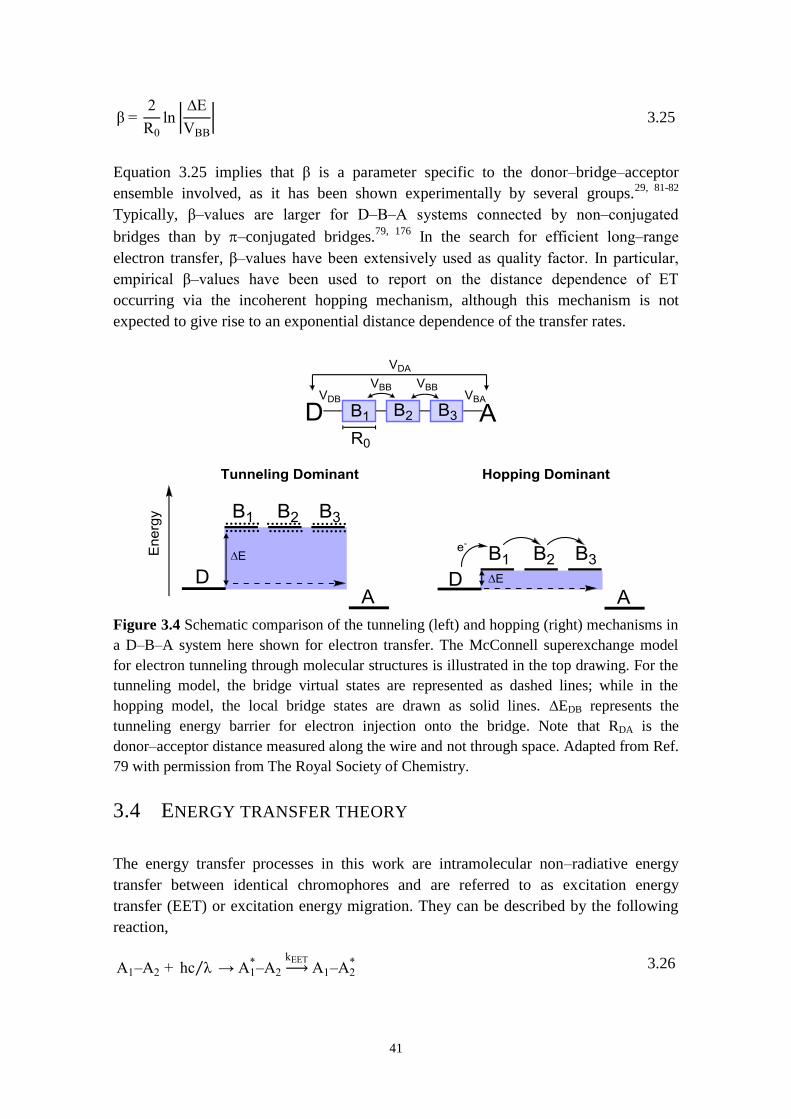
41
β 2
0
ln ∆E
BB
3.25
Equation 3.25 implies that β is a parameter specific to the donor‒bridge‒acceptor
ensemble involved, as it has been shown experimentally by several groups.29, 81-82
Typically, β‒values are larger for D‒B‒A systems connected by non‒conjugated
bridges than by ‒conjugated bridges.79, 176
In the search for efficient long‒range
electron transfer, β‒values have been extensively used as quality factor. In particular,
empirical β‒values have been used to report on the distance dependence of ET
occurring via the incoherent hopping mechanism, although this mechanism is not
expected to give rise to an exponential distance dependence of the transfer rates.
Figure 3.4 Schematic comparison of the tunneling (left) and hopping (right) mechanisms in
a D‒B‒A system here shown for electron transfer. The McConnell superexchange model
for electron tunneling through molecular structures is illustrated in the top drawing. For the
tunneling model, the bridge virtual states are represented as dashed lines; while in the
hopping model, the local bridge states are drawn as solid lines. ∆EDB represents the
tunneling energy barrier for electron injection onto the bridge. Note that RDA is the
donor‒acceptor distance measured along the wire and not through space. Adapted from Ref.
79 with permission from The Royal Society of Chemistry.
3.4 ENERGY TRANSFER THEORY
The energy transfer processes in this work are intramolecular non‒radiative energy
transfer between identical chromophores and are referred to as excitation energy
transfer (EET) or excitation energy migration. They can be described by the following
reaction,
A1‒A2 hc λ → A1 ‒A2
kEET A1‒A2
3.26
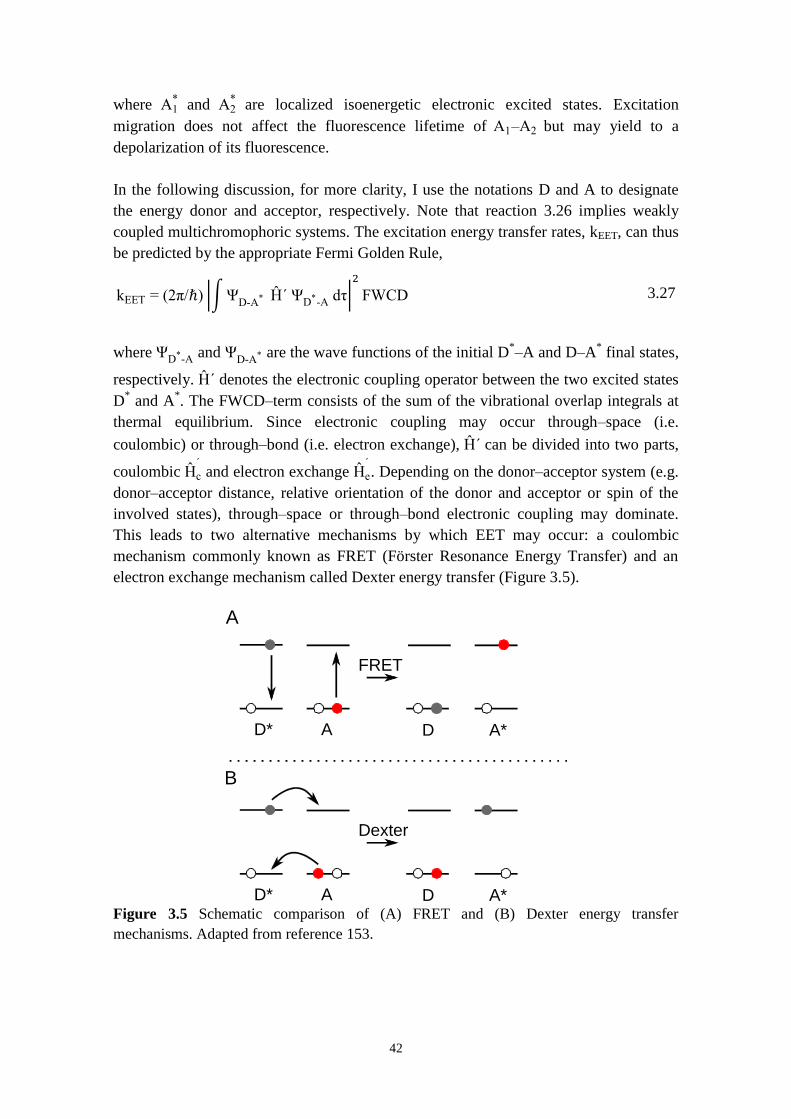
42
where A1
and A2
are localized isoenergetic electronic excited states. Excitation
migration does not affect the fluorescence lifetime of A1‒A2 but may yield to a
depolarization of its fluorescence.
In the following discussion, for more clarity, I use the notations D and A to designate
the energy donor and acceptor, respectively. Note that reaction 3.26 implies weakly
coupled multichromophoric systems. The excitation energy transfer rates, kEET, can thus
be predicted by the appropriate Fermi Golden Rule,
kEET (2π ) ΨD A
Ĥ´ ΨD A dτ
FWCD 3.27
where ΨD -A
and ΨD-A
are the wave functions of the initial D*‒A and D‒A
* final states,
respectively. Ĥ´ denotes the electronic coupling operator between the two excited states
D* and A
*. The FWCD‒term consists of the sum of the vibrational overlap integrals at
thermal equilibrium. Since electronic coupling may occur through‒space (i.e.
coulombic) or through‒bond (i.e. electron exchange), Ĥ´ can be divided into two parts,
coulombic Ĥc
´ and electron exchange Ĥe
´. Depending on the donor‒acceptor system (e.g.
donor‒acceptor distance, relative orientation of the donor and acceptor or spin of the
involved states), through‒space or through‒bond electronic coupling may dominate.
This leads to two alternative mechanisms by which EET may occur: a coulombic
mechanism commonly known as FRET (Förster Resonance Energy Transfer) and an
electron exchange mechanism called Dexter energy transfer (Figure 3.5).
Figure 3.5 Schematic comparison of (A) FRET and (B) Dexter energy transfer
mechanisms. Adapted from reference 153.
D* A D A*
FRET
D* A D A*
Dexter
A
B
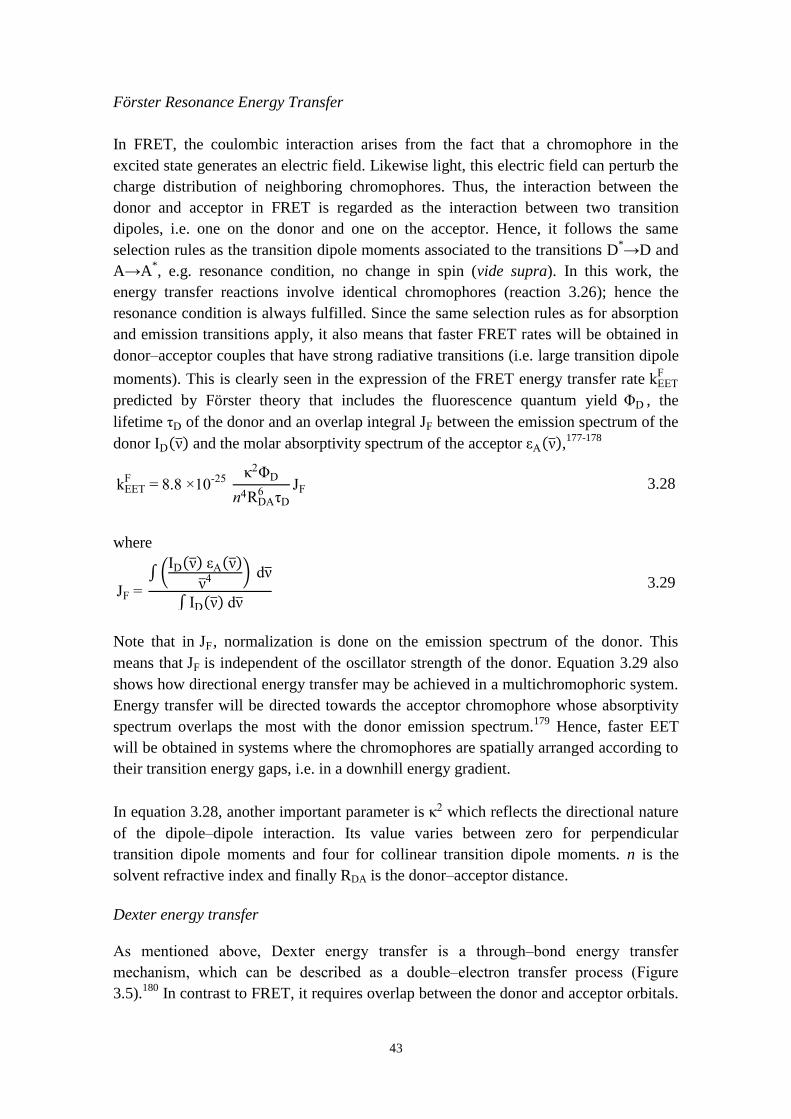
43
Förster Resonance Energy Transfer
In FRET, the coulombic interaction arises from the fact that a chromophore in the
excited state generates an electric field. Likewise light, this electric field can perturb the
charge distribution of neighboring chromophores. Thus, the interaction between the
donor and acceptor in FRET is regarded as the interaction between two transition
dipoles, i.e. one on the donor and one on the acceptor. Hence, it follows the same
selection rules as the transition dipole moments associated to the transitions D*→D and
A→A*, e.g. resonance condition, no change in spin (vide supra). In this work, the
energy transfer reactions involve identical chromophores (reaction 3.26); hence the
resonance condition is always fulfilled. Since the same selection rules as for absorption
and emission transitions apply, it also means that faster FRET rates will be obtained in
donor‒acceptor couples that have strong radiative transitions (i.e. large transition dipole
moments). This is clearly seen in the expression of the FRET energy transfer rate kEETF
predicted by Förster theory that includes the fluorescence quantum yield ΦD , the
lifetime τD of the donor and an overlap integral F between the emission spectrum of the
donor ID ν and the molar absorptivity spectrum of the acceptor εA ν ,177-178
kEETF 8.8 10 25
2ΦD
n4 DA6 τD
F 3.28
where
F
ID ν εA ν
ν 4 dν
ID ν dν
3.29
Note that in F, normalization is done on the emission spectrum of the donor. This
means that F is independent of the oscillator strength of the donor. Equation 3.29 also
shows how directional energy transfer may be achieved in a multichromophoric system.
Energy transfer will be directed towards the acceptor chromophore whose absorptivity
spectrum overlaps the most with the donor emission spectrum.179
Hence, faster EET
will be obtained in systems where the chromophores are spatially arranged according to
their transition energy gaps, i.e. in a downhill energy gradient.
In equation 3.28, another important parameter is 2 which reflects the directional nature
of the dipole‒dipole interaction. Its value varies between zero for perpendicular
transition dipole moments and four for collinear transition dipole moments. n is the
solvent refractive index and finally RDA is the donor‒acceptor distance.
Dexter energy transfer
As mentioned above, Dexter energy transfer is a through‒bond energy transfer
mechanism, which can be described as a double‒electron transfer process (Figure
3.5).180
In contrast to FRET, it requires overlap between the donor and acceptor orbitals.
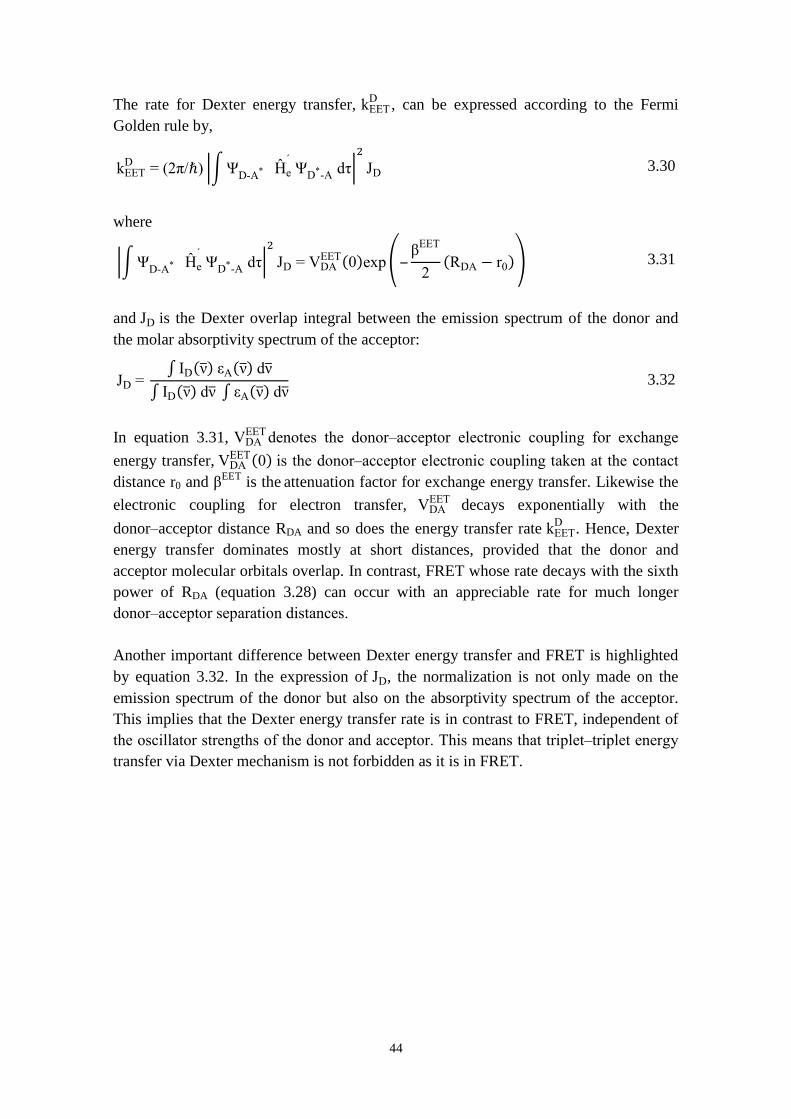
44
The rate for Dexter energy transfer, kEETD
, can be expressed according to the Fermi
Golden rule by,
kEETD
(2π ) ΨD A
Ĥe
´ Ψ
D A dτ
D 3.30
where
ΨD A
Ĥe
´ Ψ
D A dτ
D DAEET 0 exp
βEET
2 DA r0 3.31
and D is the Dexter overlap integral between the emission spectrum of the donor and
the molar absorptivity spectrum of the acceptor:
D ID ν εA ν dν
ID ν dν εA ν dν 3.32
In equation 3.31, DAEETdenotes the donor‒acceptor electronic coupling for exchange
energy transfer, DAEET 0 is the donor‒acceptor electronic coupling taken at the contact
distance r0 and βEET
is the attenuation factor for exchange energy transfer. Likewise the
electronic coupling for electron transfer, DAEET decays exponentially with the
donor‒acceptor distance RDA and so does the energy transfer rate kEETD
. Hence, Dexter
energy transfer dominates mostly at short distances, provided that the donor and
acceptor molecular orbitals overlap. In contrast, FRET whose rate decays with the sixth
power of RDA (equation 3.28) can occur with an appreciable rate for much longer
donor‒acceptor separation distances.
Another important difference between Dexter energy transfer and FRET is highlighted
by equation 3.32. In the expression of D, the normalization is not only made on the
emission spectrum of the donor but also on the absorptivity spectrum of the acceptor.
This implies that the Dexter energy transfer rate is in contrast to FRET, independent of
the oscillator strengths of the donor and acceptor. This means that triplet‒triplet energy
transfer via Dexter mechanism is not forbidden as it is in FRET.

45
4 PUT THE THEORY TO WORK: IN
PRACTICE
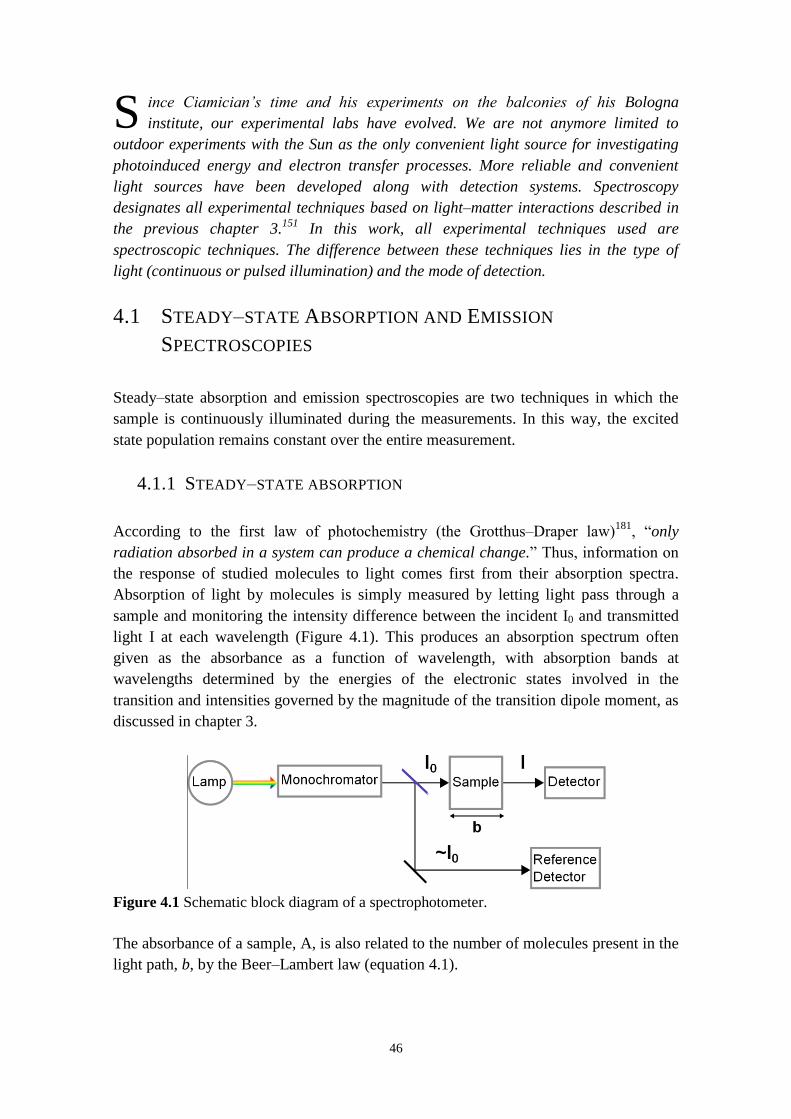
46
ince Ciamician’s time and his experiments on the balconies of his Bologna
institute, our experimental labs have evolved. We are not anymore limited to
outdoor experiments with the Sun as the only convenient light source for investigating
photoinduced energy and electron transfer processes. More reliable and convenient
light sources have been developed along with detection systems. Spectroscopy
designates all experimental techniques based on light‒matter interactions described in
the previous chapter 3.151
In this work, all experimental techniques used are
spectroscopic techniques. The difference between these techniques lies in the type of
light (continuous or pulsed illumination) and the mode of detection.
4.1 STEADY‒STATE ABSORPTION AND EMISSION
SPECTROSCOPIES
Steady‒state absorption and emission spectroscopies are two techniques in which the
sample is continuously illuminated during the measurements. In this way, the excited
state population remains constant over the entire measurement.
4.1.1 STEADY‒STATE ABSORPTION
According to the first law of photochemistry (the Grotthus‒Draper law)181
, “only
radiation absorbed in a system can produce a chemical change.” Thus, information on
the response of studied molecules to light comes first from their absorption spectra.
Absorption of light by molecules is simply measured by letting light pass through a
sample and monitoring the intensity difference between the incident I0 and transmitted
light I at each wavelength (Figure 4.1). This produces an absorption spectrum often
given as the absorbance as a function of wavelength, with absorption bands at
wavelengths determined by the energies of the electronic states involved in the
transition and intensities governed by the magnitude of the transition dipole moment, as
discussed in chapter 3.
Figure 4.1 Schematic block diagram of a spectrophotometer.
The absorbance of a sample, A, is also related to the number of molecules present in the
light path, b, by the Beer‒Lambert law (equation 4.1).
Lamp Sample DetectorMonochromatorI0 I
b
Reference
Detector
~I0
S
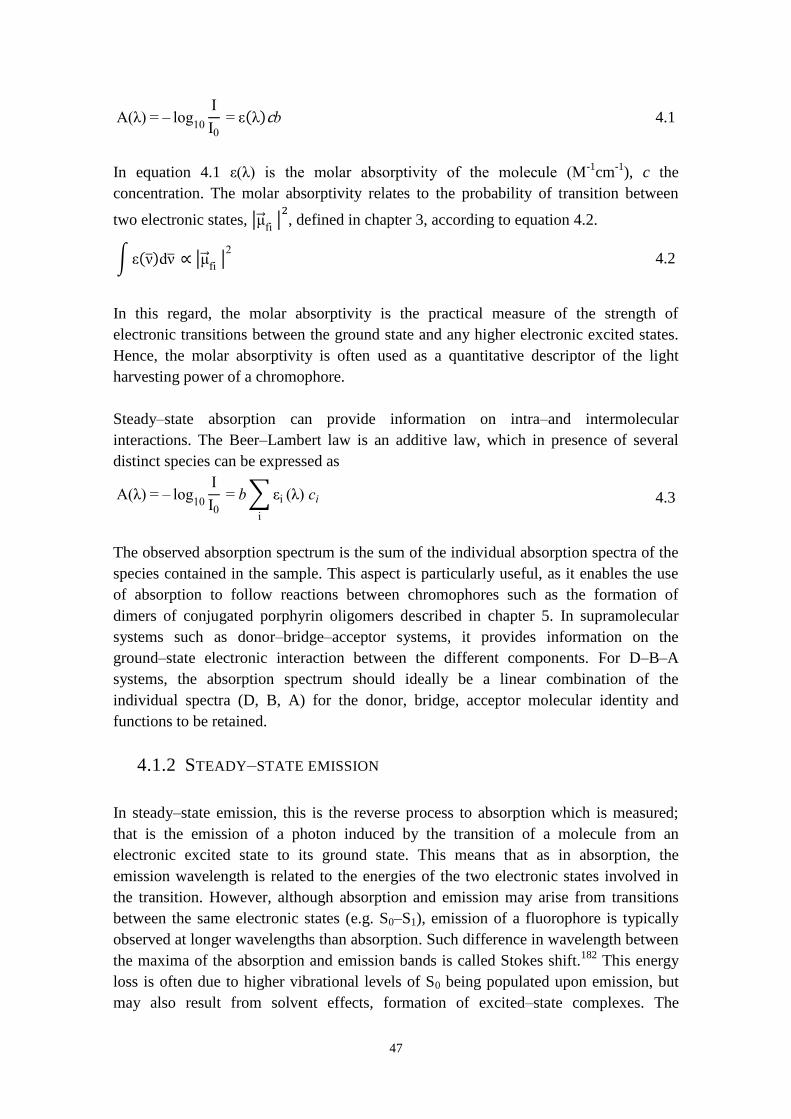
47
A(λ) ‒ log10
I
I0 ε λ b 4.1
In equation 4.1 ε(λ) is the molar absorptivity of the molecule (M-1
cm-1
), c the
concentration. The molar absorptivity relates to the probability of transition between
two electronic states, μ fi , defined in chapter 3, according to equation 4.2.
ε ν dν μ fi 2 4.2
In this regard, the molar absorptivity is the practical measure of the strength of
electronic transitions between the ground state and any higher electronic excited states.
Hence, the molar absorptivity is often used as a quantitative descriptor of the light
harvesting power of a chromophore.
Steady‒state absorption can provide information on intra‒and intermolecular
interactions. The Beer‒Lambert law is an additive law, which in presence of several
distinct species can be expressed as
A(λ) ‒ log10
I
I0 b εi
i
(λ) ci 4.3
The observed absorption spectrum is the sum of the individual absorption spectra of the
species contained in the sample. This aspect is particularly useful, as it enables the use
of absorption to follow reactions between chromophores such as the formation of
dimers of conjugated porphyrin oligomers described in chapter 5. In supramolecular
systems such as donor‒bridge‒acceptor systems, it provides information on the
ground‒state electronic interaction between the different components. For D‒B‒A
systems, the absorption spectrum should ideally be a linear combination of the
individual spectra (D, B, A) for the donor, bridge, acceptor molecular identity and
functions to be retained.
4.1.2 STEADY‒STATE EMISSION
In steady‒state emission, this is the reverse process to absorption which is measured;
that is the emission of a photon induced by the transition of a molecule from an
electronic excited state to its ground state. This means that as in absorption, the
emission wavelength is related to the energies of the two electronic states involved in
the transition. However, although absorption and emission may arise from transitions
between the same electronic states (e.g. S0‒S1), emission of a fluorophore is typically
observed at longer wavelengths than absorption. Such difference in wavelength between
the maxima of the absorption and emission bands is called Stokes shift.182
This energy
loss is often due to higher vibrational levels of S0 being populated upon emission, but
may also result from solvent effects, formation of excited‒state complexes. The
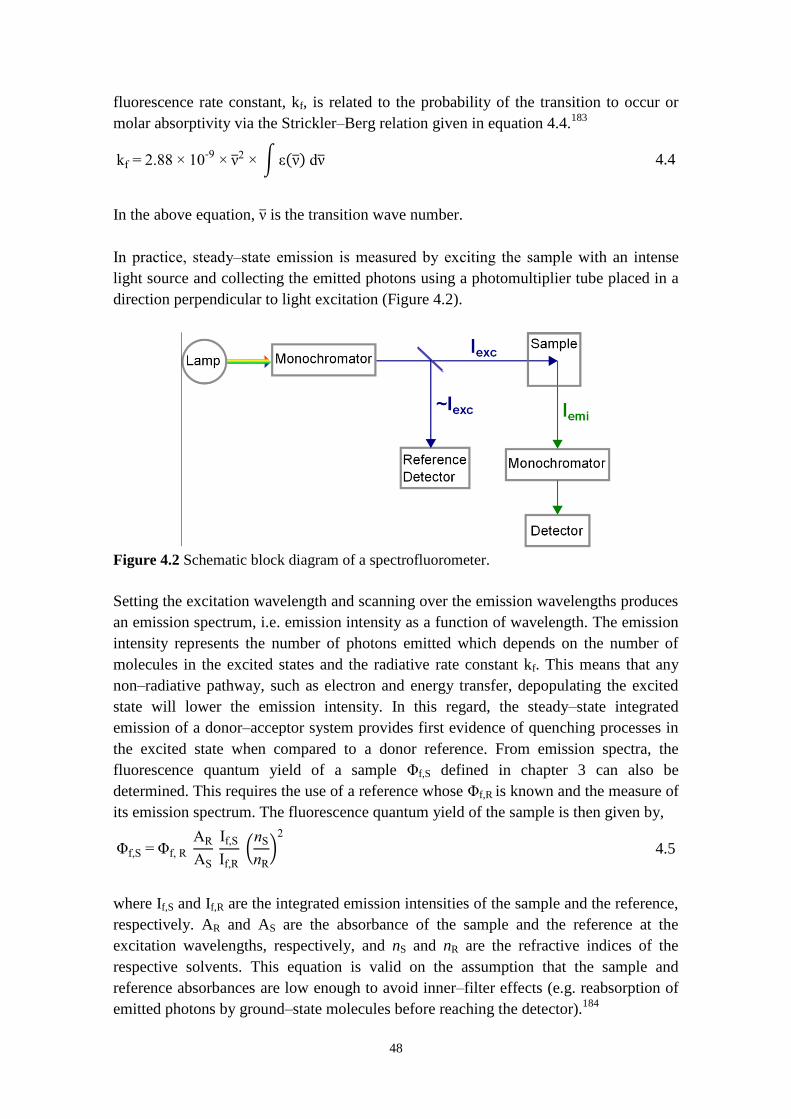
48
fluorescence rate constant, kf, is related to the probability of the transition to occur or
molar absorptivity via the Strickler‒Berg relation given in equation 4.4.183
kf 2.88 10 ν 2 ε ν dν 4.4
In the above equation, ν is the transition wave number.
In practice, steady‒state emission is measured by exciting the sample with an intense
light source and collecting the emitted photons using a photomultiplier tube placed in a
direction perpendicular to light excitation (Figure 4.2).
Figure 4.2 Schematic block diagram of a spectrofluorometer.
Setting the excitation wavelength and scanning over the emission wavelengths produces
an emission spectrum, i.e. emission intensity as a function of wavelength. The emission
intensity represents the number of photons emitted which depends on the number of
molecules in the excited states and the radiative rate constant kf. This means that any
non‒radiative pathway, such as electron and energy transfer, depopulating the excited
state will lower the emission intensity. In this regard, the steady‒state integrated
emission of a donor‒acceptor system provides first evidence of quenching processes in
the excited state when compared to a donor reference. From emission spectra, the
fluorescence quantum yield of a sample Φf,S defined in chapter 3 can also be
determined. This requires the use of a reference whose Φf,R is known and the measure of
its emission spectrum. The fluorescence quantum yield of the sample is then given by,
Φf,S Φf, A
AS
If,S
If,
nS
n 2
4.5
where If,S and If,R are the integrated emission intensities of the sample and the reference,
respectively. AR and AS are the absorbance of the sample and the reference at the
excitation wavelengths, respectively, and nS and nR are the refractive indices of the
respective solvents. This equation is valid on the assumption that the sample and
reference absorbances are low enough to avoid inner‒filter effects (e.g. reabsorption of
emitted photons by ground‒state molecules before reaching the detector).184
Iexc
Iemi
Lamp
49
Another type of measurement is steady‒state excitation spectrum. Instead of scanning
over the emission wavelengths, one sets the emission wavelength and scans over the
excitation wavelengths, i.e. the absorption bands of the sample. This produces an
excitation spectrum that reflects the dependence of the emission intensity on the
excitation wavelength. In general, most fluorophores have their emission spectra that
are independent of the excitation wavelength (Kasha’s rule).157
Consequently, their
excitation spectra resemble their absorption spectra. However, in complex fluorophore
mixtures (i.e. in presence of several emitting electronic states), steady‒state excitation
may generate an excitation spectrum that reproduces partially the absorption spectrum
of the sample. If the fluorophores have slightly different emission wavelengths, the
excitation spectrum will resemble the absorption spectrum of one or another emitting
species present in the sample depending on the set emission wavelength. In this regard,
steady‒state excitation can provide information on the emitting states.
Steady‒state methods, absorption and emission, provide both qualitative and
quantitative information on the ground state and excited states of molecules,
respectively. However they do not permit access to the time dimension of the absorption
and emission processes, neither to determine the nature of quenching processes (e.g.
electron and/or energy transfer). This requires more sophisticated techniques such as the
ones described in the next section.
4.2 TIME‒RESOLVED SPECTROSCOPIES
4.2.1 LASERS
An important constraint in the study of excited‒state processes is the intrinsic transient
character of the excited states and their short lifetimes (sub‒nanoseconds to
nanoseconds). Thus, to resolve these excited‒state processes, a primary requirement is a
light source able to excite the sample on a time scale that is faster than its lifetime.
Lasers fulfill this requirement, more particularly ultrafast lasers. Developed in the 1980s
by Moulton at Lincoln Laboratory, titanium‒doped sapphire (Ti: Al2O3) lasers produce
ultra‒short laser pulses with sub‒picosecond FWHM (< 10-12
s).185
A second
requirement that is equally important to the first one is being able to monitor ultrafast
excited‒states processes that follow photo‒excitation, i.e. electron and energy transfer
reactions in this work. By “monitor” one means to time‒resolve these processes, i.e.
determine their kinetics. This can be done using the pump‒probe technique. In
particular, this technique was used demonstrated by Prof Ahmed H. Zewail as a means
to follow intermediates states of chemical reactions for which he received the Nobel
Prize in Chemistry 1999.186
In this work, we were interested in monitoring electron and
energy transfer processes occurring from electronically excited states on the time scale
of few picoseconds to hundreds of picoseconds. Thus, we also used a pump‒probe
technique, namely transient absorption which enables recording of the change in the
sample’s absorbance induced by light as function of time.
50
4.2.2 TRANSIENT ABSORPTION
Figure 4.3 shows the experimental set up of pump‒probe transient absorption used in
this work. This technique is based on the use of two laser pulses, namely the pump and
probe pulses. The pump pulse photo‒excites the sample, i.e. initiates excited‒state
reactions. The probe pulse is used, as its name implies, to probe the changes that the
reacting molecules undergo following photo‒excitation, and hence is delayed in time
relative to the pump pulse. In order to achieve high time‒resolution (< 10-12
s-1
), both
pump and probe pulses are generated from the same ultrashort laser pulse (FWHM ~
100 fs). Such ultrashort laser pulse is originally provided by a femtosecond titatinium
sapphire laser, also called seed laser. Femtosecond titanium sapphire laser produces
femtosecond laser pulses centered at 800 nm at a repetition rate of 80 MHz with ~ 10 nJ
pulse energy. However, such pulse energy is generally not enough to achieve
sufficiently high concentration of molecules in the electronically excited states that
changes in absorption will be detectable. Thus, the femtosecond pulses are often further
amplified. Typically, this is realized by chirped pulse amplification (CPA) in a
regenerative amplifier. In short, after entering the amplifier, the femtosecond pulses are
first stretched in time (typically up to 100 ps) to reduce their peak power in order to
avoid damages of the gain medium during amplification. The stretched pulses can then
be amplified and enter the gain medium (a Ti:sapphire crystal) that is continuously fed
by an additional pump laser. After amplification, the high‒intensity stretched pulses are
compressed back to their original pulse width. This produces a final fundamental laser
pulse train with duration of ca. 100 fs with ca. 1 mJ pulse energy at a repetition rate of 1
kHz, which subsequently splits into pump and probe using a beam splitter. For more
details on the generation of ultra‒short laser pulses and their amplification, please see
e.g. “Laser Fundamentals” by William T. Silfvast.187
Taking now a journey in Figure 4.3 on the different optical paths followed by the pump
and probe beam. On the pump beam path, one encounters an optical parametric
amplifier (OPA). This system, based on non‒linear optical processes induced by
high‒intensity laser pulses, enables tuning of the excitation wavelength of the pump
beam (i.e. 800 nm) to a wavelength where the studied sample absorbs, typically in the
visible region. This gives access to a wider range of photo‒induced reactions that can be
studied. Thereafter, a chopper is used to block every second pulse of the pump beam.
The pump pulses are then time‒delayed relative to the probe pulses by increasing their
path length using a computer‒controlled optical delay line (range 0‒1.6 ns or 0‒10 ns).
Optical delaying enables here to time‒delay the pump and probe pulses with high
accuracy, and hence record changes in absorption in steps as small as 100 fs. Note that
light travels 0.03 mm in 100 fs. Finally, the pump beam is focused on the sample
contained in a 1 mm thick cuvette. Following now the probe beam path, white light is
generated by focusing the monochromatic 800 nm probe beam on a 3 mm moving CaF2
plate. This produces a white light continuum in the region 400‒800 nm. Subsequently
the probe beam is divided into a reference and probe beam before reaching the sample.
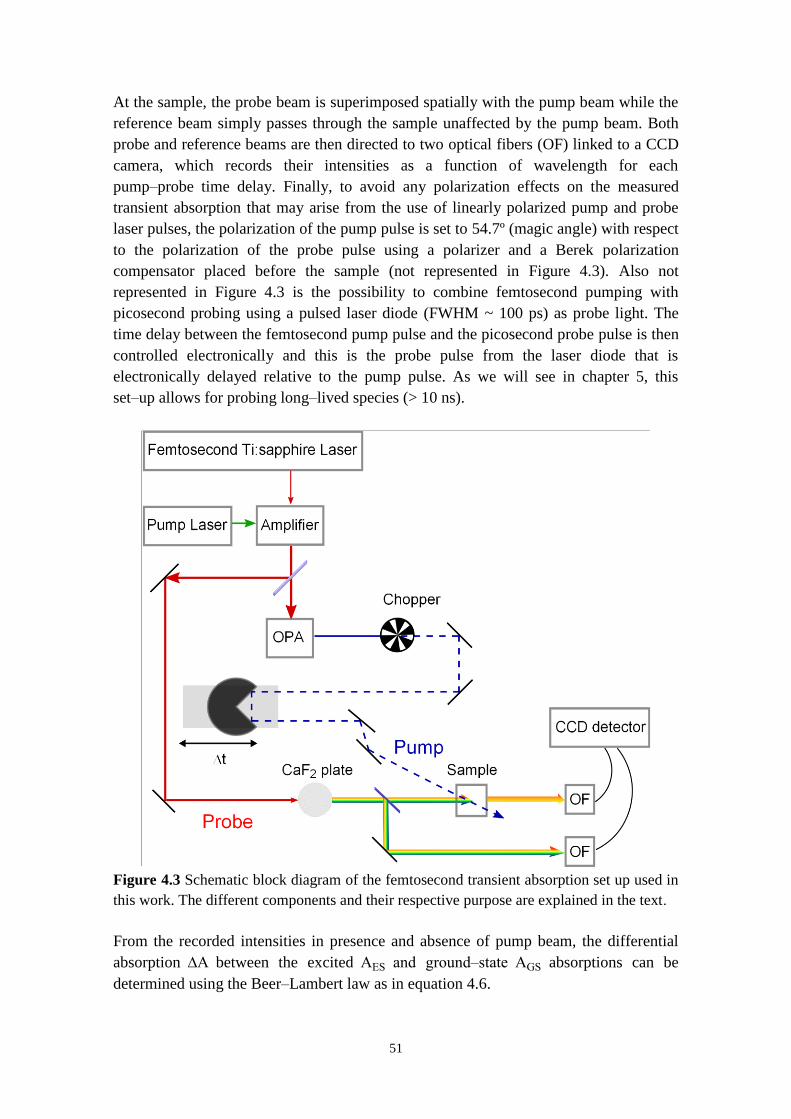
51
At the sample, the probe beam is superimposed spatially with the pump beam while the
reference beam simply passes through the sample unaffected by the pump beam. Both
probe and reference beams are then directed to two optical fibers (OF) linked to a CCD
camera, which records their intensities as a function of wavelength for each
pump‒probe time delay. Finally, to avoid any polarization effects on the measured
transient absorption that may arise from the use of linearly polarized pump and probe
laser pulses, the polarization of the pump pulse is set to 54.7º (magic angle) with respect
to the polarization of the probe pulse using a polarizer and a Berek polarization
compensator placed before the sample (not represented in Figure 4.3). Also not
represented in Figure 4.3 is the possibility to combine femtosecond pumping with
picosecond probing using a pulsed laser diode (FWHM ~ 100 ps) as probe light. The
time delay between the femtosecond pump pulse and the picosecond probe pulse is then
controlled electronically and this is the probe pulse from the laser diode that is
electronically delayed relative to the pump pulse. As we will see in chapter 5, this
set‒up allows for probing long‒lived species (> 10 ns).
Figure 4.3 Schematic block diagram of the femtosecond transient absorption set up used in
this work. The different components and their respective purpose are explained in the text.
From the recorded intensities in presence and absence of pump beam, the differential
absorption ∆A between the excited AES and ground‒state AGS absorptions can be
determined using the Beer‒Lambert law as in equation 4.6.
52
∆A(λ) AES(λ) ‒ AGS(λ) ‒ log10I λ
pon
I λ 0
pon
log10
I λ poff
I λ 0
poff
∆A λ AES λ ‒ AGS λ log10I(λ)
p off
I(λ)0
p off
I(λ)0
p on
I(λ)p on log
10
I(λ)p off
I(λ)p on
4.6
The intensities I and I0 are the intensities of the probe and reference beams,
respectively. The labels “p on” and “p off” designate intensities measured in presence
and absence of pump beam, respectively. For a perfectly stable laser, in equation 4.6,
measuring the intensities of the reference beams, i.e. I0p on
and I0p off
is not required as
they cancel out. In reality, they must be used for correction of intensity fluctuations of
the laser. Finally, compilation of the transient absorption spectra recorded at different
pump‒probe time delays may be viewed as a movie of the “life time” of electronically
excited states.
Interpretation of the observed ∆A
As ∆A is a differential absorption, both negative and positive peaks can be observed in
a transient absorption spectrum. According to equation 4.6, a simple and preliminary
interpretation of positive and negative ∆A is the following: positive peaks are observed
in regions where excited‒state absorption dominates over ground‒state absorption,
while negative ∆A peaks arise from dominant ground‒state absorption. This is the
simplest case and the picture may be a bit more complex since other phenomena may
also give rise to the observed ∆A. For example, another phenomenon that contributes
negatively to the observed ∆A is stimulated emission. Molecules in the excited state
relax to the ground state by emission of a photon, similarly as for spontaneous emission,
but with the difference that stimulated emission is triggered by the probe beam. Positive
contribution to ∆A may also be due to absorption of radical species formed from the
excited state. This means that if absorption of these radical species does not overlap
with the ones of the excited state or ground state, their formation can be clearly
demonstrated by transient absorption and their kinetics monitored. In this regard,
transient absorption is a key experiment in photoinduced electron transfer studies
providing direct evidence of formed radical species, such as charge‒separated states
D• ‒A
•- in D‒A systems. Hence, it enables to relate lower fluorescence intensities of
donor‒acceptor systems in steady‒state emission to quenching by electron transfer.
Since negative and positive ∆A can originate from different phenomena, it can be
difficult to interpret a transient absorption spectrum without any prior knowledge of the
studied system. In parallel to transient absorption, spectro‒electrochemical
measurements are often performed in order to identify the wavelength range in which
the radical species are expected to absorb and how strong their molar absorption is.
53
Quantum mechanical calculations may also be performed to simulate the absorption
spectra of the excited state and radical species.
Transient absorption contains more than only qualitative information. From the
accumulated transient absorption spectra, transient absorption time profiles at a chosen
wavelength (i.e. ∆Aλ as a function of time) can be extracted. The transient absorption
time profiles describe how fast a species forms or vanishes, provided that at the chosen
wavelength only this species contributes to the transient signal.
4.2.3 TIME‒RESOLVED EMISSION
Time‒resolved emission spectroscopy is another technique that is based on pulsed laser
sources of excitation, fast detection and electronics. This technique enables
measurement of fluorescence lifetimes. As in most lifetime measurement techniques,
the lifetime is determined by monitoring the number of excited states present over time.
In time‒resolved emission spectroscopy, it is the emission intensity or number of
emitted photons from the excited state which is recorded as function of time. Indeed the
number of emitted photons from a sample at any time is directly proportional to the
number of excited states present. As discussed in chapter 3, the number of excited states
is expected to follow first‒order decay kinetics, and so is its emission intensity,
dI(t)
dt ‒ kj
j
I t 4.7
where kjj is the sum over all the rate constants that depopulate the excited state. This
equation solve to a mono‒exponential expression for one emitting state:
I t I0 exp( ‒t τ ). Thus, the fluorescence decay of a sample (I t vs. t) is often plotted
on a semi‒logarithmic scale and describes a straight line with a slope of –τ .
Representation of fluorescence decays on a semi‒logarithmic scale enables also to
identify the presence of several emitting states in a sample. In that case, the fluorescence
decay does not describe a straight line anymore and instead, a multi-exponential
expression reproduces the fluorescence decay,
I t I0 iexp ‒t τi
n
i
4.8
Here, I0 is the intensity at time zero, i the amplitude contribution of the excited state i,
τi its corresponding lifetime and n the number of distinct excited states.
Single photon counting is one of most used methods to record fluorescence decays. In
this work, two techniques based on single photon counting have been used to measure
fluorescence lifetimes: Time Correlated Single Photon Counting (TCSPC) and a streak
camera system. Both techniques used the same source of excitation and differ only in
the system of photon detection and the mode of data collection. These differences and
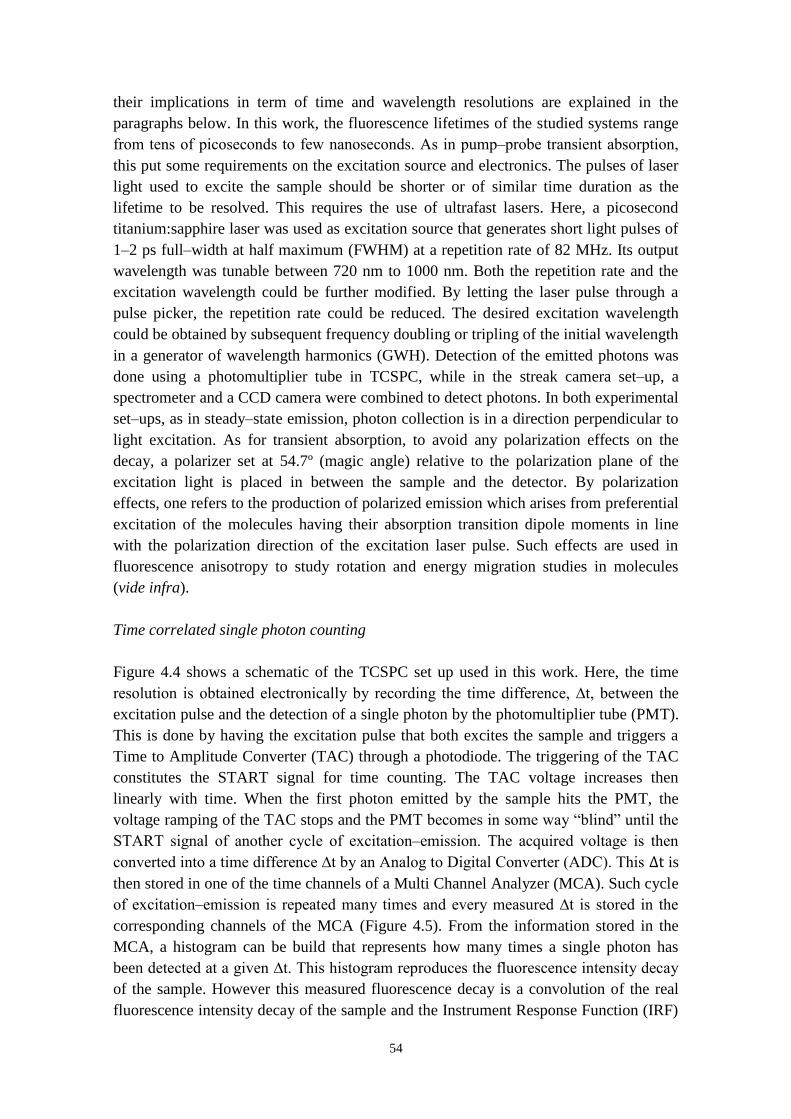
54
their implications in term of time and wavelength resolutions are explained in the
paragraphs below. In this work, the fluorescence lifetimes of the studied systems range
from tens of picoseconds to few nanoseconds. As in pump‒probe transient absorption,
this put some requirements on the excitation source and electronics. The pulses of laser
light used to excite the sample should be shorter or of similar time duration as the
lifetime to be resolved. This requires the use of ultrafast lasers. Here, a picosecond
titanium:sapphire laser was used as excitation source that generates short light pulses of
1‒2 ps full‒width at half maximum (FWHM) at a repetition rate of 82 MHz. Its output
wavelength was tunable between 720 nm to 1000 nm. Both the repetition rate and the
excitation wavelength could be further modified. By letting the laser pulse through a
pulse picker, the repetition rate could be reduced. The desired excitation wavelength
could be obtained by subsequent frequency doubling or tripling of the initial wavelength
in a generator of wavelength harmonics (GWH). Detection of the emitted photons was
done using a photomultiplier tube in TCSPC, while in the streak camera set‒up, a
spectrometer and a CCD camera were combined to detect photons. In both experimental
set‒ups, as in steady‒state emission, photon collection is in a direction perpendicular to
light excitation. As for transient absorption, to avoid any polarization effects on the
decay, a polarizer set at 54.7º (magic angle) relative to the polarization plane of the
excitation light is placed in between the sample and the detector. By polarization
effects, one refers to the production of polarized emission which arises from preferential
excitation of the molecules having their absorption transition dipole moments in line
with the polarization direction of the excitation laser pulse. Such effects are used in
fluorescence anisotropy to study rotation and energy migration studies in molecules
(vide infra).
Time correlated single photon counting
Figure 4.4 shows a schematic of the TCSPC set up used in this work. Here, the time
resolution is obtained electronically by recording the time difference, ∆t, between the
excitation pulse and the detection of a single photon by the photomultiplier tube (PMT).
This is done by having the excitation pulse that both excites the sample and triggers a
Time to Amplitude Converter (TAC) through a photodiode. The triggering of the TAC
constitutes the START signal for time counting. The TAC voltage increases then
linearly with time. When the first photon emitted by the sample hits the PMT, the
voltage ramping of the TAC stops and the PMT becomes in some way “blind” until the
STA T signal of another cycle of excitation‒emission. The acquired voltage is then
converted into a time difference ∆t by an Analog to Digital Converter (ADC). This ∆t is
then stored in one of the time channels of a Multi Channel Analyzer (MCA). Such cycle
of excitation‒emission is repeated many times and every measured ∆t is stored in the
corresponding channels of the MCA (Figure 4.5). From the information stored in the
MCA, a histogram can be build that represents how many times a single photon has
been detected at a given ∆t. This histogram reproduces the fluorescence intensity decay
of the sample. However this measured fluorescence decay is a convolution of the real
fluorescence intensity decay of the sample and the Instrument Response Function (IRF)
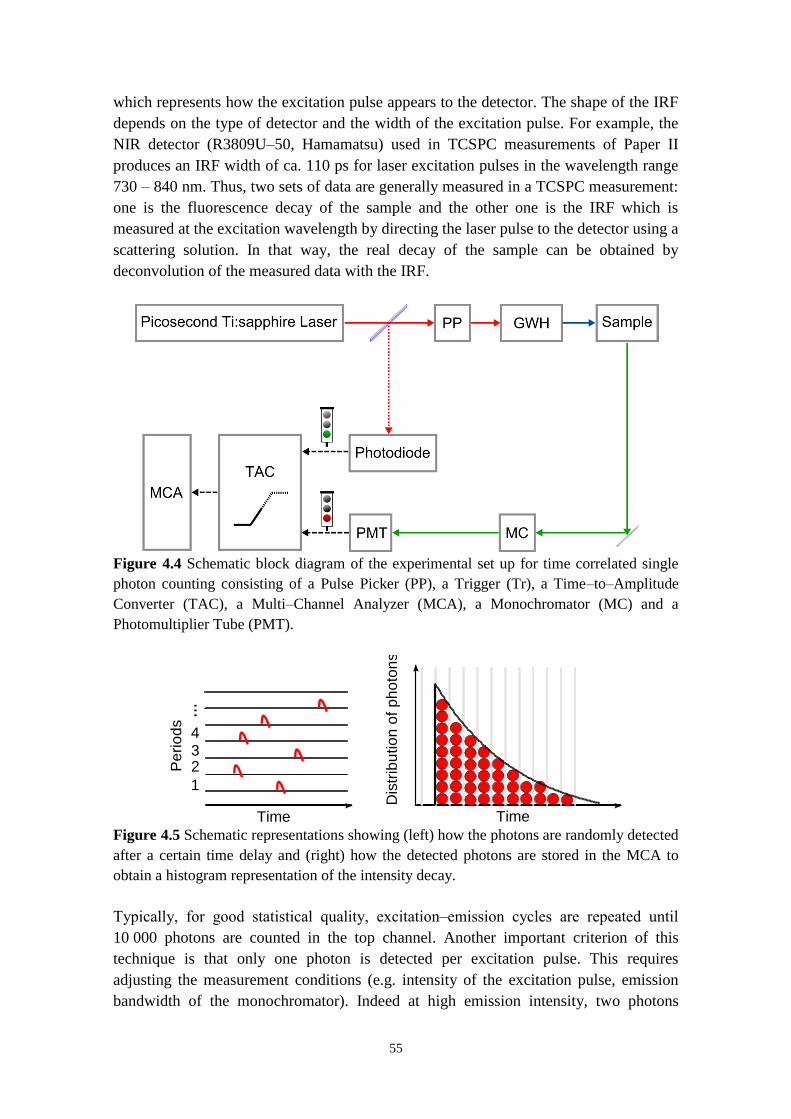
55
which represents how the excitation pulse appears to the detector. The shape of the IRF
depends on the type of detector and the width of the excitation pulse. For example, the
NIR detector (R3809U‒50, Hamamatsu) used in TCSPC measurements of Paper II
produces an IRF width of ca. 110 ps for laser excitation pulses in the wavelength range
730 ‒ 840 nm. Thus, two sets of data are generally measured in a TCSPC measurement:
one is the fluorescence decay of the sample and the other one is the IRF which is
measured at the excitation wavelength by directing the laser pulse to the detector using a
scattering solution. In that way, the real decay of the sample can be obtained by
deconvolution of the measured data with the IRF.
Figure 4.4 Schematic block diagram of the experimental set up for time correlated single
photon counting consisting of a Pulse Picker (PP), a Trigger (Tr), a Time‒to‒Amplitude
Converter (TAC), a Multi‒Channel Analyzer (MCA), a Monochromator (MC) and a
Photomultiplier Tube (PMT).
Figure 4.5 Schematic representations showing (left) how the photons are randomly detected
after a certain time delay and (right) how the detected photons are stored in the MCA to
obtain a histogram representation of the intensity decay.
Typically, for good statistical quality, excitation‒emission cycles are repeated until
10 000 photons are counted in the top channel. Another important criterion of this
technique is that only one photon is detected per excitation pulse. This requires
adjusting the measurement conditions (e.g. intensity of the excitation pulse, emission
bandwidth of the monochromator). Indeed at high emission intensity, two photons
1
34
2
...
Time
Pe
rio
ds
Time
Dis
trib
utio
n o
f p
ho
ton
s
56
originating from the same excitation event may eventually hit the PMT. This will not be
a problem if the electronics were fast enough to correlate all photons in time. However,
this is not the case. They need to reset after each photon detected which take time. If
two photons reach the detector, only the earliest photon will be counted. This is the
so‒called “pile‒up” effect where early photons are preferentially detected. In
consequence, the measured fluorescence decay is biased toward early time. To avoid
this, the emission intensity at the PMT is reduced so that a photon is counted for no
more than about 1 % of the excitation‒emission cycles.
Streak camera system
This technique differs from TCSPC by the system of photon detection and presents two
strong advantages. The streak camera system combines a spectrometer and a CCD
camera. The first advantage of such system is the higher time resolution down to few ps
that can be achieved. The second advantage is that in contrast to TCSPC, measurement
of the complete emission spectrum as a function of time is possible within a single
experiment. This produces 2D‒images of the fluorescence emission with time along the
vertical axis, the wavelength along the horizontal axis and the intensity along the z‒axis.
In short, this is done by first dispersing the emitted photons by wavelength using a
spectrometer in a line on a photocathode. Thereafter, in the streak tube, the produced
photoelectrons are deflected at different angles in the vertical direction depending on
their arrival time before hitting a phosphor screen and readout is made by the CCD
camera.188
4.3 FLUORESCENCE ANISOTROPY SPECTROSCOPY
Much more information can be obtained from the emission of a sample than its simple
lifetime. In time‒resolved fluorescence spectroscopy, effects of polarization due to the
polarized laser excitation source are voluntarily avoided using polarizers at magic angle.
In fluorescence anisotropy, polarization of the excitation source is put “at work”. By
illuminating the sample with polarized light, molecules which have their absorption
transition dipole moments oriented in the same direction as the excitation source are
preferentially excited (see in chapter 3, the second criteria for light absorption).
Emission may then also occur in a preferential direction, i.e. may be polarized.
However, this directional information is only conserved if the molecules are not free to
rotate or if their rotation is much slower than their lifetime. Indeed any rotation of a
molecule during its lifetime will randomize the direction of its emission.
This brings us to the definition of fundamental fluorescence anisotropy, denoted r0, in
absence of any depolarization processes
r0 2
5 3cos2β ‒ 1
2 4.9
57
where β is the angle between the absorption and emission transition dipole moments.
From equation 4.9, the maximum anisotropy value is 0.4 that corresponds to collinear
absorption and emission transition dipole moments (β = 0º). As mentioned earlier for
random distributions of linear molecules in solution, a polarized excitation source
excites preferentially molecules oriented in the direction of polarization resulting in a
polarization of the emission. However, if emission collection is done at 54.7º (i.e. magic
angle) relative to the polarization of excitation, equation 4.9 applies at a macroscopic
scale gives r0 = 0, hence the choice for the magic angle conditions to eliminate
polarization effects in time‒resolved emission and transient absorption measurements
(vide supra). For any fluorophore, lower anisotropy values observed than the one
predicted by equation 4.9 will suggest a depolarization of its emission. As mentioned
previously, one common cause of depolarization is rotational diffusion of the molecules
during their excited‒state lifetime. In this regard, fluorescence anisotropy spectroscopy
has been used to get structural information such as binding of ligands. Indeed any
changes in the size and/or shape and/or surrounding environment of a molecule will
affect its rotation, and hence the depolarization of its emission and its fluorescence
anisotropy. However other processes may also induce a depolarization of the emission.
Depolarization can result from excitation energy migration if accompanied by a change
in the direction of the emission transition dipole moments. In this work, it is this
application of fluorescence anisotropy that has been of interest.
In practice, both steady‒state and time‒resolved fluorescence anisotropy may be
measured using the respective experimental set‒ups described above. Additional
polarizers are used to control polarization of the excitation and emission light. In
steady‒state, excitation anisotropy spectra, i.e. plots of the anisotropy as a function of
the excitation wavelength, are usually measured since anisotropy is often independent of
the emission wavelength (Kasha’s rule).157
Excitation anisotropy spectra are calculated
from the excitation spectra recorded at both vertical (V) and horizontal (H) polarization,
using both vertically and horizontally polarized light excitation,
r(λ) I (λ) ‒ GI H(λ)
I (λ) 2GI H(λ) 4.10
G is a correction factor that is dependent on the instrument. It corrects for the difference
in sensitivity of the detection system to vertical and horizontal polarized light,
G IH
IHH 4.11
Steady‒state anisotropy measurements reveal the average anisotropy value, i.e. the
average angular displacement between the absorption and emission transition dipole
moments. Comparing the measured steady‒state anisotropy value to the predicted value
(equation 4.9) gives some hints on the presence/absence of depolarization processes,
although quite limited information on their nature. In this regard, time‒resolved
fluorescence anisotropy provides further information. Using a similar equation to
58
equation 4.10, the fluorescence anisotropy decay, r(t) , can be determined from the
fluorescence intensity decays I (t)and I H(t) measured with the emission polarizer
parallel or perpendicular to the vertically polarized excitation pulse, respectively. The
correction factor G is then given by IH (t) IHH(t) where IH (t) and IHH(t) are the
fluorescence intensity decays with the emission polarizer parallel or perpendicular to the
horizontally polarized excitation pulse, respectively. Following pulsed excitation, the
fluorescence anisotropy decay is often reproduced by a sum of exponentials
r t r0,jexp(
j
‒t j ) 4.12
where r0,j is the fractional amplitude anisotropy at time zero and j are the rotational
correlation times. Note that if r0,jj does not sum up to the r0value (equation 4.9); all
processes that contribute to emission depolarization have not been time‒resolved.
Depolarization by excitation energy migration in addition to the natural rotational
motion of the fluorophore will also lead to a multi‒exponential fluorescence anisotropy
decay. These effects can be distinguished by adjusting the experimental conditions in
order to prevent occurrence of one of them. Typically this is rotational motion of the
fluorophores which is inhibited using high‒viscosity solvents (e.g. glycerol) or solvents
that form glass at low temperature (e.g. 2‒MTHF (Tglass~90 K)189
). Under these
conditions, the fluorophores are stationary, and hence only excitation energy migration
may contribute to the anisotropy decay.
4.4 DATA ANALYSIS
In order to get meaningful information (rate constants, lifetimes) from transient
absorption spectra (∆A(t, λ)) and time‒resolved fluorescence decays (I(t, λ)), one needs
to have a model that interconnects real components (e.g. population of excited states,
ground‒state, charge‒separated states,…) via a kinetic scheme so that it is possible to
relate the variation of their concentration with time to the measured time‒dependent
values, ∆A(t, λ) or I(t, λ). Simulated data generated according to this model can then be
compared to the raw data. If sufficient agreement between the two sets of data is found,
reaction rate constants (e.g. ET or EET rates) and lifetimes may be extracted. In this
work, data fitting has been done with Matlab for transient absorption and 2D
time‒resolved fluorescence data.
As mentioned earlier, all reactions investigated in this work are intramolecular, and
hence are assumed to be first‒order. This means that in general, the overall
concentration C (i.e. of all contributing states) at any time t is given by solving the
master equation,
dC
dt KC 4.13
59
where K is a matrix containing the relevant combination of rate constants (according to
the kinetic model used) and C is a concentration matrix containing the concentration of
each individual state. The K matrix off‒diagonal elements are the rate constants that
populate each individual state while the diagonal elements are the rate constants by
which it is depopulated.
4.4.1 INDIVIDUAL FITTING
When fitting fluorescence decays or transient absorption time profiles at wavelengths
where the signal arises from a single electronic state i, the data are generally fitted
individually (i.e. independently). Indeed equation 4.13 simplifies then to a one
dimensional equation. The solution of such equation is a mono‒exponential function,
ci t ci(0) exp(‒ t τi ) 4.14
where ci(0) is the population of the state i at time zero and τ is equal to the inverse of
the sum of the rate constants of all depopulating paths (vide infra).
Equation 4.14 is general. To fit transient absorption time profiles, this equation needs to
be slightly modified. Likewise measured fluorescence intensity decays which are a
convolution of the fluorescence intensity decay of the sample and the instrument
response function (IRF), measured transient absorption time profiles contain both the
real transient absorption time profile and a “certain” temporal response function. This
temporal response function arises from the fact that both pump and probe pulses possess
a temporal width. In the experimental data, this result in a rise in the absorption time
profile of the excited state. This temporal response function is usually approximate by a
Gaussian function F(t) with a FWHM equal to 2 2 ln 2 in the fitting procedure
(equation 4.15).
F(t) 1
2πexp
(t‒t0)2
2 2 4.15
This leads to the expression for the simulated transient absorption time profiles
Aλ,fit(t),
∆Aλ,fit t 1
2 iexp
2
2τi2 exp
‒ t‒t0
τi erfc
τi t‒t0
1
2 4.16
where erfc designates the complementary error function.
4.4.2 GLOBAL DECAY FITTING
Some molecular systems can display more complex fluorescence intensity decays or
transient absorption time profiles or spectra. For example, 2D time‒resolved
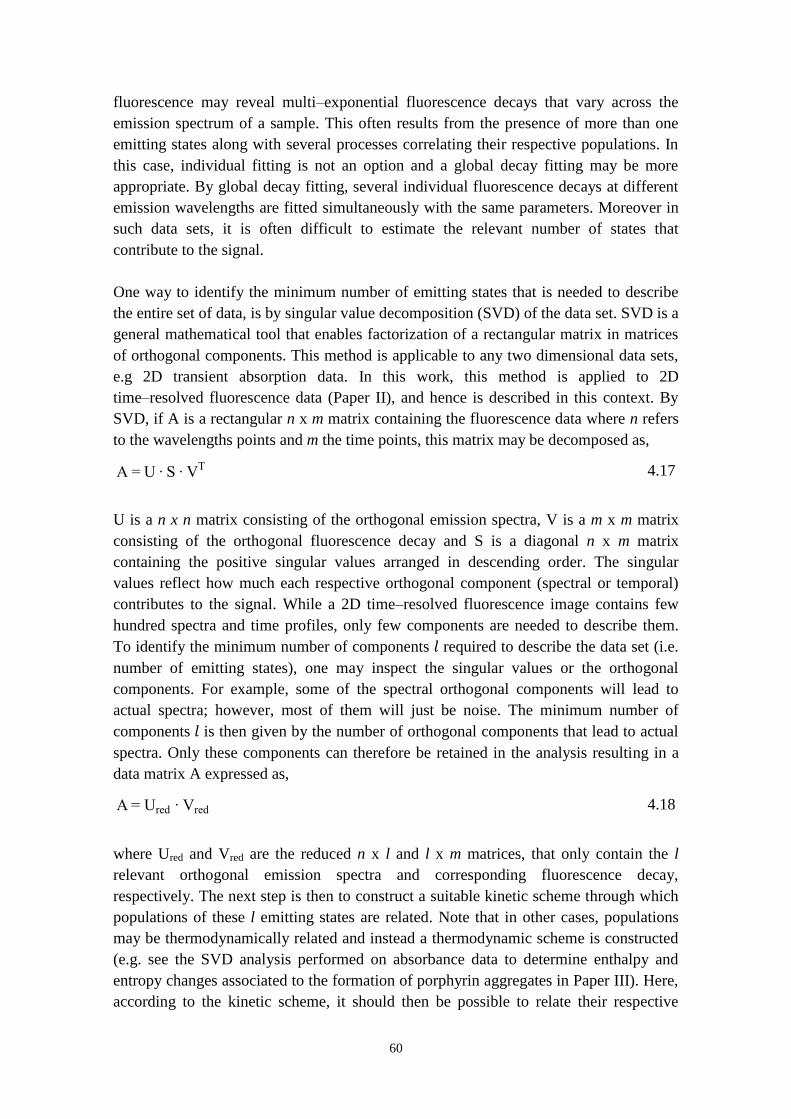
60
fluorescence may reveal multi‒exponential fluorescence decays that vary across the
emission spectrum of a sample. This often results from the presence of more than one
emitting states along with several processes correlating their respective populations. In
this case, individual fitting is not an option and a global decay fitting may be more
appropriate. By global decay fitting, several individual fluorescence decays at different
emission wavelengths are fitted simultaneously with the same parameters. Moreover in
such data sets, it is often difficult to estimate the relevant number of states that
contribute to the signal.
One way to identify the minimum number of emitting states that is needed to describe
the entire set of data, is by singular value decomposition (SVD) of the data set. SVD is a
general mathematical tool that enables factorization of a rectangular matrix in matrices
of orthogonal components. This method is applicable to any two dimensional data sets,
e.g 2D transient absorption data. In this work, this method is applied to 2D
time‒resolved fluorescence data (Paper II), and hence is described in this context. By
SVD, if A is a rectangular n x m matrix containing the fluorescence data where n refers
to the wavelengths points and m the time points, this matrix may be decomposed as,
A S T 4.17
U is a n x n matrix consisting of the orthogonal emission spectra, V is a m x m matrix
consisting of the orthogonal fluorescence decay and S is a diagonal n x m matrix
containing the positive singular values arranged in descending order. The singular
values reflect how much each respective orthogonal component (spectral or temporal)
contributes to the signal. While a 2D time‒resolved fluorescence image contains few
hundred spectra and time profiles, only few components are needed to describe them.
To identify the minimum number of components required to describe the data set (i.e.
number of emitting states), one may inspect the singular values or the orthogonal
components. For example, some of the spectral orthogonal components will lead to
actual spectra; however, most of them will just be noise. The minimum number of
components is then given by the number of orthogonal components that lead to actual
spectra. Only these components can therefore be retained in the analysis resulting in a
data matrix A expressed as,
A red red 4.18
where Ured and Vred are the reduced n x l and l x m matrices, that only contain the l
relevant orthogonal emission spectra and corresponding fluorescence decay,
respectively. The next step is then to construct a suitable kinetic scheme through which
populations of these l emitting states are related. Note that in other cases, populations
may be thermodynamically related and instead a thermodynamic scheme is constructed
(e.g. see the SVD analysis performed on absorbance data to determine enthalpy and
entropy changes associated to the formation of porphyrin aggregates in Paper III). Here,
according to the kinetic scheme, it should then be possible to relate their respective
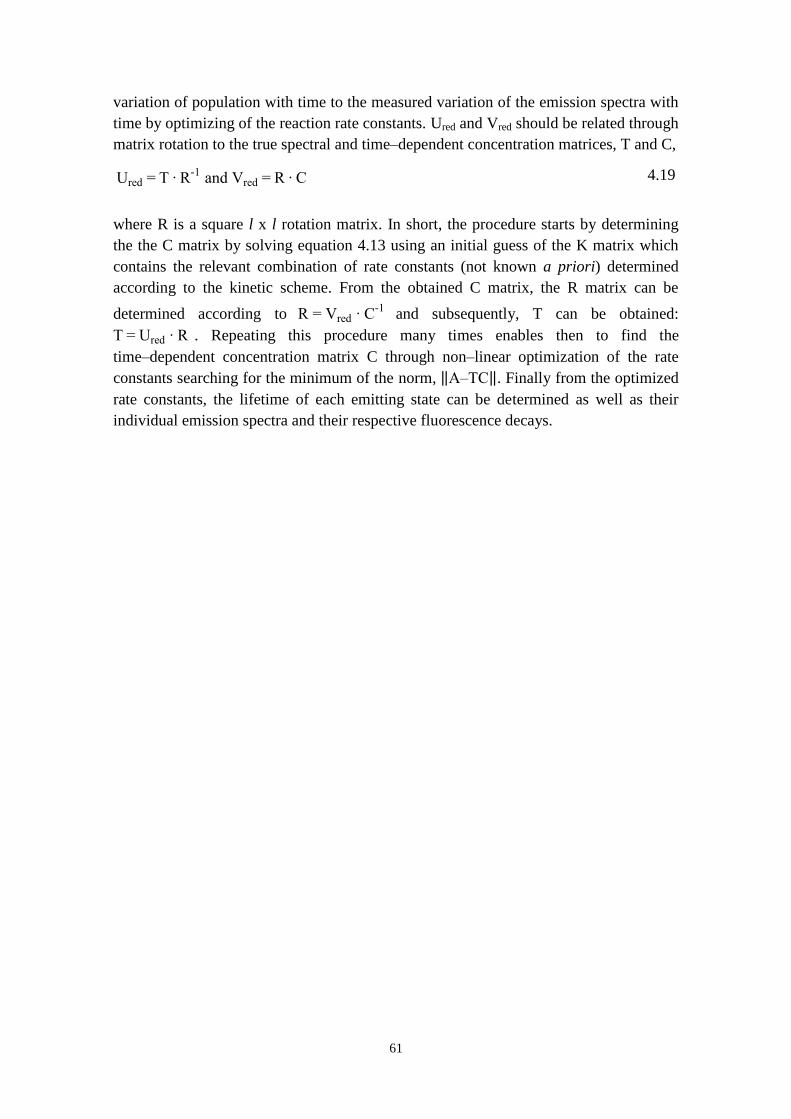
61
variation of population with time to the measured variation of the emission spectra with
time by optimizing of the reaction rate constants. Ured and Vred should be related through
matrix rotation to the true spectral and time‒dependent concentration matrices, T and C,
red T -1 and red C 4.19
where R is a square l x l rotation matrix. In short, the procedure starts by determining
the the C matrix by solving equation 4.13 using an initial guess of the K matrix which
contains the relevant combination of rate constants (not known a priori) determined
according to the kinetic scheme. From the obtained C matrix, the R matrix can be
determined according to red C-1
and subsequently, T can be obtained:
T red . Repeating this procedure many times enables then to find the
time‒dependent concentration matrix C through non‒linear optimization of the rate
constants searching for the minimum of the norm, A‒TC . Finally from the optimized
rate constants, the lifetime of each emitting state can be determined as well as their
individual emission spectra and their respective fluorescence decays.

62
63
5 PHOTOINDUCED ELECTRON TRANSFER
IN PORPHYRIN OLIGOMER‒BASED
DONOR‒ACCEPTOR SYSTEMS
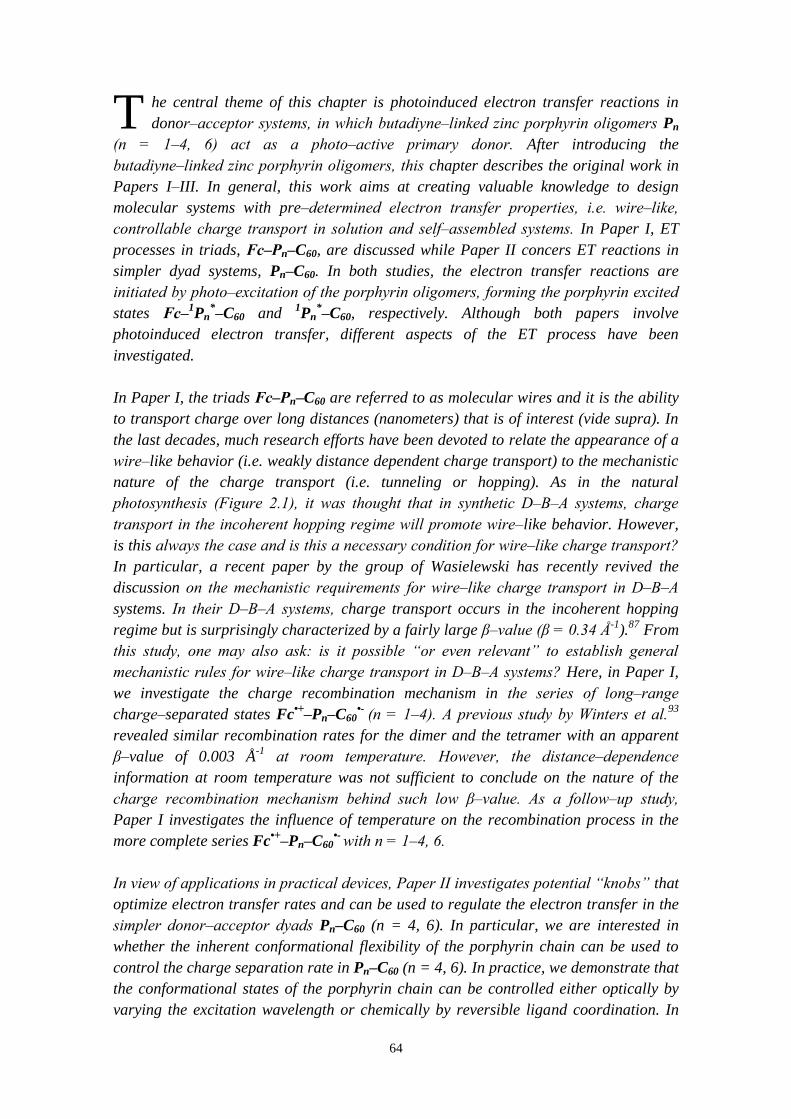
64
he central theme of this chapter is photoinduced electron transfer reactions in
donor‒acceptor systems, in which butadiyne‒linked zinc porphyrin oligomers Pn
(n = 1‒4, 6) act as a photo‒active primary donor. After introducing the
butadiyne‒linked zinc porphyrin oligomers, this chapter describes the original work in
Papers I‒III. In general, this work aims at creating valuable knowledge to design
molecular systems with pre‒determined electron transfer properties, i.e. wire‒like,
controllable charge transport in solution and self‒assembled systems. In Paper I, ET
processes in triads, Fc‒Pn‒C60, are discussed while Paper II concers ET reactions in
simpler dyad systems, Pn‒C60. In both studies, the electron transfer reactions are
initiated by photo‒excitation of the porphyrin oligomers, forming the porphyrin excited
states Fc‒1Pn
*‒C60 and
1Pn
*‒C60, respectively. Although both papers involve
photoinduced electron transfer, different aspects of the ET process have been
investigated.
In Paper I, the triads Fc‒Pn‒C60 are referred to as molecular wires and it is the ability
to transport charge over long distances (nanometers) that is of interest (vide supra). In
the last decades, much research efforts have been devoted to relate the appearance of a
wire‒like behavior (i.e. weakly distance dependent charge transport) to the mechanistic
nature of the charge transport (i.e. tunneling or hopping). As in the natural
photosynthesis (Figure 2.1), it was thought that in synthetic D‒B‒A systems, charge
transport in the incoherent hopping regime will promote wire‒like behavior. However,
is this always the case and is this a necessary condition for wire‒like charge transport?
In particular, a recent paper by the group of Wasielewski has recently revived the
discussion on the mechanistic requirements for wire‒like charge transport in D‒B‒A
systems. In their D‒B‒A systems, charge transport occurs in the incoherent hopping
regime but is surprisingly characterized by a fairly large β‒value (β = 0.34 Å-1
).87
From
this study, one may also ask: is it possible “or even relevant” to establish general
mechanistic rules for wire‒like charge transport in D‒B‒A systems? Here, in Paper I,
we investigate the charge recombination mechanism in the series of long‒range
charge‒separated states Fc•+‒Pn‒C60
•- (n = 1‒4). A previous study by Winters et al.
93
revealed similar recombination rates for the dimer and the tetramer with an apparent
β‒value of 0.003 Å-1
at room temperature. However, the distance‒dependence
information at room temperature was not sufficient to conclude on the nature of the
charge recombination mechanism behind such low β‒value. As a follow‒up study,
Paper I investigates the influence of temperature on the recombination process in the
more complete series Fc•+‒Pn‒C60
•- with n = 1‒4, 6.
In view of applications in practical devices, Paper II investigates potential “knobs” that
optimize electron transfer rates and can be used to regulate the electron transfer in the
simpler donor‒acceptor dyads Pn‒C60 (n = 4, 6). In particular, we are interested in
whether the inherent conformational flexibility of the porphyrin chain can be used to
control the charge separation rate in Pn‒C60 (n = 4, 6). In practice, we demonstrate that
the conformational states of the porphyrin chain can be controlled either optically by
varying the excitation wavelength or chemically by reversible ligand coordination. In
T
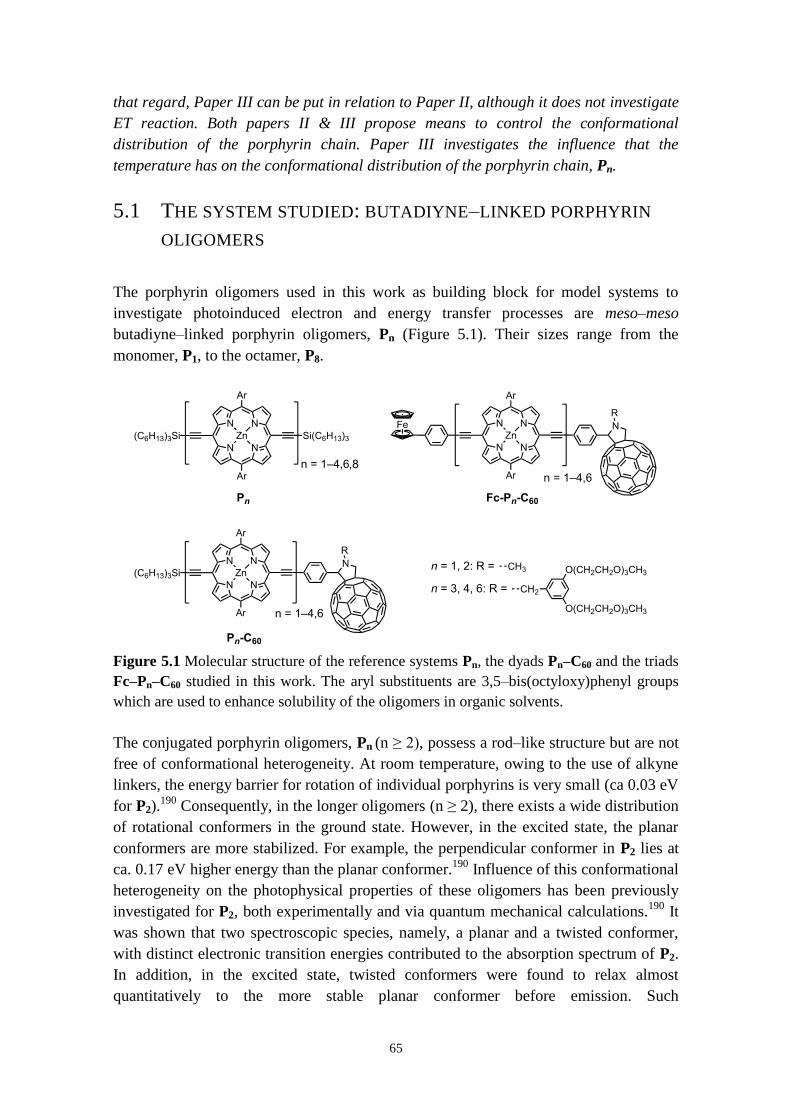
65
that regard, Paper III can be put in relation to Paper II, although it does not investigate
ET reaction. Both papers II & III propose means to control the conformational
distribution of the porphyrin chain. Paper III investigates the influence that the
temperature has on the conformational distribution of the porphyrin chain, Pn.
5.1 THE SYSTEM STUDIED: BUTADIYNE‒LINKED PORPHYRIN
OLIGOMERS
The porphyrin oligomers used in this work as building block for model systems to
investigate photoinduced electron and energy transfer processes are meso‒meso
butadiyne‒linked porphyrin oligomers, Pn (Figure 5.1). Their sizes range from the
monomer, P1, to the octamer, P8.
Figure 5.1 Molecular structure of the reference systems Pn, the dyads Pn‒C60 and the triads
Fc‒Pn‒C60 studied in this work. The aryl substituents are 3,5‒bis(octyloxy)phenyl groups
which are used to enhance solubility of the oligomers in organic solvents.
The conjugated porphyrin oligomers, Pn (n ≥ 2), possess a rod‒like structure but are not
free of conformational heterogeneity. At room temperature, owing to the use of alkyne
linkers, the energy barrier for rotation of individual porphyrins is very small (ca 0.03 eV
for P2).190
Consequently, in the longer oligomers (n ≥ 2), there exists a wide distribution
of rotational conformers in the ground state. However, in the excited state, the planar
conformers are more stabilized. For example, the perpendicular conformer in P2 lies at
ca. 0.17 eV higher energy than the planar conformer.190
Influence of this conformational
heterogeneity on the photophysical properties of these oligomers has been previously
investigated for P2, both experimentally and via quantum mechanical calculations.190
It
was shown that two spectroscopic species, namely, a planar and a twisted conformer,
with distinct electronic transition energies contributed to the absorption spectrum of P2.
In addition, in the excited state, twisted conformers were found to relax almost
quantitatively to the more stable planar conformer before emission. Such
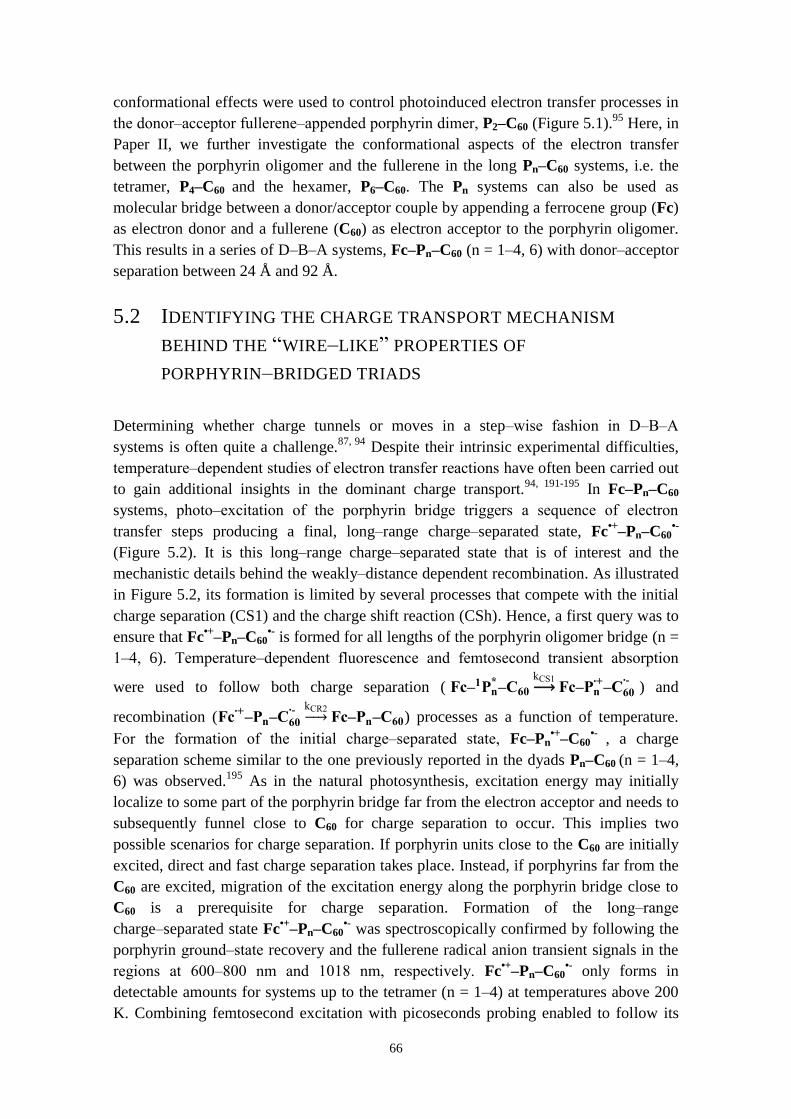
66
conformational effects were used to control photoinduced electron transfer processes in
the donor‒acceptor fullerene‒appended porphyrin dimer, P2‒C60 (Figure 5.1).95
Here, in
Paper II, we further investigate the conformational aspects of the electron transfer
between the porphyrin oligomer and the fullerene in the long Pn‒C60 systems, i.e. the
tetramer, P4‒C60 and the hexamer, P6‒C60. The Pn systems can also be used as
molecular bridge between a donor/acceptor couple by appending a ferrocene group (Fc)
as electron donor and a fullerene (C60) as electron acceptor to the porphyrin oligomer.
This results in a series of D‒B‒A systems, Fc‒Pn‒C60 (n = 1‒4, 6) with donor‒acceptor
separation between 24 Å and 92 Å.
5.2 IDENTIFYING THE CHARGE TRANSPORT MECHANISM
BEHIND THE “WIRE‒LIKE” PROPERTIES OF
PORPHYRIN‒BRIDGED TRIADS
Determining whether charge tunnels or moves in a step‒wise fashion in D‒B‒A
systems is often quite a challenge.87, 94
Despite their intrinsic experimental difficulties,
temperature‒dependent studies of electron transfer reactions have often been carried out
to gain additional insights in the dominant charge transport.94, 191-195
In Fc‒Pn‒C60
systems, photo‒excitation of the porphyrin bridge triggers a sequence of electron
transfer steps producing a final, long‒range charge‒separated state, Fc•+
‒Pn‒C60•-
(Figure 5.2). It is this long‒range charge‒separated state that is of interest and the
mechanistic details behind the weakly‒distance dependent recombination. As illustrated
in Figure 5.2, its formation is limited by several processes that compete with the initial
charge separation (CS1) and the charge shift reaction (CSh). Hence, a first query was to
ensure that Fc•+
‒Pn‒C60•- is formed for all lengths of the porphyrin oligomer bridge (n =
1‒4, 6). Temperature‒dependent fluorescence and femtosecond transient absorption
were used to follow both charge separation ( Fc‒ Pn ‒
kCS1 Fc‒Pn
+‒
-) and
recombination (Fc +
‒Pn‒ - kC 2 Fc‒Pn‒ ) processes as a function of temperature.
For the formation of the initial charge‒separated state, Fc‒Pn•+
‒C60•-
, a charge
separation scheme similar to the one previously reported in the dyads Pn‒C60 (n = 1‒4,
6) was observed.195
As in the natural photosynthesis, excitation energy may initially
localize to some part of the porphyrin bridge far from the electron acceptor and needs to
subsequently funnel close to C60 for charge separation to occur. This implies two
possible scenarios for charge separation. If porphyrin units close to the C60 are initially
excited, direct and fast charge separation takes place. Instead, if porphyrins far from the
C60 are excited, migration of the excitation energy along the porphyrin bridge close to
C60 is a prerequisite for charge separation. Formation of the long‒range
charge‒separated state Fc•+
‒Pn‒C60•- was spectroscopically confirmed by following the
porphyrin ground‒state recovery and the fullerene radical anion transient signals in the
regions at 600‒800 nm and 1018 nm, respectively. Fc•+
‒Pn‒C60•- only forms in
detectable amounts for systems up to the tetramer (n = 1‒4) at temperatures above 200
K. Combining femtosecond excitation with picoseconds probing enabled to follow its
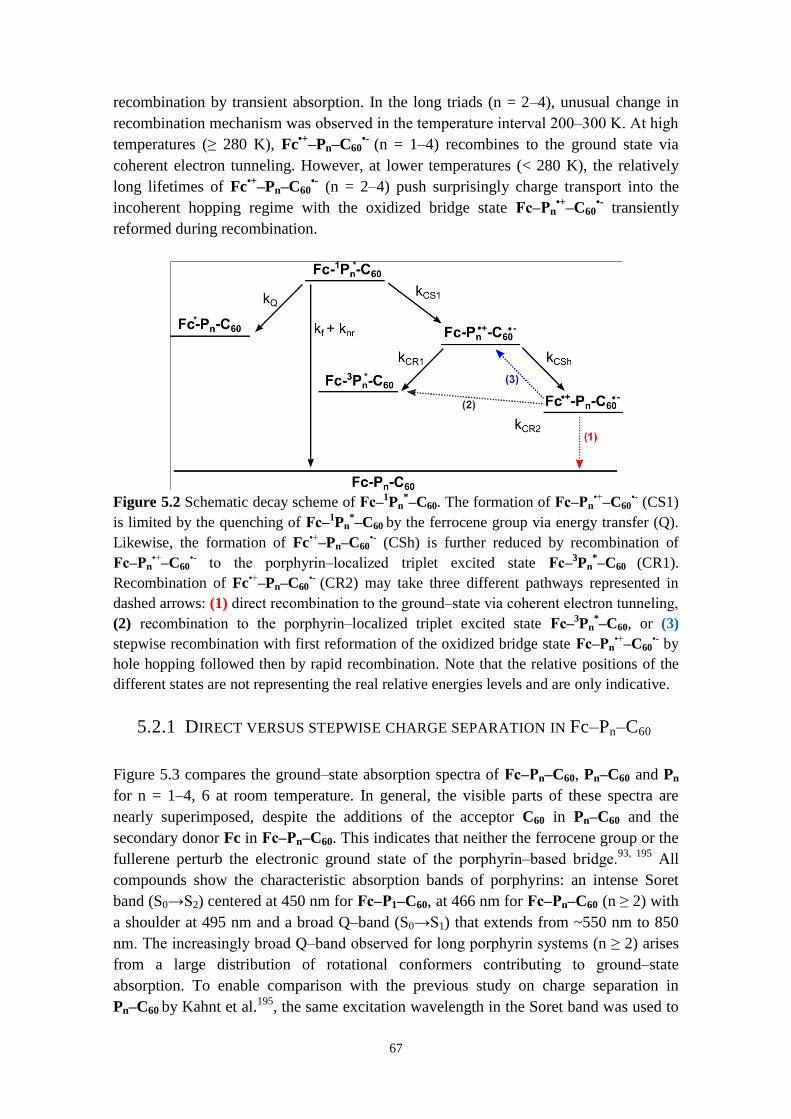
67
recombination by transient absorption. In the long triads (n = 2‒4), unusual change in
recombination mechanism was observed in the temperature interval 200‒300 K. At high
temperatures (≥ 280 K), Fc•+
‒Pn‒C60•-
(n = 1‒4) recombines to the ground state via
coherent electron tunneling. However, at lower temperatures (< 280 K), the relatively
long lifetimes of Fc•+
‒Pn‒C60•- (n = 2‒4) push surprisingly charge transport into the
incoherent hopping regime with the oxidized bridge state Fc‒Pn•+
‒C60•- transiently
reformed during recombination.
Figure 5.2 Schematic decay scheme of Fc‒1Pn
*‒C60. The formation of Fc‒Pn• ‒C60
•- (CS1)
is limited by the quenching of Fc‒1Pn*‒C60 by the ferrocene group via energy transfer (Q).
Likewise, the formation of Fc• ‒Pn‒C60•- (CSh) is further reduced by recombination of
Fc‒Pn• ‒C60
•- to the porphyrin‒localized triplet excited state Fc‒3Pn*‒C60 (CR1).
Recombination of Fc• ‒Pn‒C60•- (CR2) may take three different pathways represented in
dashed arrows: (1) direct recombination to the ground‒state via coherent electron tunneling,
(2) recombination to the porphyrin‒localized triplet excited state Fc‒3Pn*‒C60, or (3)
stepwise recombination with first reformation of the oxidized bridge state Fc‒Pn• ‒C60
•- by
hole hopping followed then by rapid recombination. Note that the relative positions of the
different states are not representing the real relative energies levels and are only indicative.
5.2.1 DIRECT VERSUS STEPWISE CHARGE SEPARATION IN Fc‒Pn‒C60
Figure 5.3 compares the ground‒state absorption spectra of Fc‒Pn‒C60, Pn‒C60 and Pn
for n = 1‒4, 6 at room temperature. In general, the visible parts of these spectra are
nearly superimposed, despite the additions of the acceptor C60 in Pn‒C60 and the
secondary donor Fc in Fc‒Pn‒C60. This indicates that neither the ferrocene group or the
fullerene perturb the electronic ground state of the porphyrin‒based bridge.93, 195
All
compounds show the characteristic absorption bands of porphyrins: an intense Soret
band (S0→S2) centered at 450 nm for Fc‒P1‒C60, at 466 nm for Fc‒Pn‒C60 (n ≥ 2) with
a shoulder at 495 nm and a broad Q‒band (S0→S1) that extends from ~550 nm to 850
nm. The increasingly broad Q‒band observed for long porphyrin systems (n ≥ 2) arises
from a large distribution of rotational conformers contributing to ground‒state
absorption. To enable comparison with the previous study on charge separation in
Pn‒C60 by Kahnt et al.195
, the same excitation wavelength in the Soret band was used to
68
initiate the charge separation reaction (CS1) in Fc‒Pn‒C60: 450 nm for Fc‒P1‒C60 and
495 nm for Fc‒Pn‒C60 (n ≥ 2). Thus, in both studies, dyads and triads, virtually
identical conformational distributions are initially excited, and in regard to the similar
absorption spectra, formation of the initial charge separated state is expected to occur by
a similar charge separation scheme in both dyads and triads.
Figure 5.3 Ground‒state absorption spectra of Pn (black), Pn‒C60 (red) and Fc‒Pn‒C60
(blue) (n = 1–4, 6) at room temperature in 2‒MTHF with 1% pyridine added. The spectra
have been normalized and offset by (n–1) x 0.25 absorbance units.
Steady‒state fluorescence measurements reveal significantly quenched emission of the
porphyrin excited state in Fc‒Pn‒C60 compared to their corresponding Pn‒C60, Fc‒Pn
and reference systems Pn over the temperature range 180–300 K (see Paper I Figure 4).
Despite the competing quenching by energy transfer to the ferrocene group, the initial
charge separation is sufficiently efficient that Fc‒Pn•+
‒C60•- is formed for the entire
series. Nevertheless, significant differences in the quantum yield for formation of
Fc‒Pn•+
‒C60•-, are observed with the length of the porphyrin bridge and/or temperature.
When going from Fc‒P1‒C60 to Fc‒P6‒C60, ΦCS1 drops from > 0.90 in Fc‒P1‒C60 to
nearly 0.45 in Fc‒P6‒C60 at room temperature. At lower temperatures, ΦCS1 further
decreases for the long systems (n ≥ 3). Clear evidence of the similar charge separation
scheme in triads and dyads is provided by temperature‒dependent fluorescence decays.
As mentioned earlier, charge separation may occur via two scenarios: either directly for
excitation energy initially localized close to the C60 or in a step‒wise fashion with
excitation energy migration close to the C60 followed by charge separation. Such charge
separation scheme should translate to kinetically more than one rate constant for charge
separation. Remarkably, this is confirmed by the measured fluorescence decays for the
porphyrin excited states over the temperature range 300‒180 K, shown in Figure 5.4.
Except for Fc‒P1‒C60, all fluorescence decays need to be fitted to bi-exponential
expressions. The fitted lifetimes (see Table 5.1) are both shorter than the ones of the
corresponding reference compounds Pn (P1: 1450 ps, P2:1210 ps, P3:1100 ps, P4:830 ps
and P6: 650 ps) and the dyads Fc‒Pn (Fc‒P1: 7.1 ps and 109 ps, Fc‒P2: 18 ps and 67 ps,
300 400 500 600 700 800 900
0.0
0.5
1.0
1.5
2.0
n = 1
n = 6
Abso
rba
nce
Wavelength (nm)
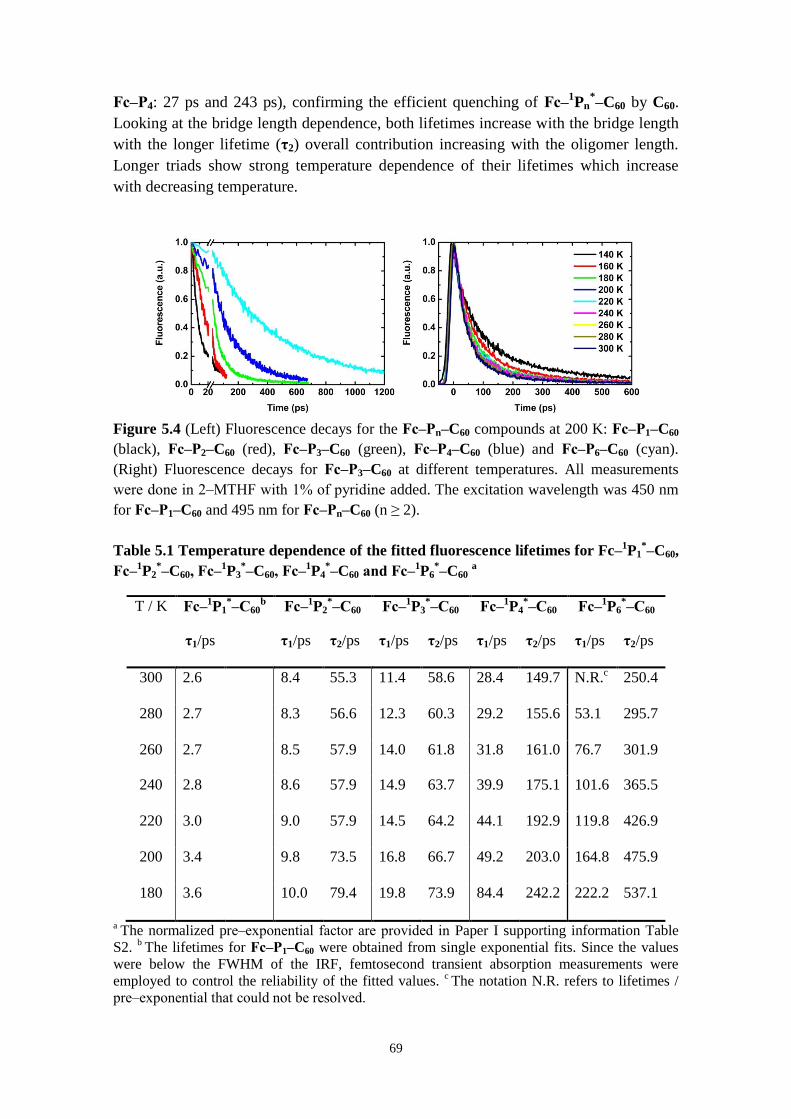
69
Fc‒P4: 27 ps and 243 ps), confirming the efficient quenching of Fc‒1Pn
*‒C60 by C60.
Looking at the bridge length dependence, both lifetimes increase with the bridge length
with the longer lifetime (τ2) overall contribution increasing with the oligomer length.
Longer triads show strong temperature dependence of their lifetimes which increase
with decreasing temperature.
Figure 5.4 (Left) Fluorescence decays for the Fc‒Pn‒C60 compounds at 200 K: Fc‒P1‒C60
(black), Fc‒P2‒C60 (red), Fc‒P3‒C60 (green), Fc‒P4‒C60 (blue) and Fc‒P6‒C60 (cyan).
(Right) Fluorescence decays for Fc‒P3‒C60 at different temperatures. All measurements
were done in 2‒MTHF with 1% of pyridine added. The excitation wavelength was 450 nm
for Fc‒P1‒C60 and 495 nm for Fc‒Pn‒C60 (n ≥ 2).
Table 5.1 Temperature dependence of the fitted fluorescence lifetimes for Fc‒1P1*‒C60,
Fc‒1P2*‒C60, Fc‒1P3
*‒C60, Fc‒1P4*‒C60 and Fc‒1P6
*‒C60 a
T / K Fc‒1P1*‒ 60
b Fc‒1P2
*‒ 60 Fc‒1P3*‒ 60 Fc‒1P4
*‒ 60 Fc‒1P6*‒ 60
τ1/ps τ1/ps τ2/ps τ1/ps τ2/ps τ1/ps τ2/ps τ1/ps τ2/ps
300 2.6 8.4 55.3 11.4 58.6 28.4 149.7 N.R.c 250.4
280 2.7 8.3 56.6 12.3 60.3 29.2 155.6 53.1 295.7
260 2.7 8.5 57.9 14.0 61.8 31.8 161.0 76.7 301.9
240 2.8 8.6 57.9 14.9 63.7 39.9 175.1 101.6 365.5
220 3.0 9.0 57.9 14.5 64.2 44.1 192.9 119.8 426.9
200 3.4 9.8 73.5 16.8 66.7 49.2 203.0 164.8 475.9
180 3.6 10.0 79.4 19.8 73.9 84.4 242.2 222.2 537.1
a The normalized pre‒exponential factor are provided in Paper I supporting information Table
S2. b The lifetimes for Fc‒P1‒C60 were obtained from single exponential fits. Since the values
were below the FWHM of the IRF, femtosecond transient absorption measurements were
employed to control the reliability of the fitted values. c The notation N.R. refers to lifetimes /
pre‒exponential that could not be resolved.
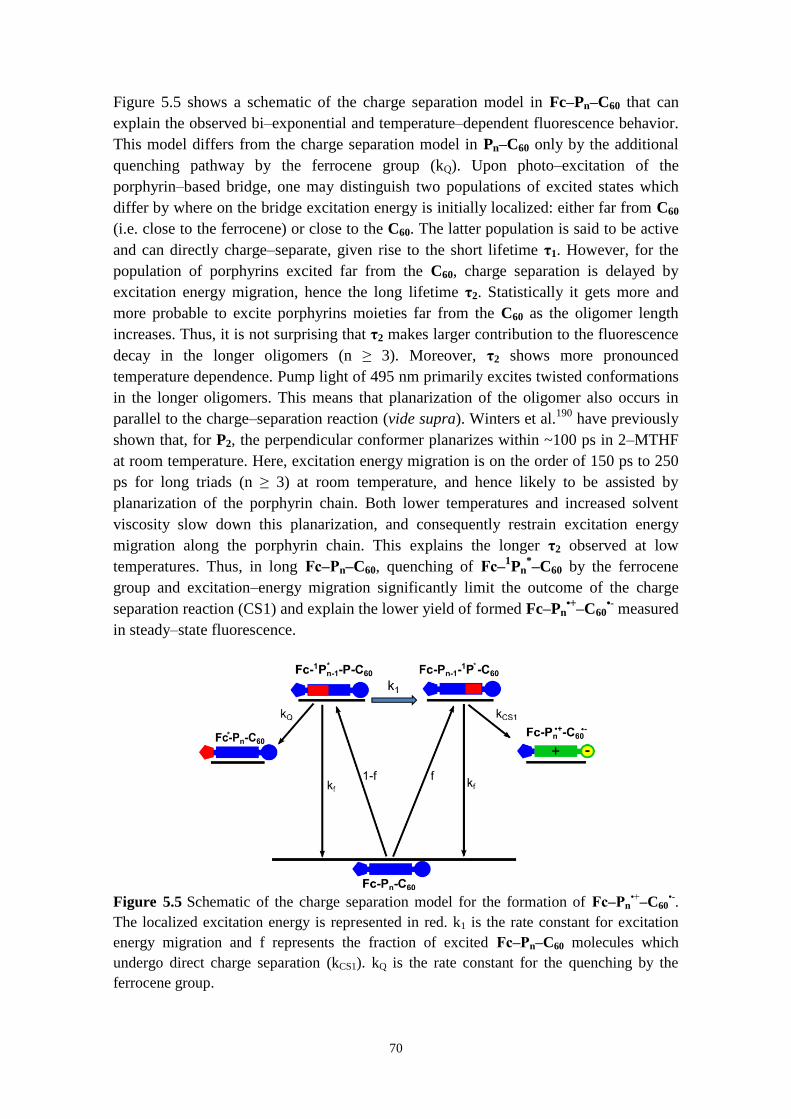
70
Figure 5.5 shows a schematic of the charge separation model in Fc‒Pn‒C60 that can
explain the observed bi‒exponential and temperature‒dependent fluorescence behavior.
This model differs from the charge separation model in Pn‒C60 only by the additional
quenching pathway by the ferrocene group (kQ). Upon photo‒excitation of the
porphyrin‒based bridge, one may distinguish two populations of excited states which
differ by where on the bridge excitation energy is initially localized: either far from C60
(i.e. close to the ferrocene) or close to the C60. The latter population is said to be active
and can directly charge‒separate, given rise to the short lifetime τ1. However, for the
population of porphyrins excited far from the C60, charge separation is delayed by
excitation energy migration, hence the long lifetime τ2. Statistically it gets more and
more probable to excite porphyrins moieties far from the C60 as the oligomer length
increases. Thus, it is not surprising that τ2 makes larger contribution to the fluorescence
decay in the longer oligomers (n ≥ 3). Moreover, τ2 shows more pronounced
temperature dependence. Pump light of 495 nm primarily excites twisted conformations
in the longer oligomers. This means that planarization of the oligomer also occurs in
parallel to the charge‒separation reaction (vide supra). Winters et al.190
have previously
shown that, for P2, the perpendicular conformer planarizes within ~100 ps in 2‒MTHF
at room temperature. Here, excitation energy migration is on the order of 150 ps to 250
ps for long triads (n ≥ 3) at room temperature, and hence likely to be assisted by
planarization of the porphyrin chain. Both lower temperatures and increased solvent
viscosity slow down this planarization, and consequently restrain excitation energy
migration along the porphyrin chain. This explains the longer τ2 observed at low
temperatures. Thus, in long Fc‒Pn‒C60, quenching of Fc‒1Pn
*‒C60 by the ferrocene
group and excitation‒energy migration significantly limit the outcome of the charge
separation reaction (CS1) and explain the lower yield of formed Fc‒Pn•+
‒C60•- measured
in steady‒state fluorescence.
Figure 5.5 Schematic of the charge separation model for the formation of Fc‒Pn
• ‒C60•-.
The localized excitation energy is represented in red. k1 is the rate constant for excitation
energy migration and f represents the fraction of excited Fc‒Pn‒C60 molecules which
undergo direct charge separation (kCS1). kQ is the rate constant for the quenching by the
ferrocene group.
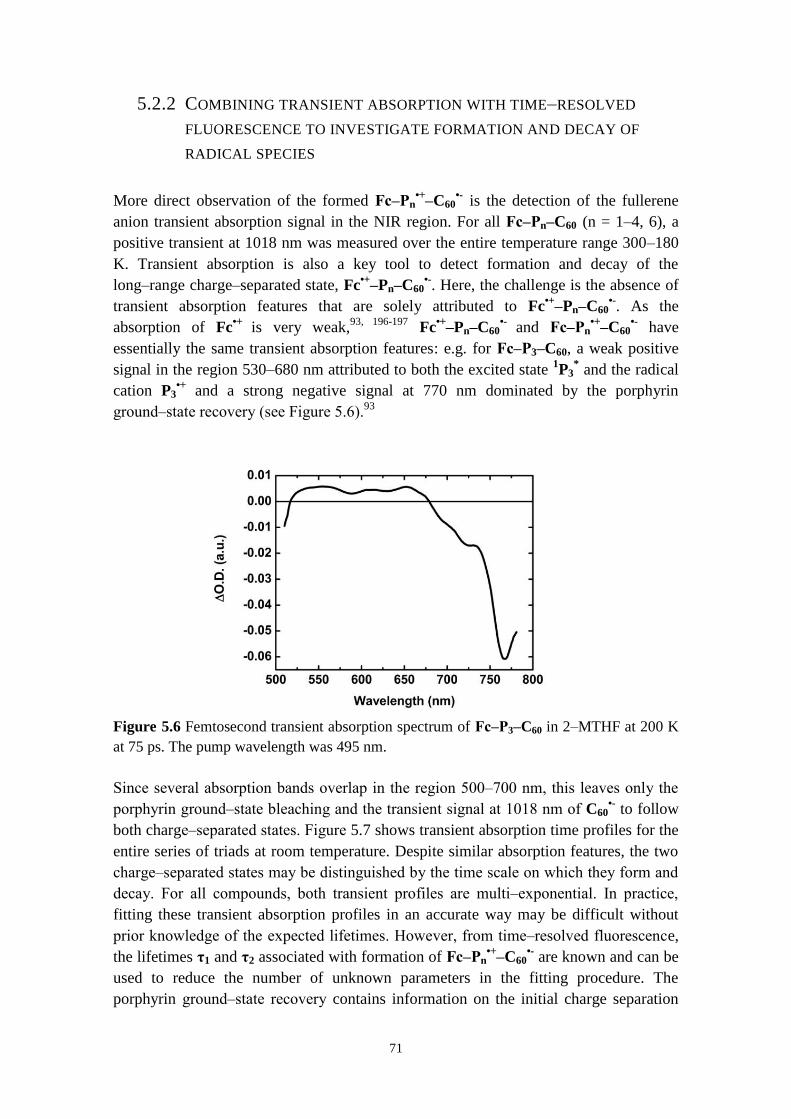
71
5.2.2 COMBINING TRANSIENT ABSORPTION WITH TIME‒RESOLVED
FLUORESCENCE TO INVESTIGATE FORMATION AND DECAY OF
RADICAL SPECIES
More direct observation of the formed Fc‒Pn•+
‒C60•- is the detection of the fullerene
anion transient absorption signal in the NIR region. For all Fc‒Pn‒C60 (n = 1–4, 6), a
positive transient at 1018 nm was measured over the entire temperature range 300‒180
K. Transient absorption is also a key tool to detect formation and decay of the
long‒range charge‒separated state, Fc•+
‒Pn‒C60•-. Here, the challenge is the absence of
transient absorption features that are solely attributed to Fc•+
‒Pn‒C60•-. As the
absorption of Fc•+
is very weak,93, 196-197
Fc•+
‒Pn‒C60•-
and Fc‒Pn•+
‒C60•- have
essentially the same transient absorption features: e.g. for Fc‒P3‒C60, a weak positive
signal in the region 530–680 nm attributed to both the excited state 1P3
* and the radical
cation P3•+
and a strong negative signal at 770 nm dominated by the porphyrin
ground‒state recovery (see Figure 5.6).93
Figure 5.6 Femtosecond transient absorption spectrum of Fc‒P3‒C60 in 2‒MTHF at 200 K
at 75 ps. The pump wavelength was 495 nm.
Since several absorption bands overlap in the region 500‒700 nm, this leaves only the
porphyrin ground‒state bleaching and the transient signal at 1018 nm of C60•- to follow
both charge‒separated states. Figure 5.7 shows transient absorption time profiles for the
entire series of triads at room temperature. Despite similar absorption features, the two
charge‒separated states may be distinguished by the time scale on which they form and
decay. For all compounds, both transient profiles are multi‒exponential. In practice,
fitting these transient absorption profiles in an accurate way may be difficult without
prior knowledge of the expected lifetimes. However, from time‒resolved fluorescence,
the lifetimes τ1 and τ2 associated with formation of Fc‒Pn•+
‒C60•- are known and can be
used to reduce the number of unknown parameters in the fitting procedure. The
porphyrin ground‒state recovery contains information on the initial charge separation
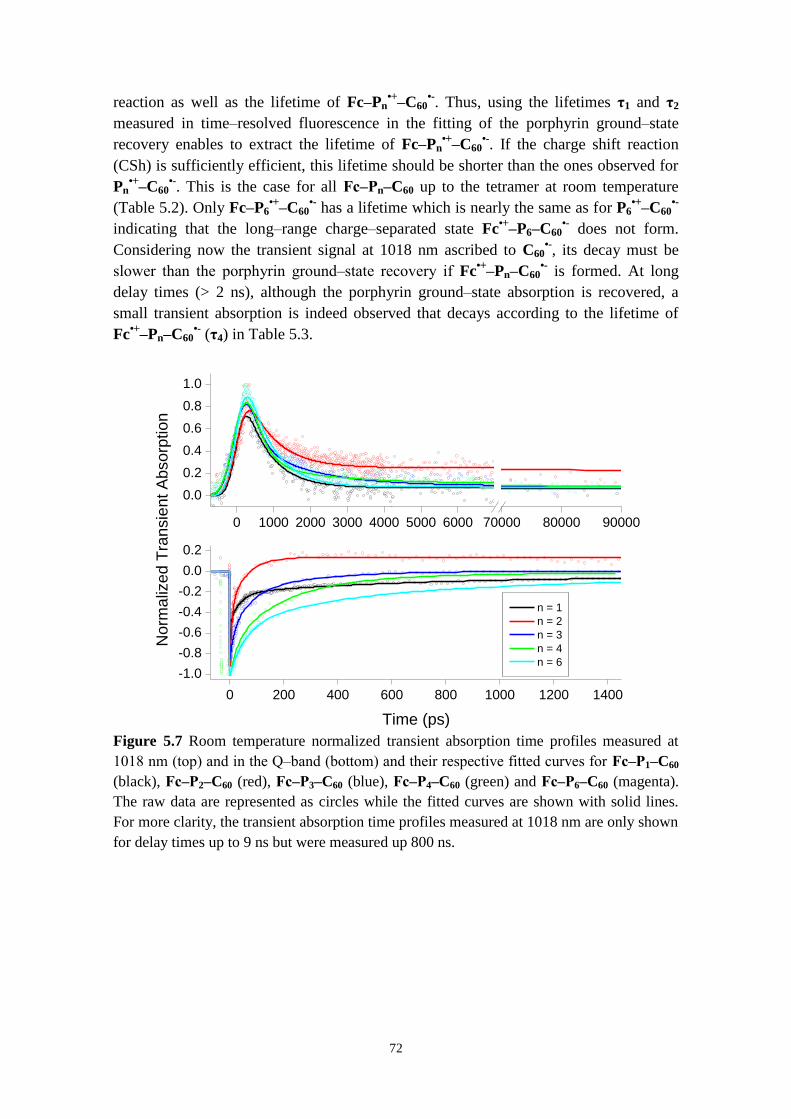
72
reaction as well as the lifetime of Fc‒Pn•+
‒C60•-. Thus, using the lifetimes τ1 and τ2
measured in time‒resolved fluorescence in the fitting of the porphyrin ground‒state
recovery enables to extract the lifetime of Fc‒Pn•+
‒C60•-. If the charge shift reaction
(CSh) is sufficiently efficient, this lifetime should be shorter than the ones observed for
Pn•+
‒C60•-. This is the case for all Fc‒Pn‒C60 up to the tetramer at room temperature
(Table 5.2). Only Fc‒P6•+
‒C60•- has a lifetime which is nearly the same as for P6
•+‒C60
•-
indicating that the long‒range charge‒separated state Fc•+
‒P6‒C60•- does not form.
Considering now the transient signal at 1018 nm ascribed to C60•-, its decay must be
slower than the porphyrin ground‒state recovery if Fc•+
‒Pn‒C60•- is formed. At long
delay times (> 2 ns), although the porphyrin ground‒state absorption is recovered, a
small transient absorption is indeed observed that decays according to the lifetime of
Fc•+
‒Pn‒C60•- (τ4) in Table 5.3.
Figure 5.7 Room temperature normalized transient absorption time profiles measured at
1018 nm (top) and in the Q‒band (bottom) and their respective fitted curves for Fc‒P1‒C60
(black), Fc‒P2‒C60 (red), Fc‒P3‒C60 (blue), Fc‒P4‒C60 (green) and Fc‒P6‒C60 (magenta).
The raw data are represented as circles while the fitted curves are shown with solid lines.
For more clarity, the transient absorption time profiles measured at 1018 nm are only shown
for delay times up to 9 ns but were measured up 800 ns.
0 200 400 600 800 1000 1200 1400
-1.0
-0.8
-0.6
-0.4
-0.2
0.0
0.2
n = 1
n = 2
n = 3
n = 4
n = 6
Norm
aliz
ed T
ransie
nt A
bsorp
tion
Time (ps)
0 1000 2000 3000 4000 5000 6000 70000 80000 90000
0.0
0.2
0.4
0.6
0.8
1.0
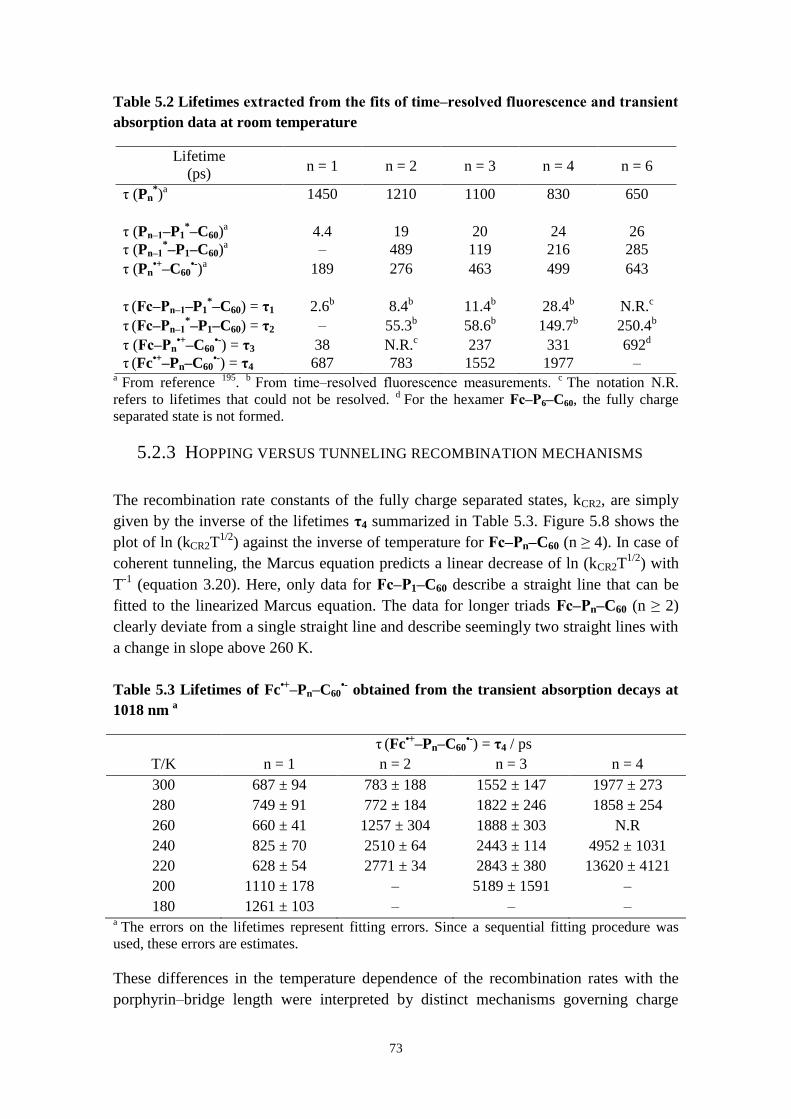
73
Table 5.2 Lifetimes extracted from the fits of time‒resolved fluorescence and transient
absorption data at room temperature
Lifetime
(ps) n = 1 n = 2 n = 3 n = 4 n = 6
τ (Pn*)a 1450 1210 1100 830 650
τ (Pn‒ ‒P1*‒C60)
a 4.4 19 20 24 26
τ (Pn‒ *‒P1‒C60)
a ‒ 489 119 216 285
τ (Pn•+‒C60
•-)a 189 276 463 499 643
τ (Fc‒Pn‒ ‒P1*‒C60) = τ1 2.6b 8.4b 11.4b 28.4b N.R.c
τ (Fc‒Pn‒ *‒P1‒C60) = τ2 ‒ 55.3b 58.6b 149.7b 250.4b
τ (Fc‒Pn•+‒C60
•-) = τ3 38 N.R.c 237 331 692d
τ (Fc•+‒Pn‒C60•-) = τ4 687 783 1552 1977 ‒
a From reference
195.
b From time‒resolved fluorescence measurements.
c The notation N.R.
refers to lifetimes that could not be resolved. d
For the hexamer Fc‒P6‒C60, the fully charge
separated state is not formed.
5.2.3 HOPPING VERSUS TUNNELING RECOMBINATION MECHANISMS
The recombination rate constants of the fully charge separated states, kCR2, are simply
given by the inverse of the lifetimes τ4 summarized in Table 5.3. Figure 5.8 shows the
plot of ln (kCR2T1/2
) against the inverse of temperature for Fc‒Pn‒C60 (n ≥ 4). In case of
coherent tunneling, the Marcus equation predicts a linear decrease of ln (kCR2T1/2
) with
T-1
(equation 3.20). Here, only data for Fc‒P1‒C60 describe a straight line that can be
fitted to the linearized Marcus equation. The data for longer triads Fc‒Pn‒C60 (n ≥ 2)
clearly deviate from a single straight line and describe seemingly two straight lines with
a change in slope above 260 K.
Table 5.3 Lifetimes of Fc•+‒Pn‒C60•- obtained from the transient absorption decays at
1018 nm a
τ (Fc•+‒Pn‒C60•-) = τ4 / ps
T/K n = 1 n = 2 n = 3 n = 4
300 687 ± 94 783 ± 188 1552 ± 147 1977 ± 273
280 749 ± 91 772 ± 184 1822 ± 246 1858 ± 254
260 660 ± 41 1257 ± 304 1888 ± 303 N.R
240 825 ± 70 2510 ± 64 2443 ± 114 4952 ± 1031
220 628 ± 54 2771 ± 34 2843 ± 380 13620 ± 4121
200 1110 ± 178 ‒ 5189 ± 1591 ‒
180 1261 ± 103 ‒ ‒ ‒ a
The errors on the lifetimes represent fitting errors. Since a sequential fitting procedure was
used, these errors are estimates.
These differences in the temperature dependence of the recombination rates with the
porphyrin‒bridge length were interpreted by distinct mechanisms governing charge
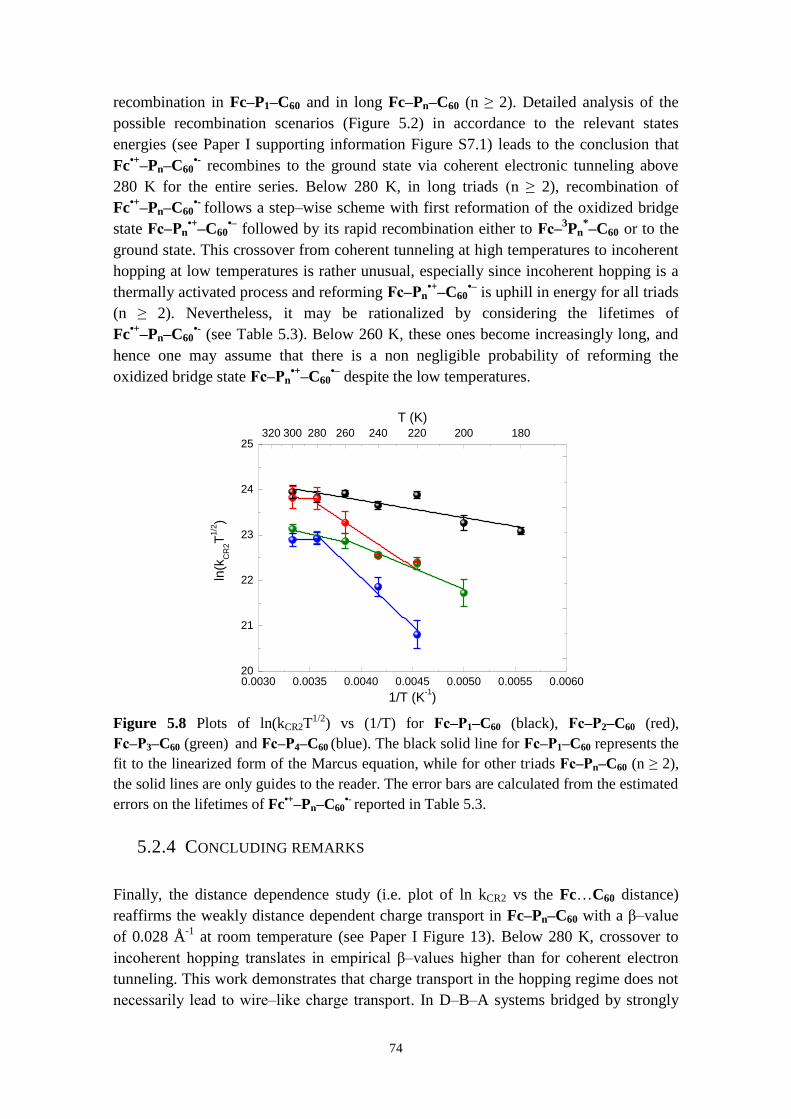
74
recombination in Fc‒P1‒C60 and in long Fc‒Pn‒C60 (n ≥ 2). Detailed analysis of the
possible recombination scenarios (Figure 5.2) in accordance to the relevant states
energies (see Paper I supporting information Figure S7.1) leads to the conclusion that
Fc•+
‒Pn‒C60•- recombines to the ground state via coherent electronic tunneling above
280 K for the entire series. Below 280 K, in long triads (n ≥ 2), recombination of
Fc•+
‒Pn‒C60•-
follows a step‒wise scheme with first reformation of the oxidized bridge
state Fc‒Pn•+
‒C60•‒
followed by its rapid recombination either to Fc‒3Pn
*‒C60 or to the
ground state. This crossover from coherent tunneling at high temperatures to incoherent
hopping at low temperatures is rather unusual, especially since incoherent hopping is a
thermally activated process and reforming Fc‒Pn•+
‒C60•‒
is uphill in energy for all triads
(n ≥ 2). Nevertheless, it may be rationalized by considering the lifetimes of
Fc•+
‒Pn‒C60•- (see Table 5.3). Below 260 K, these ones become increasingly long, and
hence one may assume that there is a non negligible probability of reforming the
oxidized bridge state Fc‒Pn•+
‒C60•‒
despite the low temperatures.
Figure 5.8 Plots of ln(kCR2T1/2) vs (1/T) for Fc‒P1‒C60 (black), Fc‒P2‒C60 (red),
Fc‒P3‒C60 (green) and Fc‒P4‒C60 (blue). The black solid line for Fc‒P1‒C60 represents the
fit to the linearized form of the Marcus equation, while for other triads Fc‒Pn‒C60 (n ≥ 2),
the solid lines are only guides to the reader. The error bars are calculated from the estimated
errors on the lifetimes of Fc•+‒Pn‒C60•- reported in Table 5.3.
5.2.4 CONCLUDING REMARKS
Finally, the distance dependence study (i.e. plot of ln kCR2 vs the Fc…C60 distance)
reaffirms the weakly distance dependent charge transport in Fc‒Pn‒C60 with a β‒value
of 0.028 Å-1
at room temperature (see Paper I Figure 13). Below 280 K, crossover to
incoherent hopping translates in empirical β‒values higher than for coherent electron
tunneling. This work demonstrates that charge transport in the hopping regime does not
necessarily lead to wire‒like charge transport. In D‒B‒A systems bridged by strongly
0.0030 0.0035 0.0040 0.0045 0.0050 0.0055 0.006020
21
22
23
24
25
ln(k
CR
2T
1/2)
1/T (K-1)
320 300 280 260 240 220 200 180
T (K)
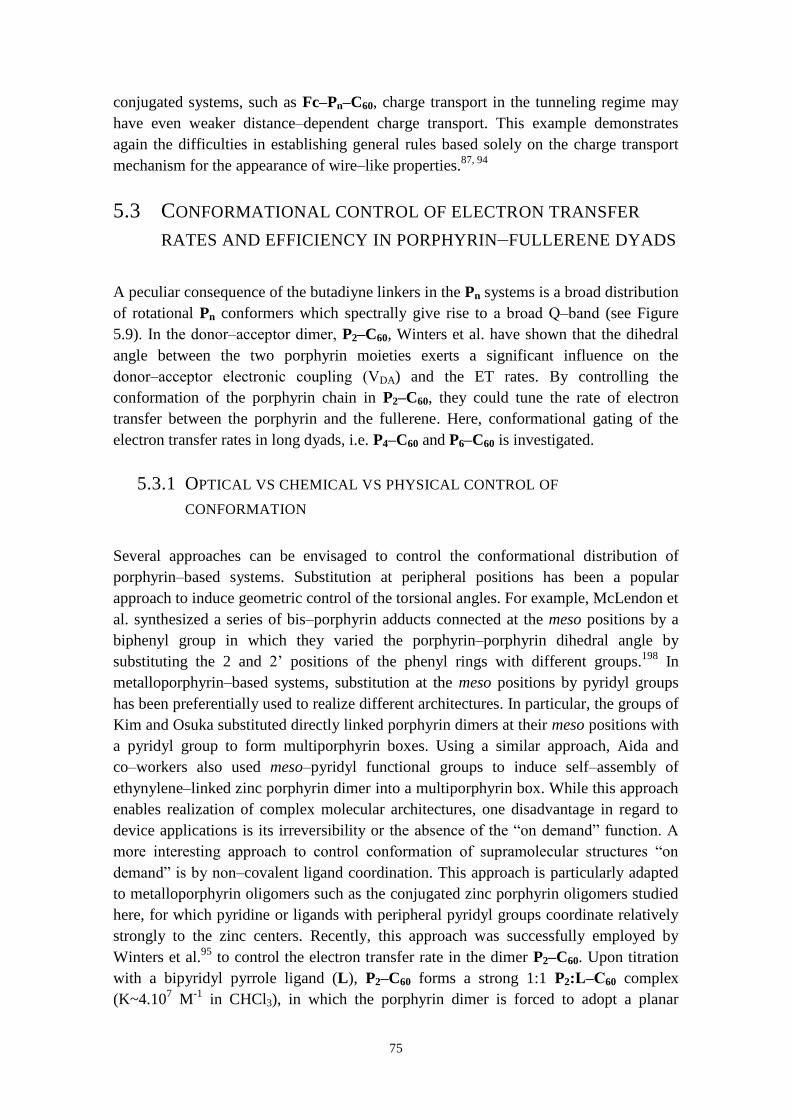
75
conjugated systems, such as Fc‒Pn‒C60, charge transport in the tunneling regime may
have even weaker distance‒dependent charge transport. This example demonstrates
again the difficulties in establishing general rules based solely on the charge transport
mechanism for the appearance of wire‒like properties.87, 94
5.3 CONFORMATIONAL CONTROL OF ELECTRON TRANSFER
RATES AND EFFICIENCY IN PORPHYRIN‒FULLERENE DYADS
A peculiar consequence of the butadiyne linkers in the Pn systems is a broad distribution
of rotational Pn conformers which spectrally give rise to a broad Q‒band (see Figure
5.9). In the donor‒acceptor dimer, P2‒C60, Winters et al. have shown that the dihedral
angle between the two porphyrin moieties exerts a significant influence on the
donor‒acceptor electronic coupling ( DA) and the ET rates. By controlling the
conformation of the porphyrin chain in P2‒C60, they could tune the rate of electron
transfer between the porphyrin and the fullerene. Here, conformational gating of the
electron transfer rates in long dyads, i.e. P4‒C60 and P6‒C60 is investigated.
5.3.1 OPTICAL VS CHEMICAL VS PHYSICAL CONTROL OF
CONFORMATION
Several approaches can be envisaged to control the conformational distribution of
porphyrin‒based systems. Substitution at peripheral positions has been a popular
approach to induce geometric control of the torsional angles. For example, McLendon et
al. synthesized a series of bis‒porphyrin adducts connected at the meso positions by a
biphenyl group in which they varied the porphyrin‒porphyrin dihedral angle by
substituting the 2 and 2’ positions of the phenyl rings with different groups.198
In
metalloporphyrin‒based systems, substitution at the meso positions by pyridyl groups
has been preferentially used to realize different architectures. In particular, the groups of
Kim and Osuka substituted directly linked porphyrin dimers at their meso positions with
a pyridyl group to form multiporphyrin boxes. Using a similar approach, Aida and
co‒workers also used meso‒pyridyl functional groups to induce self‒assembly of
ethynylene‒linked zinc porphyrin dimer into a multiporphyrin box. While this approach
enables realization of complex molecular architectures, one disadvantage in regard to
device applications is its irreversibility or the absence of the “on demand” function. A
more interesting approach to control conformation of supramolecular structures “on
demand” is by non‒covalent ligand coordination. This approach is particularly adapted
to metalloporphyrin oligomers such as the conjugated zinc porphyrin oligomers studied
here, for which pyridine or ligands with peripheral pyridyl groups coordinate relatively
strongly to the zinc centers. Recently, this approach was successfully employed by
Winters et al.95
to control the electron transfer rate in the dimer P2‒C60. Upon titration
with a bipyridyl pyrrole ligand (L), P2‒C60 forms a strong 1:1 P2:L‒ 60 complex
(K~4.107 M
-1 in CHCl3), in which the porphyrin dimer is forced to adopt a planar
76
conformation. This conformational restriction leads to a significantly reduced rate of
electron transfer in the planar P2:L‒ 60 compared to its unconstrained counterpart
P2‒C60 (i.e. with random conformation). In an even simpler approach, they could also
control the conformational state of the oligomer using light as an external stimulus.
They showed that excitation in the blue‒part of the Q‒band promoted mostly twisted
conformers to the excited state, while excitation in its red‒end favored the planar
conformer. Applied to the donor‒acceptor dimer, P2‒C60, this approach produced
different initial excited states for charge separation. About four times faster charge
separation rates were measured for twisted conformers, due, in part, to an electronic
coupling twice as large for these conformers with respect to the planar conformer.
Considering the longer oligomers, P4‒C60 and P6‒C60, a much larger number of
rotational conformers exist due to the increasing number of combinations of dihedral
angles between the neighboring porphyrin moieties. This renders control of
conformation in these long dyads more difficult than in the shorter P2‒C60.
Nevertheless, the possibility to excite different population of conformers by tuning the
excitation wavelength in the Q‒band is expected to also prevail for longer oligomers. In
particular, time‒dependent DFT calculations of the electronic transitions for the planar
conformer in the entire series confirm their absorption at long wavelengths in the
Q‒band (see Paper II Figure 3). Figure 5.9 shows the ground‒state absorption spectra of
P4‒C60 and P6‒C60 with arrows indicating the different excitation wavelengths chosen
to prepare different excited states for charge separation. Self‒assembly by ligand
coordination was also envisaged to restrain the conformational distribution of these long
oligomers. In principle, bidentate ligands with pyridyl groups such as the ones used for
planarization of P2‒C60 could have been used. However, these ligands are here far from
being ideal since many different complexes could form, i.e. Pn:L2‒C60, Pn:L1‒C60 for n
≥ 4. Instead multidentate ligands with several pyridyl groups may be used. Here, we
used an octa‒dentate template with eight axial pyridine groups to prevent rotations of
individual porphyrins in P4‒C60 and P6‒C60 (Figure 5.16).199
Upon titration of the
porphyrin oligomer with a solution of T8, 1:1 Pn:T8‒ 60 (n = 4, 6) semi‒circular
complexes form by coordination of the zinc centers to the pyridyl groups of T8. In these
complexes, the neighboring porphyrin molecular planes are nearly coplanar. This leads
spectrally to a new red‒shifted peak growing in at the red‒edge of the Q‒band and a
more structured Q‒band, as shown in Figure 5.9. The self‒assembled Pn:T8‒ 60
dissociate with a large excess of pyridine.199
The following sections describe how the
selected conformation by optical or chemical external stimuli influences the outcome of
the charge separation reaction (i.e. kinetics and yield) in long Pn‒C60 (n = 4, 6). In both
cases, the charge separation reaction was followed by means of steady‒state and
time‒resolved fluorescence emission. Finally, we demonstrate that temperature may be
used as a physical means to control conformational distribution.
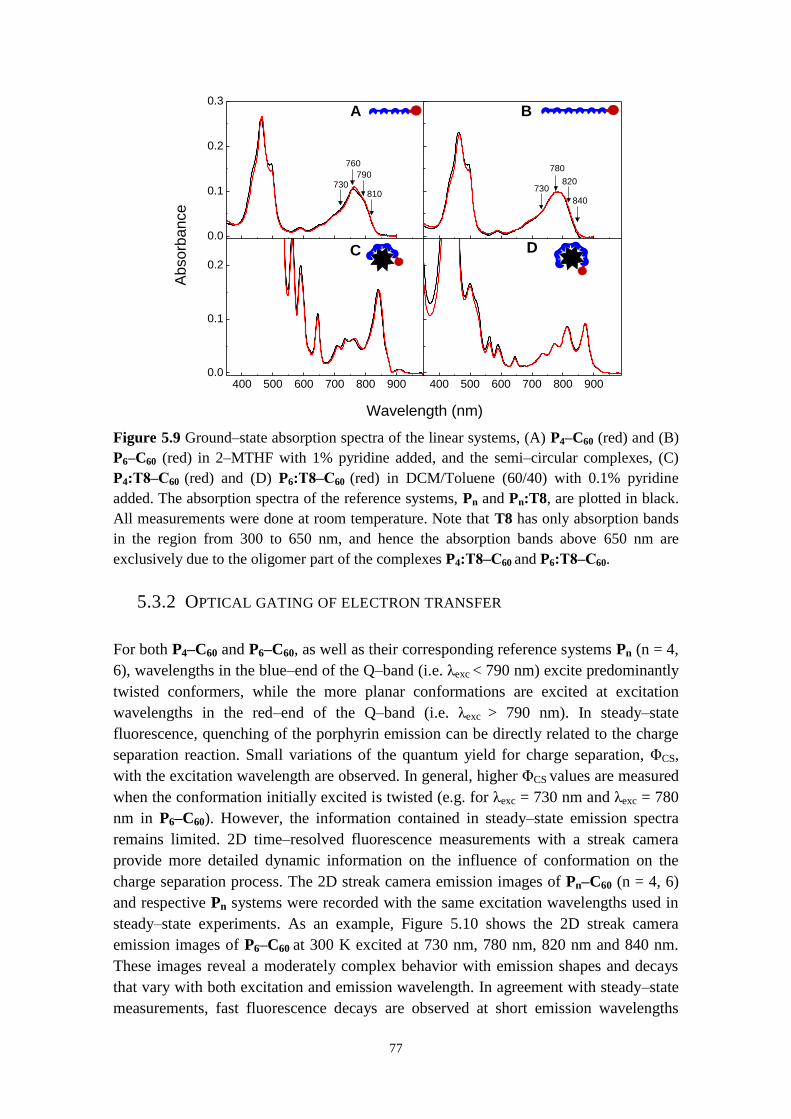
77
Figure 5.9 Ground‒state absorption spectra of the linear systems, (A) P4‒C60 (red) and (B)
P6‒C60 (red) in 2‒MTHF with 1% pyridine added, and the semi‒circular complexes, (C)
P4:T8‒ 60 (red) and (D) P6:T8‒ 60 (red) in DCM/Toluene (60/40) with 0.1% pyridine
added. The absorption spectra of the reference systems, Pn and Pn:T8, are plotted in black.
All measurements were done at room temperature. Note that T8 has only absorption bands
in the region from 300 to 650 nm, and hence the absorption bands above 650 nm are
exclusively due to the oligomer part of the complexes P4:T8‒ 60 and P6:T8‒ 60.
5.3.2 OPTICAL GATING OF ELECTRON TRANSFER
For both P4‒C60 and P6‒C60, as well as their corresponding reference systems Pn (n = 4,
6), wavelengths in the blue‒end of the Q‒band (i.e. λexc < 790 nm) excite predominantly
twisted conformers, while the more planar conformations are excited at excitation
wavelengths in the red‒end of the Q‒band (i.e. λexc > 790 nm). In steady‒state
fluorescence, quenching of the porphyrin emission can be directly related to the charge
separation reaction. Small variations of the quantum yield for charge separation, ΦCS,
with the excitation wavelength are observed. In general, higher ΦCS values are measured
when the conformation initially excited is twisted (e.g. for λexc = 730 nm and λexc = 780
nm in P6‒C60). However, the information contained in steady‒state emission spectra
remains limited. 2D time‒resolved fluorescence measurements with a streak camera
provide more detailed dynamic information on the influence of conformation on the
charge separation process. The 2D streak camera emission images of Pn‒C60 (n = 4, 6)
and respective Pn systems were recorded with the same excitation wavelengths used in
steady‒state experiments. As an example, Figure 5.10 shows the 2D streak camera
emission images of P6‒C60 at 300 K excited at 730 nm, 780 nm, 820 nm and 840 nm.
These images reveal a moderately complex behavior with emission shapes and decays
that vary with both excitation and emission wavelength. In agreement with steady‒state
measurements, fast fluorescence decays are observed at short emission wavelengths
0.0
0.1
0.2
0.3
810
790
760
DC
B
Ab
so
rba
nce
A
730 730
780
820
840
400 500 600 700 800 9000.0
0.1
0.2
Wavelength (nm)
400 500 600 700 800 900
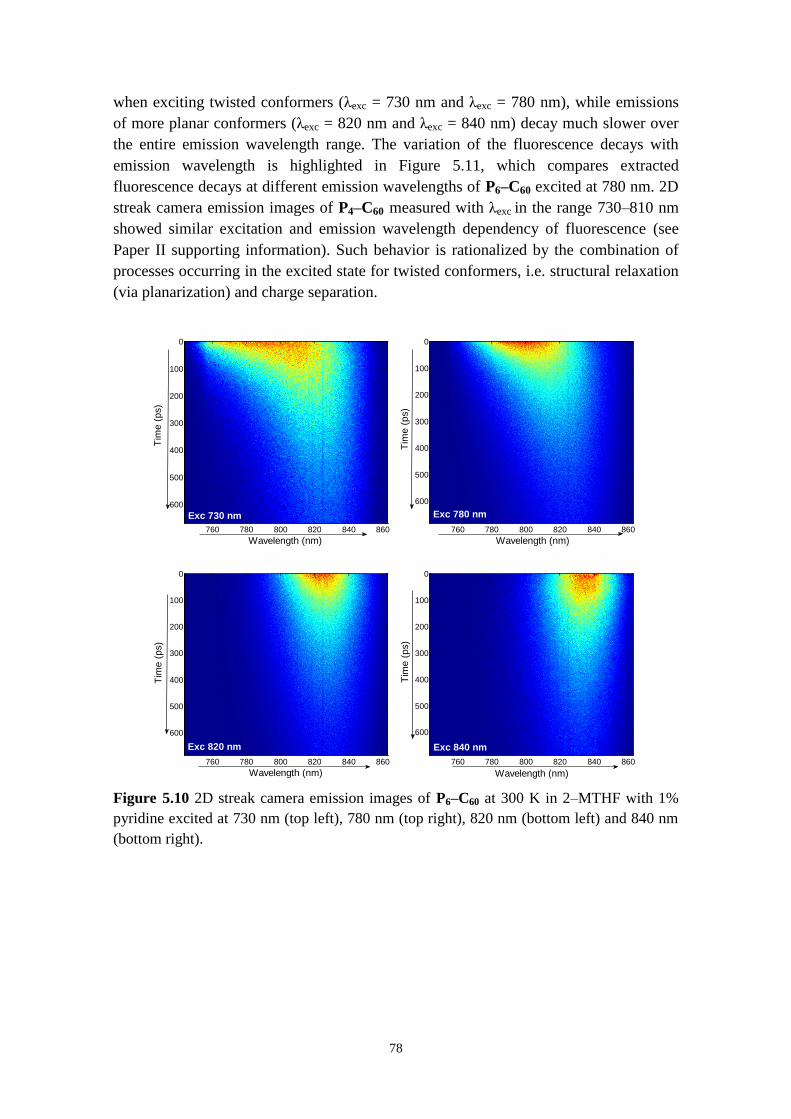
78
when exciting twisted conformers (λexc = 730 nm and λexc = 780 nm), while emissions
of more planar conformers (λexc = 820 nm and λexc = 840 nm) decay much slower over
the entire emission wavelength range. The variation of the fluorescence decays with
emission wavelength is highlighted in Figure 5.11, which compares extracted
fluorescence decays at different emission wavelengths of P6‒C60 excited at 780 nm. 2D
streak camera emission images of P4‒C60 measured with λexc in the range 730‒810 nm
showed similar excitation and emission wavelength dependency of fluorescence (see
Paper II supporting information). Such behavior is rationalized by the combination of
processes occurring in the excited state for twisted conformers, i.e. structural relaxation
(via planarization) and charge separation.
Figure 5.10 2D streak camera emission images of P6‒C60 at 300 K in 2‒MTHF with 1%
pyridine excited at 730 nm (top left), 780 nm (top right), 820 nm (bottom left) and 840 nm
(bottom right).
Wavelength (nm)
Tim
e (
ps)
760 780 800 820 840 860
0
100
200
300
400
500
600
Exc 730 nm
Wavelength (nm)
Tim
e (
ps)
760 780 800 820 840 860
0
100
200
300
400
500
600
Exc 780 nm
Wavelength (nm)
Tim
e (
ps)
760 780 800 820 840 860
0
100
200
300
400
500
600
Exc 820 nm
Wavelength (nm)
Tim
e (
ps)
760 780 800 820 840 860
0
100
200
300
400
500
600
Exc 840 nm
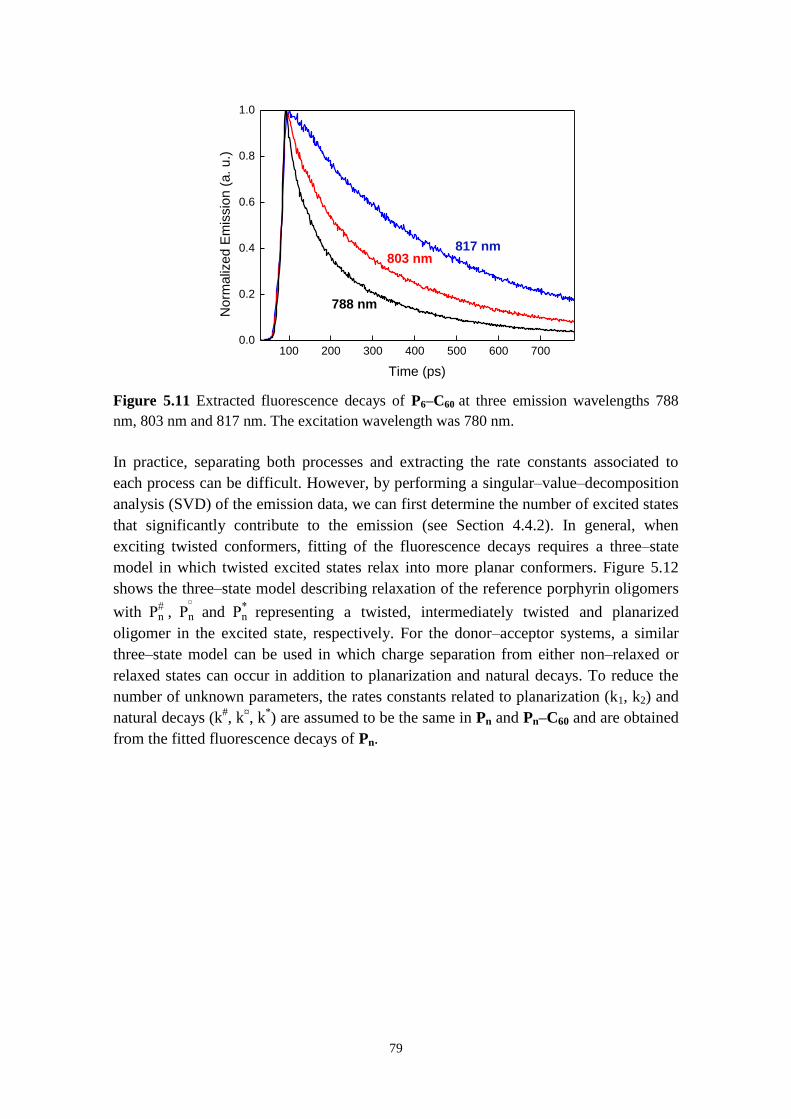
79
Figure 5.11 Extracted fluorescence decays of P6‒C60 at three emission wavelengths 788
nm, 803 nm and 817 nm. The excitation wavelength was 780 nm.
In practice, separating both processes and extracting the rate constants associated to
each process can be difficult. However, by performing a singular‒value‒decomposition
analysis (SVD) of the emission data, we can first determine the number of excited states
that significantly contribute to the emission (see Section 4.4.2). In general, when
exciting twisted conformers, fitting of the fluorescence decays requires a three‒state
model in which twisted excited states relax into more planar conformers. Figure 5.12
shows the three‒state model describing relaxation of the reference porphyrin oligomers
with Pn , Pn
and Pn representing a twisted, intermediately twisted and planarized
oligomer in the excited state, respectively. For the donor‒acceptor systems, a similar
three‒state model can be used in which charge separation from either non‒relaxed or
relaxed states can occur in addition to planarization and natural decays. To reduce the
number of unknown parameters, the rates constants related to planarization (k1, k2) and
natural decays (k#, k
¤, k
*) are assumed to be the same in Pn and Pn‒C60 and are obtained
from the fitted fluorescence decays of Pn.
100 200 300 400 500 600 7000.0
0.2
0.4
0.6
0.8
1.0
803 nm
Norm
aliz
ed E
mis
sio
n (
a. u.)
Time (ps)
817 nm
788 nm
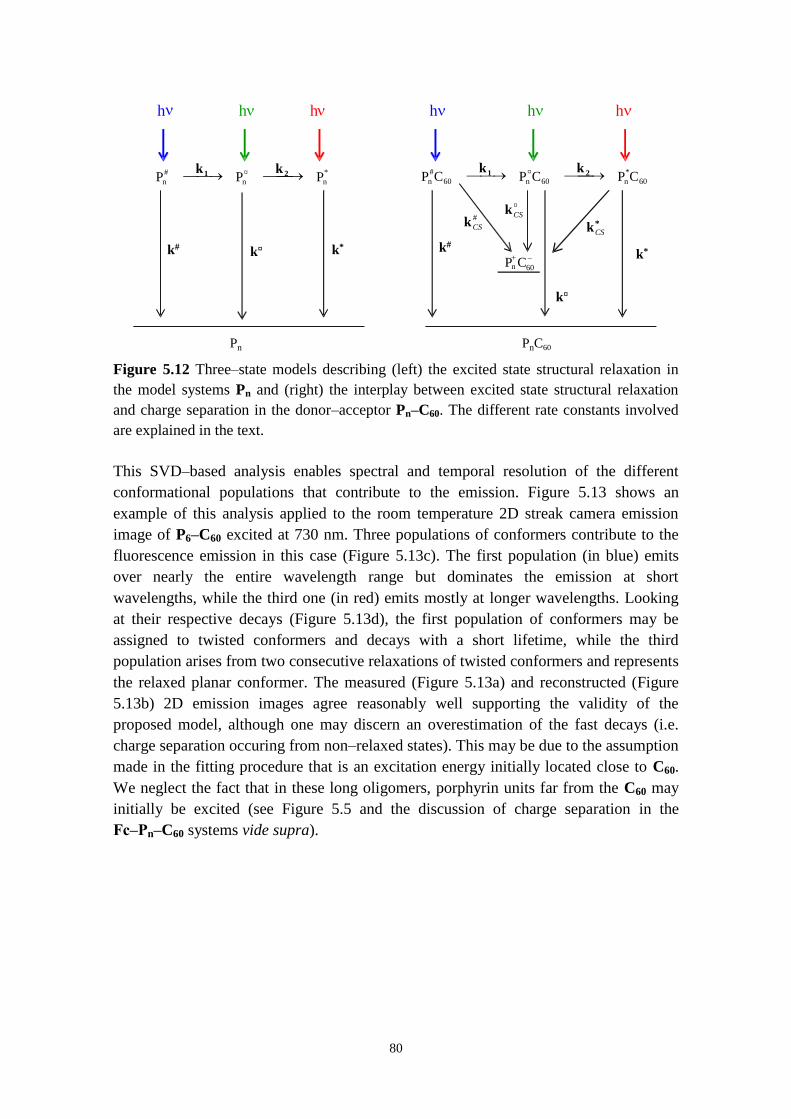
80
Figure 5.12 Three‒state models describing (left) the excited state structural relaxation in
the model systems Pn and (right) the interplay between excited state structural relaxation
and charge separation in the donor‒acceptor Pn‒C60. The different rate constants involved
are explained in the text.
This SVD‒based analysis enables spectral and temporal resolution of the different
conformational populations that contribute to the emission. Figure 5.13 shows an
example of this analysis applied to the room temperature 2D streak camera emission
image of P6‒C60 excited at 730 nm. Three populations of conformers contribute to the
fluorescence emission in this case (Figure 5.13c). The first population (in blue) emits
over nearly the entire wavelength range but dominates the emission at short
wavelengths, while the third one (in red) emits mostly at longer wavelengths. Looking
at their respective decays (Figure 5.13d), the first population of conformers may be
assigned to twisted conformers and decays with a short lifetime, while the third
population arises from two consecutive relaxations of twisted conformers and represents
the relaxed planar conformer. The measured (Figure 5.13a) and reconstructed (Figure
5.13b) 2D emission images agree reasonably well supporting the validity of the
proposed model, although one may discern an overestimation of the fast decays (i.e.
charge separation occuring from non‒relaxed states). This may be due to the assumption
made in the fitting procedure that is an excitation energy initially located close to C60.
We neglect the fact that in these long oligomers, porphyrin units far from the C60 may
initially be excited (see Figure 5.5 and the discussion of charge separation in the
Fc‒Pn‒C60 systems vide supra).
*
n
¤
n
#
n PPP 21 kk
k#k¤ k*
Pn
60
*
n60
¤
n60
#
n CPCPCP 21 kk
k#
k¤
k*
PnC60
+
60n CP
#
CSk
¤
CSk*CSk
hn hn hnhn hn hn
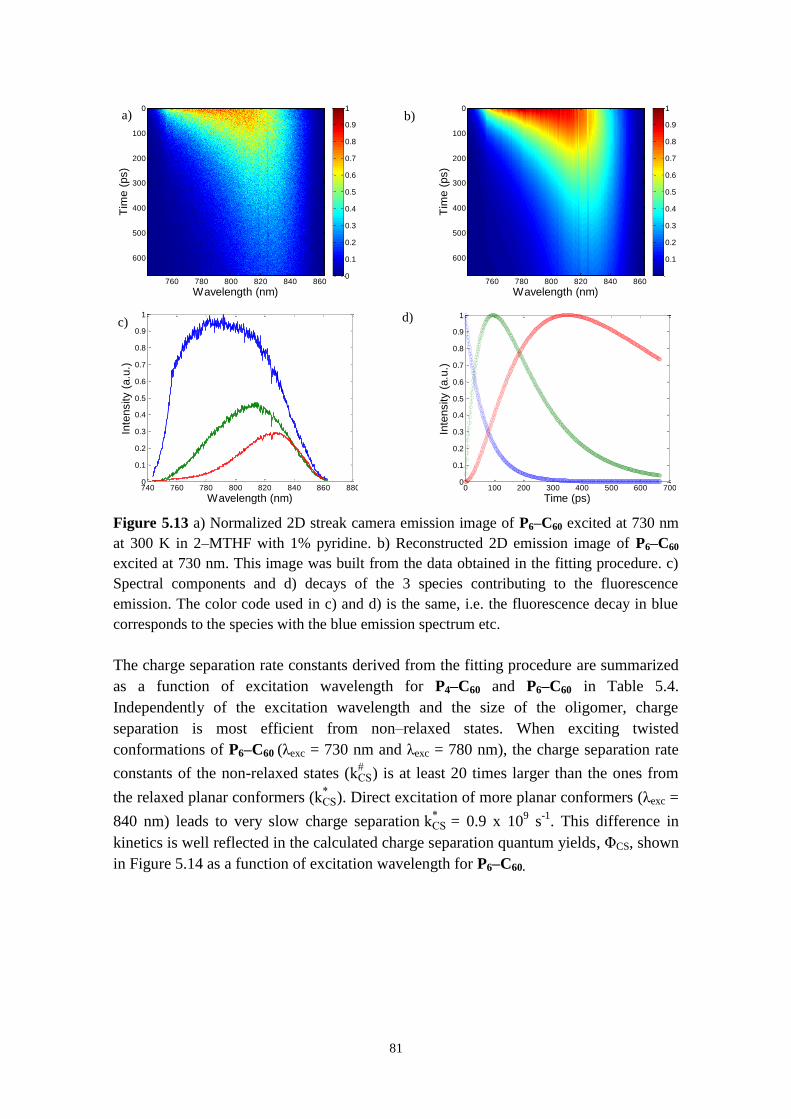
81
Figure 5.13 a) Normalized 2D streak camera emission image of P6‒C60 excited at 730 nm
at 300 K in 2‒MTHF with 1% pyridine. b) Reconstructed 2D emission image of P6‒C60
excited at 730 nm. This image was built from the data obtained in the fitting procedure. c)
Spectral components and d) decays of the 3 species contributing to the fluorescence
emission. The color code used in c) and d) is the same, i.e. the fluorescence decay in blue
corresponds to the species with the blue emission spectrum etc.
The charge separation rate constants derived from the fitting procedure are summarized
as a function of excitation wavelength for P4‒C60 and P6‒C60 in Table 5.4.
Independently of the excitation wavelength and the size of the oligomer, charge
separation is most efficient from non‒relaxed states. When exciting twisted
conformations of P6‒C60 (λexc = 730 nm and λexc = 780 nm), the charge separation rate
constants of the non-relaxed states (kCS
) is at least 20 times larger than the ones from
the relaxed planar conformers (kCS
). Direct excitation of more planar conformers (λexc =
840 nm) leads to very slow charge separation kCS
= 0.9 x 10⁹ s
-1. This difference in
kinetics is well reflected in the calculated charge separation quantum yields, ΦCS, shown
in Figure 5.14 as a function of excitation wavelength for P6‒C60.
Wavelength (nm)
Tim
e (
ps)
760 780 800 820 840 860
0
100
200
300
400
500
600
0
0.1
0.2
0.3
0.4
0.5
0.6
0.7
0.8
0.9
1
Wavelength (nm)
Tim
e (
ps)
760 780 800 820 840 860
0
100
200
300
400
500
600 0.1
0.2
0.3
0.4
0.5
0.6
0.7
0.8
0.9
1
740 760 780 800 820 840 860 8800
0.1
0.2
0.3
0.4
0.5
0.6
0.7
0.8
0.9
1
Wavelength (nm)
Inte
nsity (
a.u
.)
0 100 200 300 400 500 600 7000
0.1
0.2
0.3
0.4
0.5
0.6
0.7
0.8
0.9
1
Time (ps)
Inte
nsity (
a.u
.)
d)
b) a)
c)
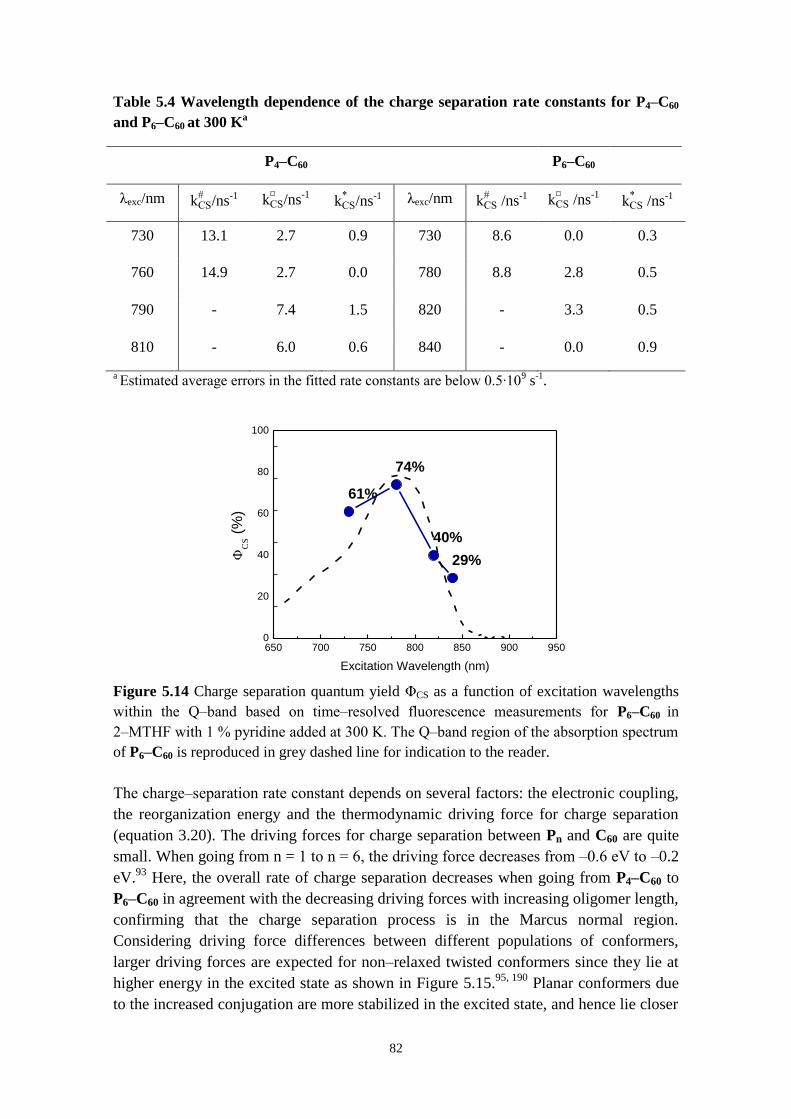
82
Table 5.4 Wavelength dependence of the charge separation rate constants for P4‒C60
and P6‒C60 at 300 Ka
P4‒C60 P6‒C60
λexc/nm kCS
/ns-1
/109 s
-1
kCS
/ns-1
/109 s
-1
kCS
/ns-1
/109 s
-1
λexc/nm kCS
/ns-1
/109 s
-1
kCS
/ns-1
/109 s
-1
kCS
/ns-1
/109 s
-1
730 13.1 2.7 0.9 730 8.6 0.0 0.3
760 14.9 2.7 0.0 780 8.8 2.8 0.5
790 - 7.4 1.5 820 - 3.3 0.5
810 - 6.0 0.6 840 - 0.0 0.9
a Estimated average errors in the fitted rate constants are below 0.5 10
9 s
-1.
Figure 5.14 Charge separation quantum yield ΦCS as a function of excitation wavelengths
within the Q‒band based on time‒resolved fluorescence measurements for P6‒C60 in
2‒MTHF with 1 % pyridine added at 300 K. The Q‒band region of the absorption spectrum
of P6‒C60 is reproduced in grey dashed line for indication to the reader.
The charge‒separation rate constant depends on several factors: the electronic coupling,
the reorganization energy and the thermodynamic driving force for charge separation
(equation 3.20). The driving forces for charge separation between Pn and C60 are quite
small. When going from n = 1 to n 6, the driving force decreases from ‒0.6 e to –0.2
eV.93
Here, the overall rate of charge separation decreases when going from P4‒C60 to
P6‒C60 in agreement with the decreasing driving forces with increasing oligomer length,
confirming that the charge separation process is in the Marcus normal region.
Considering driving force differences between different populations of conformers,
larger driving forces are expected for non‒relaxed twisted conformers since they lie at
higher energy in the excited state as shown in Figure 5.15.95, 190
Planar conformers due
to the increased conjugation are more stabilized in the excited state, and hence lie closer
650 700 750 800 850 900 9500
20
40
60
80
100
61%
74%
40%
29%
Excitation Wavelength (nm)
C
S (
%)
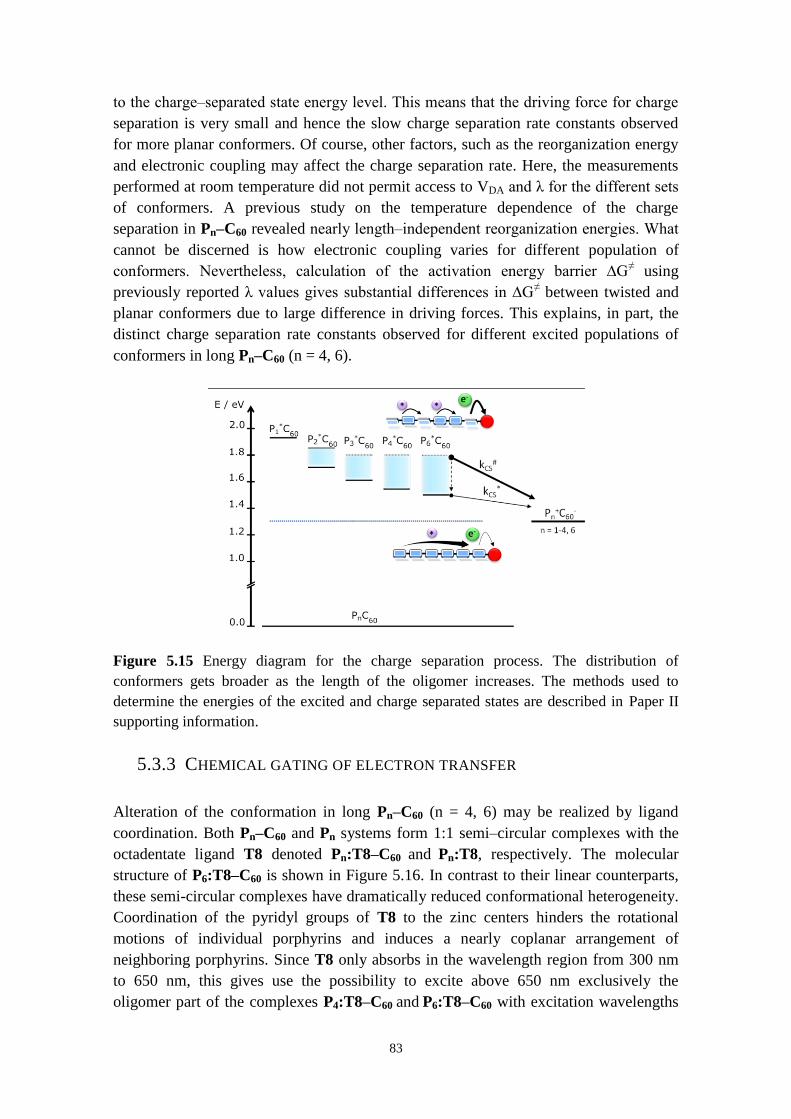
83
to the charge‒separated state energy level. This means that the driving force for charge
separation is very small and hence the slow charge separation rate constants observed
for more planar conformers. Of course, other factors, such as the reorganization energy
and electronic coupling may affect the charge separation rate. Here, the measurements
performed at room temperature did not permit access to VDA and λ for the different sets
of conformers. A previous study on the temperature dependence of the charge
separation in Pn‒C60 revealed nearly length‒independent reorganization energies. What
cannot be discerned is how electronic coupling varies for different population of
conformers. Nevertheless, calculation of the activation energy barrier ∆G≠ using
previously reported λ values gives substantial differences in ∆G≠ between twisted and
planar conformers due to large difference in driving forces. This explains, in part, the
distinct charge separation rate constants observed for different excited populations of
conformers in long Pn‒C60 (n = 4, 6).
Figure 5.15 Energy diagram for the charge separation process. The distribution of
conformers gets broader as the length of the oligomer increases. The methods used to
determine the energies of the excited and charge separated states are described in Paper II
supporting information.
5.3.3 CHEMICAL GATING OF ELECTRON TRANSFER
Alteration of the conformation in long Pn‒C60 (n = 4, 6) may be realized by ligand
coordination. Both Pn‒C60 and Pn systems form 1:1 semi‒circular complexes with the
octadentate ligand T8 denoted Pn:T8‒C60 and Pn:T8, respectively. The molecular
structure of P6:T8‒C60 is shown in Figure 5.16. In contrast to their linear counterparts,
these semi-circular complexes have dramatically reduced conformational heterogeneity.
Coordination of the pyridyl groups of T8 to the zinc centers hinders the rotational
motions of individual porphyrins and induces a nearly coplanar arrangement of
neighboring porphyrins. Since T8 only absorbs in the wavelength region from 300 nm
to 650 nm, this gives use the possibility to excite above 650 nm exclusively the
oligomer part of the complexes P4:T8‒C60 and P6:T8‒C60 with excitation wavelengths
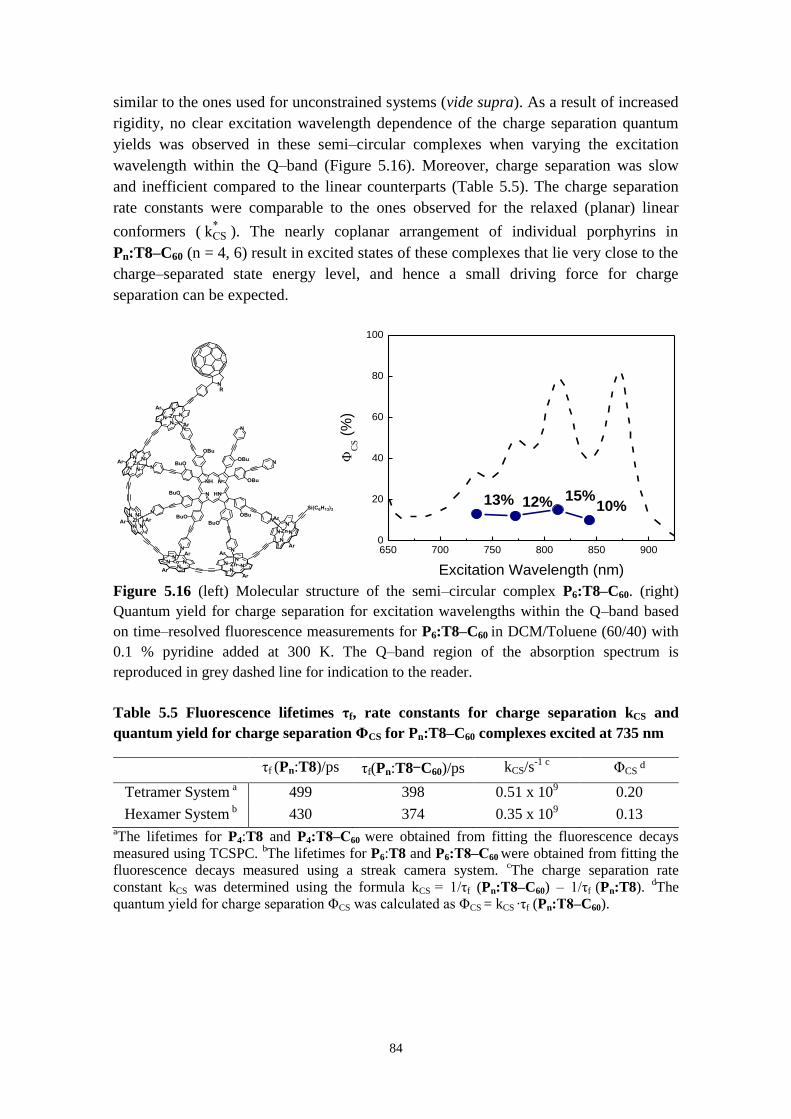
84
similar to the ones used for unconstrained systems (vide supra). As a result of increased
rigidity, no clear excitation wavelength dependence of the charge separation quantum
yields was observed in these semi‒circular complexes when varying the excitation
wavelength within the Q‒band (Figure 5.16). Moreover, charge separation was slow
and inefficient compared to the linear counterparts (Table 5.5). The charge separation
rate constants were comparable to the ones observed for the relaxed (planar) linear
conformers ( kCS
). The nearly coplanar arrangement of individual porphyrins in
Pn:T8‒C60 (n = 4, 6) result in excited states of these complexes that lie very close to the
charge‒separated state energy level, and hence a small driving force for charge
separation can be expected.
Figure 5.16 (left) Molecular structure of the semi‒circular complex P6:T8‒C60. (right)
Quantum yield for charge separation for excitation wavelengths within the Q‒band based
on time‒resolved fluorescence measurements for P6:T8‒C60 in DCM/Toluene (60/40) with
0.1 % pyridine added at 300 K. The Q‒band region of the absorption spectrum is
reproduced in grey dashed line for indication to the reader.
Table 5.5 Fluorescence lifetimes τf, rate constants for charge separation kCS and
quantum yield for charge separation ΦCS for Pn:T8‒C60 complexes excited at 735 nm
τf (Pn:T8)/ps τf(Pn:T8‒C60)/ps kCS/s-1 c ΦCS d
Tetramer System a 499 398 0.51 x 10⁹ 0.20
Hexamer System b 430 374 0.35 x 10⁹ 0.13 aThe lifetimes for P4:T8 and P4:T8‒ 60 were obtained from fitting the fluorescence decays
measured using TCSPC. bThe lifetimes for P6:T8 and P6:T8‒ 60 were obtained from fitting the
fluorescence decays measured using a streak camera system. cThe charge separation rate
constant kCS was determined using the formula kCS 1 τf (Pn:T8‒C60) – 1 τf (Pn:T8). dThe
quantum yield for charge separation ΦCS was calculated as ΦCS = kCS τf (Pn:T8‒C60).
650 700 750 800 850 9000
20
40
60
80
100
13% 12% 15%10%
C
S (
%)
Excitation Wavelength (nm)
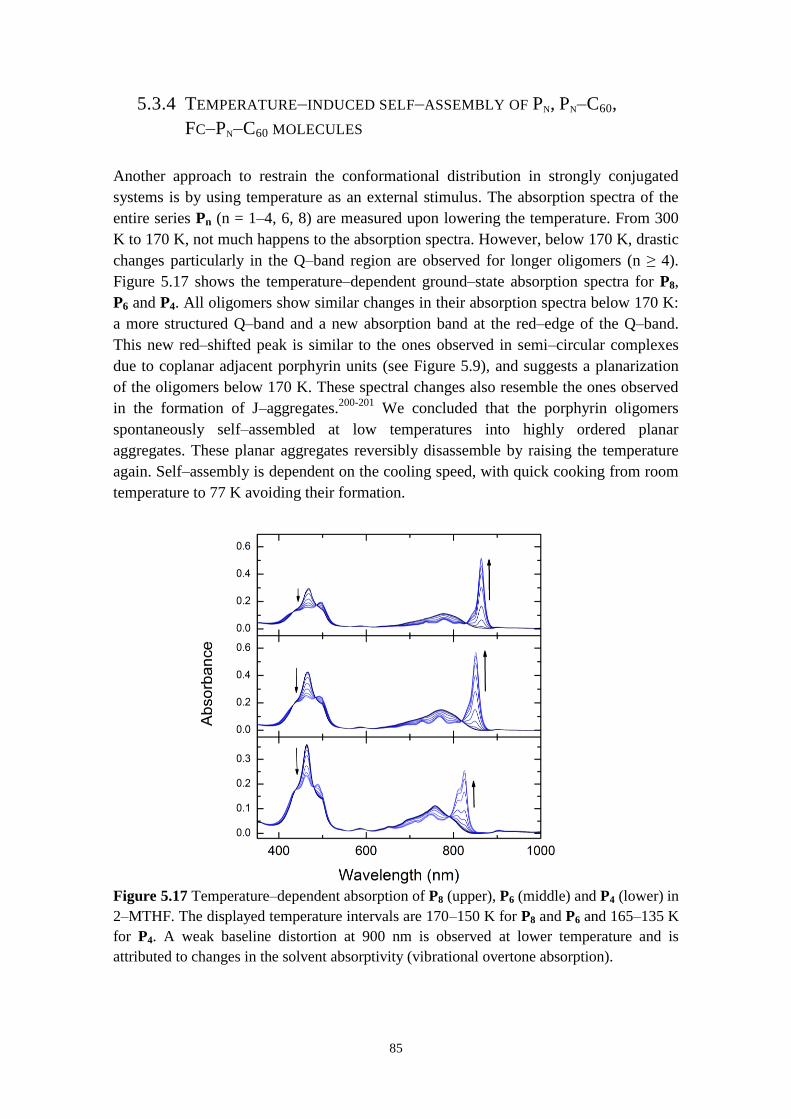
85
5.3.4 TEMPERATURE‒INDUCED SELF‒ASSEMBLY OF PN, PN‒C60,
FC‒PN‒C60 MOLECULES
Another approach to restrain the conformational distribution in strongly conjugated
systems is by using temperature as an external stimulus. The absorption spectra of the
entire series Pn (n = 1‒4, 6, 8) are measured upon lowering the temperature. From 300
K to 170 K, not much happens to the absorption spectra. However, below 170 K, drastic
changes particularly in the Q‒band region are observed for longer oligomers (n ≥ 4).
Figure 5.17 shows the temperature‒dependent ground‒state absorption spectra for P8,
P6 and P4. All oligomers show similar changes in their absorption spectra below 170 K:
a more structured Q‒band and a new absorption band at the red‒edge of the Q‒band.
This new red‒shifted peak is similar to the ones observed in semi‒circular complexes
due to coplanar adjacent porphyrin units (see Figure 5.9), and suggests a planarization
of the oligomers below 170 K. These spectral changes also resemble the ones observed
in the formation of J‒aggregates.200-201
We concluded that the porphyrin oligomers
spontaneously self‒assembled at low temperatures into highly ordered planar
aggregates. These planar aggregates reversibly disassemble by raising the temperature
again. Self‒assembly is dependent on the cooling speed, with quick cooking from room
temperature to 77 K avoiding their formation.
Figure 5.17 Temperature‒dependent absorption of P8 (upper), P6 (middle) and P4 (lower) in
2‒MTHF. The displayed temperature intervals are 170‒150 K for P8 and P6 and 165‒135 K
for P4. A weak baseline distortion at 900 nm is observed at lower temperature and is
attributed to changes in the solvent absorptivity (vibrational overtone absorption).
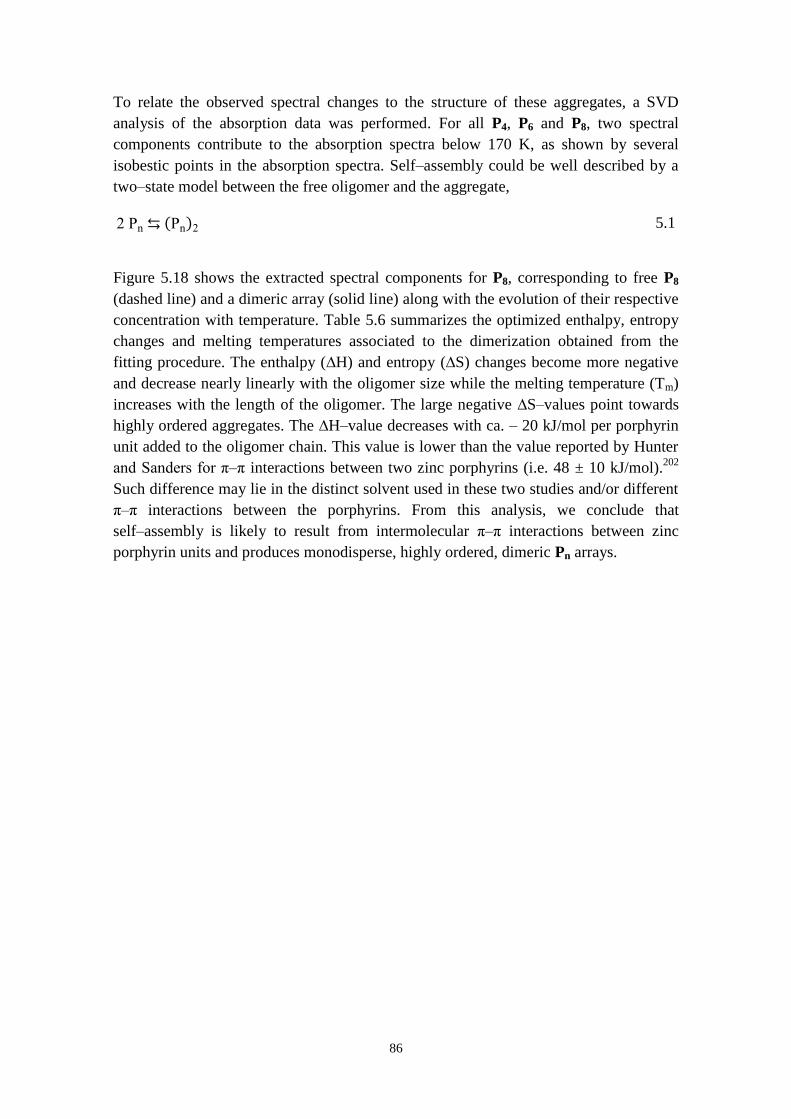
86
To relate the observed spectral changes to the structure of these aggregates, a SVD
analysis of the absorption data was performed. For all P4, P6 and P8, two spectral
components contribute to the absorption spectra below 170 K, as shown by several
isobestic points in the absorption spectra. Self‒assembly could be well described by a
two‒state model between the free oligomer and the aggregate,
2 Pn Pn 2 5.1
Figure 5.18 shows the extracted spectral components for P8, corresponding to free P8
(dashed line) and a dimeric array (solid line) along with the evolution of their respective
concentration with temperature. Table 5.6 summarizes the optimized enthalpy, entropy
changes and melting temperatures associated to the dimerization obtained from the
fitting procedure. The enthalpy (∆H) and entropy (∆S) changes become more negative
and decrease nearly linearly with the oligomer size while the melting temperature (Tm)
increases with the length of the oligomer. The large negative ∆S‒values point towards
highly ordered aggregates. The ∆H‒value decreases with ca. ‒ 20 kJ/mol per porphyrin
unit added to the oligomer chain. This value is lower than the value reported by Hunter
and Sanders for π‒π interactions between two zinc porphyrins (i.e. 48 ± 10 kJ/mol).202
Such difference may lie in the distinct solvent used in these two studies and/or different
π‒π interactions between the porphyrins. From this analysis, we conclude that
self‒assembly is likely to result from intermolecular π‒π interactions between zinc
porphyrin units and produces monodisperse, highly ordered, dimeric Pn arrays.
87
Figure 5.18 (Top) The two most significant spectral components extracted from SVD-
analysis of the P8 dimerization and (Bottom) the corresponding concentration profiles of the
monomer (squares) and the dimer (triangles). The spectral profiles and concentration
variations correspond to the optimized enthalpy (H) and entropy (S) values in Table 5.6.
The dimer concentration is displayed in units of P8 concentration.
Table 5.6 Optimized enthalpy and entropy changes of the porphyrin oligomer
dimerization and melting temperatures extracted from the fita
∆H (kJ/mol) ∆S (J/mol K) Tm (K)
Tetramer -86 -459 146
Hexamer -137 -749 158
Octamer -168 -906 163
aTm is the apparent melting temperatures where 50 % of the oligomers have formed aggregates.
The total oligomer concentration is 0.19 µM for P4, 0.48 µM for P6 and 0.29 µM for P8.
For supramolecular arrays in solution, small and wide angle X‒ray scattering often
enable to determine their structures, and hence establish direct structure-property
relationship. Here, the low temperature condition for formation of these aggregates
prevents us to use these tools to determine their structure and size. Instead, we
performed resonance light scattering, dynamic light scattering and steady‒state
fluorescence anisotropy measurements, that all showed virtually no change in signal
88
before and after aggregation. Hence, a rather small aggregate can be assumed from
these experiments. Another indication of small aggregates arises from the very similar
fluorescence rate constants in the free oligomer and the aggregate (see Table 5.7). Note
that these measurements are done at 163 K, i.e. a temperature at which both free
oligomer and aggregate are present in nearly identical concentrations (see Figure 5.18).
This suggests that the transition dipole moments in the free oligomer and the aggregate
are comparable in size. This can only be envisioned for a small stack of the oligomers.
This is further supported by formation of these aggregates in presence of a small
amount of pyridine (1 %) showing similar but red‒shifted absorption spectra. An
identical red‒shift of the absorption spectra is obtained when adding pyridine to a
solution of free oligomers as pyridine coordinates to the zinc atoms. If large stacks of
porphyrin oligomers form, only few peripheral zinc atoms will be accessible to
pyridine. This will give at most a minor red‒shift of their absorption spectra. Here, the
observed red‒shift is clearly non negligible with the strongest absorption peak in the
Q‒band red‒shifted by 12 nm, indicating that most zinc atoms in the stack are exposed
to pyridine.
Table 5.7 Fluorescence quantum yields (Φf) and lifetimes (τf) and radiative rate
constant (kf) of the free and aggregated porphyrin octamer measured at 163 K where
approximately half of the oligomers have converted to aggregates.
Compound Φfa τf(ps)b kf(ns-1)
Free octamer 10 % 930 0.107
Aggregate 7 % 575 0.122
aOptical density of the two species at the excitation wavelength was scaled with their
corresponding absorptivities and their individual emission spectra was obtained by subtracting
the contribution from the other species. The quantum yield of P6 in toluene was used as
reference.203
bThe sample was excited at 495 nm and the emission decay was measured at 800
nm and 867 nm for the free octamer and aggregates respectively.
Finally, the D‒A systems, Pn‒C60 and Fc‒Pn‒C60, absorption spectra undergo identical
changes to Pn below 170 K (see Paper III Figure 8). This indicates that low temperature
also favors their self‒assembly into highly ordered planar aggregates. The formation of
such aggregates for Pn‒C60 and Fc‒Pn‒C60 is at first quite surprising since the bulky C60
could impose significant steric hindrance to the stacking. Once more, we conclude that
only small stack of Fc‒Pn‒C60 or Pn‒C60 can accommodate such bulky group like C60.
We propose a dimeric Pn‒C60 array with a structure similar to the one sketched in
Figure 5.19.
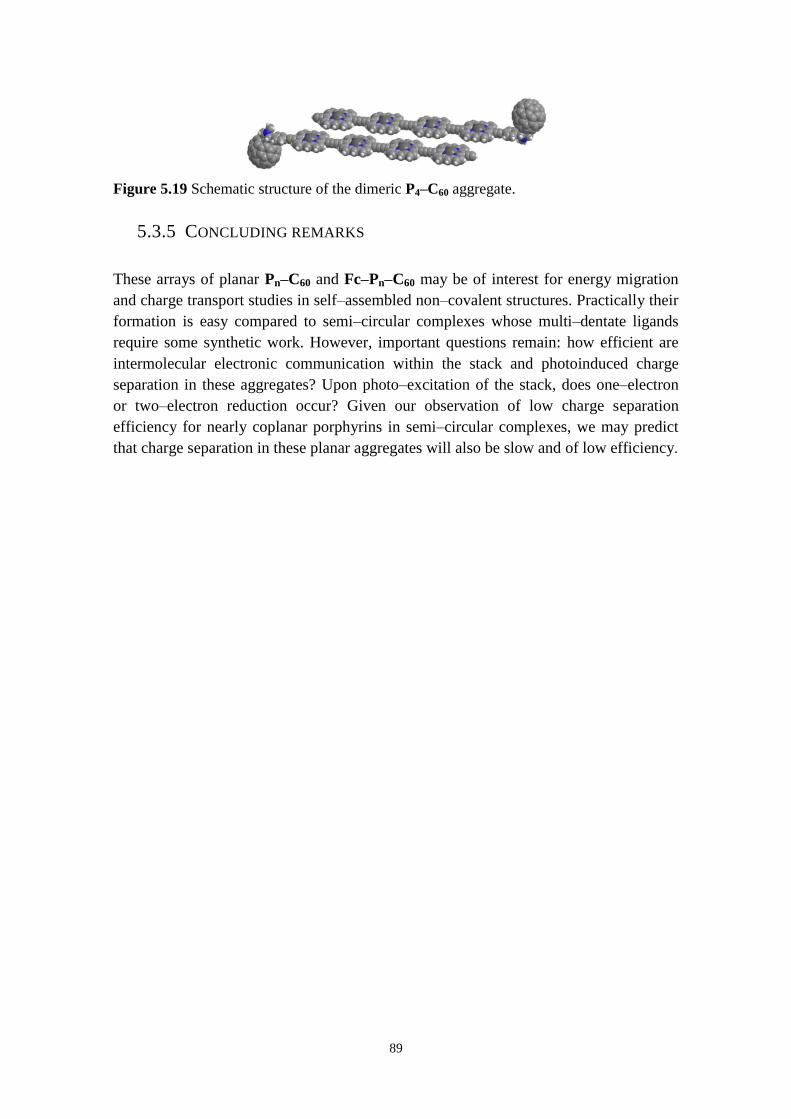
89
Figure 5.19 Schematic structure of the dimeric P4‒C60 aggregate.
5.3.5 CONCLUDING REMARKS
These arrays of planar Pn‒C60 and Fc‒Pn‒C60 may be of interest for energy migration
and charge transport studies in self‒assembled non‒covalent structures. Practically their
formation is easy compared to semi‒circular complexes whose multi‒dentate ligands
require some synthetic work. However, important questions remain: how efficient are
intermolecular electronic communication within the stack and photoinduced charge
separation in these aggregates? Upon photo‒excitation of the stack, does one‒electron
or two‒electron reduction occur? Given our observation of low charge separation
efficiency for nearly coplanar porphyrins in semi‒circular complexes, we may predict
that charge separation in these planar aggregates will also be slow and of low efficiency.

90
91
6 EXCITON ENERGY TRANSFER: A
COMPARISON BETWEEN WEAKLY AND
STRONGLY CONJUGATED
MULTICHROMOPHORE SYSTEMS
92
ommon theme in many areas ranging from nuclear physics to materials science to
biology is the transport of energy from one site to another with the question of
what govern its kinetics and efficiency. In the context of the natural photosynthesis, this
question may be reformulated as how energy is efficiently transferred from the initial
location of photon absorption to the reaction center. Even though the crystal structures
of some light harvesting complexes are now known,204-205
it remains difficult to predict
kinetics and overall efficiency of the energy transfer from the antenna to the reaction
center. Part of this challenge lies in the complexity of the natural light harvesting
complexes which involve many subsystems rendering in vivo energy transfer studies
difficult. Another difficulty is linked to a broad landscape of electronic couplings
between chromophores, from strong to weak, which arises from some chromophores in
the light harvesting complexes being very close to each other and other remaining far
away from each other. Consequently, excitation energy is not transferred from the
antenna to the reaction center via a single mechanism but via a combination of
short‒range and long‒range energy mechanisms (e.g. FRET, exciton coupling). Here,
two synthetic multichromophoric systems, i.e. anthracene dendrimers G1 and G2 and
the butadiyne‒linked zinc porphyrin oligomers Pn (n = 1‒4, 6, 8) previously introduced,
are used as simple model systems to investigate the influence of linker topology on the
inter‒chromophore communication and resulting excitation energy transfer (EET). Both
systems possess sufficient structural rigidity that enables spatial control of the relative
orientation and distance of neighboring chromophores. The results presented in this
chapter are from the original work in Papers IV‒V. This work attempted to bring some
answers to the following questions: to what extent does the linker topology influence the
inter‒chromophore communication? Do chromophores in the studied systems behave as
chromophores in the absence of the others or do they form a new chromophore with
distinct properties from the individual chromophoric components?
In the following sections, after introducing the anthracene dendrimers, we first examine
the influence that the linker topology has on the overall photophysical properties of
these multichromophoric systems using steady‒state absorption and emission,
fluorescence lifetimes. In the second part, we investigate excitation energy migration in
the anthracene dendrimers and the linear porphyrin oligomers using different
spectroscopic methods, fluorescence anisotropy and pump‒power dependent transient
absorption, respectively.
C
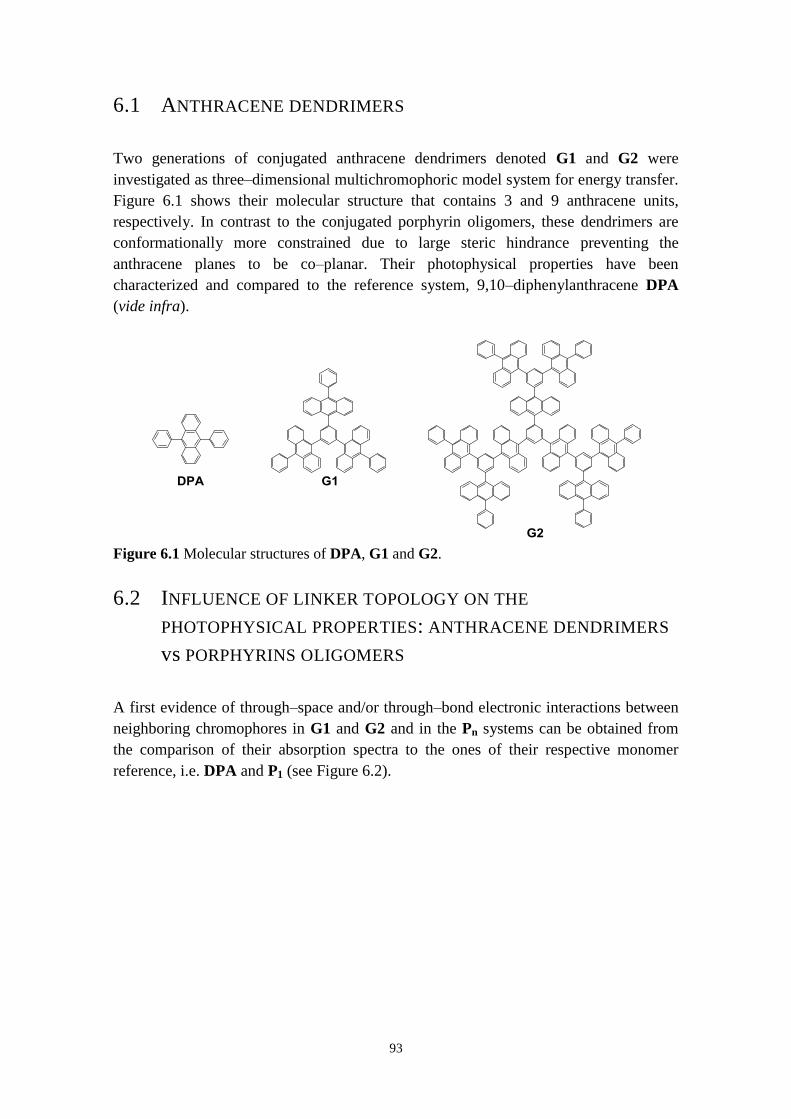
93
6.1 ANTHRACENE DENDRIMERS
Two generations of conjugated anthracene dendrimers denoted G1 and G2 were
investigated as three‒dimensional multichromophoric model system for energy transfer.
Figure 6.1 shows their molecular structure that contains 3 and 9 anthracene units,
respectively. In contrast to the conjugated porphyrin oligomers, these dendrimers are
conformationally more constrained due to large steric hindrance preventing the
anthracene planes to be co‒planar. Their photophysical properties have been
characterized and compared to the reference system, 9,10‒diphenylanthracene DPA
(vide infra).
Figure 6.1 Molecular structures of DPA, G1 and G2.
6.2 INFLUENCE OF LINKER TOPOLOGY ON THE
PHOTOPHYSICAL PROPERTIES: ANTHRACENE DENDRIMERS
vs PORPHYRINS OLIGOMERS
A first evidence of through‒space and/or through‒bond electronic interactions between
neighboring chromophores in G1 and G2 and in the Pn systems can be obtained from
the comparison of their absorption spectra to the ones of their respective monomer
reference, i.e. DPA and P1 (see Figure 6.2).
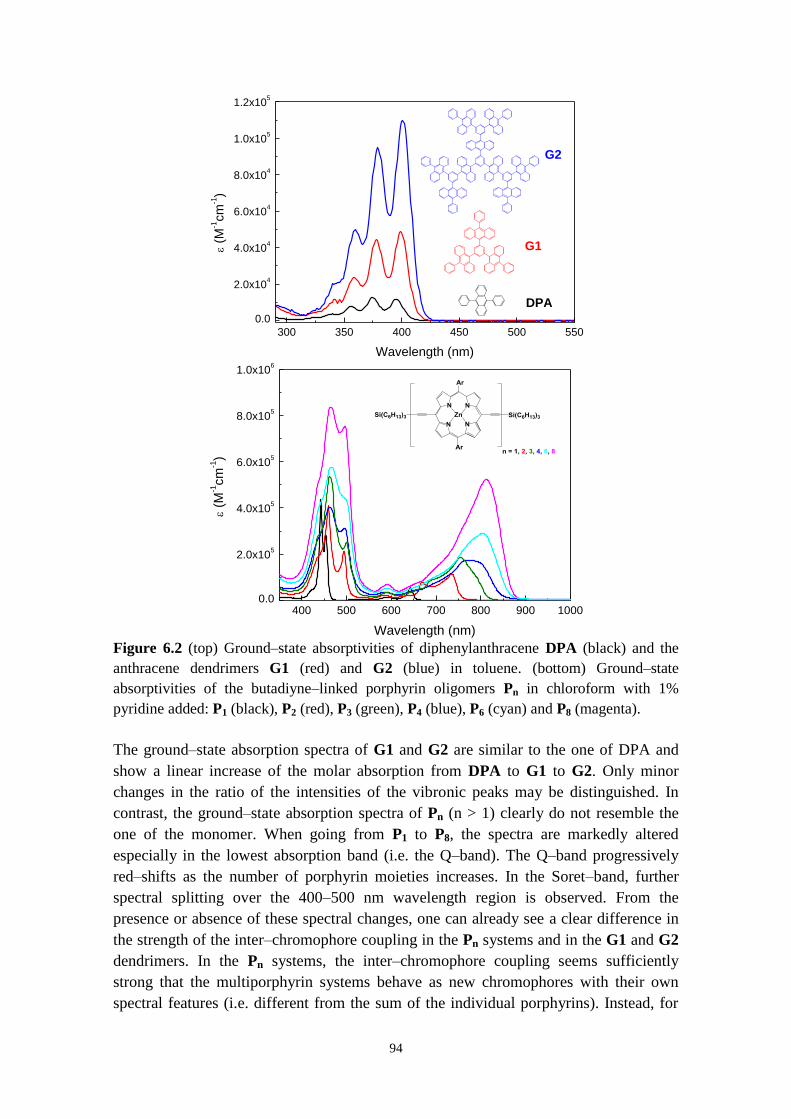
94
Figure 6.2 (top) Ground‒state absorptivities of diphenylanthracene DPA (black) and the
anthracene dendrimers G1 (red) and G2 (blue) in toluene. (bottom) Ground‒state
absorptivities of the butadiyne‒linked porphyrin oligomers Pn in chloroform with 1%
pyridine added: P1 (black), P2 (red), P3 (green), P4 (blue), P6 (cyan) and P8 (magenta).
The ground‒state absorption spectra of G1 and G2 are similar to the one of DPA and
show a linear increase of the molar absorption from DPA to G1 to G2. Only minor
changes in the ratio of the intensities of the vibronic peaks may be distinguished. In
contrast, the ground‒state absorption spectra of Pn (n > 1) clearly do not resemble the
one of the monomer. When going from P1 to P8, the spectra are markedly altered
especially in the lowest absorption band (i.e. the Q‒band). The Q‒band progressively
red‒shifts as the number of porphyrin moieties increases. In the Soret‒band, further
spectral splitting over the 400‒500 nm wavelength region is observed. From the
presence or absence of these spectral changes, one can already see a clear difference in
the strength of the inter‒chromophore coupling in the Pn systems and in the G1 and G2
dendrimers. In the Pn systems, the inter‒chromophore coupling seems sufficiently
strong that the multiporphyrin systems behave as new chromophores with their own
spectral features (i.e. different from the sum of the individual porphyrins). Instead, for
300 350 400 450 500 550
0.0
2.0x10⁴
4.0x10⁴
6.0x10⁴
8.0x10⁴
1.0x10⁵
1.2x10⁵
DPA
G1
(M
-1cm
-1)
Wavelength (nm)
G2
400 500 600 700 800 900 10000.0
2.0x10⁵
4.0x10⁵
6.0x10⁵
8.0x10⁵
1.0x10⁶
(M
-1cm
-1)
Wavelength (nm)
95
G1 and G2 dendrimers, their ground‒state absorption spectra are a simple addition of
the absorption spectra of the individual DPA moieties. To go further, it is useful to take
a closer look at the linkage topology in these two systems. In the case of G1 and G2, the
anthracene moieties are connected to each other using phenyl linkers. Due to steric
constraints with the anthracene groups, these phenyl linkers impose relatively large
dihedral angles between the DPA moieties.206
Such large dihedral angles disrupt the
π‒conjugation within the dendrimer structure. This results in a weak through‒bond
electronic coupling between the individual DPA moieties in G1 and G2, hence the
observed monomer‒like absorption spectra of G1 and G2. One may refer to them as
weakly conjugated multichromophoric systems. In contrast, the butadiyne‒linked
porphyrin oligomers, or at least the planar conformers, are strongly conjugated systems.
With the use of alkyne linkers such as butadiyne in Pn, the coplanar arrangement of
neighboring porphyrin macrocycles is possible and allows for significant π‒overlap
between neighboring porphyrins. The increased size of the conjugated system leads to a
gradual red‒shift of the Q‒band with the length of the oligomer as observed in Figure
6.2. Thus, the strong inter‒chromophore coupling in the Pn systems mainly arises in the
ground state from electronic delocalization. Note that as discussed in chapter 5, the
spectrally broad Q‒band observed for Pn (n ≥ 2) also arises from the use of butadiyne
linkers that allow for nearly barrierless rotation of individual porphyrin macrocycles in
and out of the plane at room temperature.
Another manifestation of electronic delocalization in multichromophoric systems is the
reduction of the HOMO‒LUMO gap with the increasing size of the system which can
be estimated from the experimental E0‒0 energy of the lowest electronic transition.111
For the porphyrin oligomers, E0‒0 decreases from 1.9 eV for P1 to 1.5 eV for P8 due
mainly to an enhanced stabilization of the excited state as the oligomers adopt on
average a more planar conformation than in the ground‒state.137-138
In contrast for the
dendrimers, minor changes in the E0‒0 values are observed indicating that electronic
delocalization in these systems is negligible: E0‒0 = 3.09 eV for DPA, E0‒0 = 3.06 eV for
G1 and E0‒0 = 3.04 eV for G2.
Thus, steady‒state absorption and emission reveal that the Pn systems already in the
ground state show signs of strong electronic coupling and behave as new chromophores,
while in the anthracene dendrimers G1 and G2, the spectroscopic individuality of the
monomeric units is retained. However, is it also the case in the excited state? To get a
partial answer, it is interesting to look at the radiative rate constants, kf, of the
dendrimers (see Table 6.1). When going from DPA to G1 to G2, kf increases quite
substantially, suggesting a more collective emission behavior of the DPA moieties, i.e.
exciton coupling within the dendrimer structure.207
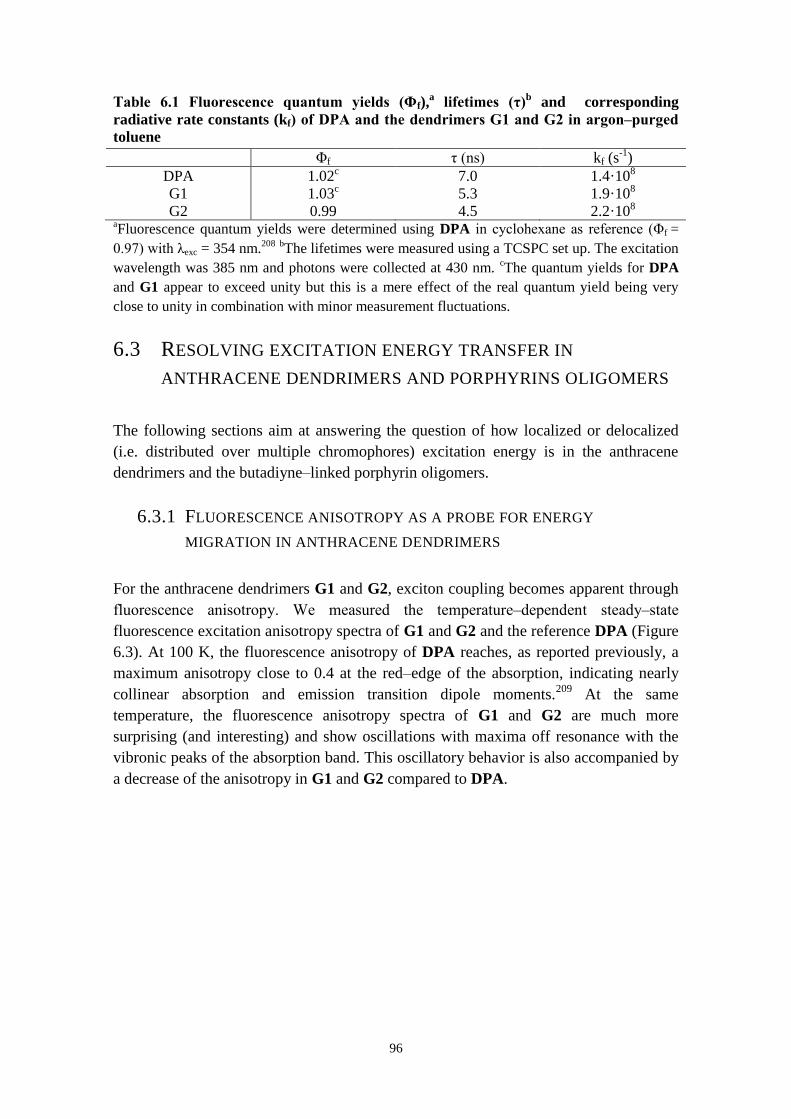
96
Table . Fluorescence quantum yields (Φf),a lifetimes (τ)b and corresponding
radiative rate constants (kf) of DPA and the dendrimers G and G2 in argon‒purged
toluene
Φf τ (ns) kf (s-1)
DPA 1.02c 7.0 1.4·108
G1 1.03c 5.3 1.9·108
G2 0.99 4.5 2.2·108 aFluorescence quantum yields were determined using DPA in cyclohexane as reference (Φf =
0. 7) with λexc = 354 nm.208
bThe lifetimes were measured using a TCSPC set up. The excitation
wavelength was 385 nm and photons were collected at 430 nm. cThe quantum yields for DPA
and G1 appear to exceed unity but this is a mere effect of the real quantum yield being very
close to unity in combination with minor measurement fluctuations.
6.3 RESOLVING EXCITATION ENERGY TRANSFER IN
ANTHRACENE DENDRIMERS AND PORPHYRINS OLIGOMERS
The following sections aim at answering the question of how localized or delocalized
(i.e. distributed over multiple chromophores) excitation energy is in the anthracene
dendrimers and the butadiyne‒linked porphyrin oligomers.
6.3.1 FLUORESCENCE ANISOTROPY AS A PROBE FOR ENERGY
MIGRATION IN ANTHRACENE DENDRIMERS
For the anthracene dendrimers G1 and G2, exciton coupling becomes apparent through
fluorescence anisotropy. We measured the temperature‒dependent steady‒state
fluorescence excitation anisotropy spectra of G1 and G2 and the reference DPA (Figure
6.3). At 100 K, the fluorescence anisotropy of DPA reaches, as reported previously, a
maximum anisotropy close to 0.4 at the red‒edge of the absorption, indicating nearly
collinear absorption and emission transition dipole moments.209
At the same
temperature, the fluorescence anisotropy spectra of G1 and G2 are much more
surprising (and interesting) and show oscillations with maxima off resonance with the
vibronic peaks of the absorption band. This oscillatory behavior is also accompanied by
a decrease of the anisotropy in G1 and G2 compared to DPA.
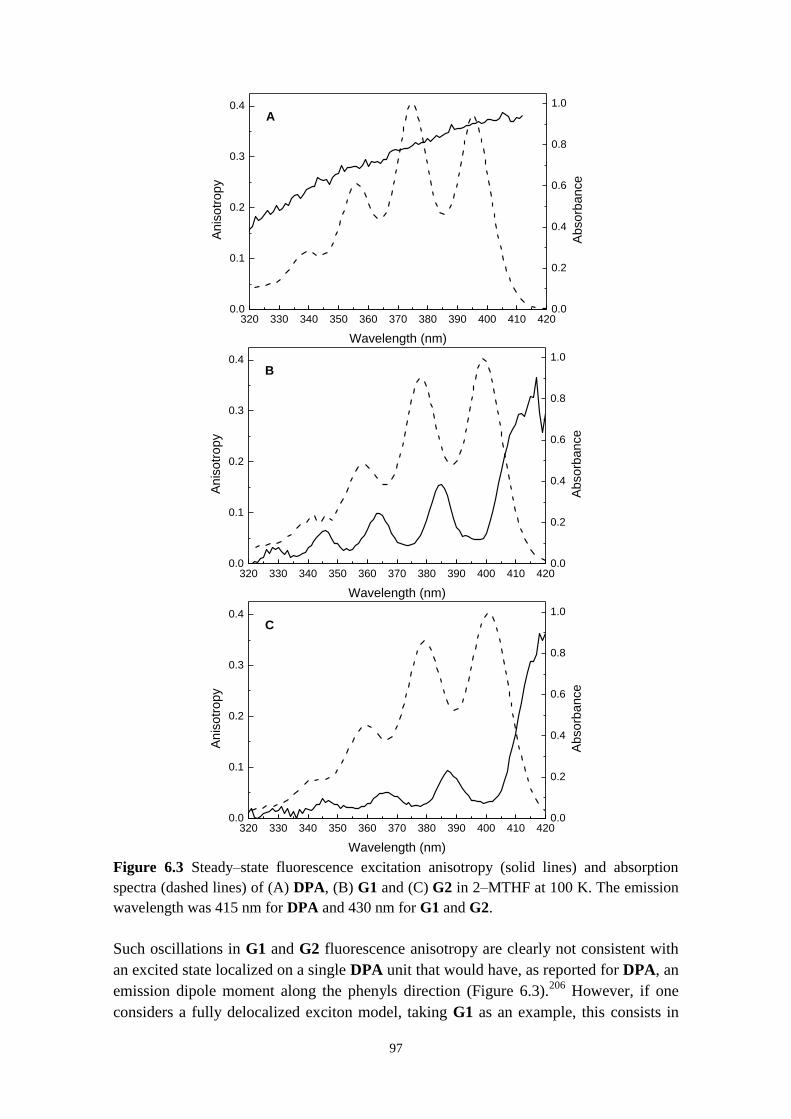
97
Figure 6.3 Steady‒state fluorescence excitation anisotropy (solid lines) and absorption
spectra (dashed lines) of (A) DPA, (B) G1 and (C) G2 in 2‒MTHF at 100 K. The emission
wavelength was 415 nm for DPA and 430 nm for G1 and G2.
Such oscillations in G1 and G2 fluorescence anisotropy are clearly not consistent with
an excited state localized on a single DPA unit that would have, as reported for DPA, an
emission dipole moment along the phenyls direction (Figure 6.3).206
However, if one
considers a fully delocalized exciton model, taking G1 as an example, this consists in
320 330 340 350 360 370 380 390 400 410 4200.0
0.1
0.2
0.3
0.4
An
iso
tro
py
Wavelength (nm)
A
0.0
0.2
0.4
0.6
0.8
1.0
Ab
so
rba
nce
320 330 340 350 360 370 380 390 400 410 4200.0
0.1
0.2
0.3
0.4
An
iso
tro
py
Wavelength (nm)
B
0.0
0.2
0.4
0.6
0.8
1.0
Ab
so
rba
nce
320 330 340 350 360 370 380 390 400 410 4200.0
0.1
0.2
0.3
0.4
An
iso
tro
py
Wavelength (nm)
C
0.0
0.2
0.4
0.6
0.8
1.0
A
bso
rba
nce
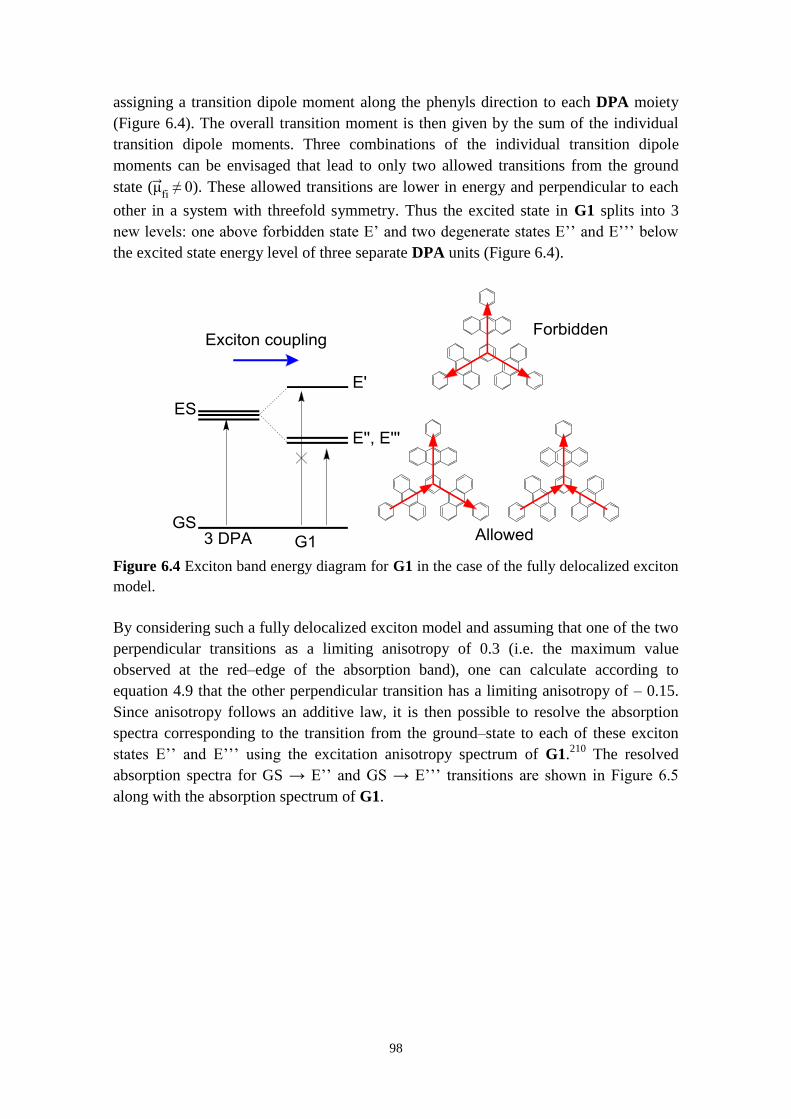
98
assigning a transition dipole moment along the phenyls direction to each DPA moiety
(Figure 6.4). The overall transition moment is then given by the sum of the individual
transition dipole moments. Three combinations of the individual transition dipole
moments can be envisaged that lead to only two allowed transitions from the ground
state (μ fi ≠ 0). These allowed transitions are lower in energy and perpendicular to each
other in a system with threefold symmetry. Thus the excited state in G1 splits into 3
new levels: one above forbidden state E’ and two degenerate states E’’ and E’’’ below
the excited state energy level of three separate DPA units (Figure 6.4).
Figure 6.4 Exciton band energy diagram for G1 in the case of the fully delocalized exciton
model.
By considering such a fully delocalized exciton model and assuming that one of the two
perpendicular transitions as a limiting anisotropy of 0.3 (i.e. the maximum value
observed at the red‒edge of the absorption band), one can calculate according to
equation 4.9 that the other perpendicular transition has a limiting anisotropy of ‒ 0.15.
Since anisotropy follows an additive law, it is then possible to resolve the absorption
spectra corresponding to the transition from the ground‒state to each of these exciton
states E’’ and E’’’ using the excitation anisotropy spectrum of G1.210
The resolved
absorption spectra for GS → E’’ and GS → E’’’ transitions are shown in Figure 6.5
along with the absorption spectrum of G1.
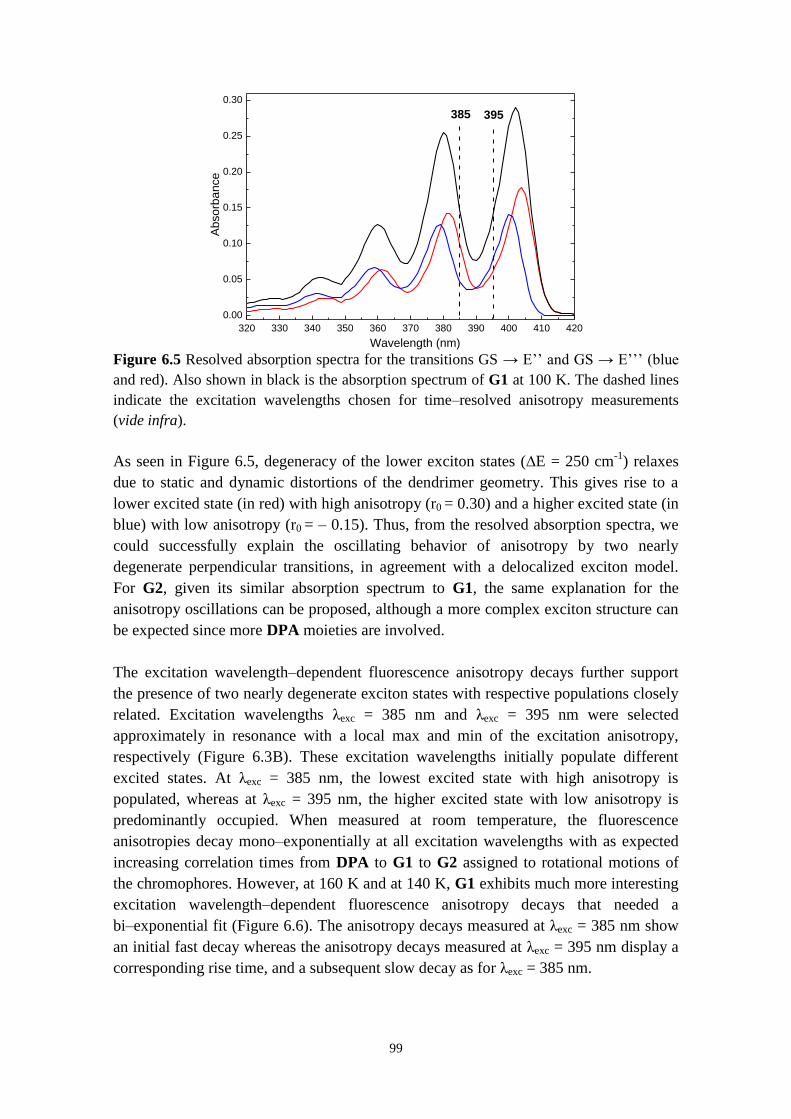
99
Figure 6.5 Resolved absorption spectra for the transitions GS → E’’ and GS → E’’’ (blue
and red). Also shown in black is the absorption spectrum of G1 at 100 K. The dashed lines
indicate the excitation wavelengths chosen for time‒resolved anisotropy measurements
(vide infra).
As seen in Figure 6.5, degeneracy of the lower exciton states (∆E = 250 cm-1
) relaxes
due to static and dynamic distortions of the dendrimer geometry. This gives rise to a
lower excited state (in red) with high anisotropy (r0 = 0.30) and a higher excited state (in
blue) with low anisotropy (r0 = ‒ 0.15). Thus, from the resolved absorption spectra, we
could successfully explain the oscillating behavior of anisotropy by two nearly
degenerate perpendicular transitions, in agreement with a delocalized exciton model.
For G2, given its similar absorption spectrum to G1, the same explanation for the
anisotropy oscillations can be proposed, although a more complex exciton structure can
be expected since more DPA moieties are involved.
The excitation wavelength‒dependent fluorescence anisotropy decays further support
the presence of two nearly degenerate exciton states with respective populations closely
related. Excitation wavelengths λexc = 385 nm and λexc = 395 nm were selected
approximately in resonance with a local max and min of the excitation anisotropy,
respectively (Figure 6.3B). These excitation wavelengths initially populate different
excited states. At λexc = 385 nm, the lowest excited state with high anisotropy is
populated, whereas at λexc = 395 nm, the higher excited state with low anisotropy is
predominantly occupied. When measured at room temperature, the fluorescence
anisotropies decay mono‒exponentially at all excitation wavelengths with as expected
increasing correlation times from DPA to G1 to G2 assigned to rotational motions of
the chromophores. However, at 160 K and at 140 K, G1 exhibits much more interesting
excitation wavelength‒dependent fluorescence anisotropy decays that needed a
bi‒exponential fit (Figure 6.6). The anisotropy decays measured at λexc = 385 nm show
an initial fast decay whereas the anisotropy decays measured at λexc = 395 nm display a
corresponding rise time, and a subsequent slow decay as for λexc = 385 nm.
320 330 340 350 360 370 380 390 400 410 420
0.00
0.05
0.10
0.15
0.20
0.25
0.30
395
Absorb
ance
Wavelength (nm)
385
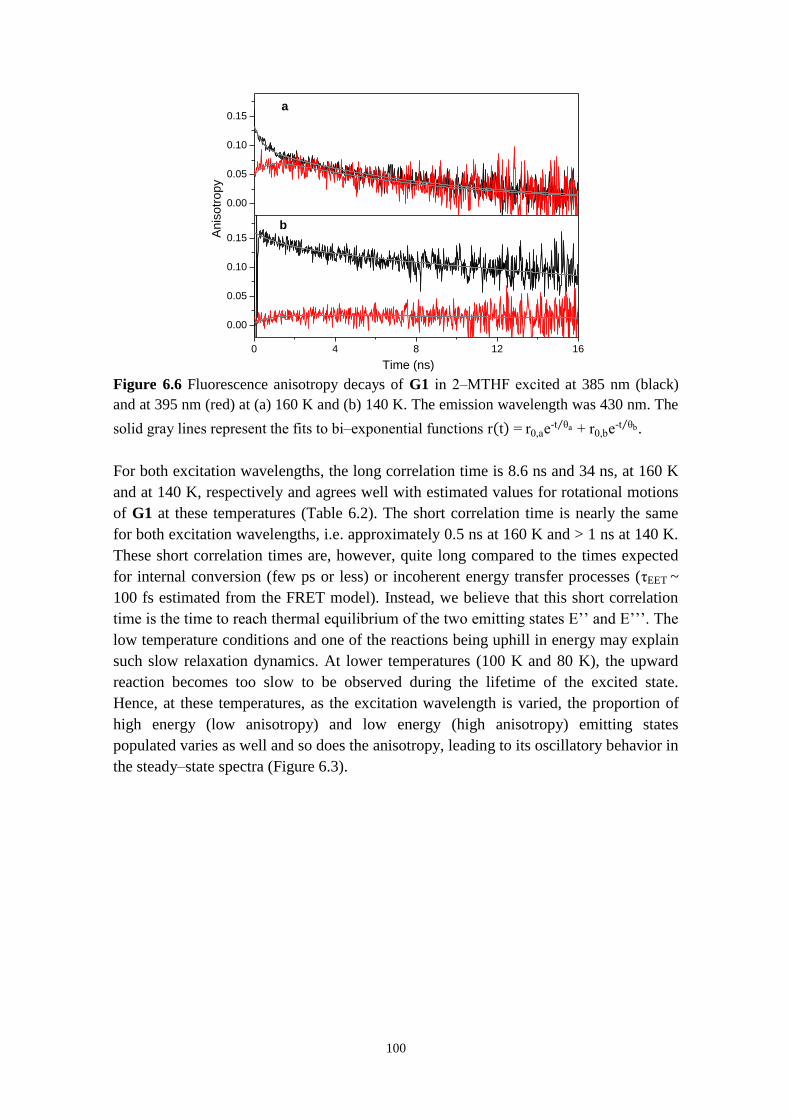
100
Figure 6.6 Fluorescence anisotropy decays of G1 in 2‒MTHF excited at 385 nm (black)
and at 395 nm (red) at (a) 160 K and (b) 140 K. The emission wavelength was 430 nm. The
solid gray lines represent the fits to bi‒exponential functions r t r0,ae-t a r0,be
-t b .
For both excitation wavelengths, the long correlation time is 8.6 ns and 34 ns, at 160 K
and at 140 K, respectively and agrees well with estimated values for rotational motions
of G1 at these temperatures (Table 6.2). The short correlation time is nearly the same
for both excitation wavelengths, i.e. approximately 0.5 ns at 160 K and > 1 ns at 140 K.
These short correlation times are, however, quite long compared to the times expected
for internal conversion (few ps or less) or incoherent energy transfer processes (τEET ~
100 fs estimated from the FRET model). Instead, we believe that this short correlation
time is the time to reach thermal equilibrium of the two emitting states E’’ and E’’’. The
low temperature conditions and one of the reactions being uphill in energy may explain
such slow relaxation dynamics. At lower temperatures (100 K and 80 K), the upward
reaction becomes too slow to be observed during the lifetime of the excited state.
Hence, at these temperatures, as the excitation wavelength is varied, the proportion of
high energy (low anisotropy) and low energy (high anisotropy) emitting states
populated varies as well and so does the anisotropy, leading to its oscillatory behavior in
the steady‒state spectra (Figure 6.3).
0.00
0.05
0.10
0.15
0 4 8 12 16
0.00
0.05
0.10
0.15
b
a
An
iso
tro
py
Time (ns)
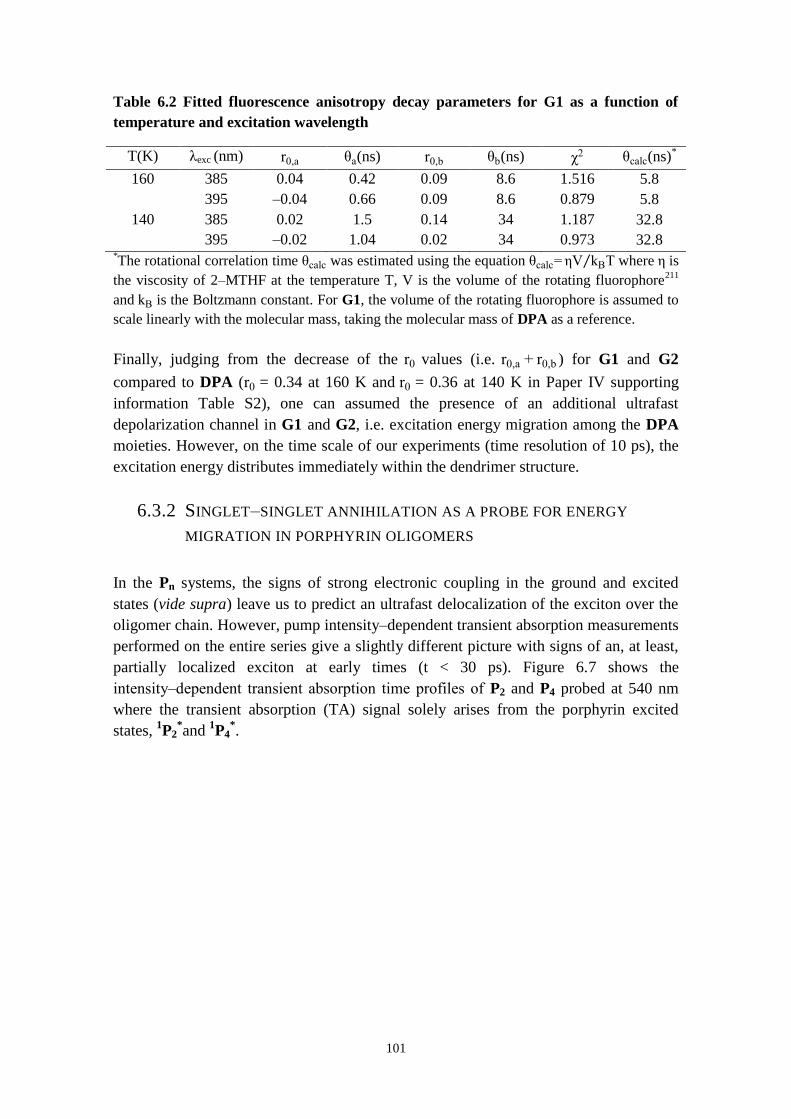
101
Table 6.2 Fitted fluorescence anisotropy decay parameters for G1 as a function of
temperature and excitation wavelength
T(K) λexc (nm) r0,a a(ns) r0,b b(ns) 2 calc(ns)*
160 385 0.04 0.42 0.09 8.6 1.516 5.8
395 ‒0.04 0.66 0.09 8.6 0.879 5.8
140 385 0.02 1.5 0.14 34 1.187 32.8
395 ‒0.02 1.04 0.02 34 0.973 32.8 *The rotational correlation time calc was estimated using the equation calc kBT where is
the viscosity of 2‒MTHF at the temperature T, V is the volume of the rotating fluorophore211
and kB is the Boltzmann constant. For G1, the volume of the rotating fluorophore is assumed to
scale linearly with the molecular mass, taking the molecular mass of DPA as a reference.
Finally, judging from the decrease of the r0 values (i.e. r0,a r0,b ) for G1 and G2
compared to DPA (r0 = 0.34 at 160 K and r0 = 0.36 at 140 K in Paper IV supporting
information Table S2), one can assumed the presence of an additional ultrafast
depolarization channel in G1 and G2, i.e. excitation energy migration among the DPA
moieties. However, on the time scale of our experiments (time resolution of 10 ps), the
excitation energy distributes immediately within the dendrimer structure.
6.3.2 SINGLET‒SINGLET ANNIHILATION AS A PROBE FOR ENERGY
MIGRATION IN PORPHYRIN OLIGOMERS
In the Pn systems, the signs of strong electronic coupling in the ground and excited
states (vide supra) leave us to predict an ultrafast delocalization of the exciton over the
oligomer chain. However, pump intensity‒dependent transient absorption measurements
performed on the entire series give a slightly different picture with signs of an, at least,
partially localized exciton at early times (t < 30 ps). Figure 6.7 shows the
intensity‒dependent transient absorption time profiles of P2 and P4 probed at 540 nm
where the transient absorption (TA) signal solely arises from the porphyrin excited
states, 1P2
*and
1P4
*.
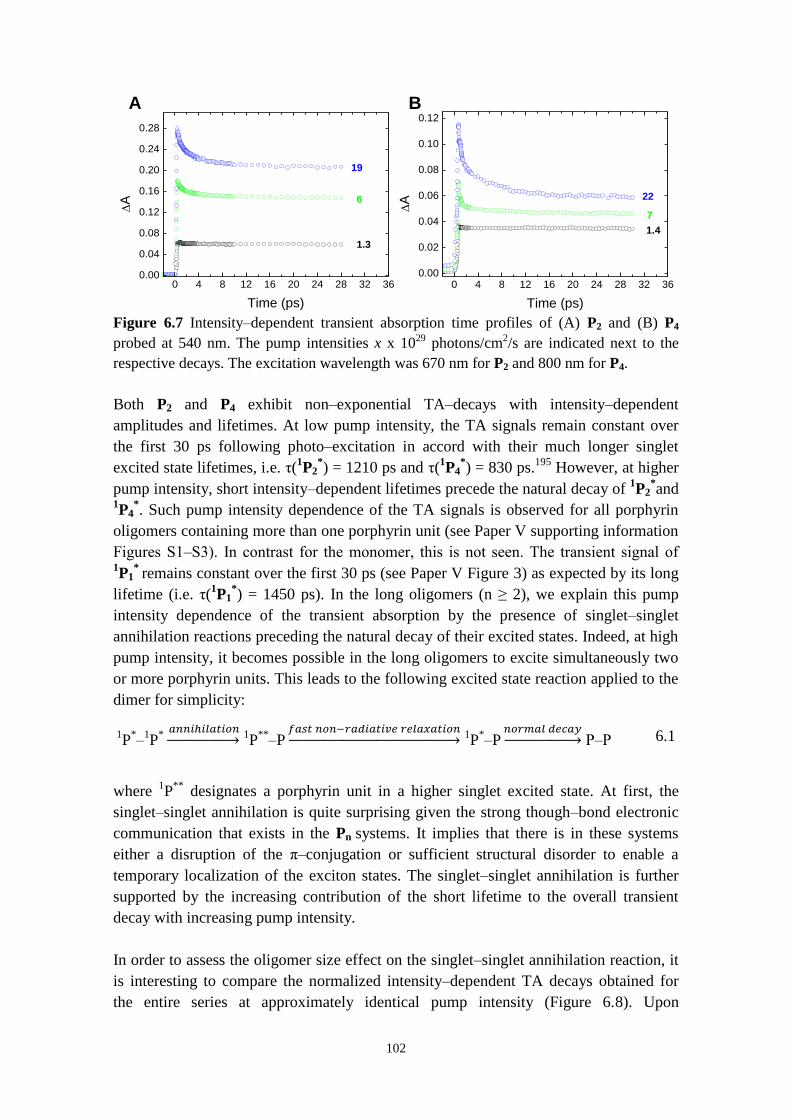
102
Figure 6.7 Intensity‒dependent transient absorption time profiles of (A) P2 and (B) P4
probed at 540 nm. The pump intensities x x 1029 photons/cm2/s are indicated next to the
respective decays. The excitation wavelength was 670 nm for P2 and 800 nm for P4.
Both P2 and P4 exhibit non‒exponential TA‒decays with intensity‒dependent
amplitudes and lifetimes. At low pump intensity, the TA signals remain constant over
the first 30 ps following photo‒excitation in accord with their much longer singlet
excited state lifetimes, i.e. τ(1P2
*) = 1210 ps and τ(
1P4
*) = 830 ps.
195 However, at higher
pump intensity, short intensity‒dependent lifetimes precede the natural decay of 1P2
*and
1P4
*. Such pump intensity dependence of the TA signals is observed for all porphyrin
oligomers containing more than one porphyrin unit (see Paper V supporting information
Figures S1‒S3). In contrast for the monomer, this is not seen. The transient signal of 1P1
* remains constant over the first 30 ps (see Paper V Figure 3) as expected by its long
lifetime (i.e. τ(1P1
*) = 1450 ps). In the long oligomers (n ≥ 2), we explain this pump
intensity dependence of the transient absorption by the presence of singlet‒singlet
annihilation reactions preceding the natural decay of their excited states. Indeed, at high
pump intensity, it becomes possible in the long oligomers to excite simultaneously two
or more porphyrin units. This leads to the following excited state reaction applied to the
dimer for simplicity:
1P
*‒
1P
*
1P
**‒P
1P
*‒P
P‒P 6.1
where 1P
** designates a porphyrin unit in a higher singlet excited state. At first, the
singlet‒singlet annihilation is quite surprising given the strong though‒bond electronic
communication that exists in the Pn systems. It implies that there is in these systems
either a disruption of the π‒conjugation or sufficient structural disorder to enable a
temporary localization of the exciton states. The singlet‒singlet annihilation is further
supported by the increasing contribution of the short lifetime to the overall transient
decay with increasing pump intensity.
In order to assess the oligomer size effect on the singlet‒singlet annihilation reaction, it
is interesting to compare the normalized intensity‒dependent TA decays obtained for
the entire series at approximately identical pump intensity (Figure 6.8). Upon
0 4 8 12 16 20 24 28 32 360.00
0.04
0.08
0.12
0.16
0.20
0.24
0.28
A
Time (ps)
19
6
1.3
A
0 4 8 12 16 20 24 28 32 360.00
0.02
0.04
0.06
0.08
0.10
0.12
B
A
Time (ps)
22
7
1.4
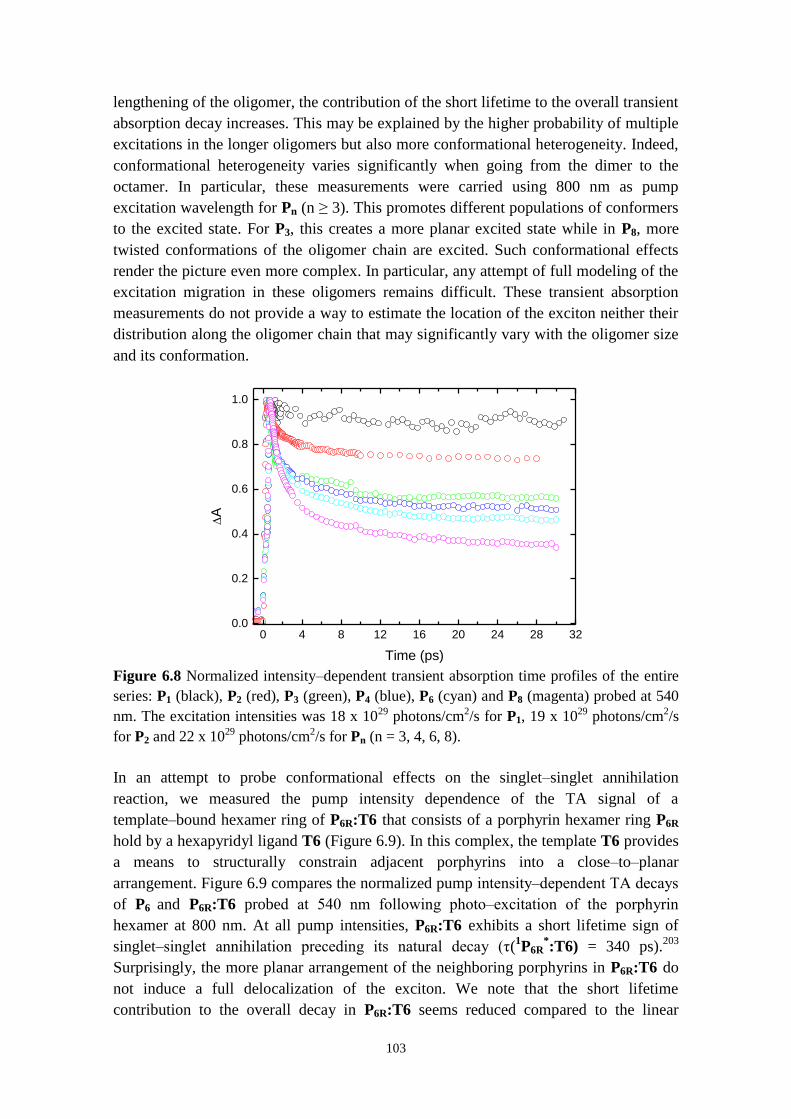
103
lengthening of the oligomer, the contribution of the short lifetime to the overall transient
absorption decay increases. This may be explained by the higher probability of multiple
excitations in the longer oligomers but also more conformational heterogeneity. Indeed,
conformational heterogeneity varies significantly when going from the dimer to the
octamer. In particular, these measurements were carried using 800 nm as pump
excitation wavelength for Pn (n ≥ 3). This promotes different populations of conformers
to the excited state. For P3, this creates a more planar excited state while in P8, more
twisted conformations of the oligomer chain are excited. Such conformational effects
render the picture even more complex. In particular, any attempt of full modeling of the
excitation migration in these oligomers remains difficult. These transient absorption
measurements do not provide a way to estimate the location of the exciton neither their
distribution along the oligomer chain that may significantly vary with the oligomer size
and its conformation.
Figure 6.8 Normalized intensity‒dependent transient absorption time profiles of the entire
series: P1 (black), P2 (red), P3 (green), P4 (blue), P6 (cyan) and P8 (magenta) probed at 540
nm. The excitation intensities was 18 x 1029 photons/cm2/s for P1, 19 x 1029 photons/cm2/s
for P2 and 22 x 1029 photons/cm2/s for Pn (n = 3, 4, 6, 8).
In an attempt to probe conformational effects on the singlet‒singlet annihilation
reaction, we measured the pump intensity dependence of the TA signal of a
template‒bound hexamer ring of P6R:T6 that consists of a porphyrin hexamer ring P6R
hold by a hexapyridyl ligand T6 (Figure 6.9). In this complex, the template T6 provides
a means to structurally constrain adjacent porphyrins into a close‒to‒planar
arrangement. Figure 6.9 compares the normalized pump intensity‒dependent TA decays
of P6 and P6R:T6 probed at 540 nm following photo‒excitation of the porphyrin
hexamer at 800 nm. At all pump intensities, P6R:T6 exhibits a short lifetime sign of
singlet‒singlet annihilation preceding its natural decay (τ(1P6R
*:T6) = 340 ps).
203
Surprisingly, the more planar arrangement of the neighboring porphyrins in P6R:T6 do
not induce a full delocalization of the exciton. We note that the short lifetime
contribution to the overall decay in P6R:T6 seems reduced compared to the linear
0 4 8 12 16 20 24 28 320.0
0.2
0.4
0.6
0.8
1.0
A
Time (ps)
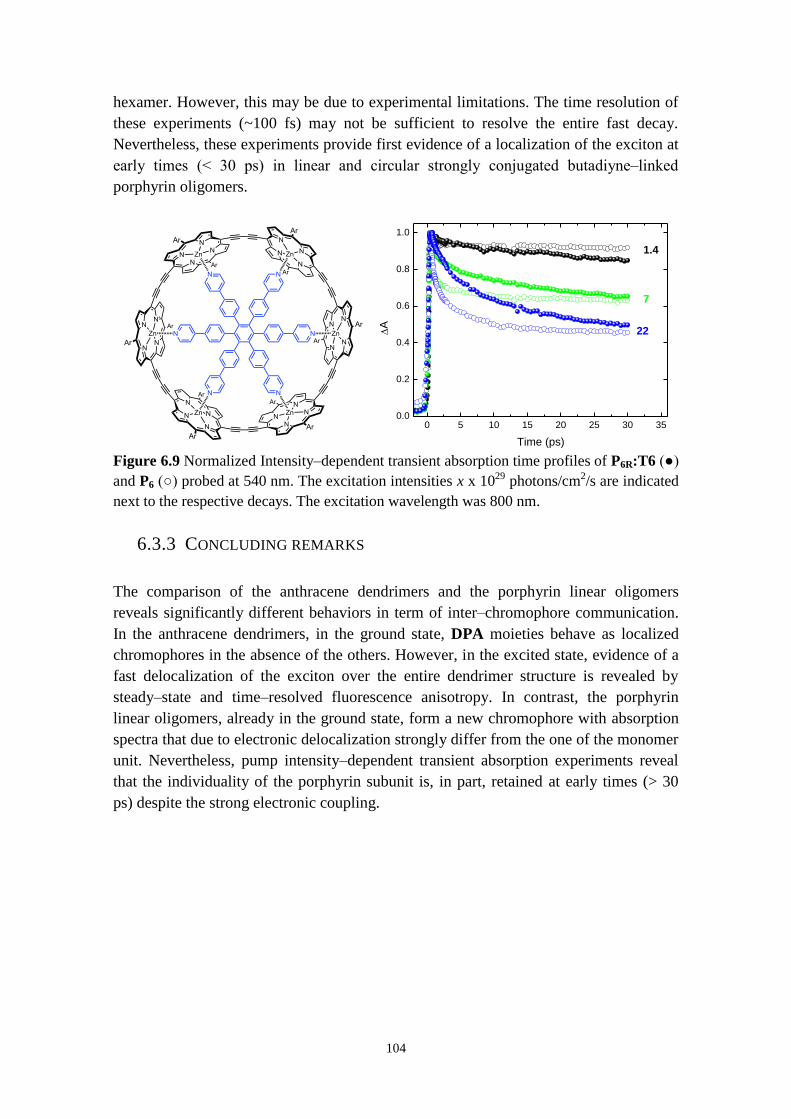
104
hexamer. However, this may be due to experimental limitations. The time resolution of
these experiments (~100 fs) may not be sufficient to resolve the entire fast decay.
Nevertheless, these experiments provide first evidence of a localization of the exciton at
early times (< 30 ps) in linear and circular strongly conjugated butadiyne‒linked
porphyrin oligomers.
Figure 6.9 Normalized Intensity‒dependent transient absorption time profiles of P6R:T6 (●)
and P6 (○) probed at 540 nm. The excitation intensities x x 1029 photons/cm2/s are indicated
next to the respective decays. The excitation wavelength was 800 nm.
6.3.3 CONCLUDING REMARKS
The comparison of the anthracene dendrimers and the porphyrin linear oligomers
reveals significantly different behaviors in term of inter‒chromophore communication.
In the anthracene dendrimers, in the ground state, DPA moieties behave as localized
chromophores in the absence of the others. However, in the excited state, evidence of a
fast delocalization of the exciton over the entire dendrimer structure is revealed by
steady‒state and time‒resolved fluorescence anisotropy. In contrast, the porphyrin
linear oligomers, already in the ground state, form a new chromophore with absorption
spectra that due to electronic delocalization strongly differ from the one of the monomer
unit. Nevertheless, pump intensity‒dependent transient absorption experiments reveal
that the individuality of the porphyrin subunit is, in part, retained at early times (> 30
ps) despite the strong electronic coupling.
0 5 10 15 20 25 30 350.0
0.2
0.4
0.6
0.8
1.0
A
Time (ps)
22
7
1.4

105
7 CONCLUSION
106
In this Thesis, the butadiyne‒linked zinc porphyrin oligomers Pn are versatile model
systems that can be used to investigate both photoinduced energy transfer and electron
transfer when incorporating in a donor‒acceptor couple.
In electron transfer studies (Chapter 5), appending to the Pn systems (n 1‒4, 6) a
ferrocene‒fullerene donor‒acceptor couple led to the formation of a series of
Fc‒Pn‒C60 D‒B‒A triads. In these triads, the formation and recombination of the
long‒range charge separated state Fc•+
‒Pn‒C60•- generated upon photoexcitation of the
porphyrin bridge was studied in detail. The temperature dependence of both its
formation and decay probed by combining time‒resolved fluorescence and transient
absorption experiments provided mechanistic details of the electron transfer in these
triads. In particular, we could relate the weakly distance‒dependent charge
recombination of Fc•+
‒Pn‒C60•- (β 0.028 Å
-1 at 300 K) to recombination to the ground
state via coherent electron tunneling for the entire series. However, at lower
temperature, the temperature dependence of the recombination rates revealed an unusual
switch in charge transport mechanism from coherent electron tunneling to incoherent
hopping in the long triads (n ≥ 2). Such crossover was evidenced by recombination rates
that strongly deviated from the Marcus description with a single set of parameters (∆G0,
λ, ) and was rationalized by the long lifetimes of the charge separated state that push
charge transport into the hopping regime. Overall, the implication of this work is that
there is not a single modus operandi by which wire‒like charge transport may be
achieved in highly conjugated systems. 87, 212
Another aspect investigated in detail is the influence that the conformation of the
photoexcited porphyrin oligomer has on the charge separation process in long dyads
Pn‒C60 (n = 4, 6). In contrast to the previous study, this study can be placed in a more
practical context where primary requirement is the control of signal transmission (here
electron transfer). By probing the excitation wavelength dependence of the charge
separation process in Pn‒C60 (n = 4, 6), we showed that exciting twisted conformations
led to significantly faster charge separation than excitation of the more planar
conformers. Such optical gating of the charge separation could be explained, in part, by
differences in driving forces. In addition, we showed that changing the geometry of the
porphyrin oligomer from a linear to a semi‒circular dyad by ligand coordination nearly
shut down the electron transfer between the porphyrin photoexcited state and the
fullerene, due to a considerably reduced driving force for charge separation in the
semi‒circular complexes. This result could be used to create a simple switch device. A
potential improvement could be the optical control of the assembly and disassembly of
these semi‒circular complexes using a photoactive ligand instead.47
We also
demonstrated that temperature could be a simple means to control the conformation of
the porphyrin systems. Lowering the temperature induced the reversible self‒assembly
of the Pn, Pn‒C60 and Fc‒Pn‒C60 systems into planar dimeric arrays. In these dimeric
systems, several questions arise that could be the subject of follow‒up studies: how
strong is the intermolecular communication between the monomers within the stack? Is
electron transfer in stack of Pn‒C60 as efficient as in the free Pn‒C60?
107
The last part of the Thesis (Chapter 6) has been focused on establishing the relationship
between the electronic structure and the photophysical properties in two
multichromophore systems: the Pn systems and the anthracene dendrimers G1 and G2.
In both systems, we demonstrated that the linker topology strongly influenced their
photophysical properties. In the anthracene dendrimers, collective analysis of their
steady‒state absorption and emission revealed an apparent conservation of the
individuality of the chromophores. However, excited state dynamics probed by steady-
state and time-resolved fluorescence anisotropy showed a rather different behavior of
the chromophores in the excited state. In the excited states, the anthracene dendrimers
can be viewed as single chromophores due to fast delocalization of the exciton within
the dendrimer structure. In contrast, in the Pn systems, pump intensity‒dependent
transient absorption measurements provided strong indication of singlet‒singlet
exciton‒exciton annihilation reactions in the multiporphyrin systems. This was
interpreted as a partial coupling of the porphyrin subunits in the excited state. In
addition, qualitative comparison of the pump intensity dependent transient decays of the
linear hexamer P6 and the template‒bound hexamer ring P6R:T6 suggested that the
backbone conformation of the oligomer chain influenced the rate and the occurrence of
the singlet‒singlet annihilation reaction. In the future, complementary experiments
could include fluorescence‒up conversion anisotropy or singlet‒singlet annihilation
measurements in the anthracene dendrimers to probe the early times (t < 10 ps)
following photon absorption while in the Pn systems, varying the pump wavelength at
which the pump intensity dependent transient absorption decay is measured could
provide more insights of the importance of conformation in the singlet‒singlet
annihilation reaction.

108

109
8 ACKNOWLEDGEMENTS

110
First of all, I would like to thank my supervisor Prof. Bo Albinsson. Thank you Bo!
Thank you for your scientific guidance and your support. Thank you for your trust when
I was working back home in Stockholm. Finally, I will never forget your favorite
expression to me “Don’t worry”, making me panicking at times but put things into
perspective at end.
I also want to thank Maria Abrahamsson my official co‒supervisor and friend. Thank
you for your tireless encouragement and always open door. I will not forget your
support and help after my little curling accident on my second PhD week. Thank you
for introducing me to your colleagues at Uppsala University. Next time, we should plan
a home‒made Indian‒French dinner.
I would also like to thank the past and present “laser” people for the help in the laser
labs: Joakim Kärnbratt, Jonas Hannestad, Joachim Hedberg, Damir Dzebo and Valeria
Saavedra. To the present people, keep it up running!!
This thesis is also the result of close collaborations with different groups. I want to
thank Harry Anderson and his group of organic chemists at Oxford University for
synthesizing all porphyrin‒based systems. Thanks to Karl Börjesson and Kasper
Moth‒Poulsen for the nice collaboration on the dendrimer project.
Thanks to my past and present officemates, Moa, Lena, Anke, Lulu, Tamas for the
friendly and open‒minded atmosphere in our office.
Special thanks to Anke for being a good friend, always there in bad and good times and
opened for discussions about everything and nothing.
Thanks to all people at floor 5 for the great atmosphere.
Finally I would like to thank my parents and my brothers for their encouragement and
support throughout the years. Big thanks to my husband, Hithesh, for often bringing me
back down Earth, for all lunch boxes, including special deliveries at KTH library. I
could not have made it without you. What is the next challenge?

111
9 REFERENCES
112
(1) Key World Energy Statistics; International Energy Agency: 2014.
(2) Hamblyn, R. The Art of Science: A natural history of ideas. Pan Macmillan:
2011.
(3) Arrhenius, S. On the Influence of Carbonic Acid in the Air upon the
Temperature of the Ground. Philos. Mag. 1896, 41, 237-276.
(4) Statement of Dr. James Hansen, Director, NASA Goddard Institute for Space
Studies. In Committee on Energy and Natural Resources, U.S. Senate, 100th
Congress, US Government Printing Office: Washington D.C., 1988; pp 39-41.
(5) Shabecoff, P. Global Warming Has Begun, Expert Tells Senate. New York Times
24th June 1988, 1988.
(6) Green, M. A.; Emery, K.; Hishikawa, Y.; Warta, W.; Dunlop, E. D. Solar cell
efficiency tables (Version 45). Prog. Photovoltaics Res. Appl. 2015, 23, 1-9.
(7) Hagfeldt, A.; Boschloo, G.; Sun, L.; Kloo, L.; Pettersson, H. Dye-Sensitized
Solar Cells. Chem. Rev. 2010, 110, 6595-6663.
(8) Kloo, L. On the early development of organic dyes for dye-sensitized solar cells.
Chem. Commun. 2013, 49, 6580-6583.
(9) Burschka, J.; Pellet, N.; Moon, S.-J.; Humphry-Baker, R.; Gao, P.; Nazeeruddin,
M. K.; Gratzel, M. Sequential deposition as a route to high-performance
perovskite-sensitized solar cells. Nature 2013, 499, 316-319.
(10) http://www.solarimpulse.com/ (accessed 17 March 2015).
(11) Barber, J. Photosynthetic energy conversion: natural and artificial. Chem. Soc.
Rev. 2009, 38, 185-196.
(12) Ciamician, G. The Photochemistry of the Future. Science 1912, 36, 385-394.
(13) Blankenship, R. E. Molecular mechanisms of photosynthesis. John Wiley &
Sons: 2013.
(14) van Grondelle, R.; Dekker, J. P.; Gillbro, T.; Sundstrom, V. Energy transfer and
trapping in photosynthesis. Biochimica et Biophysica Acta (BBA) -
Bioenergetics 1994, 1187, 1-65.
(15) Sundström, V.; Pullerits, T.; van Grondelle, R. Photosynthetic Light-
Harvesting: econciling Dynamics and Structure of Purple Bacterial LH2
Reveals Function of Photosynthetic Unit. J. Phys. Chem. B 1999, 103, 2327-
2346.
(16) Scholes, G. D.; Fleming, G. R.; Olaya-Castro, A.; van Grondelle, R. Lessons
from nature about solar light harvesting. Nature Chem. 2011, 3, 763-774.
113
(17) Concepcion, J. J.; Jurss, J. W.; Brennaman, M. K.; Hoertz, P. G.; Patrocinio, A.
O. T.; Murakami Iha, N. Y.; Templeton, J. L.; Meyer, T. J. Making Oxygen with
Ruthenium Complexes. Acc. Chem. Res. 2009, 42, 1954-1965.
(18) Archer, S.; Weinstein, J. A. Charge-separated excited states in platinum(II)
chromophores: Photophysics, formation, stabilization and utilization in solar
energy conversion. Coord. Chem. Rev. 2012, 256, 2530-2561.
(19) Magnuson, A.; Anderlund, M.; Johansson, O.; Lindblad, P.; Lomoth, R.;
Polivka, T.; Ott, S.; Stensjö, K.; Styring, S.; Sundström, V., et al. Biomimetic
and Microbial Approaches to Solar Fuel Generation. Acc. Chem. Res. 2009, 42,
1899-1909.
(20) Frischmann, P. D.; Mahata, K.; Wurthner, F. Powering the future of molecular
artificial photosynthesis with light-harvesting metallosupramolecular dye
assemblies. Chem. Soc. Rev. 2013, 42, 1847-1870.
(21) Gust, D.; Moore, T. A.; Moore, A. L. Realizing Artificial Photosynthesis.
Faraday Discuss. 2012, 155, 9-26.
(22) Guldi, D. M. Fullerene-porphyrin architectures; photosynthetic antenna and
reaction center models. Chem. Soc. Rev. 2002, 31, 22-36.
(23) Gust, D.; Moore, T. A.; Moore, A. L.; Lee, S.-J.; Bittersmann, E.; Luttrull, D.
K.; Rehms, A. A.; DeGraziano, J. M.; Ma, X. C.; Gao, F., et al. Efficient
Multistep Photoinitiated Electron Transfer in a Molecular Pentad. Science 1990,
248, 199-201.
(24) Imahori, H.; Sekiguchi, Y.; Kashiwagi, Y.; Sato, T.; Araki, Y.; Ito, O.; Yamada,
H.; Fukuzumi, S. Long-Lived Charge-Separated State Generated in a Ferrocene–
meso,meso-Linked Porphyrin Trimer–Fullerene Pentad with a High Quantum
Yield. Chem. Eur. J. 2004, 10, 3184-3196.
(25) Borgström, M.; Shaikh, N.; Johansson, O.; Anderlund, M. F.; Styring, S.;
Åkermark, B.; Magnuson, A.; Hammarström, L. Light induced manganese
oxidation and long-lived charge separation in a Mn-2(II,II)-Ru-II (bpy)(3)-
acceptor triad. J. Am. Chem. Soc. 2005, 127, 17504-17515.
(26) Berardi, S.; La Ganga, G.; Natali, M.; Bazzan, I.; Puntoriero, F.; Sartorel, A.;
Scandola, F.; Campagna, S.; Bonchio, M. Photocatalytic Water Oxidation:
Tuning Light-Induced Electron Transfer by Molecular Co4O4 Cores. J. Am.
Chem. Soc. 2012, 134, 11104-11107.
(27) Megiatto, J. D.; Antoniuk-Pablant, A.; Sherman, B. D.; Kodis, G.; Gervaldo, M.;
Moore, T. A.; Moore, A. L.; Gust, D. Mimicking the electron transfer chain in
photosystem II with a molecular triad thermodynamically capable of water
oxidation. Proc. Natl. Acad. Sci. U. S. A. 2012, 109, 15578-15583.
(28) de la Torre, G.; Giacalone, F.; Segura, J. L.; Martin, N.; Guldi, D. M. Electronic
Communication through pi-Conjugated Wires in Covalently Linked
Porphyrin/C-60 Ensembles. Chem. Eur. J. 2005, 11, 1267-1280.
114
(29) Kilså, K.; Kajanus, J.; Macpherson, A. N.; Mårtensson, J.; Albinsson, B. Bridge-
Dependent Electron Transfer in Porphyrin-Based Donor−Bridge−Acceptor
Systems. J. Am. Chem. Soc. 2001, 123, 3069-3080.
(30) Petersson, J.; Eklund, M.; Davidsson, J.; Hammarström, L. Variation of
Excitation Energy Influences the Product Distribution of a Two-Step Electron
Transfer: S2 vs S1 Electron Transfer in a Zn(II)porphyrin− iologen Complex.
J. Am. Chem. Soc. 2009, 131, 7940-7941.
(31) Fathalla, M.; Barnes, J. C.; Young, R. M.; Hartlieb, K. J.; Dyar, S. M.; Eaton, S.
W.; Sarjeant, A. A.; Co, D. T.; Wasielewski, M. R.; Stoddart, J. F. Photoinduced
Electron Transfer within a Zinc Porphyrin–Cyclobis(paraquat-p-phenylene)
Donor–Acceptor Dyad. Chem. Eur. J. 2014, 20, 14690-14697.
(32) Göransson, E.; Boixel, J.; Fortage, J.; Jacquemin, D.; Becker, H.-C.; Blart, E.;
Hammarström, L.; Odobel, F. Long-Range Electron Transfer in Zinc-
Phthalocyanine-Oligo(Phenylene-Ethynylene)-Based Donor-Bridge-Acceptor
Dyads. Inorg. Chem. 2012, 51, 11500-11512.
(33) Weiss, E. A.; Ahrens, M. J.; Sinks, L. E.; Gusev, A. V.; Ratner, M. A.;
Wasielewski, M. . Making a Molecular Wire: Charge and Spin Transport
through para-Phenylene Oligomers. J. Am. Chem. Soc. 2004, 126, 5577-5584.
(34) Goldsmith, R. H.; Sinks, L. E.; Kelley, R. F.; Betzen, L. J.; Liu, W. H.; Weiss,
E. A.; Ratner, M. A.; Wasielewski, M. R. Wire-Like Charge Transport at near
Constant Bridge Energy through Fluorene Oligomers. Proc. Natl. Acad. Sci. U.
S. A. 2005, 102, 3540-3545.
(35) Scattergood, P. A.; Delor, M.; Sazanovich, I. V.; Bouganov, O. V.; Tikhomirov,
S. A.; Stasheuski, A. S.; Parker, A. W.; Greetham, G. M.; Towrie, M.; Davies,
E. S., et al. Electron transfer dynamics and excited state branching in a charge-
transfer platinum(ii) donor-bridge-acceptor assembly. Dalton Trans. 2014, 43,
17677-17693.
(36) Sazanovich, I. V.; Best, J.; Scattergood, P. A.; Towrie, M.; Tikhomirov, S. A.;
Bouganov, O. V.; Meijer, A. J. H. M.; Weinstein, J. A. Ultrafast photoinduced
charge transport in Pt(ii) donor-acceptor assembly bearing naphthalimide
electron acceptor and phenothiazine electron donor. Phys. Chem. Chem. Phys.
2014, 16, 25775-25788.
(37) Hanss, D.; Walther, M. E.; Wenger, O. S. Importance of covalence,
conformational effects and tunneling-barrier heights for long-range electron
transfer: Insights from dyads with oligo-p-phenylene, oligo-p-xylene and oligo-
p-dimethoxybenzene bridges. Coord. Chem. Rev. 2010, 254, 2584-2592.
(38) Imahori, H.; Sakata, Y. Fullerenes as Novel Acceptors in Photosynthetic
Electron Transfer. Eur. J. Org. Chem. 1999, 1999, 2445-2457.
(39) Giacalone, F.; Segura, J. L.; Martín, N.; Guldi, D. M. Exceptionally Small
Attenuation Factors in Molecular Wires. J. Am. Chem. Soc. 2004, 126, 5340-
5341.
115
(40) Atienza, C.; Martin, N.; Wielopolski, M.; Haworth, N.; Clark, T.; Guldi, D. M.
Tuning electron transfer through p-phenyleneethynylene molecular wires. Chem.
Commun. 2006, 3202-3204.
(41) D'Souza, F.; Ito, O. Supramolecular donor-acceptor hybrids of
porphyrins/phthalocyanines with fullerenes/carbon nanotubes: electron transfer,
sensing, switching, and catalytic applications. Chem. Commun. 2009, 4913-
4928.
(42) Bandi, .; Das, S. K.; Awuah, S. G.; You, Y.; D’Souza, F. Thieno-Pyrrole-
Fused 4,4-Difluoro-4-bora-3a,4a-diaza-s-indacene–Fullerene Dyads: Utilization
of Near-Infrared Sensitizers for Ultrafast Charge Separation in Donor–Acceptor
Systems. J. Am. Chem. Soc. 2014, 136, 7571-7574.
(43) Wojcik, A.; Kamat, P. V. Reduced Graphene Oxide and Porphyrin. An
Interactive Affair in 2-D. ACS Nano 2010, 4, 6697-6706.
(44) Guldi, D. M.; Sgobba, V. Carbon nanostructures for solar energy conversion
schemes. Chem. Commun. 2011, 47, 606-610.
(45) Leary, E.; La Rosa, A.; Gonzalez, M. T.; Rubio-Bollinger, G.; Agrait, N.;
Martin, N. Incorporating single molecules into electrical circuits. The role of the
chemical anchoring group. Chem. Soc. Rev. 2015, 44, 920-942.
(46) Perrin, M. L.; Burzuri, E.; van der Zant, H. S. J. Single-molecule transistors.
Chem. Soc. Rev. 2015, 44, 902-919.
(47) Kärnbratt, J.; Hammarson, M.; Li, S.; Anderson, H. L.; Albinsson, B.;
Andréasson, J. Photochromic Supramolecular Memory With Nondestructive
Readout. Angew. Chem. Int. Ed. 2010, 49, 1854-1857.
(48) Franco, I.; George, C. B.; Solomon, G. C.; Schatz, G. C.; Ratner, M. A.
Mechanically Activated Molecular Switch through Single-Molecule Pulling. J.
Am. Chem. Soc. 2011, 133, 2242-2249.
(49) Aviram, A.; Ratner, M. A. Molecular rectifiers. Chem. Phys. Lett. 1974, 29, 277-
283.
(50) Ball, P. Chemistry Meets Computing. Nature 2000, 406, 118-120.
(51) Balzani, V.; Credi, A.; Venturi, M. Molecular Logic Circuits. ChemPhysChem
2003, 4, 49-59.
(52) Balzani, V. Photochemical molecular devices. Photochem. Photobiol. Sci. 2003,
2, 459-476.
(53) Cheng, Y.-C.; Fleming, G. R. Dynamics of Light Harvesting in Photosynthesis.
Annu. Rev. Phys. Chem. 2009, 60, 241-262.
(54) Tachibana, Y.; Vayssieres, L.; Durrant, J. R. Artificial photosynthesis for solar
water-splitting. Nature Photon. 2012, 6, 511-518.
116
(55) Björn, L.; Papageorgiou, G.; Blankenship, R.; Govindjee. A viewpoint: Why
chlorophyll a? Photosynth. Res. 2009, 99, 85-98.
(56) van Grondelle, R.; Novoderezhkin, V. I. Energy transfer in photosynthesis:
experimental insights and quantitative models. Phys. Chem. Chem. Phys. 2006,
8, 793-807.
(57) Novoderezhkin, V. I.; van Grondelle, R. Physical origins and models of energy
transfer in photosynthetic light-harvesting. Phys. Chem. Chem. Phys. 2010, 12,
7352-7365.
(58) Fassioli, F.; Olaya-Castro, A.; Scheuring, S.; Sturgis, J. N.; Johnson, N. F.
Energy Transfer in Light-Adapted Photosynthetic Membranes: From Active to
Saturated Photosynthesis. Biophys. J. 2009, 97, 2464-2473.
(59) Boekema, E. J.; Hankamer, B.; Bald, D.; Kruip, J.; Nield, J.; Boonstra, A. F.;
Barber, J.; Rögner, M. Supramolecular structure of the photosystem II complex
from green plants and cyanobacteria. Proc. Natl. Acad. Sci. U. S. A. 1995, 92,
175-179.
(60) Rhee, K. H.; Morris, E. P.; Barber, J.; Kuhlbrandt, W. Three-dimensional
structure of photosystem II reaction centre at 8 Å resolution. Nature 1998, 396,
283-286.
(61) Nield, J.; Kruse, O.; Ruprecht, J.; da Fonseca, P.; Büchel, C.; Barber, J. 3D
structure of chlamydomonas reinhardtii and synechococcus elongatus
photosystem II complexes allow for comparison of their OEC organisation. J.
Biol. Chem. 2000.
(62) Zouni, A.; Witt, H.-T.; Kern, J.; Fromme, P.; Krauss, N.; Saenger, W.; Orth, P.
Crystal structure of photosystem II from Synechococcus elongatus at 3.8 Å
resolution. Nature 2001, 409, 739-743.
(63) Kamiya, N.; Shen, J.-R. Crystal structure of oxygen-evolving photosystem II
from Thermosynechococcus vulcanus at 3.7 Å resolution. Proc. Natl. Acad. Sci.
U. S. A. 2003, 100, 98-103.
(64) Biesiadka, J.; Loll, B.; Kern, J.; Irrgang, K.-D.; Zouni, A. Crystal structure of
cyanobacterial photosystem II at 3.2 Å resolution: a closer look at the Mn-
cluster. Phys. Chem. Chem. Phys. 2004, 6, 4733-4736.
(65) Loll, B.; Kern, J.; Saenger, W.; Zouni, A.; Biesiadka, J. Towards complete
cofactor arrangement in the 3.0 Å resolution structure of photosystem II. Nature
2005, 438, 1040-1044.
(66) Guskov, A.; Kern, J.; Gabdulkhakov, A.; Broser, M.; Zouni, A.; Saenger, W.
Cyanobacterial photosystem II at 2.9 Å resolution and the role of quinones,
lipids, channels and chloride. Nat. Struct. Mol. Biol. 2009, 16, 334-342.
(67) Umena, Y.; Kawakami, K.; Shen, J.-R.; Kamiya, N. Crystal structure of oxygen-
evolving photosystem II at a resolution of 1.9 Å. Nature 2011, 473, 55-60.
117
(68) Macpherson, A. N.; Liddell, P. A.; Lin, S.; Noss, L.; Seely, G. R.; DeGraziano,
J. M.; Moore, A. L.; Moore, T. A.; Gust, D. Ultrafast Photoinduced Electron
Transfer in Rigid Porphyrin-Quinone Dyads. J. Am. Chem. Soc. 1995, 117,
7202-7212.
(69) Moore, T. A.; Gust, D.; Mathis, P.; Mialocq, J.-C.; Chachaty, C.; Bensasson, R.
V.; Land, E. J.; Doizi, D.; Liddell, P. A.; Lehman, W. R., et al. Photodriven
charge separation in a carotenoporphyrin-quinone triad. Nature 1984, 307, 630-
632.
(70) Sun, L. C.; Hammarström, L.; Åkermark, B.; Styring, S. Towards artificial
photosynthesis: ruthenium-manganese chemistry for energy production. Chem.
Soc. Rev. 2001, 30, 36-49.
(71) Abrahamsson, M.; Jäger, M.; Österman, T.; Eriksson, L.; Persson, P.; Becker,
H.-C.; ohansson, O.; Hammarström, L. A 3.0 μs oom Temperature Excited
State Lifetime of a Bistridentate uII−Polypyridine Complex for od-like
Molecular Arrays. J. Am. Chem. Soc. 2006, 128, 12616-12617.
(72) Fukuzumi, S.; Ohkubo, K.; Suenobu, T. Long-Lived Charge Separation and
Applications in Artificial Photosynthesis. Acc. Chem. Res. 2014, 47, 1455-1464.
(73) Kodis, G.; Terazono, Y.; Liddell, P. A.; Andréasson, J.; Garg, V.; Hambourger,
M.; Moore, T. A.; Moore, A. L.; Gust, D. Energy and Photoinduced Electron
Transfer in a Wheel-Shaped Artificial Photosynthetic Antenna-Reaction Center
Complex. J. Am. Chem. Soc. 2006, 128, 1818-1827.
(74) Terazono, Y.; Kodis, G.; Liddell, P. A.; Garg, V.; Moore, T. A.; Moore, A. L.;
Gust, D. Multiantenna Artificial Photosynthetic Reaction Center Complex. J.
Phys. Chem. B 2009, 113, 7147-7155.
(75) Wenger, O. S. Proton-Coupled Electron Transfer with Photoexcited Metal
Complexes. Acc. Chem. Res. 2013, 46, 1517-1526.
(76) Eisenhart, T. T.; Dempsey, J. L. Photo-induced Proton-Coupled Electron
Transfer Reactions of Acridine Orange: Comprehensive Spectral and Kinetics
Analysis. J. Am. Chem. Soc. 2014, 136, 12221-12224.
(77) Bourrez, M.; Steinmetz, R.; Ott, S.; Gloaguen, F.; Hammarström, L. Concerted
proton-coupled electron transfer from a metal-hydride complex. Nature Chem.
2015, 7, 140-145.
(78) Hammarström, L. Accumulative Charge Separation for Solar Fuels Production:
Coupling Light-Induced Single Electron Transfer to Multielectron Catalysis.
Acc. Chem. Res. 2015, 48, 840-850.
(79) Gilbert, M.; Albinsson, B. Photoinduced Charge and Energy Transfer in
Molecular Wires. Chem. Soc. Rev. 2015, 44, 845-862.
(80) Davis, W. B.; Svec, W. A.; Ratner, M. A.; Wasielewski, M. R. Molecular-Wire
Behaviour in p-Phenylenevinylene Oligomers. Nature 1998, 396, 60-63.
118
(81) Pettersson, K.; Wiberg, J.; Ljungdahl, T.; Mårtensson, J.; Albinsson, B.
Interplay between Barrier Width and Height in Electron Tunneling:
Photoinduced Electron Transfer in Porphyrin-Based Donor−Bridge−Acceptor
Systems. J. Phys. Chem. A 2005, 110, 319-326.
(82) Hanss, D.; Wenger, O. S. Tunneling Barrier Effects on Photoinduced Charge
Transfer through Covalent Rigid Rod-Like Bridges. Inorg. Chem. 2008, 48, 671-
680.
(83) Weiss, E. A.; Wasielewski, M. R.; Ratner, M. A. Molecules as wires: Molecule-
assisted movement of charge and energy. In Molecular Wires: From Design to
Properties, DeCola, L., Ed. Springer-Verlag Berlin: Berlin, 2005; Vol. 257, pp
103-133.
(84) Weiss, E. A.; Tauber, M. J.; Kelley, R. F.; Ahrens, M. J.; Ratner, M. A.;
Wasielewski, M. R. Conformationally gated switching between superexchange
and hopping within oligo-p-phenylene-based molecular wires. J. Am. Chem.
Soc. 2005, 127, 11842-11850.
(85) Miura, T.; Carmieli, R.; Wasielewski, M. R. Time-Resolved EPR Studies of
Charge Recombination and Triplet-State Formation within
Donor−Bridge−Acceptor Molecules Having Wire-Like Oligofluorene Bridges.
J. Phys. Chem. A 2010, 114, 5769-5778.
(86) Atienza-Castellanos, C.; Wielopolski, M.; Guldi, D. M.; van der Pol, C.; Bryce,
M. R.; Filippone, S.; Martin, N. Determination of the attenuation factor in
fluorene-based molecular wires. Chem. Commun. 2007, 5164-5166.
(87) Ricks, A. B.; Brown, K. E.; Wenninger, M.; Karlen, S. D.; Berlin, Y. A.; Co, D.
T.; Wasielewski, M. R. Exponential Distance Dependence of Photoinitiated
Stepwise Electron Transfer in Donor–Bridge–Acceptor Molecules: Implications
for Wirelike Behavior. J. Am. Chem. Soc. 2012, 134, 4581-4588.
(88) Pettersson, K.; Kilså, K.; Mårtensson, J.; Albinsson, B. Intersystem Crossing
versus Electron Transfer in Porphyrin-Based Donor−Bridge−Acceptor Systems:
Influence of a Paramagnetic Species. J. Am. Chem. Soc. 2004, 126, 6710-6719.
(89) Wiberg, J.; Guo, L.; Pettersson, K.; Nilsson, D.; Ljungdahl, T.; Mårtensson, J.;
Albinsson, B. Charge Recombination versus Charge Separation in
Donor−Bridge−Acceptor Systems. J. Am. Chem. Soc. 2006, 129, 155-163.
(90) Winters, M. U.; Pettersson, K.; Mårtensson, J.; Albinsson, B. Competition
between Superexchange-Mediated and Sequential Electron Transfer in a Bridged
Donor–Acceptor System. Chem. Eur. J. 2005, 11, 562-573.
(91) Hanss, D.; Wenger, O. S. Electron Tunneling through Oligo-p-xylene Bridges.
Inorg. Chem. 2008, 47, 9081-9084.
(92) Hanss, D.; Wenger, O. S. Conformational Effects on Long-Range Electron
Transfer: Comparison of Oligo-p-phenylene and Oligo-p-xylene Bridges. Eur. J.
Inorg. Chem. 2009, 2009, 3778-3790.
119
(93) Winters, M. U.; Dahlstedt, E.; Blades, H. E.; Wilson, C. J.; Frampton, M. J.;
Anderson, H. L.; Albinsson, B. Probing the Efficiency of Electron Transfer
through Porphyrin-Based Molecular Wires. J. Am. Chem. Soc. 2007, 129, 4291-
4297.
(94) Goldsmith, R. H.; DeLeon, O.; Wilson, T. M.; Finkelstein-Shapiro, D.; Ratner,
M. A.; Wasielewski, M. R. Challenges in Distinguishing Superexchange and
Hopping Mechanisms of Intramolecular Charge Transfer through Fluorene
Oligomers. J. Phys. Chem. A 2008, 112, 4410-4414.
(95) Winters, M. U.; Kärnbratt, J.; Blades, H. E.; Wilson, C. J.; Frampton, M. J.;
Anderson, H. L.; Albinsson, B. Control of Electron Transfer in a Conjugated
Porphyrin Dimer by Selective Excitation of Planar and Perpendicular
Conformers. Chem. Eur. J. 2007, 13, 7385-7394.
(96) Davis, W. B.; Ratner, M. A.; Wasielewski, M. R. Conformational Gating of
Long Distance Electron Transfer through Wire-like Bridges in
Donor−Bridge−Acceptor Molecules. J. Am. Chem. Soc. 2001, 123, 7877-7886.
(97) Walther, M. E.; Grilj, J.; Hanss, D.; Vauthey, E.; Wenger, O. S. Photoinduced
Processes in Fluorene-Bridged Rhenium–Phenothiazine Dyads – Comparison of
Electron Transfer Across Fluorene, Phenylene, and Xylene Bridges. Eur. J.
Inorg. Chem. 2010, 2010, 4843-4850.
(98) Indelli, M. T.; Chiorboli, C.; Flamigni, L.; De Cola, L.; Scandola, F.
Photoinduced Electron Transfer across Oligo-p-phenylene Bridges. Distance and
Conformational Effects in u(II)− h(III) Dyads. Inorg. Chem. 2007, 46, 5630-
5641.
(99) Welter, S.; Salluce, N.; Belser, P.; Groeneveld, M.; De Cola, L. Photoinduced
electronic energy transfer in modular, conjugated, dinuclear Ru(II)/Os(II)
complexes. Coord. Chem. Rev. 2005, 249, 1360-1371.
(100) Benniston, A. C.; Harriman, A.; Li, P.; Sams, C. A.; Ward, M. D. Orientational
Control of Electronic Coupling in Mixed-Valence, Binuclear
uthenium(II)−Bis(2,2‘:6‘,2‘ ‘-Terpyridine) Complexes. J. Am. Chem. Soc.
2004, 126, 13630-13631.
(101) Benniston, A. C.; Harriman, A.; Li, P.; Patel, P. V.; Sams, C. A. The effect of
torsion angle on the rate of intramolecular triplet energy transfer. Phys. Chem.
Chem. Phys. 2005, 7, 3677-3679.
(102) Eng, M. P.; Mårtensson, J.; Albinsson, B. Temperature Dependence of
Electronic Coupling through Oligo-p-phenyleneethynylene Bridges. Chem. Eur.
J. 2008, 14, 2819-2826.
(103) Eng, M. P.; Albinsson, B. The dependence of the electronic coupling on energy
gap and bridge conformation – Towards prediction of the distance dependence
of electron transfer reactions. Chem. Phys. 2009, 357, 132-139.
(104) Ahn, T. K.; Kim, K. S.; Kim, D. Y.; Noh, S. B.; Aratani, N.; Ikeda, C.; Osuka,
A.; Kim, D. Relationship between Two-Photon Absorption and the π-
120
Conjugation Pathway in Porphyrin Arrays through Dihedral Angle Control. J.
Am. Chem. Soc. 2006, 128, 1700-1704.
(105) Ahn, T. K.; Yoon, Z. S.; Hwang, I.-W.; Lim, J. K.; Rhee, H.; Joo, T.; Sim, E.;
Kim, S. K.; Aratani, N.; Osuka, A., et al. Effect of Conformational
Heterogeneity on Excitation Energy Transfer Efficiency in Directly meso−meso
Linked Zn(II) Porphyrin Arrays. J. Phys. Chem. B 2005, 109, 11223-11230.
(106) Eng, M. P.; Albinsson, B. Non-Exponential Distance Dependence of Bridge-
Mediated Electronic Coupling. Angew. Chem. Int. Ed. 2006, 118, 5754-5757.
(107) Eng, M. P.; Ljungdahl, T.; Mårtensson, J.; Albinsson, B. Triplet Excitation
Energy Transfer in Porphyrin-Based Donor−Bridge−Acceptor Systems with
Conjugated Bridges of arying Length: An Experimental and DFT Study. J.
Phys. Chem. B 2006, 110, 6483-6491.
(108) N. Taylor, P.; Huuskonen, J.; T. Aplin, R.; L. Anderson, H.; Rumbles, G.;
Williams, E. Conjugated porphyrin oligomers from monomer to hexamer. Chem.
Commun. 1998, 909-910.
(109) Hensel, V.; Schlüter, A. D. A Cyclotetraicosaphenylene. Chem. Eur. J. 1999, 5,
421-429.
(110) Aratani, N.; Takagi, A.; Yanagawa, Y.; Matsumoto, T.; Kawai, T.; Yoon, Z. S.;
Kim, D.; Osuka, A. Giant meso–meso-Linked Porphyrin Arrays of Micrometer
Molecular Length and Their Fabrication. Chem. Eur. J. 2005, 11, 3389-3404.
(111) Ikeda, T.; Aratani, N.; Osuka, A. Synthesis of Extremely π-Extended Porphyrin
Tapes from Hybrid meso-meso Linked Porphyrin Arrays: An Approach
Towards the Conjugation Length. Chem. Asian J. 2009, 4, 1248-1256.
(112) Kondratuk, D. V.; Perdigao, L. M. A.; O'Sullivan, M. C.; Svatek, S.; Smith, G.;
O'Shea, J. N.; Beton, P. H.; Anderson, H. L. Two Vernier-Templated Routes to a
24-Porphyrin Nanoring. Angew. Chem. Int. Ed. 2012, 51, 6696-6699.
(113) Liu, S.; Kondratuk, D. V.; Rousseaux, S. A. L.; Gil-Ramírez, G.; O'Sullivan, M.
C.; Cremers, J.; Claridge, T. D. W.; Anderson, H. L. Caterpillar Track
Complexes in Template-Directed Synthesis and Correlated Molecular Motion.
Angew. Chem. Int. Ed. 2015, 127, 5445-5449.
(114) Kim, D.; Osuka, A. Directly Linked Porphyrin Arrays with Tunable Excitonic
Interactions. Acc. Chem. Res. 2004, 37, 735-745.
(115) Lehn, J.-M. Toward Self-Organization and Complex Matter. Science 2002, 295,
2400-2403.
(116) Whitesides, G. M.; Grzybowski, B. Self-Assembly at All Scales. Science 2002,
295, 2418-2421.
(117) Shipman, L. L.; Cotton, T. M.; Norris, J. R.; Katz, J. J. New proposal for
structure of special-pair chlorophyll. Proc. Natl. Acad. Sci. U. S. A. 1976, 73,
1791-1794.
121
(118) Watson, J. D.; Crick, F. H. C. A Structure for Deoxyribose Nucleic Acid. Nature
1953, 171, 737-738.
(119) Wasielewski, M. R. Self-Assembly Strategies for Integrating Light Harvesting
and Charge Separation in Artificial Photosynthetic Systems. Acc. Chem. Res.
2009, 42, 1910-1921.
(120) Ahrens, M. J.; Sinks, L. E.; Rybtchinski, B.; Liu, W.; Jones, B. A.; Giaimo, J.
M.; Gusev, A. V.; Goshe, A. J.; Tiede, D. M.; Wasielewski, M. R. Self-
Assembly of Supramolecular Light-Harvesting Arrays from Covalent Multi-
Chromophore Perylene-3,4:9,10-bis(dicarboximide) Building Blocks. J. Am.
Chem. Soc. 2004, 126, 8284-8294.
(121) Rybtchinski, B.; Sinks, L. E.; Wasielewski, M. R. Combining Light-Harvesting
and Charge Separation in a Self-Assembled Artificial Photosynthetic System
Based on Perylenediimide Chromophores. J. Am. Chem. Soc. 2004, 126, 12268-
12269.
(122) Tanaka, T.; Osuka, A. Conjugated porphyrin arrays: synthesis, properties and
applications for functional materials. Chem. Soc. Rev. 2014.
(123) Nakamura, Y.; Aratani, N.; Osuka, A. Cyclic porphyrin arrays as artificial
photosynthetic antenna: synthesis and excitation energy transfer. Chem. Soc.
Rev. 2007, 36, 831-845.
(124) Hwang, I.-W.; Cho, H. S.; Jeong, D. H.; Kim, D.; Tsuda, A.; Nakamura, T.;
Osuka, A. Photophysical Properties of a Three-Dimensional Zinc(II) Porphyrin
Box. J. Phys. Chem. B 2003, 107, 9977-9988.
(125) Hwang, I.-W.; Kamada, T.; Ahn, T. K.; Ko, D. M.; Nakamura, T.; Tsuda, A.;
Osuka, A.; Kim, D. Porphyrin Boxes Constructed by Homochiral Self-Sorting
Assembly: Optical Separation, Exciton Coupling, and Efficient Excitation
Energy Migration. J. Am. Chem. Soc. 2004, 126, 16187-16198.
(126) Tsuda, A.; Hu, H.; Watanabe, .; Aida, T. π-Conjugated multiporphyrin box via
self-assembly of an ethynylene-bridged zinc porphyrin dimer. J. Porphyrins
Phthalocyanines 2003, 07, 388-393.
(127) Osuka, A.; Nakajima, S.; Maruyama, K.; Mataga, N.; Asahi, T.; Yamazaki, I.;
Nishimura, Y.; Ohno, T.; Nozaki, K. 1,2-Phenylene-bridged diporphyrin linked
with porphyrin monomer and pyromellitimide as a model for a photosynthetic
reaction center: synthesis and photoinduced charge separation. J. Am. Chem.
Soc. 1993, 115, 4577-4589.
(128) Wagner, R. W.; Lindsey, J. S. A molecular photonic wire. J. Am. Chem. Soc.
1994, 116, 9759-9760.
(129) Senge, M. O.; Gerzevske, K. R.; Vicente, M. G. H.; Forsyth, T. P.; Smith, K. M.
Models for the Photosynthetic Reaction Center—Synthesis and Structure of
Porphyrin Dimers with cis- and trans-Ethene and Skewed Hydroxymethylene
Bridges. Angew. Chem. Int. Ed. Engl. 1993, 32, 750-753.
122
(130) Lin, V.; DiMagno, S.; Therien, M. Highly conjugated, acetylenyl bridged
porphyrins: new models for light-harvesting antenna systems. Science 1994,
264, 1105-1111.
(131) Anderson, H. L.; Martin, S. J.; Bradley, D. D. C. Synthesis and Third-Order
Nonlinear Optical Properties of a Conjugated Porphyrin Polymer. Angew. Chem.
Int. Ed. Engl. 1994, 33, 655-657.
(132) Lin, V. S. Y.; Therien, M. J. The Role of Porphyrin-to-Porphyrin Linkage
Topology in the Extensive Modulation of the Absorptive and Emissive
Properties of a Series of Ethynyl- and Butadiynyl-Bridged Bis- and
Tris(porphinato)zinc Chromophores. Chem. Eur. J. 1995, 1, 645-651.
(133) Kim, D.; Osuka, A. Photophysical Properties of Directly Linked Linear
Porphyrin Arrays. J. Phys. Chem. A 2003, 107, 8791-8816.
(134) Kasha, M.; Rawls, H.; El-Bayoumi, M. A. The exciton model in molecular
spectroscopy. Pure Appl. Chem. 1965, 11, 371-392.
(135) Aratani, N.; Kim, D.; Osuka, A. Discrete Cyclic Porphyrin Arrays as Artificial
Light-Harvesting Antenna. Acc. Chem. Res. 2009, 42, 1922-1934.
(136) Holten, D.; Bocian, D. F.; Lindsey, J. S. Probing Electronic Communication in
Covalently Linked Multiporphyrin Arrays. A Guide to the Rational Design of
Molecular Photonic Devices. Acc. Chem. Res. 2001, 35, 57-69.
(137) Beljonne, D.; O’Keefe, G. E.; Hamer, P. .; Friend, . H.; Anderson, H. L.;
Brédas, J. L. Investigation of the linear and nonlinear optical response of edge-
linked conjugated zinc porphyrin oligomers by optical spectroscopy and
configuration interaction techniques. J. Chem. Phys. 1997, 106, 9439-9460.
(138) Anderson, H. L. Building Molecular Wires from the Colours of Life:
Conjugated Porphyrin Oligomers. Chem. Commun. 1999, 2323-2330.
(139) Tsuda, A.; Osuka, A. Fully Conjugated Porphyrin Tapes with Electronic
Absorption Bands That Reach into Infrared. Science 2001, 293, 79-82.
(140) Khoury, T.; Crossley, M. J. A strategy for the stepwise ring annulation of all
four pyrrolic rings of a porphyrin. Chem. Commun. 2007, 4851-4853.
(141) Pawlicki, M.; Morisue, M.; Davis, N. K. S.; McLean, D. G.; Haley, J. E.;
Beuerman, E.; Drobizhev, M.; Rebane, A.; Thompson, A. L.; Pascu, S. I., et al.
Engineering conjugation in para-phenylene-bridged porphyrin tapes. Chem. Sci.
2012, 3, 1541-1547.
(142) Susumu, K.; Frail, P. R.; Angiolillo, P. J.; Therien, M. J. Conjugated
Chromophore Arrays with Unusually Large Hole Polaron Delocalization
Lengths. J. Am. Chem. Soc. 2006, 128, 8380-8381.
(143) Sedghi, G.; Sawada, K.; Esdaile, L. J.; Hoffmann, M.; Anderson, H. L.; Bethell,
D.; Haiss, W.; Higgins, S. J.; Nichols, R. J. Single Molecule Conductance of
123
Porphyrin Wires with Ultralow Attenuation. J. Am. Chem. Soc. 2008, 130, 8582-
8583.
(144) Sedghi, G.; Garcia-Suarez, V. M.; Esdaile, L. J.; Anderson, H. L.; Lambert, C.
J.; Martin, S.; Bethell, D.; Higgins, S. J.; Elliott, M.; Bennett, N., et al. Long-
Range Electron Tunnelling in Oligo-Porphyrin Molecular Wires. Nature
Nanotech. 2011, 6, 517-523.
(145) Sedghi, G.; Esdaile, L. J.; Anderson, H. L.; Martin, S.; Bethell, D.; Higgins, S.
J.; Nichols, R. J. Comparison of the Conductance of Three Types of Porphyrin-
Based Molecular Wires: β,meso,β-Fused Tapes, meso-Butadiyne-Linked and
Twisted meso-meso Linked Oligomers. Adv. Mater. 2012, 24, 653-657.
(146) Li, Z.; Park, T.-H.; Rawson, J.; Therien, M. J.; Borguet, E. Quasi-Ohmic Single
Molecule Charge Transport through Highly Conjugated meso-to-meso Ethyne-
Bridged Porphyrin Wires. Nano Lett. 2012, 12, 2722-2727.
(147) Haiss, W.; van Zalinge, H.; Higgins, S. J.; Bethell, D.; Höbenreich, H.;
Schiffrin, D. J.; Nichols, R. J. Redox State Dependence of Single Molecule
Conductivity. J. Am. Chem. Soc. 2003, 125, 15294-15295.
(148) Haiss, W.; Nichols, R. J.; van Zalinge, H.; Higgins, S. J.; Bethell, D.; Schiffrin,
D. J. Measurement of single molecule conductivity using the spontaneous
formation of molecular wires. Phys. Chem. Chem. Phys. 2004, 6, 4330-4337.
(149) Solomon, G. C.; Andrews, D. Q.; Van Duyne, R. P.; Ratner, M. A. When Things
Are Not as They Seem: Quantum Interference Turns Molecular Electron
Transfer “ ules” pside Down. J. Am. Chem. Soc. 2008, 130, 7788-7789.
(150) Visions for a molecular future. Nature Nanotech. 2013, 8, 385-389.
(151) Hollas, J. M. Modern Spectroscopy. Fourth Edition. John Wiley and Sons:
Hoboken, NJ, 2004.
(152) Atkins, P.; De Paula, J.; Friedman, R. Quanta, matter, and change: a molecular
approach to physical chemistry. Oxford University Press: 2009.
(153) Balzani, V.; Ceroni, P.; Juris, A. Photochemistry and photophysics: concepts,
research, applications. John Wiley & Sons: 2014.
(154) Balzani, V. Electron transfer in chemistry. WILEY-VCH Verlag GmbH: 2001.
(155) McNaught, A. D.; Wilkinson, A. IUPAC. Compendium of Chemical
Terminology, 2nd ed. (the "Gold Book"). 2nd ed.; Blackwell Scientific
Publications: Oxford, 1997.
(156) Lakowicz, J. R. Principles of Fluorescence Spectroscopy. Third Edition.
Springer: New-York, NY, 2006.
(157) Kasha, M. Characterization of electronic transitions in complex molecules.
Farad. Discuss. 1950, 9, 14-19.
124
(158) Huppert, D.; ortner, .; entzepis, P. M. S2 → S1 emission of azulene in
solution. Chem. Phys. Lett. 1972, 13, 225-228.
(159) Kurabayashi, Y.; Kikuchi, K.; Kokubun, H.; Kaizu, Y.; Kobayashi, H. S2 → S0
fluorescence of some metallotetraphenylporphyrins. J. Phys. Chem. 1984, 88,
1308-1310.
(160) Kobayashi, N.; Lever, A. B. P. Cation or solvent-induced supermolecular
phthalocyanine formation: crown ether substituted phthalocyanines. J. Am.
Chem. Soc. 1987, 109, 7433-7441.
(161) Libby, W. F. Theory of Electron Exchange Reactions in Aqueous Solution. J.
Phys. Chem. 1952, 56, 863-868.
(162) Marcus, R. A. On the Theory of Oxidation-Reduction Reactions Involving
Electron Transfer. I. J. Chem. Phys. 1956, 24, 966-978.
(163) Marcus, R. A. On the Theory of Electron-Transfer Reactions. VI. Unified
Treatment for Homogeneous and Electrode Reactions. J. Chem. Phys. 1965, 43,
679-701.
(164) Marcus, R. A. Exchange reactions and electron transfer reactions including
isotopic exchange. Theory of oxidation-reduction reactions involving electron
transfer. Part 4.-A statistical-mechanical basis for treating contributions from
solvent, ligands, and inert salt. Farad. Discuss. 1960, 29, 21-31.
(165) Miller, J. R.; Calcaterra, L. T.; Closs, G. L. Intramolecular long-distance
electron transfer in radical anions. The effects of free energy and solvent on the
reaction rates. J. Am. Chem. Soc. 1984, 106, 3047-3049.
(166) Closs, G. L.; Miller, J. R. Intramolecular Long-Distance Electron Transfer in
Organic Molecules. Science 1988, 240, 440-447.
(167) Weller, A. Photoinduced Electron Transfer in Solution: Exciplex and Radical
Ion Pair Formation Free Enthalpies and their Solvent Dependence. Zeitschrift für
Physikalische Chemie 1982, 133, 93-98.
(168) Hilgendorff, M.; Sundström, V. Ultrafast electron injection and recombination
dynamics of dye sensitised TiO2 particles. Chem. Phys. Lett. 1998, 287, 709-
713.
(169) McConnell, H. M. Intramolecular Charge Transfer in Aromatic Free Radicals. J.
Chem. Phys. 1961, 35, 508-515.
(170) Anderson, P. W. New approach to the theory of superexchange interactions.
Phys. Rev. 1959, 115, 2-13.
(171) Halpern, J.; Orgel, L. E. The Theory of Electron Transfer between Metal Ions in
Bridged Systems. Discuss. Faraday Soc. 1960, 32-41.
125
(172) Berlin, Y. A.; Hutchison, G. R.; Rempala, P.; Ratner, M. A.; Michl, J. Charge
Hopping in Molecular Wires as a Sequence of Electron-Transfer Reactions. J.
Phys. Chem. A 2003, 107, 3970-3980.
(173) Berlin, Y. A.; Burin, A. L.; Ratner, M. A. Elementary steps for charge transport
in DNA: thermal activation vs. tunneling. Chem. Phys. 2002, 275, 61-74.
(174) Paulson, B. P.; Miller, J. R.; Gan, W. X.; Closs, G. Superexchange and
sequential mechanisms in charge transfer with a mediating state between the
donor and acceptor. J. Am. Chem. Soc. 2005, 127, 4860-4868.
(175) McConnell, H. Intramolecular Charge Transfer in Aromatic Free Radicals. J.
Chem. Phys. 1961, 35, 508-515.
(176) Paddon-Row, M. N.; Oliver, A. M.; Warman, J. M.; Smit, K. J.; De Haas, M. P.;
Oevering, H.; Verhoeven, J. W. Factors affecting charge separation and
recombination in photoexcited rigid donor-insulator-acceptor compounds. J.
Phys. Chem. 1988, 92, 6958-6962.
(177) Förster, T. Energiewanderung und Fluoreszenz. Naturwissenschaften 1946, 33,
166-175.
(178) Förster, T. Zwischenmolekulare Energiewanderung und Fluoreszenz. Annalen
der Physik 1948, 437, 55-75.
(179) Andrews, D. L.; Li, S.; Rodriguez, J.; Slota, J. Development of the energy flow
in light-harvesting dendrimers. J. Chem. Phys. 2007, 127, 134902.
(180) Dexter, D. L. A Theory of Sensitized Luminescence in Solids. J. Chem. Phys.
1953, 21, 836-850.
(181) de Grotthuss, C. J. T. Sur la décomposition de l'eau et des corps qu'elle tient en
dissolution à l'aide de l'électricité galvanique. Ann. Chim. 1806, 58, 54-73.
(182) Stokes, G. G. On the Change of Refrangibility of Light. Philosophical
Transactions of the Royal Society of London 1852, 142, 463-562.
(183) Strickler, S. J.; Berg, R. A. Relationship between Absorption Intensity and
Fluorescence Lifetime of Molecules. J. Chem. Phys. 1962, 37, 814-822.
(184) Kubista, M.; Sjoback, R.; Eriksson, S.; Albinsson, B. Experimental correction
for the inner-filter effect in fluorescence spectra. Analyst 1994, 119, 417-419.
(185) Moulton, P. Ti-doped Sapphire Tunable Solid State Laser. Opt. News 1982, 9.
(186) “for his studies of the transition states of chemical reactions using femtosecond
spectroscopy”,"The Nobel Prize in Chemistry 1 ".
http://www.nobelprize.org/nobel_prizes/chemistry/laureates/1999 (accessed 25
March 2015).
(187) Silfvast, W. T. Laser Fundamentals. 2nd ed.; Cambridge University Press: 2008.
126
(188) Komura, M.; Itoh, S. Fluorescence measurement by a streak camera in a single-
photon-counting mode. Photosynth. Res. 2009, 101, 119-133.
(189) Brocklehurst, B.; Young, R. N. Fluorescence anisotropy decays and viscous
behaviour of 2-methyltetrahydrofuran. J. Chem. Soc., Faraday Trans. 1994, 90,
271-278.
(190) Winters, M. U.; Kärnbratt, J.; Eng, M.; Wilson, C. J.; Anderson, H. L.;
Albinsson, B. Photophysics of a Butadiyne-Linked Porphyrin Dimer: Influence
of Conformational Flexibility in the Ground and First Singlet Excited State. J.
Phys. Chem. C 2007, 111, 7192-7199.
(191) Kuciauskas, D.; Liddell, P. A.; Lin, S.; Stone, S. G.; Moore, A. L.; Moore, T. A.;
Gust, D. Photoinduced Electron Transfer in Carotenoporphyrin−Fullerene
Triads: Temperature and Solvent Effects. J. Phys. Chem. B 2000, 104, 4307-
4321.
(192) Kang, Y. K.; Duncan, T. V.; Therien, M. J. Temperature-Dependent Mechanistic
Transition for Photoinduced Electron Transfer Modulated by Excited-State
Vibrational Relaxation Dynamics. J. Phys. Chem. B 2007, 111, 6829-6838.
(193) Lemmetyinen, H.; Tkachenko, N. V.; Efimov, A.; Niemi, M. Temperature
Independent ltrafast Photoinduced Charge Transfer in Donor−Acceptor Pairs
Forming Exciplexes. J. Phys. Chem. C 2009, 113, 11475-11483.
(194) Scott, A. M.; Wasielewski, M. R. Temperature Dependence of Spin-Selective
Charge Transfer Pathways in Donor−Bridge−Acceptor Molecules with
Oligomeric Fluorenone and p-Phenylethynylene Bridges. J. Am. Chem. Soc.
2011, 133, 3005-3013.
(195) Kahnt, A.; K rnbratt, J.; Esdaile, L. J.; Hutin, M.; Sawada, K.; Anderson, H. L.;
Albinsson, B. Temperature Dependence of Charge Separation and
Recombination in Porphyrin Oligomer–Fullerene Donor–Acceptor Systems. J.
Am. Chem. Soc. 2011, 133, 9863-9871.
(196) Rohmer, M.-M.; Veillard, A.; Wood, M. H. Excited states and electronic
spectrum of ferrocene. Chem. Phys. Lett. 1974, 29, 466-468.
(197) Armstrong, A. T.; Smith, F.; Elder, E.; McGlynn, S. P. Electronic Absorption
Spectrum of Ferrocene. J. Chem. Phys. 1967, 46, 4321-4328.
(198) Helms, A.; Heiler, D.; McLendon, G. Dependence of electron transfer rates on
donor-acceptor angle in bis-porphyrin adducts. J. Am. Chem. Soc. 1991, 113,
4325-4327.
(199) Hoffmann, M.; Wilson, C. J.; Odell, B.; Anderson, H. L. Template-Directed
Synthesis of a π-Conjugated Porphyrin Nanoring. Angew. Chem. Int. Ed. 2007,
46, 3122-3125.
(200) Scheibe, G. Angew. Chem. 1936, 49, 563.
127
(201) Jelley, E. E. Spectral Absorption and Fluorescence of Dyes in the Molecular
State. Nature 1936, 138, 1009-1010.
(202) Hunter, C. A.; Meah, M. N.; Sanders, J. K. M. Dabco-metalloporphyrin binding:
ternary complexes, host-guest chemistry and the measurement of .pi.-.pi.
interactions. J. Am. Chem. Soc. 1990, 112, 5773-5780.
(203) Hoffmann, M.; Karnbratt, J.; Chang, M. H.; Herz, L. M.; Albinsson, B.;
Anderson, H. L. Enhanced pi conjugation around a porphyrin 6 nanoring.
Angewandte Chemie-International Edition 2008, 47, 4993-4996.
(204) Kuhlbrandt, W.; Wang, D. N.; Fujiyoshi, Y. Atomic model of plant light-
harvesting complex by electron crystallography. Nature 1994, 367, 614-621.
(205) McDermott, G.; Prince, S. M.; Freer, A. A.; Hawthornthwaite-Lawless, A. M.;
Papiz, M. Z.; Cogdell, R. J.; Isaacs, N. W. Crystal structure of an integral
membrane light-harvesting complex from photosynthetic bacteria. Nature 1995,
374, 517-521.
(206) Watanabe, S.; Shimodo, Y.; Morihashi, K. Theoretical investigation of hole
mobility in 9,10-diphenylanthracene by density functional calculations. Theor.
Chem. Acc. 2011, 130, 807-813.
(207) Hernando, J.; Hoogenboom, J. P.; van Dijk, E. M. H. P.; García-López, J. J.;
Crego-Calama, M.; Reinhoudt, D. N.; van Hulst, N. F.; García-Parajó, M. F.
Single Molecule Photobleaching Probes the Exciton Wave Function in a
Multichromophoric System. Phys. Rev. Lett. 2004, 93, 236404.
(208) Suzuki, K.; Kobayashi, A.; Kaneko, S.; Takehira, K.; Yoshihara, T.; Ishida, H.;
Shiina, Y.; Oishi, S.; Tobita, S. Reevaluation of absolute luminescence quantum
yields of standard solutions using a spectrometer with an integrating sphere and
a back-thinned CCD detector. Phys. Chem. Chem. Phys. 2009, 11, 9850-9860.
(209) Bright, F. V.; McGown, L. B. Three-component determinations using
fluorescence anisotropy measurements and wavelength selectivity. Anal. Chem.
1986, 58, 1424-1427.
(210) Valeur, B.; Weber, G. Resolution of the fluorescence excitation spectrum of
indole into the 1La and
1Lb excitation bands. Photochem. Photobiol. 1977, 25,
441-444.
(211) Johnson, B. S.; Ediger, M. D.; Yamaguchi, Y.; Matsushita, Y.; Noda, I.
Concentration and temperature dependence of molecular motions in
polystyrene/tetrahydrofuran solutions. Polymer 1992, 33, 3916-3924.
(212) Sukegawa, J.; Schubert, C.; Zhu, X.; Tsuji, H.; Guldi, D. M.; Nakamura, E.
Electron Transfer through Rigid Organic Molecular Wires Enhanced by
Electronic and Electron–Vibration Coupling. Nature Chem. 2014, 6, 899-905.