Pharmacological Basis of β-Lactamase Inhibitor ...aac.asm.org/content/57/12/5924.full.pdf ·...
7
Pharmacological Basis of -Lactamase Inhibitor Therapeutics: Tazobactam in Combination with Ceftolozane Brian VanScoy, a Rodrigo E. Mendes, b Jennifer McCauley, a Sujata M. Bhavnani, a Catharine C. Bulik, a Olanrewaju O. Okusanya, a Alan Forrest, a Ronald N. Jones, b Lawrence V. Friedrich, c Judith N. Steenbergen, c Paul G. Ambrose a,d Institute for Clinical Pharmacodynamics, Latham, New York, USA a ; JMI Laboratories, North Liberty, Iowa, USA b ; Cubist Pharmaceuticals, Lexington, Massachusetts, USA c ; University of Oxford, Oxford, United Kingdom d We recently investigated the pharmacokinetics-pharmacodynamics (PK-PD) of tazobactam in combination with ceftolozane against an isogenic CTX-M-15-producing Escherichia coli triplet set, genetically engineered to transcribe different levels of bla CTX-M-15 . The percentage of the dosing interval that tazobactam concentrations remained above a threshold (%Time>threshold) was identified as the PK-PD exposure measure that was most closely associated with efficacy. Moreover, the tazobactam concentration was dependent upon the enzyme transcription level. Given that the aforementioned strains were genetically engineered to transcribe a single -lacta- mase enzyme and that clinical isolates typically produce multiple -lactamase enzymes with various transcription levels, it is likely that the tazobactam threshold concentration is isolate/enzyme dependent. Our first objective was to characterize the relationship between the tazobactam %Time>threshold in combination with ceftolozane and efficacy using clinical isolates in an in vitro PK-PD infection model. Our second objective was to identify a translational relationship that would allow for the comodeling across clinical isolates. The initial challenge panel included four well-characterized -lactamase-producing E. coli strains with variable enzyme expression and other resistance determinants. As evidenced by r 2 values of ranging from 0.90 to 0.99 for each clinical isolate, the observed data were well described by fitted functions describing the relationship between the tazobactam %Time>threshold and change in log 10 CFU from baseline; however, the data from the four isolates did not comodel well. The threshold concentration identified for each iso- late ranged from 0.5 to 4 mg/liter. We identified an enabling translational relationship for the tazobactam threshold that allowed co- modeling of all four clinical isolates, which was the product of the individual isolate’s ceftolozane-tazobactam MIC value and 0.5. As evidenced by an r 2 value of 0.90, the transformed data were well described by a fitted function describing the relationship between tazo- bactam %Time>threshold and change in log 10 CFU from baseline. Due to these findings, the challenge panel was expanded to include three well-characterized -lactamase-producing Klebsiella pneumoniae strains with variable enzyme expression and other resistance determinants. The translational relationship for the tazobactam threshold that allowed for the comodeling of the four E. coli isolates performed well for the expanded data set (seven isolates in total; four E. coli and three K. pneumoniae), as evidenced by an r 2 value of 0.84. This simple translational relationship is especially useful as it is directly linked to in vitro susceptibility test results, which are used to guide the clinician’s choice of drug and dosing regimen. T azobactam, a penicillanic acid sulfone -lactamase inhibitor, has been used in combination with piperacillin to treat in- fected patients for nearly a quarter-century (1). As a result of the rising clinical concern for -lactamase-producing Enterobacteria- ceae, there has been renewed interest in developing new tazobac- tam–-lactam combinations. Ceftolozane-tazobactam is a novel antibacterial with activity against Pseudomonas aeruginosa, in- cluding drug-resistant strains, and other common Gram-negative pathogens, including most extended-spectrum -lactamase (ESBL)- producing Enterobacteriaceae (2). Until recently, little was known about the pharmacokinetic- pharmacodynamic (PK-PD) underpinnings of -lactamase in- hibitor therapeutics (3, 4, 5). For instance, the PK-PD measure associated with tazobactam efficacy was only recently identified (5). VanScoy et al. utilized an isogenic CTX-M-15-producing Escherichia coli triplet set, genetically engineered to transcribe dif- ferent levels of bla CTX-M-15 , to identify the percentage of the dosing interval that tazobactam concentrations remained above a thresh- old (%Timethreshold) as the PK-PD efficacy determinant. The results of these studies also demonstrated that the bla CTX-M-15 transcription level had an impact on the tazobactam threshold concentration associated with efficacy. Higher tazobactam thresh- old concentrations were associated with strains transcribing higher levels of -lactamase enzyme. Given that the aforemen- tioned strains were genetically engineered to transcribe a single -lactamase enzyme and that clinical isolates typically produce multiple -lactamase enzymes with various transcription levels, it is likely that the tazobactam threshold concentration is isolate and enzyme dependent. In such a circumstance, the forecasting of po- tentially efficacious clinical regimens from preclinical infection model data would be challenging. Thus, it would be useful to identify a translational relationship that would allow for comodeling of the relationship between %Timethreshold and efficacy using data across isolates that produce different -lactamase enzymes and enzyme combinations with various transcription levels. The objectives of the PK-PD in vitro infection model studies for ceftolozane-tazobactam described herein were 3-fold. The first objec- Received 1 April 2013 Returned for modification 23 May 2013 Accepted 7 September 2013 Published ahead of print 16 September 2013 Address correspondence to Paul G. Ambrose, [email protected]. Copyright © 2013, American Society for Microbiology. All Rights Reserved. doi:10.1128/AAC.00656-13 5924 aac.asm.org Antimicrobial Agents and Chemotherapy p. 5924 –5930 December 2013 Volume 57 Number 12 on September 6, 2018 by guest http://aac.asm.org/ Downloaded from
Transcript of Pharmacological Basis of β-Lactamase Inhibitor ...aac.asm.org/content/57/12/5924.full.pdf ·...
Pharmacological Basis of �-Lactamase Inhibitor Therapeutics:Tazobactam in Combination with Ceftolozane
Brian VanScoy,a Rodrigo E. Mendes,b Jennifer McCauley,a Sujata M. Bhavnani,a Catharine C. Bulik,a Olanrewaju O. Okusanya,a
Alan Forrest,a Ronald N. Jones,b Lawrence V. Friedrich,c Judith N. Steenbergen,c Paul G. Ambrosea,d
Institute for Clinical Pharmacodynamics, Latham, New York, USAa; JMI Laboratories, North Liberty, Iowa, USAb; Cubist Pharmaceuticals, Lexington, Massachusetts, USAc;University of Oxford, Oxford, United Kingdomd
We recently investigated the pharmacokinetics-pharmacodynamics (PK-PD) of tazobactam in combination with ceftolozane againstan isogenic CTX-M-15-producing Escherichia coli triplet set, genetically engineered to transcribe different levels of blaCTX-M-15. Thepercentage of the dosing interval that tazobactam concentrations remained above a threshold (%Time>threshold) was identified asthe PK-PD exposure measure that was most closely associated with efficacy. Moreover, the tazobactam concentration was dependentupon the enzyme transcription level. Given that the aforementioned strains were genetically engineered to transcribe a single �-lacta-mase enzyme and that clinical isolates typically produce multiple �-lactamase enzymes with various transcription levels, it is likely thatthe tazobactam threshold concentration is isolate/enzyme dependent. Our first objective was to characterize the relationship betweenthe tazobactam %Time>threshold in combination with ceftolozane and efficacy using clinical isolates in an in vitro PK-PD infectionmodel. Our second objective was to identify a translational relationship that would allow for the comodeling across clinical isolates.The initial challenge panel included four well-characterized �-lactamase-producing E. coli strains with variable enzyme expressionand other resistance determinants. As evidenced by r2 values of ranging from 0.90 to 0.99 for each clinical isolate, the observed datawere well described by fitted functions describing the relationship between the tazobactam %Time>threshold and change in log10
CFU from baseline; however, the data from the four isolates did not comodel well. The threshold concentration identified for each iso-late ranged from 0.5 to 4 mg/liter. We identified an enabling translational relationship for the tazobactam threshold that allowed co-modeling of all four clinical isolates, which was the product of the individual isolate’s ceftolozane-tazobactam MIC value and 0.5. Asevidenced by an r2 value of 0.90, the transformed data were well described by a fitted function describing the relationship between tazo-bactam %Time>threshold and change in log10 CFU from baseline. Due to these findings, the challenge panel was expanded to includethree well-characterized �-lactamase-producing Klebsiella pneumoniae strains with variable enzyme expression and other resistancedeterminants. The translational relationship for the tazobactam threshold that allowed for the comodeling of the four E. coli isolatesperformed well for the expanded data set (seven isolates in total; four E. coli and three K. pneumoniae), as evidenced by an r2 value of0.84. This simple translational relationship is especially useful as it is directly linked to in vitro susceptibility test results, which are usedto guide the clinician’s choice of drug and dosing regimen.
Tazobactam, a penicillanic acid sulfone �-lactamase inhibitor,has been used in combination with piperacillin to treat in-
fected patients for nearly a quarter-century (1). As a result of therising clinical concern for �-lactamase-producing Enterobacteria-ceae, there has been renewed interest in developing new tazobac-tam–�-lactam combinations. Ceftolozane-tazobactam is a novelantibacterial with activity against Pseudomonas aeruginosa, in-cluding drug-resistant strains, and other common Gram-negativepathogens, including most extended-spectrum �-lactamase (ESBL)-producing Enterobacteriaceae (2).
Until recently, little was known about the pharmacokinetic-pharmacodynamic (PK-PD) underpinnings of �-lactamase in-hibitor therapeutics (3, 4, 5). For instance, the PK-PD measureassociated with tazobactam efficacy was only recently identified(5). VanScoy et al. utilized an isogenic CTX-M-15-producingEscherichia coli triplet set, genetically engineered to transcribe dif-ferent levels of blaCTX-M-15, to identify the percentage of the dosinginterval that tazobactam concentrations remained above a thresh-old (%Time�threshold) as the PK-PD efficacy determinant. Theresults of these studies also demonstrated that the blaCTX-M-15
transcription level had an impact on the tazobactam thresholdconcentration associated with efficacy. Higher tazobactam thresh-old concentrations were associated with strains transcribing
higher levels of �-lactamase enzyme. Given that the aforemen-tioned strains were genetically engineered to transcribe a single�-lactamase enzyme and that clinical isolates typically producemultiple �-lactamase enzymes with various transcription levels, itis likely that the tazobactam threshold concentration is isolate andenzyme dependent. In such a circumstance, the forecasting of po-tentially efficacious clinical regimens from preclinical infectionmodel data would be challenging. Thus, it would be useful toidentify a translational relationship that would allow for comodelingof the relationship between %Time�threshold and efficacy usingdata across isolates that produce different �-lactamase enzymes andenzyme combinations with various transcription levels.
The objectives of the PK-PD in vitro infection model studies forceftolozane-tazobactam described herein were 3-fold. The first objec-
Received 1 April 2013 Returned for modification 23 May 2013Accepted 7 September 2013
Published ahead of print 16 September 2013
Address correspondence to Paul G. Ambrose, [email protected].
Copyright © 2013, American Society for Microbiology. All Rights Reserved.
doi:10.1128/AAC.00656-13
5924 aac.asm.org Antimicrobial Agents and Chemotherapy p. 5924 –5930 December 2013 Volume 57 Number 12
on Septem
ber 6, 2018 by guesthttp://aac.asm
.org/D
ownloaded from
tive was to characterize the relationship between tazobactam%Time�threshold and efficacy for each of four well-characterized�-lactamase-producing clinical E. coli isolates. Using data pooled forthese four isolates, the second objective was to identify a translationalrelationship that would allow for comodeling of the relationship be-tween %Time�threshold and efficacy. Upon successful completionof the second objective, the clinical isolate challenge panel was ex-panded to include three well-characterized �-lactamase-producingclinical Klebsiella pneumoniae isolates in order to evaluate the trans-lational relationship in the context of an expanded ESBL-producinggenus data set. Escherichia coli and K. pneumoniae represent thoseEnterobacteriaceae that dominantly harbor ESBL genes and cause thegreatest occurrence of human disease. Such an enabling translationalrelationship would subsequently allow for the forecasting of effectiveand noneffective clinical regimens from preclinical models systemsbased upon in vitro susceptibility test results.
MATERIALS AND METHODSBacteria, antimicrobial, and �-lactamase inhibitor. Four E. coli andthree K. pneumoniae clinical isolates (JMI Laboratories, North Liberty,IA) were utilized in these studies. Isolates were chosen to cover a rangeceftolozane/tazobactam MIC values. Ceftolozane and tazobactam wereprovided by Cubist Pharmaceuticals (Lexington, MA).
Determining transcription levels of intrinsic ampC, efflux pump,and outer membrane protein genes. The transcription levels of ampC,acrA, ompC, and ompF were determined by comparing the transcriptionlevels of these selected targets to those from the same clinical wild-type E.coli recipient strain used in previous studies (5). For K. pneumoniae, thetranscription levels of ampC, acrA, and ompK were determined by com-paring the transcription levels of these selected targets to those from awild-type strain. Total genomic RNA samples were extracted from eachchallenge isolate using the RNeasy Mini Kit in a fully automated roboticworkstation (QIAcube; Qiagen, Valencia, CA), and residual DNA waseliminated with RNase-free DNase (Promega, Madison, WI). Samplequality and quantification of the genomic RNA were assessed using theAgilent 21000 Bioanalyzer with the RNA 6000 Nano kit according to themanufacturer’s instructions (Agilent, Santa Clara, CA). Reverse tran-scription-PCR (RT-PCR) was performed in triplicate using the Quanti-Tect SYBR green RT-PCR kit (Qiagen, Germantown, MD) in the StepOnePlus instrument (Lie Technologies, Foster City, CA).
Genotypic and phenotypic characterization of �-lactamase content.Each challenge isolate was screened for plasmidic AmpC (blaCMY-1-41,blaCMY-43-44, blaCMY-49, blaFOX-1-7, blaACC-1-4, blaACT-1-7, blaDHA-1-3,blaLAT-1, blaMIR-1-5, and blaMOM-1-7) extended-spectrum �-lactamase(ESBL) (blaTEM, blaSHV, blaCTX-M, blaGES, blaVEB, blaPER, blaPSE, andblaBEL), and oxacillinases with ESBL spectrum (blaOXA-2, blaOXA-10, andblaOXA-1/30 group, blaOXA-18, and blaOXA-45). �-Lactamase-encodinggenes were confirmed by sequencing analysis.
All isolates were subjected to isoelectric focusing (IEF) patterns usingstandard protocols to rule out the presence of unknown �-lactamase-encoding genes not detected by PCR and sequencing. Crude protein ex-tract preparations were obtained from overnight cultures subjected to celllysis using BugBuster (Novagen, Darmstadt, Germany). The lysed sam-ples were normalized and loaded into precast IEF gels stained using nitro-cefin and a prestained protein marker as a standard. The isoelectric pointswere determined by linear regression using a combination of preparationsfrom bacteria possessing known �-lactamases.
Determination of hydrolytic activity. The hydrolytic activity of thepooled �-lactam enzymes produced by each clinical strain was measuredby observing the changes in absorbance due to the opening of the nitro-cefin �-lactam ring in an Ultrospec 3300 Pro UV/visible spectrophotom-eter (GE Healthcare Biosciences, Pittsburgh, PA) during a 2-min interval.The degree of hydrolytic activity was calculated using the following for-
mula: hydrolytic activity � [(�absorbance/minute)/protein concentra-tion in mg/liter] � �1,000 (factor).
Media and in vitro susceptibility studies. Susceptibility studies, usingcation-adjusted Mueller-Hinton broth (CA-MHB) (BD laboratories,Franklin Lakes, NJ) microdilution methods, were conducted in accor-dance with Clinical and Laboratory Standards Institute (CLSI) guidelines(6). Isolate susceptibility to ceftolozane was determined for ceftolozanealone as well as in combination with a fixed tazobactam concentration (4mg/liter) per CLSI guidelines. Minimum bactericidal concentrations(MBCs) were determined in duplicate for each isolate. Briefly, 10 �l wasremoved from the wells that represented the MIC and 4 concentrationsgreater than the MIC and was plated onto blood agar plates. To avoidantibacterial carryover, the aliquots were allowed to soak into the agar andthen were spread for isolation, thus removing the cells from the drugsource. The MBC was defined as the lowest concentration of drug thatreduced the initial inoculum by 3 log units. Susceptibility studies wereperformed in triplicate over a 2-day period. The modal MIC and MBCvalues are presented and were utilized in all analyses.
PK-PD in vitro model and sample processing. The one-compart-ment PK-PD in vitro infection model utilized in these studies has beendescribed previously (7). Briefly, the model consists of a central infectioncompartment containing growth medium, the challenge isolate, and mag-netic stir bars to ensure the homogeneity of the drug(s) within the com-partment. The central infection compartment was attached to a stir plate,and the entire unit was placed within a temperature- and humidity-con-trolled incubator set at 35°C. Drug-free growth medium was pumped intothe central infection compartment via a computer-controlled peristalticpump while growth medium was simultaneously removed through anexit port and captured in a waste container. The challenge isolate wasaseptically inoculated directly into the central infection compartment.The peristaltic pump was set at a flow rate which allowed for the simula-tion of the human free drug concentration-time profile of the drug(s)under study. The test compounds were infused via computer-controlledsyringe pumps which allow for the simulation of the desired half-lives,dosing frequencies, and concentrations. Specimens for CFU determina-tion and drug concentration assay were collected from the central infec-tion compartment using a sterile syringe and needle through a rubberseptum at predetermined time points.
In these experiments, initial inocula of 1.0 � 106 CFU/ml of each of thechallenge isolates were prepared from a culture grown overnight on Tryp-ticase soy agar enriched with 5% sheep blood (BD, Sparks, MD). Isolateswere taken from the overnight cultures and grown to mid-logarithmicphase in a flask of MHB set in a water-shaker bath at 35°C and 125 rota-tions per minute. The bacterial concentration within the flask of MHB wasdetermined by optical density using a Genesys 30 spectrophotometer(Thermo Scientific, Waltham MA) and a previously confirmed growthcurve for each challenge isolate.
Bacteria were then exposed to changing concentrations of ceftolozane andtazobactam simulating human half-lives of 2.5 h for ceftolozane and 1 h fortazobactam. One-milliliter specimens were collected for CFU determinationat 0, 2, 4, 8, 12, and 24 h. Each sample was centrifuged, washed, and resus-pended with sterile normal saline twice to prevent drug carryover and wasthen cultured onto Trypticase soy agar enriched with 5% sheep blood. Platedsamples were incubated at 35°C for 24 h. One-milliliter specimens for drugassay were collected at 1, 3, 5, 7, 9, and 24 h. These samples were immediatelyfrozen at �80°C until assayed for drug concentration.
Dose-ranging studies. Dose-ranging studies were conducted usingeach of the four clinical E. coli isolates to determine the tazobactam%Time�threshold concentration required for cell kill. In these studies, arange of tazobactam doses were administered using a fixed dose of cef-tolozane. Each dosing interval was 8 h since this is the dosing schedule thatis expected to be used clinically. Both drugs were administered over 1 h,and free drug concentration-time profiles assuming 20% and 30% proteinbinding for ceftolozane (Cubist; data on file) and tazobactam (Zosynpackage insert; Wyeth Pharmaceuticals, Inc., Philadelphia, PA), respec-
Basis of Tazobactam Therapeutics
December 2013 Volume 57 Number 12 aac.asm.org 5925
on Septem
ber 6, 2018 by guesthttp://aac.asm
.org/D
ownloaded from
tively, were simulated. The ceftolozane dose administered for isolates withMIC values of 0.5 and 1 mg/liter was 1,000 mg, while a 2,000-mg dose wasadministered for isolates with MIC values of 2 and 4 mg/liter. The tazo-bactam dose ranged from 125 to 4,000 mg.
Analytical method. All samples were assayed by liquid chromatogra-phy-tandem mass spectrometry (LC-MS/MS) (Waters, Milford, MA).The standard curve for ceftolozane was linear over a range of 0.1 to 500mg/liter, and that for tazobactam was quadratic over a range of 0.1 to 100mg/liter. For the ceftolozane and tazobactam quality control (QC) sam-ples, the deviation of the mean from theoretical values did not exceed3.00% and 4.00%, respectively. The coefficients of variation (CVs) forthe ceftolozane and tazobactam QC samples ranged from 2.89% to 4.21%and from 3.22% to 4.20%, respectively.
PK-PD analysis. Data from the dose-ranging studies were evaluatedusing Hill-type models and nonlinear least-squares regression. The datawere weighted using the inverse of the estimated measurement variance.Relationships between the tazobactam %Time�threshold and change inlog10 CFU from baseline at 24 h were evaluated. For each individual iso-late, the tazobactam %Time�threshold was identified through an itera-tive process in which candidate threshold concentrations of 0.05, 0.1, 0.25,0.5, 1, 2, and 4 mg/liter were evaluated. Threshold value discriminationwas based on the evaluation of the dispersion of data along the%Time�threshold axis and optimization of r2 values for the relationship
between tazobactam %Time�threshold and change in log10 CFU frombaseline at 24 h.
For analyses of pooled data across isolates, two approaches were consid-ered. First, graphical evaluations while viewing an electric telescope (52 Class530 Series 1080p LCD/HD; Samsung Group, Seoul, South Korea) were usedto identify potential tazobactam thresholds, and second, nonlinear regressionwas considered to explore multivariable models which would predict the ta-zobactam threshold concentration (dependent variable) as a function of thecandidate independent variables. Model discrimination was accomplishedaccording to the corrected Akaike’s information criterion (8).
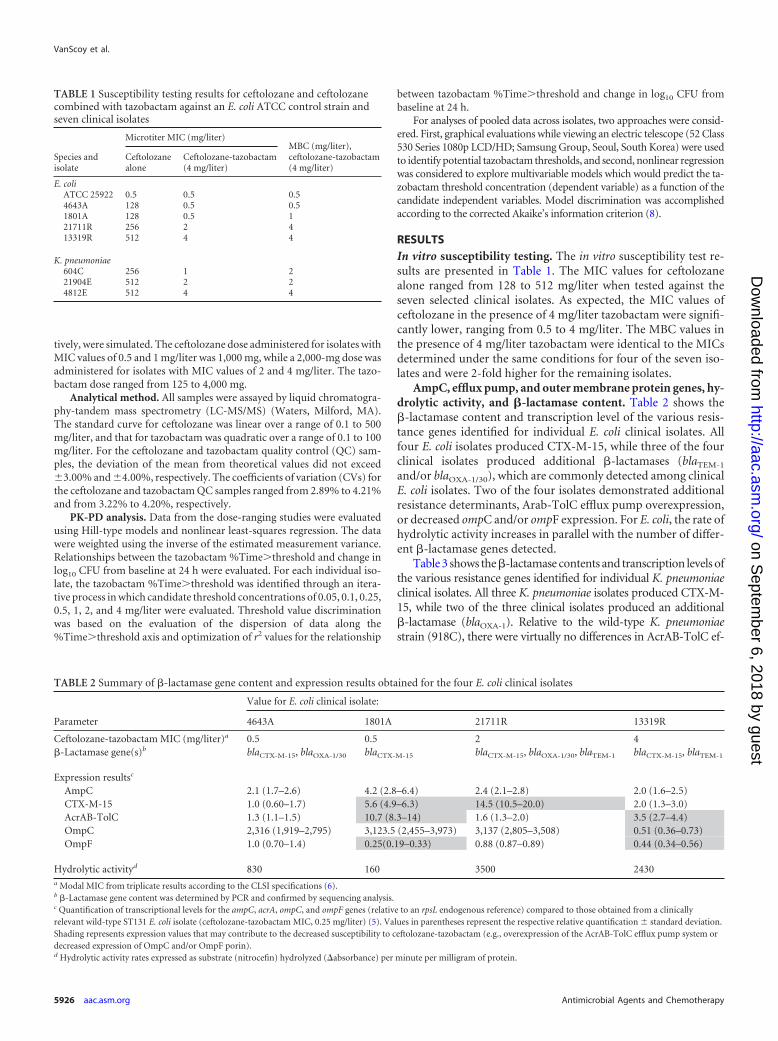
RESULTSIn vitro susceptibility testing. The in vitro susceptibility test re-sults are presented in Table 1. The MIC values for ceftolozanealone ranged from 128 to 512 mg/liter when tested against theseven selected clinical isolates. As expected, the MIC values ofceftolozane in the presence of 4 mg/liter tazobactam were signifi-cantly lower, ranging from 0.5 to 4 mg/liter. The MBC values inthe presence of 4 mg/liter tazobactam were identical to the MICsdetermined under the same conditions for four of the seven iso-lates and were 2-fold higher for the remaining isolates.
AmpC, efflux pump, and outer membrane protein genes, hy-drolytic activity, and �-lactamase content. Table 2 shows the�-lactamase content and transcription level of the various resis-tance genes identified for individual E. coli clinical isolates. Allfour E. coli isolates produced CTX-M-15, while three of the fourclinical isolates produced additional �-lactamases (blaTEM-1
and/or blaOXA-1/30), which are commonly detected among clinicalE. coli isolates. Two of the four isolates demonstrated additionalresistance determinants, Arab-TolC efflux pump overexpression,or decreased ompC and/or ompF expression. For E. coli, the rate ofhydrolytic activity increases in parallel with the number of differ-ent �-lactamase genes detected.
Table 3 shows the �-lactamase contents and transcription levels ofthe various resistance genes identified for individual K. pneumoniaeclinical isolates. All three K. pneumoniae isolates produced CTX-M-15, while two of the three clinical isolates produced an additional�-lactamase (blaOXA-1). Relative to the wild-type K. pneumoniaestrain (918C), there were virtually no differences in AcrAB-TolC ef-
TABLE 1 Susceptibility testing results for ceftolozane and ceftolozanecombined with tazobactam against an E. coli ATCC control strain andseven clinical isolates
Species andisolate
Microtiter MIC (mg/liter)MBC (mg/liter),ceftolozane-tazobactam(4 mg/liter)
Ceftolozanealone
Ceftolozane-tazobactam(4 mg/liter)
E. coliATCC 25922 0.5 0.5 0.54643A 128 0.5 0.51801A 128 0.5 121711R 256 2 413319R 512 4 4
K. pneumoniae604C 256 1 221904E 512 2 24812E 512 4 4
TABLE 2 Summary of �-lactamase gene content and expression results obtained for the four E. coli clinical isolates
Parameter
Value for E. coli clinical isolate:
4643A 1801A 21711R 13319R
Ceftolozane-tazobactam MIC (mg/liter)a 0.5 0.5 2 4�-Lactamase gene(s)b blaCTX-M-15, blaOXA-1/30 blaCTX-M-15 blaCTX-M-15, blaOXA-1/30, blaTEM-1 blaCTX-M-15, blaTEM-1
Expression resultsc
AmpC 2.1 (1.7–2.6) 4.2 (2.8–6.4) 2.4 (2.1–2.8) 2.0 (1.6–2.5)CTX-M-15 1.0 (0.60–1.7) 5.6 (4.9–6.3) 14.5 (10.5–20.0) 2.0 (1.3–3.0)AcrAB-TolC 1.3 (1.1–1.5) 10.7 (8.3–14) 1.6 (1.3–2.0) 3.5 (2.7–4.4)OmpC 2,316 (1,919–2,795) 3,123.5 (2,455–3,973) 3,137 (2,805–3,508) 0.51 (0.36–0.73)OmpF 1.0 (0.70–1.4) 0.25(0.19–0.33) 0.88 (0.87–0.89) 0.44 (0.34–0.56)
Hydrolytic activityd 830 160 3500 2430a Modal MIC from triplicate results according to the CLSI specifications (6).b �-Lactamase gene content was determined by PCR and confirmed by sequencing analysis.c Quantification of transcriptional levels for the ampC, acrA, ompC, and ompF genes (relative to an rpsL endogenous reference) compared to those obtained from a clinicallyrelevant wild-type ST131 E. coli isolate (ceftolozane-tazobactam MIC, 0.25 mg/liter) (5). Values in parentheses represent the respective relative quantification standard deviation.Shading represents expression values that may contribute to the decreased susceptibility to ceftolozane-tazobactam (e.g., overexpression of the AcrAB-TolC efflux pump system ordecreased expression of OmpC and/or OmpF porin).d Hydrolytic activity rates expressed as substrate (nitrocefin) hydrolyzed (�absorbance) per minute per milligram of protein.
VanScoy et al.
5926 aac.asm.org Antimicrobial Agents and Chemotherapy
on Septem
ber 6, 2018 by guesthttp://aac.asm
.org/D
ownloaded from
flux pump expression or the level of OmpK expression. For K. pneu-moniae, the rate of hydrolytic activity of the clinical isolates was sim-ilar to or greater than that for the wild-type strain (918C).
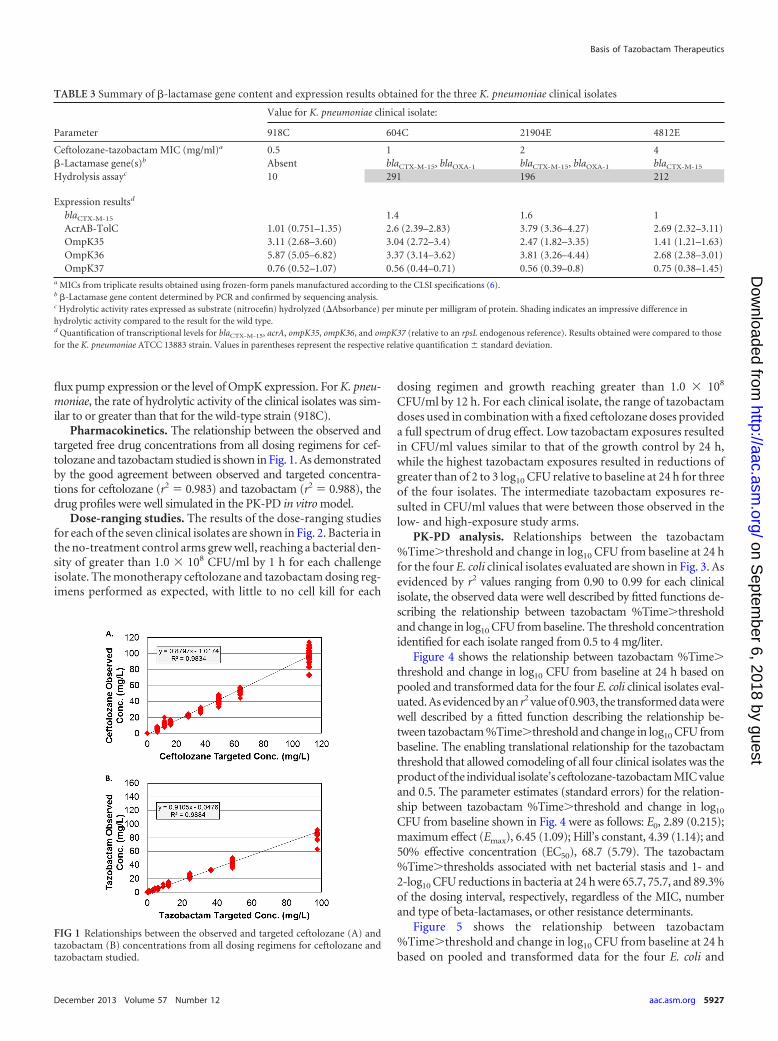
Pharmacokinetics. The relationship between the observed andtargeted free drug concentrations from all dosing regimens for cef-tolozane and tazobactam studied is shown in Fig. 1. As demonstratedby the good agreement between observed and targeted concentra-tions for ceftolozane (r2 � 0.983) and tazobactam (r2 � 0.988), thedrug profiles were well simulated in the PK-PD in vitro model.
Dose-ranging studies. The results of the dose-ranging studiesfor each of the seven clinical isolates are shown in Fig. 2. Bacteria inthe no-treatment control arms grew well, reaching a bacterial den-sity of greater than 1.0 � 108 CFU/ml by 1 h for each challengeisolate. The monotherapy ceftolozane and tazobactam dosing reg-imens performed as expected, with little to no cell kill for each
dosing regimen and growth reaching greater than 1.0 � 108
CFU/ml by 12 h. For each clinical isolate, the range of tazobactamdoses used in combination with a fixed ceftolozane doses provideda full spectrum of drug effect. Low tazobactam exposures resultedin CFU/ml values similar to that of the growth control by 24 h,while the highest tazobactam exposures resulted in reductions ofgreater than of 2 to 3 log10 CFU relative to baseline at 24 h for threeof the four isolates. The intermediate tazobactam exposures re-sulted in CFU/ml values that were between those observed in thelow- and high-exposure study arms.
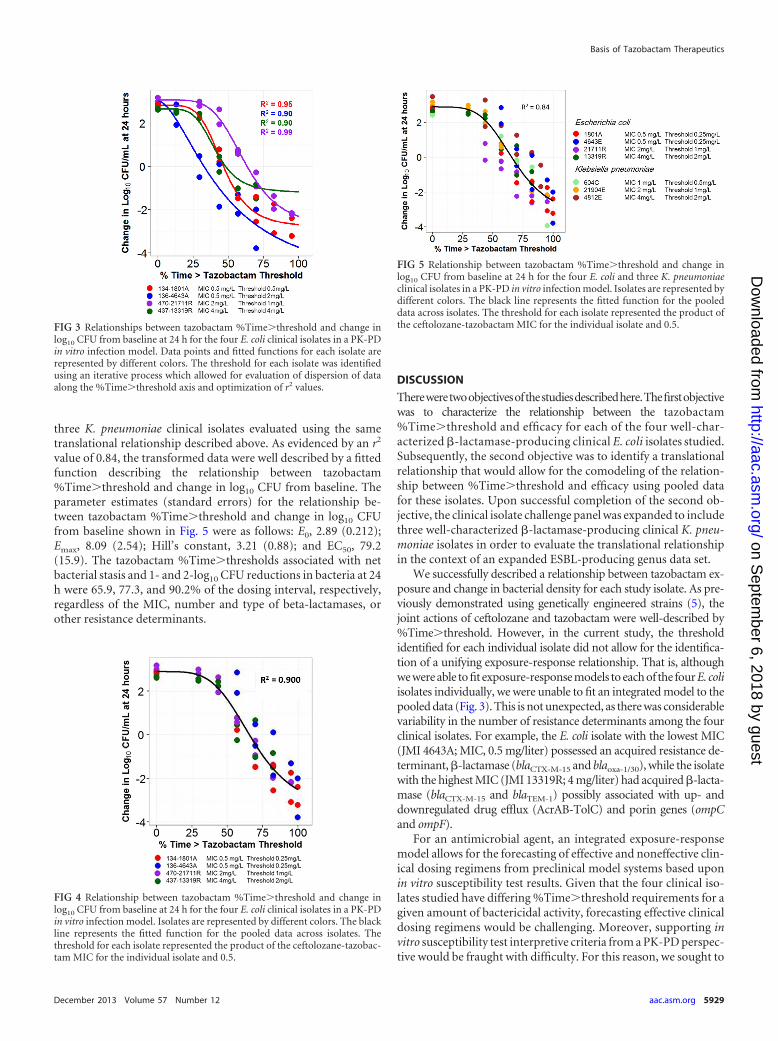
PK-PD analysis. Relationships between the tazobactam%Time�threshold and change in log10 CFU from baseline at 24 hfor the four E. coli clinical isolates evaluated are shown in Fig. 3. Asevidenced by r2 values ranging from 0.90 to 0.99 for each clinicalisolate, the observed data were well described by fitted functions de-scribing the relationship between tazobactam %Time�thresholdand change in log10 CFU from baseline. The threshold concentrationidentified for each isolate ranged from 0.5 to 4 mg/liter.
Figure 4 shows the relationship between tazobactam %Time�threshold and change in log10 CFU from baseline at 24 h based onpooled and transformed data for the four E. coli clinical isolates eval-uated. As evidenced by an r2 value of 0.903, the transformed data werewell described by a fitted function describing the relationship be-tween tazobactam %Time�threshold and change in log10 CFU frombaseline. The enabling translational relationship for the tazobactamthreshold that allowed comodeling of all four clinical isolates was theproduct of the individual isolate’s ceftolozane-tazobactam MIC valueand 0.5. The parameter estimates (standard errors) for the relation-ship between tazobactam %Time�threshold and change in log10
CFU from baseline shown in Fig. 4 were as follows: E0, 2.89 (0.215);maximum effect (Emax), 6.45 (1.09); Hill’s constant, 4.39 (1.14); and50% effective concentration (EC50), 68.7 (5.79). The tazobactam%Time�thresholds associated with net bacterial stasis and 1- and2-log10 CFU reductions in bacteria at 24 h were 65.7, 75.7, and 89.3%of the dosing interval, respectively, regardless of the MIC, numberand type of beta-lactamases, or other resistance determinants.
Figure 5 shows the relationship between tazobactam%Time�threshold and change in log10 CFU from baseline at 24 hbased on pooled and transformed data for the four E. coli and
TABLE 3 Summary of �-lactamase gene content and expression results obtained for the three K. pneumoniae clinical isolates
Parameter
Value for K. pneumoniae clinical isolate:
918C 604C 21904E 4812E
Ceftolozane-tazobactam MIC (mg/ml)a 0.5 1 2 4�-Lactamase gene(s)b Absent blaCTX-M-15, blaOXA-1 blaCTX-M-15, blaOXA-1 blaCTX-M-15
Hydrolysis assayc 10 291 196 212
Expression resultsd
blaCTX-M-15 1.4 1.6 1AcrAB-TolC 1.01 (0.751–1.35) 2.6 (2.39–2.83) 3.79 (3.36–4.27) 2.69 (2.32–3.11)OmpK35 3.11 (2.68–3.60) 3.04 (2.72–3.4) 2.47 (1.82–3.35) 1.41 (1.21–1.63)OmpK36 5.87 (5.05–6.82) 3.37 (3.14–3.62) 3.81 (3.26–4.44) 2.68 (2.38–3.01)OmpK37 0.76 (0.52–1.07) 0.56 (0.44–0.71) 0.56 (0.39–0.8) 0.75 (0.38–1.45)
a MICs from triplicate results obtained using frozen-form panels manufactured according to the CLSI specifications (6).b �-Lactamase gene content determined by PCR and confirmed by sequencing analysis.c Hydrolytic activity rates expressed as substrate (nitrocefin) hydrolyzed (�Absorbance) per minute per milligram of protein. Shading indicates an impressive difference inhydrolytic activity compared to the result for the wild type.d Quantification of transcriptional levels for blaCTX-M-15, acrA, ompK35, ompK36, and ompK37 (relative to an rpsL endogenous reference). Results obtained were compared to thosefor the K. pneumoniae ATCC 13883 strain. Values in parentheses represent the respective relative quantification standard deviation.
FIG 1 Relationships between the observed and targeted ceftolozane (A) andtazobactam (B) concentrations from all dosing regimens for ceftolozane andtazobactam studied.
Basis of Tazobactam Therapeutics
December 2013 Volume 57 Number 12 aac.asm.org 5927
on Septem
ber 6, 2018 by guesthttp://aac.asm
.org/D
ownloaded from
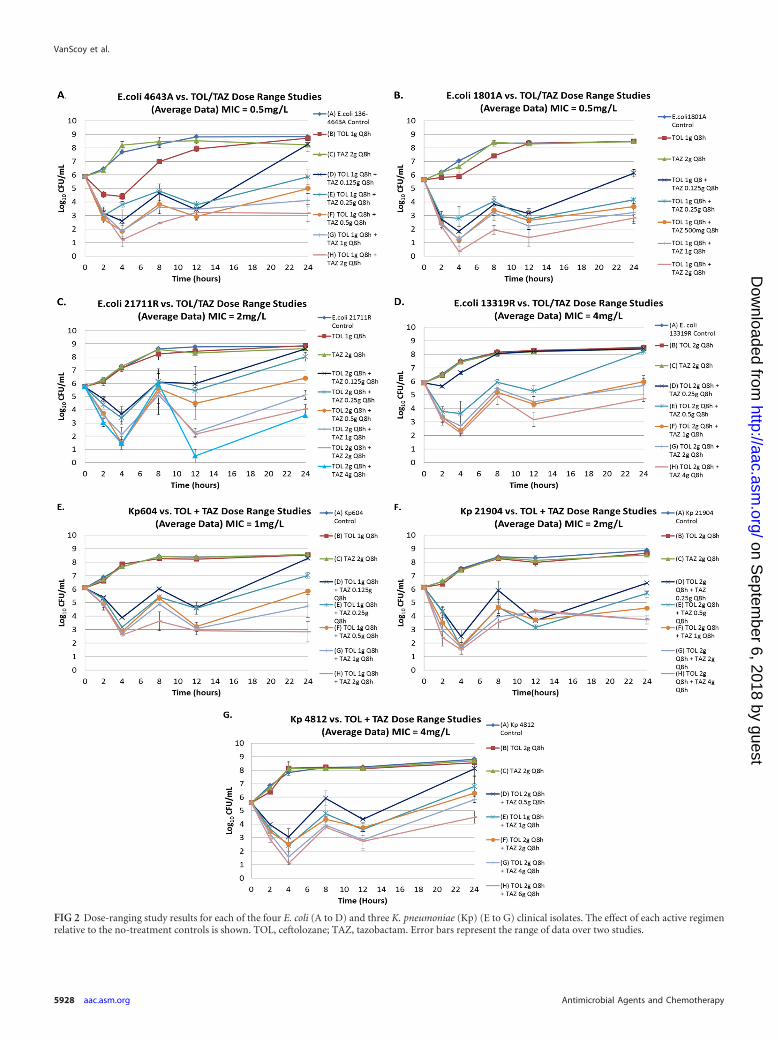
FIG 2 Dose-ranging study results for each of the four E. coli (A to D) and three K. pneumoniae (Kp) (E to G) clinical isolates. The effect of each active regimenrelative to the no-treatment controls is shown. TOL, ceftolozane; TAZ, tazobactam. Error bars represent the range of data over two studies.
VanScoy et al.
5928 aac.asm.org Antimicrobial Agents and Chemotherapy
on Septem
ber 6, 2018 by guesthttp://aac.asm
.org/D
ownloaded from
three K. pneumoniae clinical isolates evaluated using the sametranslational relationship described above. As evidenced by an r2
value of 0.84, the transformed data were well described by a fittedfunction describing the relationship between tazobactam%Time�threshold and change in log10 CFU from baseline. Theparameter estimates (standard errors) for the relationship be-tween tazobactam %Time�threshold and change in log10 CFUfrom baseline shown in Fig. 5 were as follows: E0, 2.89 (0.212);Emax, 8.09 (2.54); Hill’s constant, 3.21 (0.88); and EC50, 79.2(15.9). The tazobactam %Time�thresholds associated with netbacterial stasis and 1- and 2-log10 CFU reductions in bacteria at 24h were 65.9, 77.3, and 90.2% of the dosing interval, respectively,regardless of the MIC, number and type of beta-lactamases, orother resistance determinants.
DISCUSSION
Thereweretwoobjectivesofthestudiesdescribedhere.Thefirstobjectivewas to characterize the relationship between the tazobactam%Time�threshold and efficacy for each of the four well-char-acterized �-lactamase-producing clinical E. coli isolates studied.Subsequently, the second objective was to identify a translationalrelationship that would allow for the comodeling of the relation-ship between %Time�threshold and efficacy using pooled datafor these isolates. Upon successful completion of the second ob-jective, the clinical isolate challenge panel was expanded to includethree well-characterized �-lactamase-producing clinical K. pneu-moniae isolates in order to evaluate the translational relationshipin the context of an expanded ESBL-producing genus data set.
We successfully described a relationship between tazobactam ex-posure and change in bacterial density for each study isolate. As pre-viously demonstrated using genetically engineered strains (5), thejoint actions of ceftolozane and tazobactam were well-described by%Time�threshold. However, in the current study, the thresholdidentified for each individual isolate did not allow for the identifica-tion of a unifying exposure-response relationship. That is, althoughwe were able to fit exposure-response models to each of the four E. coliisolates individually, we were unable to fit an integrated model to thepooled data (Fig. 3). This is not unexpected, as there was considerablevariability in the number of resistance determinants among the fourclinical isolates. For example, the E. coli isolate with the lowest MIC(JMI 4643A; MIC, 0.5 mg/liter) possessed an acquired resistance de-terminant, �-lactamase (blaCTX-M-15 and blaoxa-1/30), while the isolatewith the highest MIC (JMI 13319R; 4 mg/liter) had acquired �-lacta-mase (blaCTX-M-15 and blaTEM-1) possibly associated with up- anddownregulated drug efflux (AcrAB-TolC) and porin genes (ompCand ompF).
For an antimicrobial agent, an integrated exposure-responsemodel allows for the forecasting of effective and noneffective clin-ical dosing regimens from preclinical model systems based uponin vitro susceptibility test results. Given that the four clinical iso-lates studied have differing %Time�threshold requirements for agiven amount of bactericidal activity, forecasting effective clinicaldosing regimens would be challenging. Moreover, supporting invitro susceptibility test interpretive criteria from a PK-PD perspec-tive would be fraught with difficulty. For this reason, we sought to
FIG 3 Relationships between tazobactam %Time�threshold and change inlog10 CFU from baseline at 24 h for the four E. coli clinical isolates in a PK-PDin vitro infection model. Data points and fitted functions for each isolate arerepresented by different colors. The threshold for each isolate was identifiedusing an iterative process which allowed for evaluation of dispersion of dataalong the %Time�threshold axis and optimization of r2 values.
FIG 4 Relationship between tazobactam %Time�threshold and change inlog10 CFU from baseline at 24 h for the four E. coli clinical isolates in a PK-PDin vitro infection model. Isolates are represented by different colors. The blackline represents the fitted function for the pooled data across isolates. Thethreshold for each isolate represented the product of the ceftolozane-tazobac-tam MIC for the individual isolate and 0.5.
FIG 5 Relationship between tazobactam %Time�threshold and change inlog10 CFU from baseline at 24 h for the four E. coli and three K. pneumoniaeclinical isolates in a PK-PD in vitro infection model. Isolates are represented bydifferent colors. The black line represents the fitted function for the pooleddata across isolates. The threshold for each isolate represented the product ofthe ceftolozane-tazobactam MIC for the individual isolate and 0.5.
Basis of Tazobactam Therapeutics
December 2013 Volume 57 Number 12 aac.asm.org 5929
on Septem
ber 6, 2018 by guesthttp://aac.asm
.org/D
ownloaded from
develop a translational relationship that would allow for the co-modeling of exposure-response relationships across isolates.
We successfully identified a surprisingly simple translationalrelationship that allowed for the integration of the individual ex-posure-response relationships using pooled data for each of thefour study isolates. The enabling translational relationship that ledto a high coefficient of determination (r2 � 0.900) for the fittedfunction between tazobactam %Time�threshold and change inlog10 CFU from baseline was that for which the tazobactamthreshold was the product of each individual isolate’s MIC to cef-tolozane in the presence of tazobactam (4 mg/liter) and 0.5 (Fig.4). One important benefit of this simple translation relationship isthat it is directly linked to in vitro susceptibility test results, whichguide the clinician’s choice of drug and dosing regimen.
Subsequently, we expanded the clinical isolate challenge panelto include three well-characterized �-lactamase-producing clini-cal K. pneumoniae isolates and confirmed the translational rela-tionship in a second genus (Fig. 5). As E. coli and K. pneumoniaerepresent those Enterobacteriaceae that dominantly harbor ESBLgenes and cause the greatest occurrence of human disease, we feltthe confirmation of the translational relationship using data for thesetwo genera was of critical importance. It is worth noting that thistranslational relationship was identified despite the fact that thisgroup of isolates displayed different resistance mechanisms (e.g., up-and downregulated drug efflux and porin expression). Thus, theidentification of PK-PD relationships for tazobactam, based on theunifying translational relationship for %Time�tazobactam thresh-old and using data from this genetically diverse set of isolates, impliesthat �-lactamase and not the other resistance mechanisms representsthe dominant resistance determinant.
One likely explanation for the success of this simple enablingtranslational relationship is directly related to the ceftolozane-tazo-bactam susceptibility test itself. It should be remembered that thefixed 4-mg/liter tazobactam concentration utilized in the static sus-ceptibility test method is functionally equivalent to exposing the bac-terial inoculum to a continuous infusion of drug and that the testresult itself represents net bacterial stasis over a 24-h test duration. Inreality, �-lactam antimicrobial agents do not require 100%Time�MIC to achieve net bacterial stasis in dynamic preclinicalmodel systems. Using a neutropenic murine thigh infection model,Craig and Andes demonstrated that for ceftolozane-tazobactamagainst Enterobacteriaceae elaborating extended-spectrum �-lacta-mases, 31.1% (4.9%) Time�MIC was required for net bacterialstasis over a 24-h experiment (9).
There are several important caveats regarding the implications ofthe identified simple translational relationship. The relationship wasidentified based upon studies involving four E. coli and three K. pneu-moniae �-lactamase-producing clinical isolates and one �-lactamaseinhibitor, tazobactam. Thus, we do not know if the identified trans-lational relationship will apply across �-lactam–�-lactamase inhibi-tor combinations. Additional studies are warranted in this regard.
In conclusion, we identified relationships between the tazobactam%Time�threshold and efficacy for each of the seven clinical Entero-bacteriaceae isolates studied, representing two genera. Moreover, weidentified a translational relationship that would allow for the co-modeling of the relationship between %Time�threshold and effi-cacy using data pooled for these seven isolates. The enabling transla-tional relationship was that for which the tazobactam threshold wasthe product of the individual MIC of ceftolozane in the presence of
tazobactam (4 mg/liter) and 0.5. This simple translational relation-ship is especially useful as it is directly linked to in vitro susceptibilitytest results, which are used to guide the clinician’s choice of drug anddosing regimen.
ACKNOWLEDGMENTS
We thank Kim A. Charpentier from ICPD (Latham, NY, USA) and Lal-itagauri M. Deshpande from JMI Laboratories (North Liberty, IA, USA)for manuscript assistance and technical support.
This study was sponsored by Cubist Pharmaceuticals, Inc., Lexington, MA.The Institute for Clinical Pharmacodynamics (B.V., J.M., C.C.B., O.O.O.,S.M.B., A.F., and P.G.A.) has received research support from Achaogen,Astellas, AstraZeneca, Basilea Pharmaceutica, Bayer HealthCare, Bris-tol-Meyers Squibb, Cempra Pharmaceuticals, Cerexa, Cubist Pharma-ceuticals, Durata Pharmaceuticals, Fedora Pharmaceuticals, Forest Re-search Institute, Furiex Pharmaceuticals, GlaxoSmithKline, Meiji SeikaPharma, Nabriva Therapeutics, Nimbus, Pfizer, PolyMedix, Rib-X, RocheBioscience, Rock Therapeutics, Tetraphase Pharmaceuticals, and TheMedicines Company. JMI Laboratories, Inc. (R.E.M. and R.N.J.) has re-ceived research and educational grants in 2009 to 2012 from the AmericanProficiency Institute (API), Anacor, Astellas, AstraZeneca, Bayer, Cem-pra, Cerexa, Contrafect, Cubist, Daiichi, Dipexium, Enanta, Furiex,GlaxoSmithKline, Johnson & Johnson (Ortho McNeil), LegoChem Bio-sciences Inc., Meiji Seika Kaisha, Merck, Nabriva, Novartis, Pfizer(Wyeth), Rempex, Rib-X Pharmaceuticals, Seachaid, Shionogi, The Med-icines Co., Theravance, and ThermoFisher. Some JMI employees are ad-visors/consultants for Astellas, Cubist, Pfizer, Cempra, Cerexa-Forest,J&J, and Theravance. With regard to speaker bureaus and stock options,there are none to declare. L.V.F. and J.N.S. are both employees and stock-holders of Cubist Pharmaceuticals.
REFERENCES1. Gould IM, Ansari A, Harvey G, Douglas JG, Smith CC, Reid TM. 1991.
Piperacillin/tazobactam in the treatment of serious acute soft tissue infec-tion. Drugs Exp. Clin. 17:187–190.
2. Chandorkar G, Huntington J, Parsons T, Gotfried M, Rodvold KA,Umeh O. 2012. Intrapulmonary penetration of ceftolozane/tazobactamand piperacillin/tazobactam in healthy adult subjects. J. Antimicrob. Che-mother. 67:2463–2469.
3. Strayer AH, Gilbert DH, Pivarnik P, Medeiros AA, Zinner SH, Dudley MN.1994. Pharmacodynamics of piperacillin alone and in combination with tazo-bactam against piperacillin-resistant and -susceptible organisms in an in vitromodel of infection. Antimicrob. Agents Chemother. 38:2351–2356.
4. Louie A, Castanheira M, Liu W, Grasso C, Jones RN, Williams G,Critchley I, Thye D, Brown D, Vanscoy B, Kulawy R, Drusano GL. 2012.Pharmacodynamics of �-lactamase inhibition by NXL104 in combinationwith ceftaroline: examining organisms with multiple types of �-lactamases.Antimicrob. Agents Chemother. 56:258 –270.
5. VanScoy B, Mendes RE, Nicasio AM, Castanheira M, Bulik CC, Oku-sanya OO, Bhavnani SM, Forrest A, Jones RN, Friedrich LV, Steenber-gen JN, Ambrose PG. 2013. Pharmacokinetics-pharmacodynamics of ta-zobactam in combination with ceftolozane in an in vitro infection model.Antimicrob. Agents Chemother. 57:2809 –2814.
6. Clinical and Laboratory Standards Institute. 2012. Methods for dilutionantimicrobial susceptibility tests for bacteria that grow aerobically. Ap-proved standard, 9th ed. CLSI document M07-A9. Clinical and LaboratoryStandards Institute, Wayne, PA.
7. Garrison MW, Vance-Bryan K, Larson TA, Toscano JP, Rotschafer JC.1990. Assessment of effects of protein binding on daptomycin and vanco-mycin killing of Staphylococcus aureus by using an in vitro pharmacody-namic model. Antimicrob. Agents Chemother. 34:1925–1931.
8. Akaike HA. 1979. Bayesian extension of the minimum AIC procedure ofautoregressive model fitting. Biometrika 66:237–242.
9. Craig WA, Andes DR. 2013. In vivo activity of ceftolozane, a new cepha-losporin, with and without tazobactam against Pseudomonas aeruginosaand Enterobacteriaceace, including strains with extended-spectrum �-lac-tamases, in the thighs of neutropenic mice. Antimicrob. Agents Che-mother. 57:1577–1582.
VanScoy et al.
5930 aac.asm.org Antimicrobial Agents and Chemotherapy
on Septem
ber 6, 2018 by guesthttp://aac.asm
.org/D
ownloaded from