Pharmacokinetics, metabolism and disposition of...
44
DMD 30833 1 Pharmacokinetics, metabolism and disposition of deferasirox in - thalassemia patients with transfusion-dependent iron overload who are at pharmacokinetic steady state Felix Waldmeier, Gerard J. Bruin, Ulrike Glaenzel, Katharine Hazell, Romain Sechaud, Steve Warrington, John B Porter Novartis Institutes for BioMedical Research, Drug Metabolism & Pharmacokinetics, CH-4002 Basel, Switzerland (F. W., G. J. B. ,U.G.,K. H., R. S.), and Hammersmith Medicines Research, Central Middlesex Hospital, London, United Kingdom (S. W.), and University College, London, United Kingdom (J. B. P.) DMD Fast Forward. Published on January 22, 2010 as doi:10.1124/dmd.109.030833 Copyright 2010 by the American Society for Pharmacology and Experimental Therapeutics. This article has not been copyedited and formatted. The final version may differ from this version. DMD Fast Forward. Published on January 22, 2010 as DOI: 10.1124/dmd.109.030833 at ASPET Journals on January 7, 2020 dmd.aspetjournals.org Downloaded from
Transcript of Pharmacokinetics, metabolism and disposition of...
DMD 30833
1
Pharmacokinetics, metabolism and disposition of deferasirox in β-thalassemia patients with transfusion-dependent iron overload who are at pharmacokinetic steady state Felix Waldmeier, Gerard J. Bruin, Ulrike Glaenzel, Katharine Hazell, Romain Sechaud, Steve Warrington, John B Porter
Novartis Institutes for BioMedical Research, Drug Metabolism & Pharmacokinetics, CH-4002 Basel, Switzerland (F. W., G. J. B. ,U.G.,K. H., R. S.), and
Hammersmith Medicines Research, Central Middlesex Hospital, London, United Kingdom (S. W.), and
University College, London, United Kingdom (J. B. P.)
DMD Fast Forward. Published on January 22, 2010 as doi:10.1124/dmd.109.030833
Copyright 2010 by the American Society for Pharmacology and Experimental Therapeutics.
This article has not been copyedited and formatted. The final version may differ from this version.DMD Fast Forward. Published on January 22, 2010 as DOI: 10.1124/dmd.109.030833
at ASPE
T Journals on January 7, 2020
dmd.aspetjournals.org
Dow
nloaded from
DMD 30833
2
a) Running title: human ADME of deferasirox
b) Corresponding Author: Dr. Felix Waldmeier Novartis Institutes for BioMedical Research - Drug Metabolism and Pharmacokinetics Novartis Campus, WSJ-210.4.20 Postfach CH-4056 Basel, Switzerland email: [email protected]
c) Number of text pages: 29 Number of tables: 4 Number of figures: 5 Number of references: 20 Number of words in Abstract: 224 Number of words in Introduction: 635 Number of words in Discussion: 1171
d) List of abbreviations: ADME Absorption, Distribution, Metabolism and Excretion AUC Area under the curve EDTA Ethylenediaminetetraacetic acid HPLC High Performance Liquid Chromatography LC-MS Liquid Chromatography-Mass Spectrometry LSC Liquid Scintillation Counting MBq MegaBequerel
This article has not been copyedited and formatted. The final version may differ from this version.DMD Fast Forward. Published on January 22, 2010 as DOI: 10.1124/dmd.109.030833
at ASPE
T Journals on January 7, 2020
dmd.aspetjournals.org
Dow
nloaded from
DMD 30833
3
Abstract Deferasirox (Exjade®, ICL670) is a novel once-daily, orally-administered iron chelator to
treat chronic iron overload in patients with transfusion dependent anemias. Absorption,
distribution, metabolism and excretion of [14C]deferasirox at pharmacokinetic steady state
was investigated in 5 adult β-thalassemic patients. Deferasirox 1000 mg was given orally
once daily for 6 days to achieve steady state. On day 7, patients received a single oral
1000 mg dose (~20 mg/kg) of [14C]deferasirox (2.5 MBq). Blood, plasma, feces and urine
samples collected over 7 days were analyzed for radioactivity, deferasirox, its iron
complex Fe-[deferasirox]2 and metabolites. Deferasirox was well absorbed. Deferasirox
and its iron complex accounted for 87% and 10% respectively of the radioactivity in
plasma (AUCss). Excretion occurred largely in the feces (84% of dose) and 60% of the
radioactivity in the feces was identified as deferasirox. Apparently unchanged deferasirox
in feces was partly attributable to incomplete intestinal absorption and partly to hepato-
biliary elimination of deferasirox (including 1st pass elimination) and of its glucuronide.
Renal excretion was only 8% of dose and included mainly the glucuronide M6. Oxidative
metabolism by CYP450 enzymes to M1 (5-OH deferasirox; presumably by CYP1A) and
M4 (5’-OH deferasirox; by CYP2D6) was minor (6% and 2% of the dose, respectively).
Direct and indirect evidence indicates that the main pathway of deferasirox metabolism is
via glucuronidation, to metabolites M3 (acyl glucuronide) and M6 (2-O-glucuronide).
This article has not been copyedited and formatted. The final version may differ from this version.DMD Fast Forward. Published on January 22, 2010 as DOI: 10.1124/dmd.109.030833
at ASPE
T Journals on January 7, 2020
dmd.aspetjournals.org
Dow
nloaded from
DMD 30833
4
Introduction In patients with transfusion-dependent anemias, toxic and potentially lethal levels of iron
accumulate over time. Man is unable to actively eliminate iron from the body, once it has
been acquired. Toxic and eventually lethal levels of iron accumulate as a result of repeated
transfusions, e.g. in ß-thalassemia major, or because of excessive dietary iron uptake in
anemias and hereditary hemochromatosis (Barton, 2007). The harmful effects of chronic iron
overload can lead to damage of the liver, heart, and endocrine glands, resulting in organ
compromise and death. For the last 40 years, deferoxamine (Desferal®) has been the standard
of care for removal of excess body iron. The poor oral bioavailability and the short plasma
half-live of Desferal® necessitate its administration as slow subcutaneous or intravenous
infusions. As a result the most common difficulty associated with long-term deferoxamine is
erratic compliance with therapy (Kushner et al., 2001). The need for an iron chelator which
can be given orally has been recognized for a long time.
Deferasirox (ICL670, Exjade®, Novartis Pharma AG, Basel, Switzerland) is a potent and
specific iron chelator, recently approved as first-line therapy for blood-transfusion-related iron
overload; it binds Fe3+ in a 2:1 ratio (Nick et al., 2002). The recommended initial daily dose is
20 mg/kg body weight, rounded to the nearest available tablet strength; the currently
recommended maximum dose is 30 mg/kg per day (Yang et al., 2007). Deferasirox is
administered orally as suspension after dispersion in water, or orange or apple juice; whereby
the degree of dispersion does not affect the bioavailability of deferasirox (Sechaud et al.,
2008a).
Pharmacokinetics, metabolism and disposition of deferasirox have been investigated in
mouse, rat, and marmoset using non-radiolabeled and 14C-radiolabeled deferasirox. The
disposition of deferasirox in rats has been published recently (Bruin et al., 2008). Generally,
This article has not been copyedited and formatted. The final version may differ from this version.DMD Fast Forward. Published on January 22, 2010 as DOI: 10.1124/dmd.109.030833
at ASPE
T Journals on January 7, 2020
dmd.aspetjournals.org
Dow
nloaded from
DMD 30833
5
orally dosed deferasirox was well absorbed, and peak plasma concentrations of deferasirox
and radioactivity (metabolites) were reached within 0.5-1 hour. Part of the dose was excreted
unchanged, mainly in the feces (via bile), and part was metabolized to an acyl glucuronide.
Four hydroxylated metabolites were formed by oxidative metabolism (phase I metabolism).
Those metabolites were subsequently metabolized to O-glucuronides or O-sulfates, and then
excreted, mainly via bile and feces. The metabolites were suspected to retain the ability to
form iron complexes. Therefore, the 3-hydroxy and the 5-hydroxy metabolites were
synthetized and administered to rats, but they were shown to contribute little to the iron
elimination (Bruin et al., 2008). In investigations in vitro, the oxidative metabolism of
deferasirox was found to be catalyzed mainly by the cytochrome P450 enzymes CYP1A1 and
CYP1A2. A minor metabolite was formed by CYP2D6 (Ref. data on file, see Bruin et al.
2008). In metabolism studies in vitro, the same metabolic pathways were observed in liver
microsomal fractions from several animal species and humans. On the basis of those studies,
the metabolism and disposition of deferasirox in humans were expected to be similar to those
observed in animals. However, that expectation required experimental confirmation; in
particular, it could neither be predicted for humans which metabolic pathways might be
quantitatively relevant, nor which would be the key elimination processes. Therefore, this
radiolabeled absorption, distribution, metabolism and excretion (ADME) study was done to
investigate the fate of deferasirox in human subjects, i.e. pharmacokinetics, mass balance and
metabolism of deferasirox, in order to define the biotransformation, transport, and clearance
mechanisms involved in the disposition of deferasirox. Commonly, human ADME studies are
done in healthy volunteers with administration of a single dose. In the present case, owing to
the iron elimination effect of Exjade®, it was deemed better to do the study in thalassemia
patients. That meant that patients under treatment with Desferal® had to switch treatment to
This article has not been copyedited and formatted. The final version may differ from this version.DMD Fast Forward. Published on January 22, 2010 as DOI: 10.1124/dmd.109.030833
at ASPE
T Journals on January 7, 2020
dmd.aspetjournals.org
Dow
nloaded from
DMD 30833
6
Exjade® and oral dosing had to be continued to achieve steady state, which is the ideal
scenario for a human ADME study.
This article has not been copyedited and formatted. The final version may differ from this version.DMD Fast Forward. Published on January 22, 2010 as DOI: 10.1124/dmd.109.030833
at ASPE
T Journals on January 7, 2020
dmd.aspetjournals.org
Dow
nloaded from
DMD 30833
7
Materials and Methods
Non-radioactive Deferasirox. Deferasirox (4-[3,5-bis-(2-hydroxy-phenyl)-[1,2,4]triazol-1-yl]-
benzoic acid, C21H15N3O4, molecular weight 373.4,) was synthesized at the Novartis Institute
for Biomedical research (NIBR), Basel, Switzerland.
14C-radiolabeled deferasirox. The radiolabeled drug [14C]deferasirox was synthesized by the
Isotope Laboratory of Novartis Pharma AG. The radiolabel was in the C-3 and C-5 positions of
the central triazole ring (see structure formula in Table 3). The parent batch was diluted down to
the final specific activity using a non-radiolabeled GMP drug substance batch, which had been
released for human use, and analyzed for release for human use according to predefined
specifications. Radiochemical purity was >98% with a specific radioactivity of 2.534 kBq/mg
(0.0684 µCi/mg).
Reference compounds and other materials. For comparison with metabolites, the following
reference compounds were synthesized by NIBR, Basel, Switzerland: 5-OH derivative of
deferasirox (M1); 5’-OH derivative of deferasirox (M4). Solvents and reagents, all of
analytical grade, were purchased from commercial manufacturers.
Pooled rat cryopreserved hepatocytes (product/lot no. M00005/PLD), and human
cryopreserved hepatocytes from a male donor (product/lot no. M00995/ENR) were purchased
from In Vitro Technologies (Baltimore, MD, USA). HepatoZYME-SFM medium and Hank’ s
balanced salt solution with Ca2+ or Mg2+ (10X, HBSS), were purchased from Gibco
(Invitrogen, Carlsbad, CA, USA). Percoll (colloidal polyvinylpyrrolidone-coated silica) was
obtained from GE Healthcare Bio-Sciences (Uppsala, Sweden).
This article has not been copyedited and formatted. The final version may differ from this version.DMD Fast Forward. Published on January 22, 2010 as DOI: 10.1124/dmd.109.030833
at ASPE
T Journals on January 7, 2020
dmd.aspetjournals.org
Dow
nloaded from
DMD 30833
8
Subjects and design of study. The study enrolled five patients (3 male, 2 female) with an age
range from 20 to 38 years, a body weight range from 50 to 81 kg and a height range from 153
to 165 cm. All five patients completed the study.
This was an open-label study in patients with β-thalassemia. They had received subcutaneous
Desferal® to treat transfusion-dependent iron overload. After screening, patients discontinued
Desferal® treatment for five days (iron chelation-free period, washout phase). Subsequently
the patients commenced 6 days’ treatment with oral deferasirox at a dose of 1000 mg/day
(about 20 mg/kg) once daily. The patients received a single oral nominal dose of 1000 mg
[14C]deferasirox (2.6 MBq, 70 µCi) on day 7 i.e. at steady-state (Nisbet-Brown et al., 2003).
Since the actual doses were within a minimal range and within weighing precision, the
nominal dose of 1000 mg was taken as a basis for mass balance calculation. The observation
and sample collection period (blood, plasma, urine and feces) was 168 h. Four of the five
patients continued to receive daily doses of standard deferasirox from day 8 to the end of the
study. For one patient the standard dose deferasirox was withheld for the rest of the study, but
his sample collection was also continued up to 168 h. At the end of the study all five patients
were switched back to parenteral Desferal®, as determined by the investigator.
Radiation protection. The radiation exposure of the patients was estimated prognostically,
based on the available animal ADME and human pharmacokinetics data and according to the
guidelines of the International Commission on Radiological Protection ICRP. The radiation
dose (whole body dose, “effective dose”) taken up by the patients was estimated at 0.89 mSv.
Radiation dosimetry calculations and the study protocol were approved by the UK
Administration of Radioactive Substance Advisory Committee ARSAC.
Ethics. The study was approved by the local ethics committee. The written informed consent
was obtained from each subject before enrolment.
This article has not been copyedited and formatted. The final version may differ from this version.DMD Fast Forward. Published on January 22, 2010 as DOI: 10.1124/dmd.109.030833
at ASPE
T Journals on January 7, 2020
dmd.aspetjournals.org
Dow
nloaded from
DMD 30833
9
Sample collection. Following a predose sample (0 hour) and radiolabeled dose
administration, blood samples were collected at 0.5, 1, 1.5, 2, 3, 4, 6, 8, 12, 24, 48, 72, 96,
120, 144, and 168 hours post-dose into heparinized tubes. Blood samples were taken by either
direct venipuncture or via an indwelling cannula inserted into a forearm vein. Sample volumes
per time point ranged from 5 to 12 mL. Three aliquots of 0.3 mL were removed and weighed
in counting vials for radioactivity determination in blood. The remaining blood was
centrifuged to obtain plasma for radioactivity determination, analysis of deferasirox and its
iron complex Fe-[deferasirox]2 (cold analysis), analysis of metabolite patterns and for
metabolite structure elucidation. Predose blank urine was collected on day 7 and predose
blank feces on day 5 or 6. After the radiolabeled dose, quantitative collections of urine were
done over the whole period from dosing to 168 h, in the time intervals 0-6, 6-12, 12-24, 24-
48, 48-72, 72-96, 96-120, 120-144, and 144-168 hours post-dose. All and complete feces
portions were collected over the period 0-168 h.
Sample storage and shipment conditions. After sample collection, blood, plasma, urine and
feces samples were frozen immediately and stored at ≤-18°C until and after analysis in the
analytical laboratories. Stability of deferasirox, of its iron complex and of the metabolites was
ascertained under those conditions. Samples were shipped to other analytical laboratories
under dry ice.
Analysis of deferasirox and its complex Fe-[deferasirox]2. Concentrations of the parent
drug deferasirox, deferasirox iron complex in plasma, and of total deferasirox (i.e. free ligand
and iron complex) in urine were measured quantitatively by a validated specific assay based
on HPLC with UV detection (Rouan et al., 2001). The lower limits of quantification (LLOQ)
in plasma were 1.34 µmol/L and 0.314 µmol/L for the deferasirox and deferasirox iron
complex, respectively. The LLOQ for deferasirox in urine was 0.670 µmol/L. The sample
This article has not been copyedited and formatted. The final version may differ from this version.DMD Fast Forward. Published on January 22, 2010 as DOI: 10.1124/dmd.109.030833
at ASPE
T Journals on January 7, 2020
dmd.aspetjournals.org
Dow
nloaded from
DMD 30833
10
volume was 100 µL for both plasma and urine. Measurements below the LOQ were not
considered in the calculation of means and were reported as zero.
In genuine plasma samples, it was shown that the Fe-[deferasirox]2 complex was stable in the
presence of an excess of deferasirox (Rouan et al., 2001). The Fe-[deferasirox]2 is stable at
neutral pH, whereas it tends to dissociate at acidic pH, therefore the HPLC was run with a
mobile phase of pH 7. Addition of the ion-pair reagent tetrabutylammonium hydrogen sulfate
allowed the separation of deferasirox and Fe-[deferasirox]2 complex. Further, the acetonitrile
content in the mobile phase was kept at only 10% and the methanol content at 48%, because
higher percentages of acetonitrile led to dissociation of the complex during the
chromatographic run.
Radioactivity analysis of blood, plasma, urine, and feces samples. Determination of 14C
radioactivity in blood, plasma, urine, and feces samples was done by Liquid Scintillation
Counting (LSC) with a typical counting time of 10 min using a Tri-Carb 2000CA liquid
scintillation counter (PerkinElmer Life and Analytical Sciences, Waltham, MA) at RCC Ltd.,
CH-4452 Itingen, Switzerland. Low levels in blood and plasma were counted for 30 min.
Blood and plasma samples (triplicates of 300 µL each, weighed) were counted after
solubilization. Feces samples (quadruplicates of 400 mg each, weighed) were counted after
combustion in a sample oxidizer. Urine samples (duplicates of 1 mL each) were measured
directly, after addition of scintillation cocktail (see below).
Radioactivity in pooled feces homogenates and in pellets from extractions for metabolism
investigations, were measured after solubilization with Soluene 350® (PerkinElmer Life and
Analytical Sciences) and addition of 4 mL of liquid scintillation cocktail OptiPhase®
“HiSafe”3® (PerkinElmer Life and Analytical Sciences). Urine samples, plasma samples and
feces extracts were measured directly after addition of 4 mL LSC cocktail using standard
This article has not been copyedited and formatted. The final version may differ from this version.DMD Fast Forward. Published on January 22, 2010 as DOI: 10.1124/dmd.109.030833
at ASPE
T Journals on January 7, 2020
dmd.aspetjournals.org
Dow
nloaded from
DMD 30833
11
counting procedures. Quench correction was done by the external standard method. The limit
of quantification LOQ for each matrix was calculated as described elsewhere (Jost et al.,
2006, Waldmeier et al., 2007). It was defined as the minimum number of disintegrations that
was statistically significantly above background and that showed a relative statistical
uncertainty ≤20%. The LOQ was 9 and 10 dpm for blood and plasma, respectively (counting
time 30 min), corresponding to concentrations of 0.5-0.6 µmol/L. For urine, the LOQ was 20
dpm (500 nmol, about 0.02% of the dose). For feces the LOQ was 17 dpm (200 nmol, about
0.01% of the dose).
Radioactivity analysis of collected HPLC fractions.
For HPLC radiochromatograms, 50 µL HPLC fractions (15 sec fractions) were collected into
Deepwell LumaplatesTM (PerkinElmer Life and Analytical Sciences) using a fraction collector
Gilson FC204 (Gilson Inc., Middleton, WI, USA). After evaporation of solvent in a Savant
Speedvac AES2010 (Savant Instruments Inc., Holbrook, NY, USA) the plates were counted in
a Packard Topcount NXTTM Microplate Scintillation & Luminescence Counter as described
previously (Bruin et al., 2006).
Sample preparation of plasma, urine and feces for metabolite investigation.
Semiquantitative determination of main and trace metabolites by radio-HPLC with offline
microplate solid scintillation counting and structural characterization by LC-MS was done in
plasma, urine and feces. Aliquots of 200 µL of plasma samples collected at 1.5, 4, 6, 8, 12 and
24 h after dosing were diluted 2-fold with 25 mM ammoniumformate with 2.5 mM EDTA,
pH 5.5, and centrifuged. Aliquots of 50 µL were analyzed for radioactivity by LSC. The
recovery was 100%. Volumes of 200 µL of the diluted plasma were injected into the HPLC.
The recovery of radioactivity after HPLC, in percent of the amount injected, was determined
in a separate run in which the whole eluent was collected. Recovery from HPLC was about
This article has not been copyedited and formatted. The final version may differ from this version.DMD Fast Forward. Published on January 22, 2010 as DOI: 10.1124/dmd.109.030833
at ASPE
T Journals on January 7, 2020
dmd.aspetjournals.org
Dow
nloaded from
DMD 30833
12
100%. From the urine collected over 72 h, aliquots were pooled per subject. The 0-72 h pools
represented 97%-100% of the total excreted radioactivity in urine in the time period 0-168 h.
The urine pools were centrifuged at 2860 g for 10 min. The recovery of radioactivity after
sample processing was 100%. Volumes of 200 μL of the undiluted urine pools were analyzed
by HPLC. The recovery of radioactivity from HPLC was around 100%. Feces pools were
prepared for each subject, combining the most important feces portions such that 97%-100%
of the total radioactivity excreted in feces in the period 0-168 h were included, i.e. feces
portions with marginal radioactivity contents were excluded to avoid dilution. About 2 g
pooled feces homogenate was extracted with 4 mL of acetonitrile/water (1:1; v/v), by shaking
gently for 30 min. Thereafter, the suspension was centrifuged for 20 min at 2700 g (Minifuge
RF, Heraeus, Sepatech, Osterode, Germany). The pellet was extracted once again with 2 mL
water acetonitrile/water (1:1; v/v) by shaking for 30 min followed by centrifugation. The
supernatants were combined and three aliquots of 200 µL were taken for determination of
radioactivity recovery, by LSC. The recovery was between 85 and 94% except for one subject
(67%). Volumes of 100 μL of the feces extracts were analyzed by HPLC. The recovery from
HPLC was 100%.
HPLC instrumentation for metabolite pattern analysis.
HPLC method. The HPLC system consisted of two HPLC micro pumps, model Jasco PU-
1580 (Jasco, Tokyo, Japan) with a high pressure gradient mixer (75 μL). Sample volumes
between 50 µL and 200 µL were injected manually. The chromatogram was monitored by
UV-detection at a wavelength of 235 nm. The software used was Jasco-Borwin, version 1.50
(Omnilab AG, Mettmenstetten, Switzerland). For profiling of metabolite patterns, samples
were analyzed on a 250 x 2 mm I. D. LiChrospher® 100-5 RP18 ec HPLC column (particle
size 5 µm, pore size 100 Å, endcapped; Macherey-Nagel, Oensingen, Switzerland), protected
This article has not been copyedited and formatted. The final version may differ from this version.DMD Fast Forward. Published on January 22, 2010 as DOI: 10.1124/dmd.109.030833
at ASPE
T Journals on January 7, 2020
dmd.aspetjournals.org
Dow
nloaded from
DMD 30833
13
by a 4 x 2 mm I.D. LiChrospher® 100-5 RP18 ec guard column (particle size 5 µm, pore size
100 Å endcapped: Macherey-Nagel) and maintained at 20°C in a column heater/chiller
(model 7955, Jones chromatography, Hengoed, Mid Glamorgan, UK). The components were
eluted with a gradient of 25 mM ammonium formate with 2.5 mM EDTA, pH 5.5 (mobile
phase A) and acetonitrile (mobile phase B) at a flow rate of 0.2 mL/min. HPLC fractions were
collected for offline radioactivity detection as described above.
Evaluation of HPLC data. The amounts of metabolites or parent drug in plasma or excreta
were derived from the radiochromatograms by dividing the radioactivity eluting from the
HPLC column, which is equal to radioactivity in original sample minus losses during sample
preparation and HPLC, by the relative peak area. Parent drug or metabolites were expressed
as micromolar concentrations in plasma or as percentage of dose in excreta. Those values are
only semiquantitative as compared with those determined by the validated quantitative HPLC-
UV assay. Under the conditions of sample preparation and under optimized HPLC conditions
for a complete separation of metabolites, with. mobile phase pH 5.5, acetonitrile as organic
modifier in the mobile phase, with long run times, and without ion-pair reagent, the iron
complex dissociated. The Fe-[deferasirox]2 complex could therefore not be measured by the
HPLC method used for the metabolite patterns, and the [14C]deferasirox peak included drug
substance that had been present in the form of the complex.
Structural characterization of metabolites. Urine pools, feces pool extracts, and
incubations of feces pool extracts and isolated metabolites from urine with β-
glucuronidase/arysulfatase were analyzed by LC-MS. HPLC analysis was as described above,
except that the mobile phase did not include EDTA. The HPLC effluent was split in a ratio of
about 1:3. A quarter of the effluent (50 µL/min) was directed into the electrospray LC-MS
interface of a Finnigan LCQ-Deca XP ion trap mass spectrometer (Thermo Electron Corp.,
This article has not been copyedited and formatted. The final version may differ from this version.DMD Fast Forward. Published on January 22, 2010 as DOI: 10.1124/dmd.109.030833
at ASPE
T Journals on January 7, 2020
dmd.aspetjournals.org
Dow
nloaded from
DMD 30833
14
San Jose, CA). The remaining effluent was directed into a flow-through Packard scintillation
Analyzer, 500TR series (PerkinElmer Life and Analytical Sciences). The electrospray
interface was operated with nitrogen as sheath gas at 150 psi. The transfer capillary
temperature was 270°C. The spray voltage was 4.8 kV. Positive ion mode spectra with in-
source fragmentation at 0, 25, 45 and 70 V were recorded. To protect the mass spectrometer
from non-volatile salts and other early eluting components, the divert valve before the LC-MS
interface was switched to waste during the first 2 minutes of each run.
Besides the use of LC-MS for structure characterization, isolated metabolite M7, urine and a
feces pool extract were treated enzymatically. To obtain enough metabolite M7 to be
characterized, 1 mL of a 0-6 h urine fraction was manually injected into the HPLC system
described below, which was essentially the same as for the metabolite patterns, but with an
HPLC column diameter of 4 mm and an online radioactivity detector (flow-through detector
Berthold 506 C-with a Z-500-U4M admix cell of 500 µL; Berthold, Wildbad, Germany)
Metabolite M7 (peak eluting at a retention time of about 35 min) was collected and the eluent
concentrated by evaporation (Eppendorf concentrator 5301, Vaudaux-Eppendorf,
Schönenbuch, Switzerland) under reduced pressure, to a final volume of about 100 µL. The
stability of the metabolite during isolation and evaporation was investigated by LC-MS of 30
µL of the collected and preconcentrated metabolite.
Volumes of 30 µL isolated and preconcentrated metabolite M7 or urine were subjected to
enzymatic cleavage at 37°C for 15.5 h with 10 µL crude enzyme mixture, containing ß-
glucuronidase/arylsulfatase from Helix pomatia (Roche Diagnostics, Mannheim, Germany) in
160 µL sodium acetate buffer at pH 5.12 (total incubation volume 200 µL). After incubation,
the incubate was centrifuged in a Desaspeed LC-1K at 9000 rpm for 15 min and evaporated to
This article has not been copyedited and formatted. The final version may differ from this version.DMD Fast Forward. Published on January 22, 2010 as DOI: 10.1124/dmd.109.030833
at ASPE
T Journals on January 7, 2020
dmd.aspetjournals.org
Dow
nloaded from
DMD 30833
15
a final volume of about 50 µL. Then, 50 µL 25 mM ammonium formate pH 5.3, was added
and 100 µL was analyzed by LC-MS with radioactivity detection.
A volume of 300 µL feces homogenate was mixed with 300 µL phosphate buffer at pH 5.2
and subjected to enzymatic cleavage at 37°C for 92 h with a 120 µL mixture of ß-
glucuronidase/arylsulfatase from Helix pomatia (total incubation volume 720 µL). After
incubation, analysis was as above.
Studies with cryopreserved rat and human hepatocytes. Cells were stored in liquid
nitrogen until use. Immediately before use, vials of hepatocytes (1mL) were thawed and
mixed with the serum free medium HepatoZYME-SFM, Percoll and 10X HBSS (18:9:1,
v/v/v). The cells were centrifuged at 173 g for 20 min at room temperature, and the pellet was
resuspended in HepatoZYME-SFM. The cell number and viability were determined by trypan
blue exclusion assay before drug incubations. [14C]Deferasirox was incubated at a
concentration of 50 µmol/L in 12-well plates containing human hepatocyte suspensions (1.2
million cells/mL, viability 62%) or rat hepatocyte suspensions (1.3 million cells/mL, viability
70%) in a gassed incubator (5% CO2) at 37°C for 3 h. Control samples without hepatocytes
were also run. In the samples taken at 3 h, the metabolic reactions were stopped by addition of
the same volume of acetonitrile/formic acid 95:5 (v/v). Samples were subsequently frozen for
at least 15 min at -20°C and then centrifuged at 20,000 g for 10 min at 4°C. The supernatants
were diluted 1:3 (v/v) with 25 mmol/L ammonium formate with 2.5 mmol/L EDTA, pH 5.6
for HPLC and LC-MS analysis.
Aliquot volumes up to 300 µL were analyzed by either HPLC or LC-MS coupled to online
radioactivity detection. All HPLC and LC-MS runs were done using an 1100 Agilent HPLC
system (Agilent Technologies, Waldbronn, Germany). Separation was achieved with the same
chromatographic conditions as described above. For online radioactivity detection with HPLC
This article has not been copyedited and formatted. The final version may differ from this version.DMD Fast Forward. Published on January 22, 2010 as DOI: 10.1124/dmd.109.030833
at ASPE
T Journals on January 7, 2020
dmd.aspetjournals.org
Dow
nloaded from
DMD 30833
16
and in parallel to mass spectrometry the effluent was mixed with 0.6-0.8 mL/min Rialuma
liquid scintillation cocktail (Lumac, Groningen, The Netherlands) before entering the
radiomonitor Flow Scintillation Analyzer, 500 TR series Packard (Perkin Elmer, Boston, MA,
USA, 100 µL flow cell). Mass spectrometric analysis was done using the same mass
spectrometer and similar mass spectrometric conditions as described above.
Enzymatic hydrolysis was achieved by incubation with β-glucuronidase/arylsulfatase as
described above. Alkaline hydrolysis was done in Borax-NaOH buffer (Fluka, Basel,
Switzerland) at pH 10 for 22 hours (37°C). Control incubations without the enzyme mixture
or the alkaline buffer were done to determine the stability of the sample over the incubation
time. Subsequently the samples were centrifuged and subjected to HPLC analysis with
radioactivity detection as described above.
Pharmacokinetic evaluation. Pharmacokinetic parameters were calculated using
noncompartmental methods. The apparent terminal half life t1/2λz was determined from the
slope of the regression line of ln(Ct) versus time t. For calculation of t1/2λz, blood and plasma
concentrations were used which were measured in the time period shown in the data tables.
The AUCt is the area under the concentration-time curve from time zero to the indicated time
point (typically last measurable time point), calculated by the linear trapezoidal method. AUC
is the area under the concentration-time curve from time zero to infinity, calculated as AUCt
+Ct·t1/2λz/ln2 where Ct is the concentration at time t of last measurable concentration.
Descriptive statistical evaluation of pharmacokinetic parameters included means and SD.
The binding of total radioactivity in whole blood to red blood cells (RBC) was calculated as
FRBC (%) = 100 ·[1-[CP⋅(1-H)/Cb] ] /H (Hinderling 2009), where FRBC (%) is the fraction of
total radioactivity bound to RBC, CP is the concentration of radioactivity in plasma, measured
This article has not been copyedited and formatted. The final version may differ from this version.DMD Fast Forward. Published on January 22, 2010 as DOI: 10.1124/dmd.109.030833
at ASPE
T Journals on January 7, 2020
dmd.aspetjournals.org
Dow
nloaded from
DMD 30833
17
at day 8 at 24 h after radiolabeled dose administration, Cb is the concentration of radioactivity
in whole blood, measured at day 8 at 24 h after radiolabeled dose administration and H is the
hematocrit, determined at day 8 at 24 h after radiolabeled dose administration.
This article has not been copyedited and formatted. The final version may differ from this version.DMD Fast Forward. Published on January 22, 2010 as DOI: 10.1124/dmd.109.030833
at ASPE
T Journals on January 7, 2020
dmd.aspetjournals.org
Dow
nloaded from
DMD 30833
18
Results
Safety and tolerability. All five enrolled patients completed the study with no serious
adverse events. On days 8-9 of the study (1-2 days after the last dose of deferasirox) three of
the five patients developed a maculopapular skin rash, two of mild and one of moderate
severity. The skin rash in two of these patients was accompanied by mild pruritus. The two
remaining patients experienced mild pruritus without an accompanying skin rash. These
adverse events were suspected to be related to study drug and had either resolved or improved
by the end of the study. Headaches in 2 out of 5 patients, leg pain and dyspepsia (all of mild
severity) were also suspected to be drug related. All adverse events which were not suspected
to be drug related were of mild severity.
Pharmacokinetics in plasma.
Before administration of a single oral dose of [14C]deferasirox, the treatment of the patients
was switched from i.v. Desferal® to once daily oral dosing with deferasirox to
pharmacokinetic steady state Steady state was reached by day 7 according to Nisbet-Brown et
al. (2003). At time 0 on the day of radiolabeled dose administration, “cold” deferasirox was
present in plasma at trough levels of approximately 20 µmol/L, as determined by a
quantitative HPLC-UV assay. Further, by a separate, specific, radioactivity-based assay, the
plasma levels of [14C]deferasirox were determined after radiotracer dose administration. The
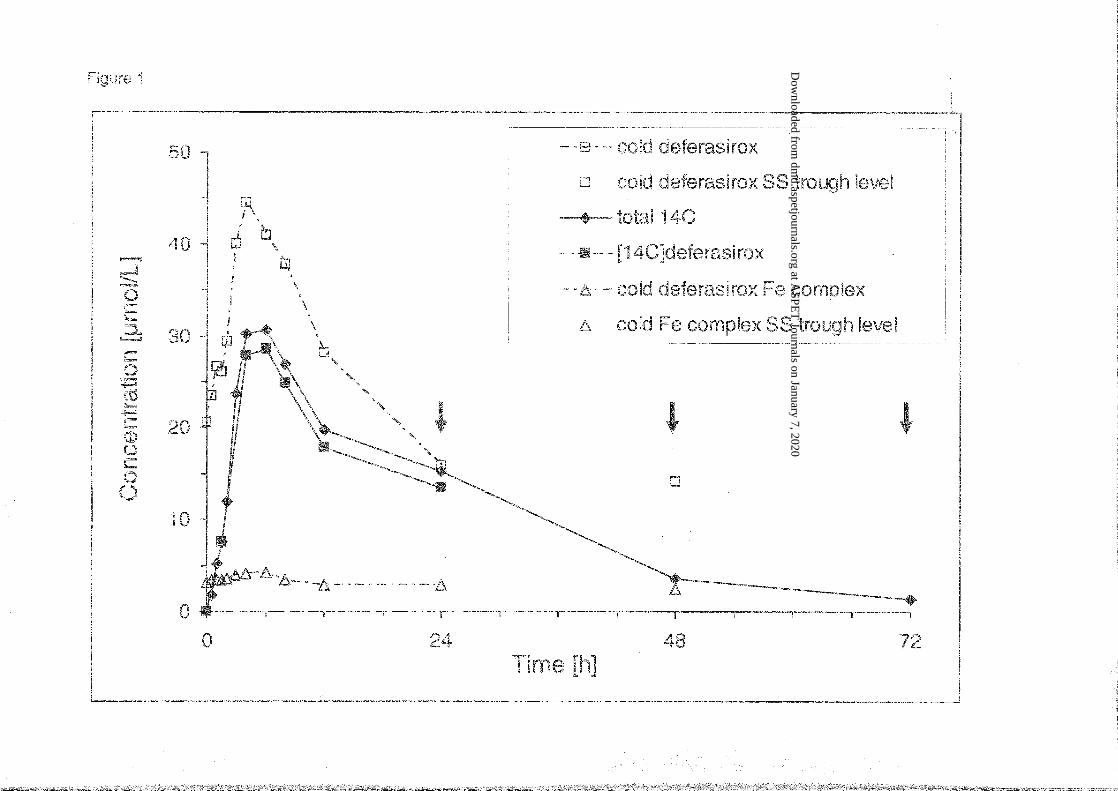
combined measurements (means) are depicted in Figure 1. The tmax values were very similar
for cold and radiolabeled deferasirox as well as for total radioactivity, with medians in the
range from 4-6 h (Table 1), indicating a rather slow absorption. In two patients, a second,
lower maximum or shoulder was observed at 24 h after dose, which probably indicates some
enterohepatic recirculation of deferasirox.
This article has not been copyedited and formatted. The final version may differ from this version.DMD Fast Forward. Published on January 22, 2010 as DOI: 10.1124/dmd.109.030833
at ASPE
T Journals on January 7, 2020
dmd.aspetjournals.org
Dow
nloaded from
DMD 30833
19
Radioactivity in plasma was detected typically for 72 h after dose, in one subject up to 120 h.
Elimination of radioactivity from blood and plasma, and of cold and radiolabeled deferasirox
from plasma showed very similar mean half-lives of about 9.5 h (Table 1). Further, Figure 1
shows that concentrations of radioactivity and [14C]deferasirox were closely similar.
Concentrations of the deferasirox iron complex in plasma at steady state, determined by a
quantitative cold LC-UV assay, were low and showed no important time-dependent variation.
No elimination half-life could be determined. Blood and plasma concentrations were subject
to substantial inter-individual variability. The SD data (Table 1) indicate that CV was
typically in a range from 40 to 60%.
Based on comparison of blood and plasma data, the radioactivity, which included deferasirox,
the iron complex and metabolite M3, was largely present in plasma. The mean radioactivity
AUC ratio blood vs. plasma was 0.61 (Table 1). The distribution into red blood cells
amounted to about 11%, which is similar to previous findings (Weiss et al., 2006).
Within the available data set (Table 1) it is interesting to compare AUC24h for various analytes
at steady state, and further to compare them with the AUC(0-∞) for the single radiolabeled
dose. As can be seen, the data were very consistent:
1. Comparison of the steady state AUC24h (AUCss) of cold deferasirox vs. single dose
radioactivity AUC showed a proportion of 87% (Table 1). Further, the AUC24h of the
complex (containing 2 molecules of deferasirox) accounted for about 10% of the plasma
radioactivity AUC. Thus the sum of the steady state AUCss of deferasirox and of the iron
complex approximately equals to the total radioactivity AUC.
This article has not been copyedited and formatted. The final version may differ from this version.DMD Fast Forward. Published on January 22, 2010 as DOI: 10.1124/dmd.109.030833
at ASPE
T Journals on January 7, 2020
dmd.aspetjournals.org
Dow
nloaded from
DMD 30833
20
2. The AUC24h of [14C]deferasirox accounted for 91% of the radioactivity AUC24h (Table 1,
Figure 1), indicating that minimal amounts of metabolites were present in the blood, apart
from the iron complex.
3. The accumulation factor of deferasirox was 1.60, determined as the ratio of deferasirox
AUC24h : [14C]deferasirox AUC24h (Table 1). It has to be noted that the analysis for
[14C]deferasirox included the iron complex. Thus with correction for the complex, the
accumulation factor was 1.97. This accumulation ratio was in the same range as observed
in previous studies (Piga et al., 2006; Yang et al., 2007; Nisbet-Brown et al., 2003).
4. Further, in theory, AUCss of deferasirox and AUC of [14C]deferasirox should be equal. A
ratio of 1.09 was found. However, if the AUC of [14C]deferasirox is corrected for the
proportion of complex, the ratio is about 0.90.
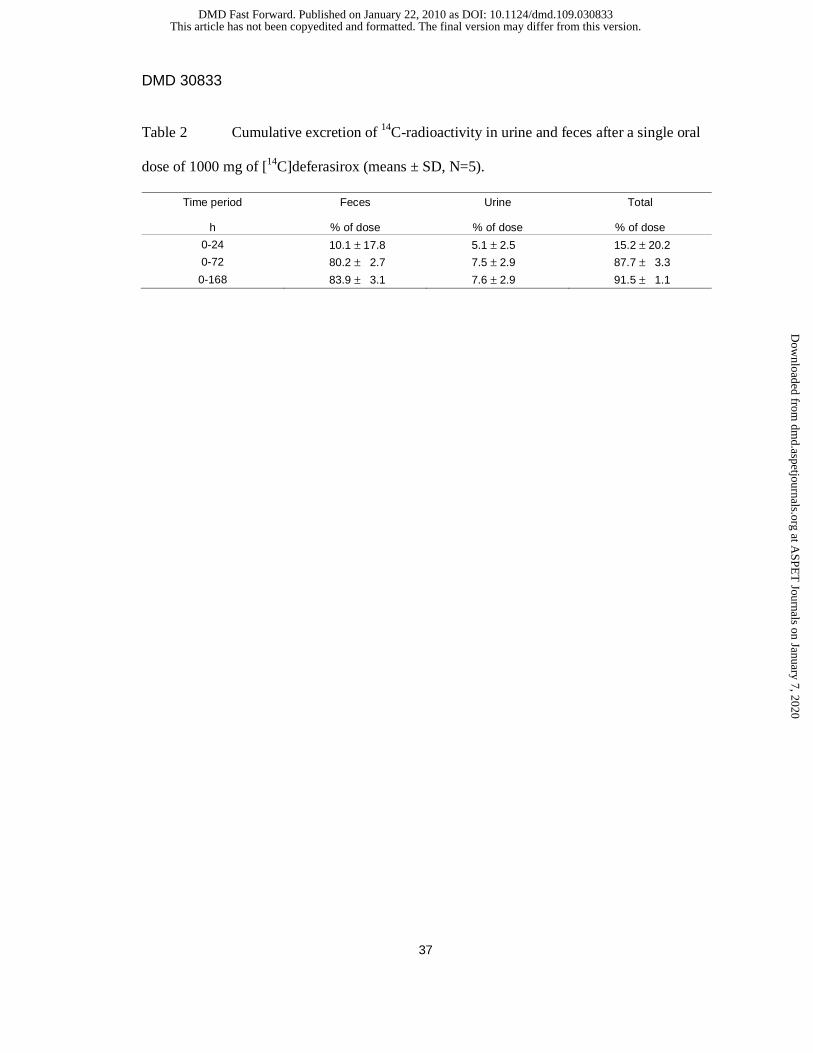
Excretion and mass balance in feces. Radiolabeled material was excreted largely in the
feces (range 78.5 – 86.9% over seven days; Table 2). A minor proportion was excreted in
urine with small interindividual variability (range 3.4 – 11.7% over seven days). As a result,
the mean total recovery in excreta over seven days was 91.5% (range 90.2 – 92.7%).
Metabolite characterization. The structures of the metabolites of [14C]deferasirox were
characterized by LC-MS with electrospray ionization in the positive ion mode. In-source
fragmentation was used to generate fragment ions.
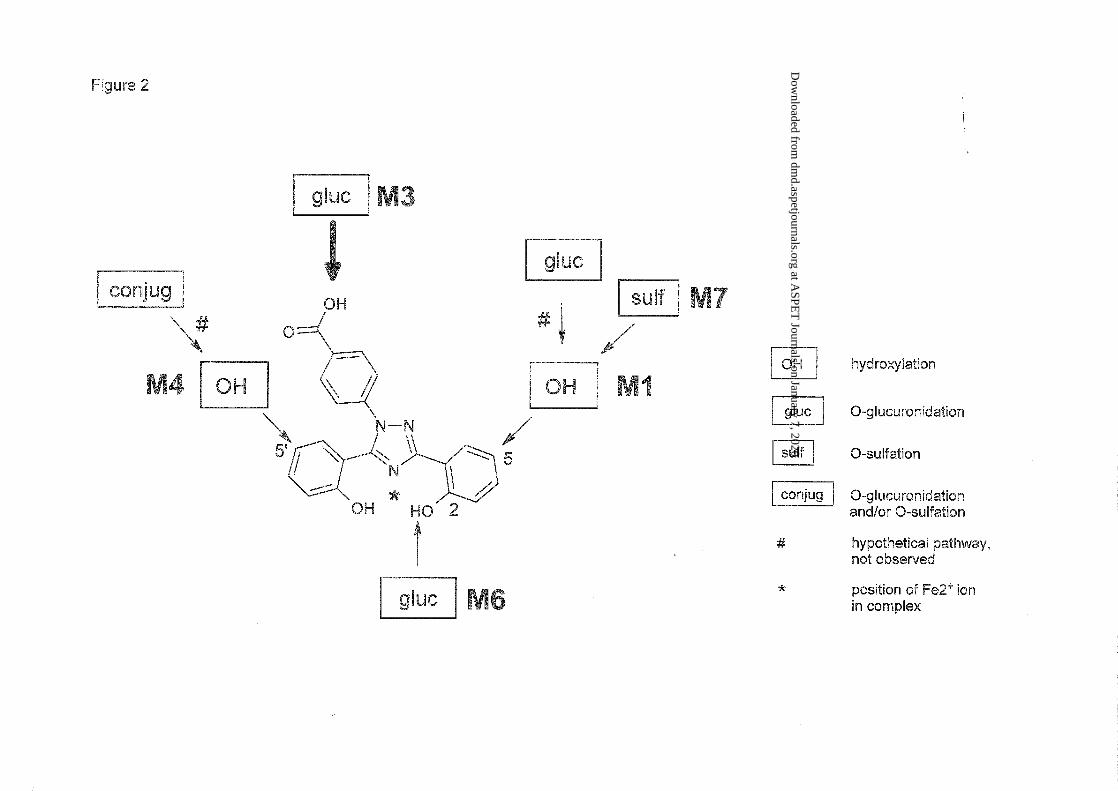
Hydroxy metabolites. The mass spectra of M1 and M4 in feces yielded mainly the molecular
ion signal at m/z 390 (see Table 3), an increase of 16 mass units compared with the [M+H]+
peak in the mass spectrum of deferasirox. That suggested the introduction of one oxygen atom
at an unknown position. The structures of the metabolites M1 and M4 (Figure 2) were
identified by comparison of retention times and mass spectra with those from the respective
reference compounds NVP-AHN496 and NVP-AHN497, and with the metabolites identified
This article has not been copyedited and formatted. The final version may differ from this version.DMD Fast Forward. Published on January 22, 2010 as DOI: 10.1124/dmd.109.030833
at ASPE
T Journals on January 7, 2020
dmd.aspetjournals.org
Dow
nloaded from
DMD 30833
21
in rat samples using detailed two-dimensional NMR analysis (Bruin et al., 2008). Two other
possible hydroxylated metabolites M2 (3-OH) and M5 (3’-OH; numbering see structure
formula in Table 3), known from several animal ADME studies, were not observed (Bruin et
al., 2008).
Glucuronide conjugates. The mass spectra of metabolites M3 and M6 in urine showed the
protonated intact molecule at m/z 550 (see Table 3). A key fragment (m/z = 374, which equals
m/z of protonated unchanged parent drug) showed the loss of a glucuronic acid moiety (-176
amu) in the MS spectrum of M3 and M6 and thus indicated the glucuronidation of unchanged
deferasirox. Experiments in urine showed the disappearance of M3 and M6 after incubation
with a β-glucuronidase/arylsulfatase enzyme mixture from Helix pomatia. Comparison of the
retention time of the glucuronide peak of about 29 minutes in this study with the retention
time of the elucidated phenol O-glucuronide in urine from mice in a previous mouse ADME
study confirmed M6 as the 2-O-glucuronide with conjugation in the phenol ring attached to
the 3-position in the triazole ring (numbering see structure formula in Table 3). The instability
of M3 observed at pH 10, and comparison of M3 in LC/MS with the acyl glucuronide
identified in the rat ADME study (Bruin et al., 2008) confirmed that M3 was the acyl
glucuronide of deferasirox. In the selected ion chromatograms at m/z 550, two additional
peaks that closely migrated with the M3 peak were found. Those two additional peaks were
not detectable in the radiochromatograms of urine. They probably represent rearranged acyl
glucuronides by intramolecular transesterification within the glucuronic acid moiety
(Shipkova et al., 2003). “Acyl migration” in M3 was also observed in a previous rat ADME
study (Bruin et al., 2008).
Sulfate conjugates. The mass spectrum of metabolite M7 present in feces in the positive ion
mode yielded the molecular ion signal at m/z 470 with the main fragment at m/z 390 after the
This article has not been copyedited and formatted. The final version may differ from this version.DMD Fast Forward. Published on January 22, 2010 as DOI: 10.1124/dmd.109.030833
at ASPE
T Journals on January 7, 2020
dmd.aspetjournals.org
Dow
nloaded from
DMD 30833
22
loss of 80 amu (see Table 3). That is an indication of sulfate conjugation of one of the
hydroxylated metabolites. M7, which was present in feces of four out of five subjects,
disappeared after incubation with β-glucuronidase/sulfatase with simultaneous formation of
the hydroxy metabolites M1. Therefore, M7 was identified as a sulfate conjugate of M1 (see
Figure 2). Mass spectrometric investigation of urine also showed the presence of a sulfate
conjugate of a hydroxylated metabolite. Cleavage experiments with the sulfate conjugate
isolated from urine showed that it was the same sulfate conjugate M7.
Despite the somewhat different retention times of M7 in urine and feces, the analysis of a
mixture of a urine sample and a feces sample extract confirmed that M7 represented the same
conjugated metabolite in both matrices. Only one peak representing sulfate conjugate was
observed, both in the radiochromatogram and in the selected ion chromatogram at m/z 470.
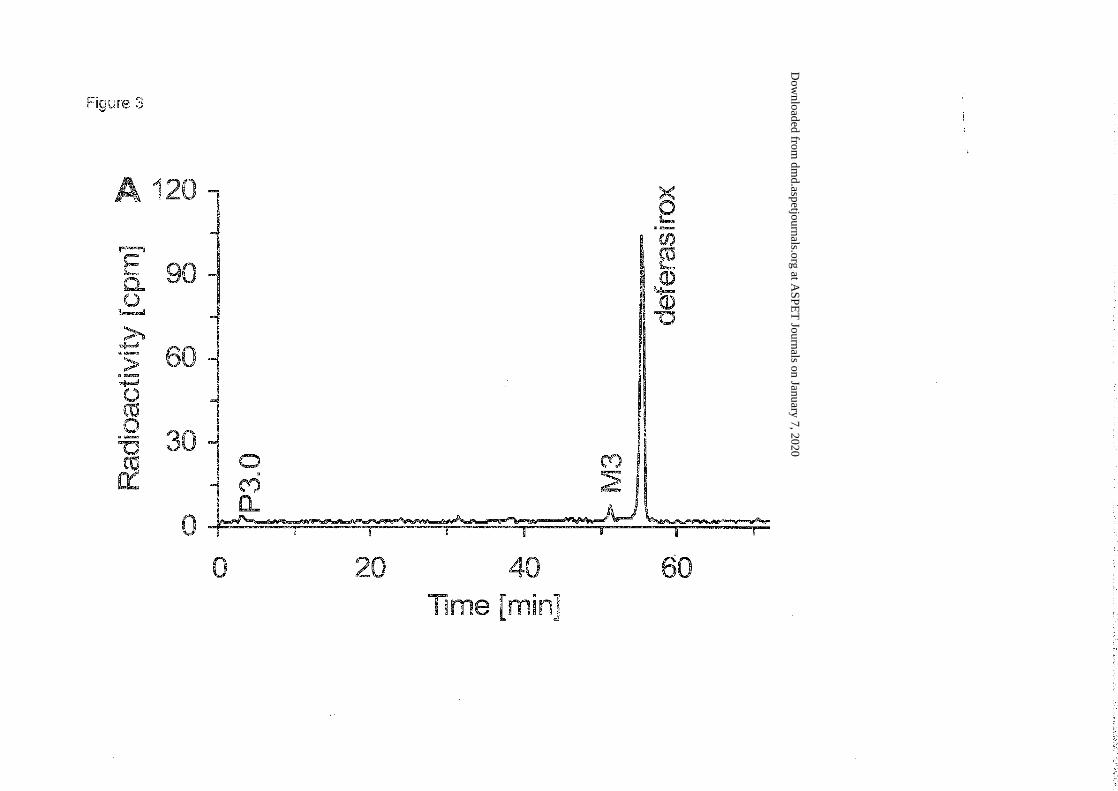
Metabolite patterns. Most of the radioactivity in plasma was associated with unchanged
deferasirox as can be seen in the chromatogram in Figure 3. The deferasirox peak includes
deferasirox involved in complex formation (under the conditions of the analytical system the
complex dissociates and cannot be measured). Systemic exposure to metabolites was minimal.
Based on molecular mass and comparison with reference material, M3 was identified as the
acyl glucuronide metabolite of deferasirox. No essential difference was observed between
patients. The mean plasma AUC24h
of M3 accounted for 3.3% of that of total radioactivity.
Metabolite patterns in pooled feces showed that a large dose fraction in feces was recovered
as unchanged deferasirox. As with plasma, the deferasirox peak includes deferasirox involved
in complex formation (under the conditions of the analytical system the complex dissociated
and could not be measured). Based on LC-MS, enzymatic incubations and comparison with
reference material, M1, M3, M4, M6 and M7 were identified. There was no evidence of
important interindividual differences in metabolism or elimination processes. Metabolite
This article has not been copyedited and formatted. The final version may differ from this version.DMD Fast Forward. Published on January 22, 2010 as DOI: 10.1124/dmd.109.030833
at ASPE
T Journals on January 7, 2020
dmd.aspetjournals.org
Dow
nloaded from
DMD 30833
23
occurrence in urine and feces is summarized in Table 4. The data show moderate
interindividual variability.
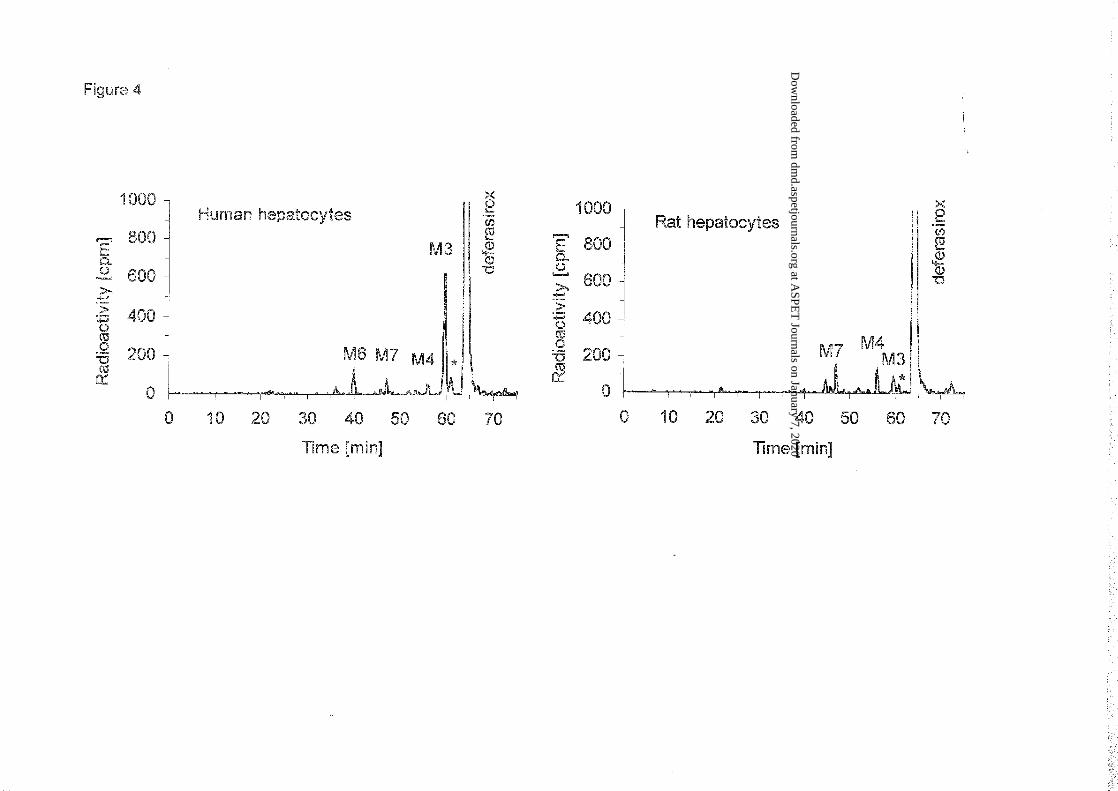
Metabolism in human and rat hepatocytes in vitro: In human hepatocytes [14C]deferasirox
was predominantly metabolized to the acyl glucuronide (M3) by glucuronidation at the
carboxylic acid moiety (Figures 2 and 4). That is in line with the levels of this metabolite in
the systemic circulation, as reflected in plasma samples from the human in vivo study. In rat
hepatocytes the formation of the acyl glucuronide (M3) was an important but not
predominant pathway (Figure 4).
In both species additional metabolic reactions of [14C]deferasirox were detected: (i) aromatic
hydroxylation followed by subsequent sulfate conjugation yielding metabolite M7 (5-O-
sulfate conjugate of M1), (ii) aromatic hydroxylation forming metabolite M4 (5’-hydroxy
metabolite of deferasirox). Phenolic glucuronidation with formation of metabolite M6 (2-O-
glucuronide) was detected only in incubations with human hepatocytes. The formation of the
acyl glucuronide of deferasirox was followed by subsequent migration of the acyl group from
hydroxy position 1 to positions 2, 3 or 4 of the glucuronic acid moiety yielding respective
positional isomers of M3 (e.g. M3’).
In addition to comparison of retention times and mass spectra (as described before) the acyl-
glucuronidation was further confirmed in human hepatocyte incubations by enzymatic and
alkaline hydrolysis. The disappearance of M3 and M6 but not of M3’ was observed during
incubation of the sample with a β-glucuronidase/arylsulfatase enzyme mixture from Helix
pomatia. At pH 10, M3 and M3’ were unstable but not M6. Therefore, it was concluded that
M3 is the acyl glucuronide. M3’ is probably an isomer of M3 formed by rearrangement of the
acyl glucuronide by intramolecular trans-esterification (Shipkova et al., 2003).
This article has not been copyedited and formatted. The final version may differ from this version.DMD Fast Forward. Published on January 22, 2010 as DOI: 10.1124/dmd.109.030833
at ASPE
T Journals on January 7, 2020
dmd.aspetjournals.org
Dow
nloaded from
DMD 30833
24
Discussion
Absorption. From the results of this study, the absorbed dose proportion cannot be derived:
renal excretion was low, there was little phase I metabolism, and hepato-biliary elimination of
deferasirox, of iron complex and of conjugates could not be measured, since no bile samples
were obtained. In a clinical study in healthy volunteers, a mean oral absolute bioavailability of
the final market image tablet formulation used in clinical studies was 70% (90% CI: 62% -
80%) relative to an intravenous dose (Sechaud et al., 2008b). Thus, it is concluded that the
gastro-intestinal absorption was at least 70 % if not close to complete. For comparison, the
absorption in rats was 75% (Bruin et al., 2008).
Based on the tmax values of 4-6 hours observed in this study, the absorption process after
dosing with a powder suspension formulation was slower than with the established cold drug
substance form (tablet suspension; tmax 1-2 h) (Sechaud et al., 2008a). The composition of the
formulations was the same for radiolabeled powder as for non-radiolabeled tablet. It is
unknown whether there might have been any differences in the physico-chemical properties of
the drink suspensions formed in water. In a separate clinical study, it was shown that the
degree of dispersion neither affected bioavailability of deferasirox nor tmax (Sechaud et al.,
2008a).
Pharmacokinetics in plasma. The observed AUC values for deferasirox and the complex
(single dose and steady state) were similar to those reported previously for the same dose
level (20 mg/kg) (Piga et al., 2006, Nisbet-Brown et al., 2003).
In two of the five patients, the concentration-time curves in plasma showed a second, small
concentration peak or ‘shoulder’ at 24 h after dose (approximately half of Cmax). That
observation suggests some enterohepatic recirculation of deferasirox. That is consistent with
This article has not been copyedited and formatted. The final version may differ from this version.DMD Fast Forward. Published on January 22, 2010 as DOI: 10.1124/dmd.109.030833
at ASPE
T Journals on January 7, 2020
dmd.aspetjournals.org
Dow
nloaded from
DMD 30833
25
previous observation in rats (Bruin et al., 2008) and results in other clinical studies (Galanello
et al., 2008, Sechaud et al., 2008a, Sechaud et al., 2008b). The extent of recycling cannot be
determined from the available human data.
The predominant radiolabeled component in plasma was deferasirox (about 90% of AUC).
Thus systemic exposure was largely to deferasirox. Exposure to the deferasirox iron complex
was 9 times lower. Metabolite M3 concentrations were minimal in systemic circulation (3%
of the 14C-AUC), but M3 is assumed to have been an important terminal metabolite in the bile
(see below).
Biotransformation. The extent and role of metabolism in the disposition of deferasirox can
be assessed only from the metabolites in excreta, which represent the final result of drug
elimination. However, in feces only phase I metabolites were found, with one minor
exception. In the gut lumen, glucuronides are hydrolyzed by intestinal and/or microbial
enzymes, leading to release of deferasirox or of the phase I metabolites, which are finally
recovered in the feces. Therefore, without investigation of human bile, the eliminated
glucuronides escape detection, and the total amount of all metabolites formed and eliminated
with bile cannot be determined, and the fecal metabolite balance substantially underestimates
the true extent of metabolism. Most importantly, the acyl glucuronide of deferasirox (M3) is
suspected to be formed in the liver and eliminated via bile as a main metabolite. This is based
on two findings:
i) In complementary investigations in human hepatocytes, glucuronidation, particularly with
formation of the acyl glucuronide (metabolite M3), was the major pathway, whereas in rat
hepatocytes the formation of M3 was less important (Figure 4).
This article has not been copyedited and formatted. The final version may differ from this version.DMD Fast Forward. Published on January 22, 2010 as DOI: 10.1124/dmd.109.030833
at ASPE
T Journals on January 7, 2020
dmd.aspetjournals.org
Dow
nloaded from
DMD 30833
26
ii) In rats in vivo, M3 was the predominant metabolite in bile after oral and intravenous
administration of [14C]deferasirox (Bruin et al., 2008).
The combined results suggest that more M3 may be formed in human than in the rat, and that
M3 is in fact the main human metabolite. It should be added that M3 retains the structural
elements and capability to form an iron complex, and therefore might contribute to the
elimination of iron via bile.
According to the above considerations, the dose fraction of about 60 % excreted in the feces
as unchanged deferasirox should not be misinterpreted as indicating low absorption or direct
elimination. Unchanged deferasirox in feces includes most likely (i) a small, unabsorbed
fraction of the oral dose, (ii) deferasirox which was eliminated via bile, or secreted via gut
wall, partly due to 1st pass elimination, (iii) the deferasirox glucuronides M3 and M6, which
were eliminated via bile and deconjugated in the gut lumen.
CYP450-catalyzed metabolism. CYP450-catalyzed, oxidative metabolism of deferasirox
appears not to be important in human, as only 6% of dose was recovered in the form of the
hydroxylated metabolites M1 and M7, and 2 % as M4. M1 is formed by CYP1A, and M4 by
CYP2D6 (H. J. Einolf, R. Peter, L. Schofield, J. Chin, M. Shapiro, and H. Yin, unpublished
data, Novartis). Therefore, neither inhibition nor induction of those enzymes by
comedications, nor genetic polymorphism (e.g. CYP2D6 poor metabolizer status) would be
expected to significantly affect the pharmacokinetics of deferasirox.
Deferasirox weakly inhibited CYP activities with IC50 values ranging from 100 to >500
µmol/L (H. J. Einolf, R. Peter, L. Schofield, unpublished data, Novartis). Given the relatively
high therapeutic levels up to 50 µM at steady-state, deferasirox might be suspected to inhibit
CYP2C8, CYP1A2, CYP3A4/5, CYP 2A6 or CYP2C9, and thus to interact with other drugs.
This article has not been copyedited and formatted. The final version may differ from this version.DMD Fast Forward. Published on January 22, 2010 as DOI: 10.1124/dmd.109.030833
at ASPE
T Journals on January 7, 2020
dmd.aspetjournals.org
Dow
nloaded from
DMD 30833
27
Though with the very high plasma protein binding of >99.5% (Weiss et al., 2006), significant
inhibition by deferasirox is unlikely.
Mass balance. The recovery of radioactivity was incomplete after 7 days, with a mean total
excretion of 91.5 ± 1.1% of dose. At study end, daily excretion amounted to <0.2% of dose. It
cannot be excluded that a dose proportion of about 8% remains retained in some organ(s) for a
longer period, and is eliminated very slowly. Based on organ distribution studies in rats, it
appears likely that some residual radioactivity remained in the skin.
Elimination. From the study results and complementary data, we conclude that deferasirox is
eliminated mainly by hepatic glucuronidation and hepato-biliary transport. Elimination by
CYP enzyme catalyzed hepatic phase I metabolism appears to contribute to a small extent.
The elimination process is probably an anion transport, as deferasirox and all metabolites are
anions, with one or two negative charges. In vitro strudies with human Caco-2 cell
monolayers showed that deferasirox is a substrate of the anion transporter MRP2 (G.
Camenisch, unpublished data, Novartis). Further, studies in transport-deficient rats showed
that mrp2 is involved in the hepato-biliary elimination of deferasirox and of the glucuronide
M3 (Bruin et al., 2008). Since this transport system is well conserved across species (Cui et al,
1999; Bleasby et al, 2006), we conclude that the human MRP2 is involved in the elimination
of deferasirox as well as its conjugated metabolites. The transporter that eliminates some
deferasirox metabolites into the sinusoidal blood, from where it will be finally excreted via
kidney, has not been investigated. A likely transporter is the basolateral Mrp3 (Bruin et al.,
2008).
This article has not been copyedited and formatted. The final version may differ from this version.DMD Fast Forward. Published on January 22, 2010 as DOI: 10.1124/dmd.109.030833
at ASPE
T Journals on January 7, 2020
dmd.aspetjournals.org
Dow
nloaded from
DMD 30833
28
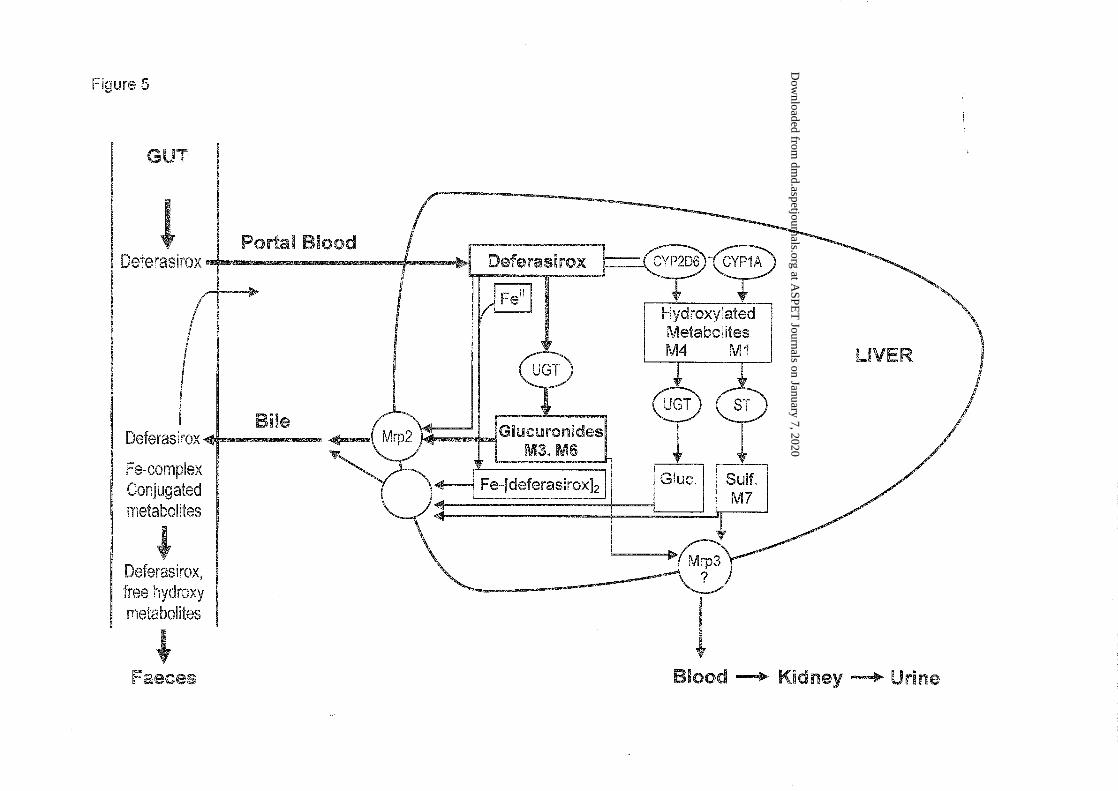
The results of this study and complementary data are compiled in Figure 5 which is a
schematic summary of the observed and/or proposed metabolism and elimination processes in
liver and gut.
This article has not been copyedited and formatted. The final version may differ from this version.DMD Fast Forward. Published on January 22, 2010 as DOI: 10.1124/dmd.109.030833
at ASPE
T Journals on January 7, 2020
dmd.aspetjournals.org
Dow
nloaded from
DMD 30833
29
Acknowledgments
The authors acknowledge the valuable clinical support by Dr. Farrukh Shah (Whittington
Hospital NHS Trust, London), the sample analysis for drug levels by Dr. Stephane Delage
(Novartis SA, Rueil-Malmaison, France), and the excellent technical assistance in metabolite
analysis by Daniel Pierroz and Agnes Holler (Novartis, Basel). We also thank Lesley
Schofield and Drs. Heidi Enolf, Raimund Peter and Gian Camenisch for providing results
from CYP interaction and transporter studies, and for helpful discussions.
This article has not been copyedited and formatted. The final version may differ from this version.DMD Fast Forward. Published on January 22, 2010 as DOI: 10.1124/dmd.109.030833
at ASPE
T Journals on January 7, 2020
dmd.aspetjournals.org
Dow
nloaded from
DMD 30833
30
References
Barton JC (2007) Optimal management strategies for chronic iron overload.
Drugs 67:685-700
Bleasby K, Castle JC, Roberts CJ, Cheng C, Bailey WJ, Sina JF, Kulkarni AV, Hafey MJ,
Evers R, Johnson JM, Ulrich RG, Slatter Jg (2006) Expression profiles of 50 xenobiotic
transporter genes in humans and pre-clinical species: A resource for investigations into
drug disposition. Xenobiotica 36:963-988
Bruin GJM, Waldmeier F, Boernsen KO, Pfaar U, Gross G, Zollinger M (2006) A microplate
scintillation counter as a radioactivity detector for high performance liquid chromatography
in drug metabolism : validation and applications. J. Chromatogr. A 1133:184-194
Bruin GJM, Faller F, Wiegand H, Schweitzer A, Nick H, Schneider J, Boernsen KO,
Waldmeier F (2008) Pharmacokinetics, Distribution, Metabolism and excretion of
deferasirox and its iron complex in rats. Drug Metab Dispos 36:2523-2538
Cui Y, König J, Buchholz U, Spring H, Leier I, Keppler D (1999) Drug resistance and ATP-
dependent conjugate transport mediated by the apical multidrug resistance protein, MRP2,
permanently expressed in human and canine cells. Molecular Pharmacology 55;929-937
Galanello R, Piga A, Cappellini MD, Forni GL, Zappu A, Origa R, Dutreix C, Belleli R, Ford
JM, Rivière GJ, Balez S, Alberti D, Séchaud R (2008) Effect of food, type of food, and
time of food intake on deferasirox bioavailability: recommendations for an optimal
deferasirox administration regimen. J Clin Pharmacol 48:428-35.
Hinderling PH (2009) Red blood cells: A negelcted compartment in pharmacokinetics and
pharmacodynamics. Pharmacological Reviews 49:279-295.
This article has not been copyedited and formatted. The final version may differ from this version.DMD Fast Forward. Published on January 22, 2010 as DOI: 10.1124/dmd.109.030833
at ASPE
T Journals on January 7, 2020
dmd.aspetjournals.org
Dow
nloaded from
DMD 30833
31
Jost LM, Gschwind H-P, Jalava T, Wang, Y, Guenther C, Souppart C, Rottmann A, Denner
K, Waldmeier F, Gross G, Masson E, Laurent D (2006) Metabolism and disposition of
vatalanib (PTK787/ZK-222584) in cancer patients. Drug Metab Dispos 34:1817-1828
Kushner JP, Porter JP, Olivieri NF (2001) Secondary iron overload. Hematology Am Soc
Hematol Educ Program 2001:47-61.
Nick H, Wong A, Acklin P, Faller B, Jin Y, Lattmann R, Sergejew T, Hauffe S, Thomas H,
Schnebli HP (2002) ICL670: preclinical profile. Adv Exp Med Biol 509:185-203
Nisbet-Brown E, Olivieri NF, Giardina PJ, et al (2003) Effectiveness and safety of deferasirox
in iron-loaded patients with thalassaemia: a randomized, double-blind, placebo-controlled,
dose-escalation trial. Lancet 361:1597-602.
Porter JB, Waldmeier F, Bruin G, Shah F, Hazell K, Warrington S, Delage S, Sechaud R,
Peter R, Ford J, Alberti D, Gross G, Schran H (2003). Pharmacokinetics, metabolism and
elimination of the iron chelator drug ICL670 in beta-thalassemia patients. Blood 102 (11,
part 2): Abstract 3720.
Piga A, Galanello R, Forni GL, Cappellini MD, Origa R, Zappu A, Donato G, Bordone E,
Lavagetto A, Zanaboni L, Sechaud R, Hewson N, Ford JM, Opitz H, Alberti D (2006)
Randomized phase II trial of deferasirox (Exjade, ICL670), a once-daily, orally-
administered iron chelator, in comparison to deferoxamine in thalassemia patients with
transfusional iron overload. Haematologica 91:873-880
Rouan M.C., Marfil F, Mangoni P., Séchaud R., Humbert H. and Maurer G. (2001)
Determination of a new oral iron chelator, deferasirox, and its iron complex in plasma by
high-performance liquid chromatography and ultraviolet detection. J Chromatogr 755:203-
213
This article has not been copyedited and formatted. The final version may differ from this version.DMD Fast Forward. Published on January 22, 2010 as DOI: 10.1124/dmd.109.030833
at ASPE
T Journals on January 7, 2020
dmd.aspetjournals.org
Dow
nloaded from
DMD 30833
32
Sechaud R, Dutreix C, Balez S, Pommier F, Dumortier T, Morisson S, Brun E (2008a)
Relative bioavailability of deferasirox tablets administered without dispersion and dispersed
in various drinks. Int J Clin Pharmacol Ther 46: 102-108.
Sechaud R, Robeva A, Belleli R, Balez S (2008b) Absolute oral bioavailability and
disposition of deferasirox in healthy human subjects. J Clin Pharmacol 48: 919-925
Shipkova M; Armstrong VW; Oellerich M; Wieland E. (2003) Acyl glucuronide drug
metabolites: toxicological and analytical implications. Therapeutic drug monitoring 25:1-
16.
Waldmeier F, Glaenzel U, Wirz B, Oberer L, Schmid D, Seiberling M, Valencia J, Riviere G-
J, End P, Vaidyanathan S (2007) Absorption, distribution, metabolism and elimination of
the direct rennin inhibitor aliskiren in healthy volunteers. Drug Metab Dispos 35:1418-
1428.
Weiss M, Fresneau M, Camenisch GP, Kretz O, Gross G (2006) In vitro blood distribution
and plasma protein binding of the iron chelator deferasirox (ICL670) and its iron complex
Fe-[ICL670]2 for rat, marmoset, rabbit, mouse, dog and human. Drug Metab Dispos
34:971-975
Yang LP, Keam SJ, Keating GM (2007) Deferasirox: a review of its use in the management of
transfusional chronic iron overload. Drugs 67:2211-2230
This article has not been copyedited and formatted. The final version may differ from this version.DMD Fast Forward. Published on January 22, 2010 as DOI: 10.1124/dmd.109.030833
at ASPE
T Journals on January 7, 2020
dmd.aspetjournals.org
Dow
nloaded from
DMD 30833
33
Footnotes
a) An abstract of this work was published at the American Society of Hematology (ASH) meeting, San Diego CA, 6-9 Dec 2003 (Porter et al., 2003)
b) Address correspondence to: Dr. Felix Waldmeier, Novartis Pharma AG, Drug Metabolism & Pharmacokinetics, Novartis Campus WSJ-210.420, CH-4056 Basel, Switzerland. Email: [email protected]
This article has not been copyedited and formatted. The final version may differ from this version.DMD Fast Forward. Published on January 22, 2010 as DOI: 10.1124/dmd.109.030833
at ASPE
T Journals on January 7, 2020
dmd.aspetjournals.org
Dow
nloaded from
DMD 30833
34
Legends for figures
Figure 1: Mean plasma concentrations of total 14C radioactivity, deferasirox (cold), Fe-
complex (cold) and [14C]deferasirox (means of N=5). Non-labeled deferasirox was
administered before the radiolabeled dose (pretreatment to steady state) and every 24 h after
the radiolabeled dose (arrows). Open symbols show the steady state levels of deferasirox and
Fe-complex, respectively, determined by “cold” assay. The filled symbols show total
radioactivity and the radioactivity fraction represented by [14C]deferasirox.
Figure 2: Schematic chemical structures of deferasirox and its metabolites, and identified
metabolic pathways in human.
Figure 3: Metabolite patterns in plasma of a representative subject at 4 h after dosing, by
HPLC combined with microplate scintillation counting.
Figure 4: Representative radio HPLC profiles of [14C]deferasirox (substrate concentration 50
µmol/L, analysis of identical aliquots) and metabolites after 3 h incubations in the presence of
human hepatocytes (top) or rat hepatocytes (bottom). The asterisk indicates a metabolite
(M3’) formed by rearrangement of the acyl glucuronide M3 by intramolecular
transesterification.
Figure 5: Proposed scheme for the disposition of deferasirox in humans after peroral
administration.
This article has not been copyedited and formatted. The final version may differ from this version.DMD Fast Forward. Published on January 22, 2010 as DOI: 10.1124/dmd.109.030833
at ASPE
T Journals on January 7, 2020
dmd.aspetjournals.org
Dow
nloaded from
DMD 30833
35
Legend: UGT: UDP-glucuronosyltransferase; ST: Sulfotransferase; Gluc.: glucuronic acid
conjugate; Sulf.: sulfate conjugate
This article has not been copyedited and formatted. The final version may differ from this version.DMD Fast Forward. Published on January 22, 2010 as DOI: 10.1124/dmd.109.030833
at ASPE
T Journals on January 7, 2020
dmd.aspetjournals.org
Dow
nloaded from
DMD 30833
36
Tables
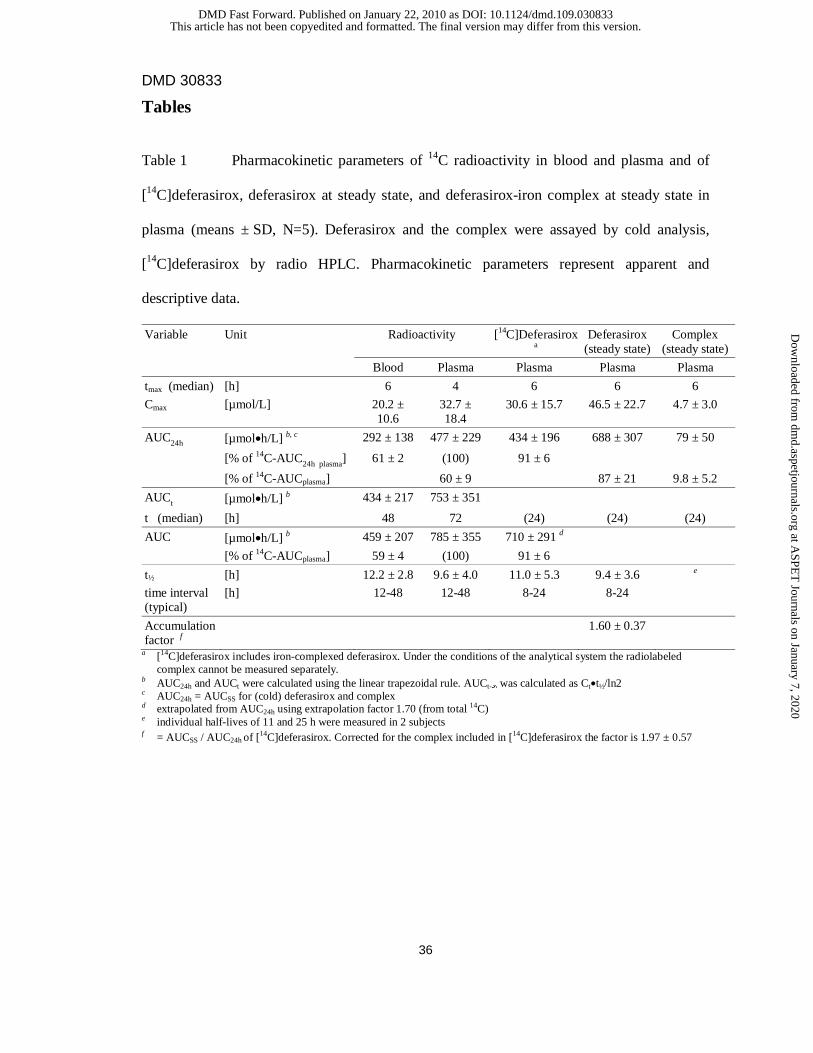
Table 1 Pharmacokinetic parameters of 14C radioactivity in blood and plasma and of
[14C]deferasirox, deferasirox at steady state, and deferasirox-iron complex at steady state in
plasma (means ± SD, N=5). Deferasirox and the complex were assayed by cold analysis,
[14C]deferasirox by radio HPLC. Pharmacokinetic parameters represent apparent and
descriptive data.
Variable Unit Radioactivity [14C]Deferasirox a
Deferasirox (steady state)
Complex (steady state)
Blood Plasma Plasma Plasma Plasma
tmax (median) [h] 6 4 6 6 6
Cmax [µmol/L] 20.2 ± 10.6
32.7 ± 18.4
30.6 ± 15.7 46.5 ± 22.7 4.7 ± 3.0
AUC24h [µmol•h/L] b, c 292 ± 138 477 ± 229 434 ± 196 688 ± 307 79 ± 50
[% of 14C-AUC24h plasma] 61 ± 2 (100) 91 ± 6
[% of 14C-AUCplasma] 60 ± 9 87 ± 21 9.8 ± 5.2
AUCt [µmol•h/L] b 434 ± 217 753 ± 351
t (median) [h] 48 72 (24) (24) (24)
AUC [µmol•h/L] b 459 ± 207 785 ± 355 710 ± 291 d
[% of 14C-AUCplasma] 59 ± 4 (100) 91 ± 6
t½ [h] 12.2 ± 2.8 9.6 ± 4.0 11.0 ± 5.3 9.4 ± 3.6 e
time interval (typical)
[h] 12-48 12-48 8-24 8-24
Accumulation factor f
1.60 ± 0.37
a [14C]deferasirox includes iron-complexed deferasirox. Under the conditions of the analytical system the radiolabeled complex cannot be measured separately.
b AUC24h and AUCt were calculated using the linear trapezoidal rule. AUCt-∞ was calculated as Ct•t½/ln2 c AUC24h = AUCSS for (cold) deferasirox and complex d extrapolated from AUC24h using extrapolation factor 1.70 (from total 14C) e individual half-lives of 11 and 25 h were measured in 2 subjects f = AUCSS / AUC24h of [14C]deferasirox. Corrected for the complex included in [14C]deferasirox the factor is 1.97 ± 0.57
This article has not been copyedited and formatted. The final version may differ from this version.DMD Fast Forward. Published on January 22, 2010 as DOI: 10.1124/dmd.109.030833
at ASPE
T Journals on January 7, 2020
dmd.aspetjournals.org
Dow
nloaded from
DMD 30833
37
Table 2 Cumulative excretion of 14C-radioactivity in urine and feces after a single oral
dose of 1000 mg of [14C]deferasirox (means ± SD, N=5).
Time period Feces Urine Total
h % of dose % of dose % of dose
0-24 10.1 ± 17.8 5.1 ± 2.5 15.2 ± 20.2
0-72 80.2 ± 2.7 7.5 ± 2.9 87.7 ± 3.3
0-168 83.9 ± 3.1 7.6 ± 2.9 91.5 ± 1.1
This article has not been copyedited and formatted. The final version may differ from this version.DMD Fast Forward. Published on January 22, 2010 as DOI: 10.1124/dmd.109.030833
at ASPE
T Journals on January 7, 2020
dmd.aspetjournals.org
Dow
nloaded from
DMD 30833
38
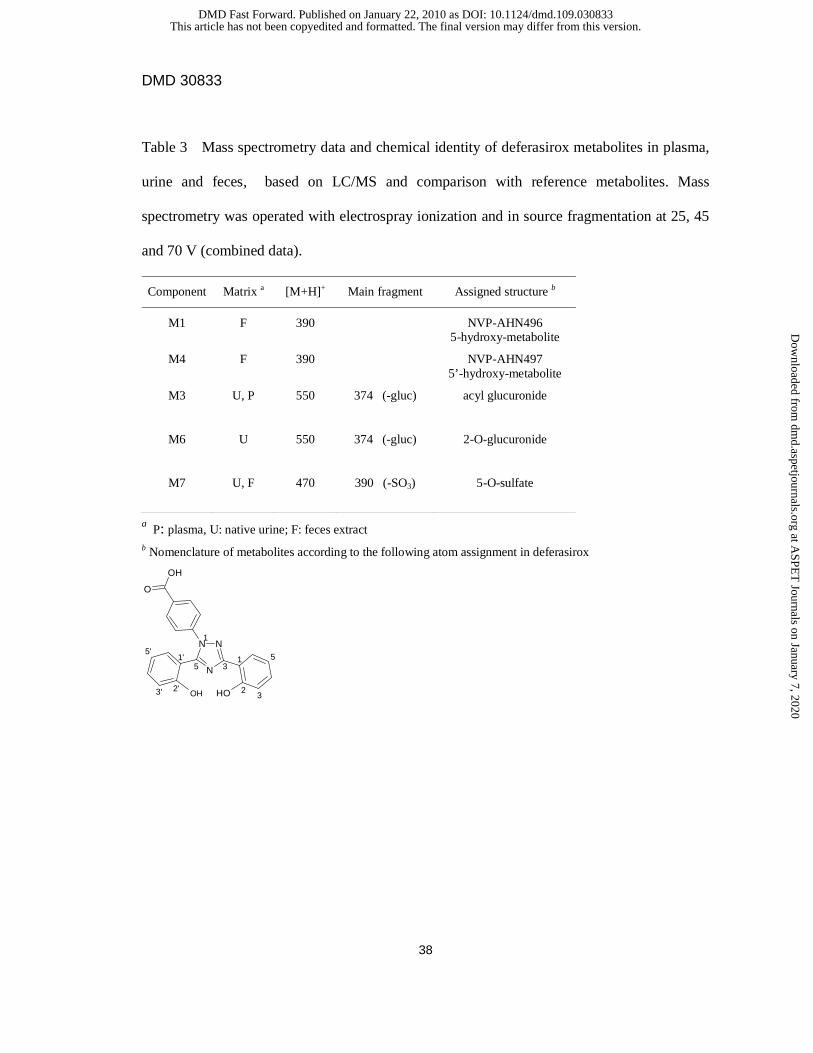
Table 3 Mass spectrometry data and chemical identity of deferasirox metabolites in plasma,
urine and feces, based on LC/MS and comparison with reference metabolites. Mass
spectrometry was operated with electrospray ionization and in source fragmentation at 25, 45
and 70 V (combined data).
Component Matrix a [M+H]+ Main fragment Assigned structure b
M1 F 390 NVP-AHN496 5-hydroxy-metabolite
M4 F 390 NVP-AHN497 5’-hydroxy-metabolite
M3 U, P 550
374 (-gluc) acyl glucuronide
M6 U 550
374 (-gluc) 2-O-glucuronide
M7 U, F 470
390 (-SO3) 5-O-sulfate
a P: plasma, U: native urine; F: feces extract b Nomenclature of metabolites according to the following atom assignment in deferasirox
N
N N
OH
OH
O
OH
5
3
5'
3'
5 3
22'
1
11'
This article has not been copyedited and formatted. The final version may differ from this version.DMD Fast Forward. Published on January 22, 2010 as DOI: 10.1124/dmd.109.030833
at ASPE
T Journals on January 7, 2020
dmd.aspetjournals.org
Dow
nloaded from
DMD 30833
39
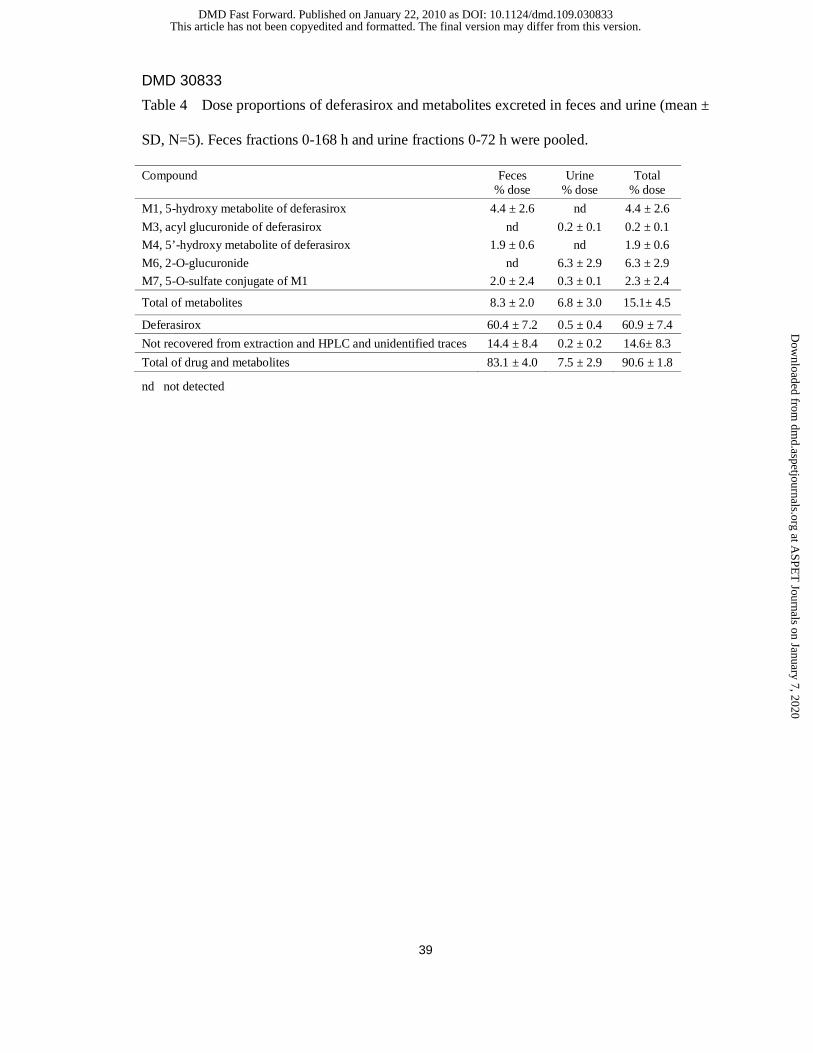
Table 4 Dose proportions of deferasirox and metabolites excreted in feces and urine (mean ±
SD, N=5). Feces fractions 0-168 h and urine fractions 0-72 h were pooled.
Compound Feces % dose
Urine % dose
Total % dose
M1, 5-hydroxy metabolite of deferasirox 4.4 ± 2.6 nd 4.4 ± 2.6
M3, acyl glucuronide of deferasirox nd 0.2 ± 0.1 0.2 ± 0.1
M4, 5’-hydroxy metabolite of deferasirox 1.9 ± 0.6 nd 1.9 ± 0.6
M6, 2-O-glucuronide nd 6.3 ± 2.9 6.3 ± 2.9
M7, 5-O-sulfate conjugate of M1 2.0 ± 2.4 0.3 ± 0.1 2.3 ± 2.4
Total of metabolites 8.3 ± 2.0 6.8 ± 3.0 15.1± 4.5
Deferasirox 60.4 ± 7.2 0.5 ± 0.4 60.9 ± 7.4
Not recovered from extraction and HPLC and unidentified traces 14.4 ± 8.4 0.2 ± 0.2 14.6± 8.3
Total of drug and metabolites 83.1 ± 4.0 7.5 ± 2.9 90.6 ± 1.8
nd not detected
This article has not been copyedited and formatted. The final version may differ from this version.DMD Fast Forward. Published on January 22, 2010 as DOI: 10.1124/dmd.109.030833
at ASPE
T Journals on January 7, 2020
dmd.aspetjournals.org
Dow
nloaded from
This article has not been copyedited and formatted. The final version may differ from this version.DMD Fast Forward. Published on January 22, 2010 as DOI: 10.1124/dmd.109.030833
at ASPE
T Journals on January 7, 2020
dmd.aspetjournals.org
Dow
nloaded from
This article has not been copyedited and formatted. The final version may differ from this version.DMD Fast Forward. Published on January 22, 2010 as DOI: 10.1124/dmd.109.030833
at ASPE
T Journals on January 7, 2020
dmd.aspetjournals.org
Dow
nloaded from
This article has not been copyedited and formatted. The final version may differ from this version.DMD Fast Forward. Published on January 22, 2010 as DOI: 10.1124/dmd.109.030833
at ASPE
T Journals on January 7, 2020
dmd.aspetjournals.org
Dow
nloaded from
This article has not been copyedited and formatted. The final version may differ from this version.DMD Fast Forward. Published on January 22, 2010 as DOI: 10.1124/dmd.109.030833
at ASPE
T Journals on January 7, 2020
dmd.aspetjournals.org
Dow
nloaded from
This article has not been copyedited and formatted. The final version may differ from this version.DMD Fast Forward. Published on January 22, 2010 as DOI: 10.1124/dmd.109.030833
at ASPE
T Journals on January 7, 2020
dmd.aspetjournals.org
Dow
nloaded from