
Petmesidou-Power Point
31
“CRISIS AND AUSTERITY: A PAINFUL WATERSHED FOR THE GREEK WELFARE STATE?” MARIA PETMESIDOU Democritus University of Thrace, Greece
Transcript of Petmesidou-Power Point
“CRISIS AND AUSTERITY:
A PAINFUL WATERSHED FOR THE
GREEK WELFARE STATE?”
MARIA PETMESIDOU
Democritus University of Thrace, Greece

Three parts of my presentation
1. Has rising social spending
contributed to the crisis? - The
predicaments of the Greek
welfare state
2. Major reforms (pensions &
health care)
3. Where is structural adjustment
heading?

(1) Is the “growth to the limits”
argument tenable?
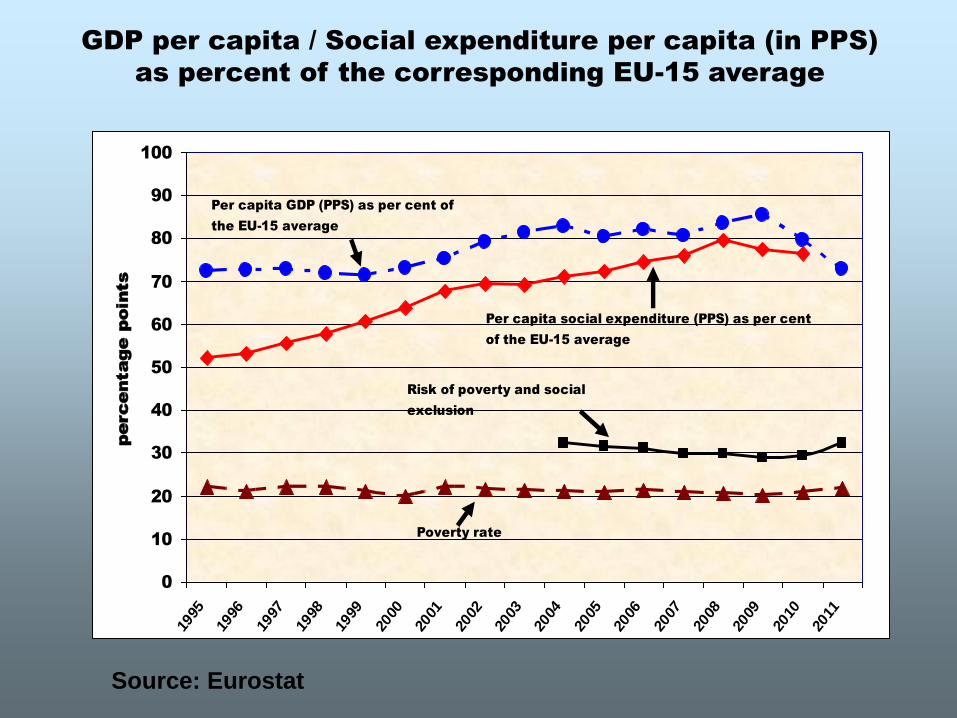
Source: Eurostat
GDP per capita / Social expenditure per capita (in PPS)
as percent of the corresponding EU-15 average
0
10
20
30
40
50
60
70
80
90
100
1995
1996
1997
1998
1999
2000
2001
2002
2003
2004
2005
2006
2007
2008
2009
2010
2011
Risk of poverty and social
exclusion
Poverty rate
Per capita social expenditure (PPS) as per cent
of the EU-15 average
Per capita GDP (PPS) as per cent of
the EU-15 average
percentage points ς
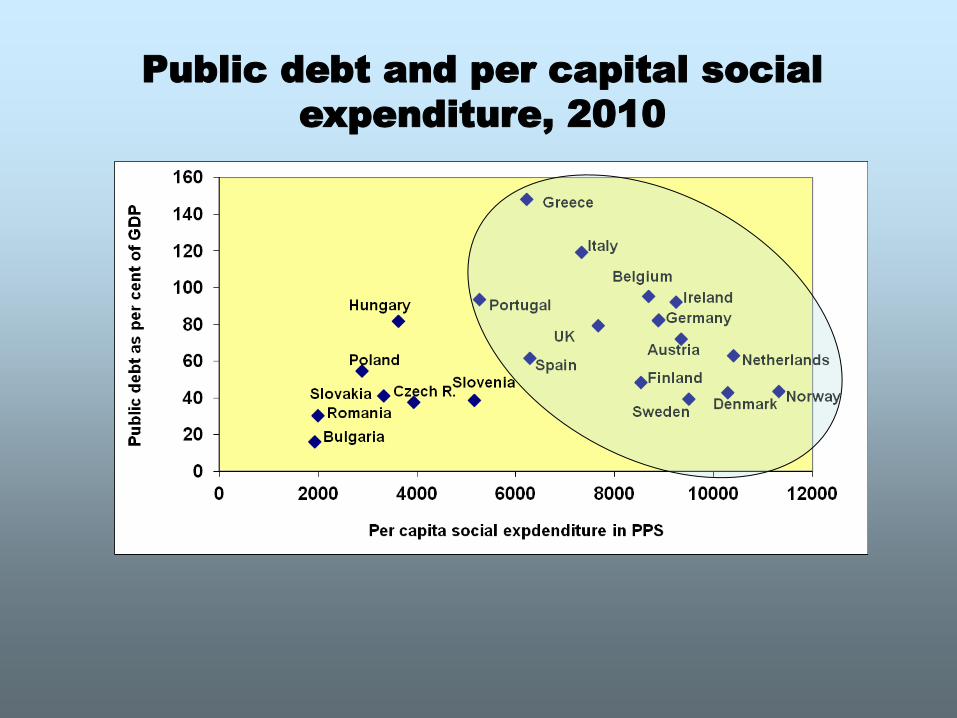
Public debt and per capital social
expenditure, 2010
On the eve of the crisis the main
features of social protection in Greece
could be suitably described by two
parameters:
(A) The ‘hybrid’ form of welfare
arrangements across the major social
policy fields (social insurance, health,
social assistance and care), linked to a
distinctive pattern of redistribution
(B) The ‘density of historical’ time in
respect to institutional consolidation
(A) A HYBRID (AND FRAGMENTED)
SOCIAL PROTECTION SYSTEM
1.A Bismarckian but highly fragmented social
insurance system
Transfer-heavy arrangements - High degree of
polarization (generous protection of the “insiders” /
dearth of social protection schemes for the “outsiders”)
Blurred boundaries between social assistance and social
insurance
2. An incomplete path shift in respect to health
care
Extensive mediation of coverage by numerous health
insurance schemes markedly uneven across social
groups and geographic areas and chaotic in
organizational terms.
3. Rudimentary statutory social care (mostly
provided on a means-tested basis) – Informal
privatization of social care

(B) Institutional changes expanding
social rights and social programmes
took place in a much shorter time
period compared to northwest Europe.
Hence, consolidation of new
structures and institutions has been
weaker

(2) Structural reforms under
the “bail-out deal”
(A) PENSION REFORM (2010 onwards)
Amalgamation of social insurance funds (from about
130 to 13 with the 2008 legislation, but this remained on
paper / from 13 to 4 major funds with the 2010 reform)
A path-breaking overhaul – From a Bismarckian social
insurance system (based primarily on the first pillar), to a
unified, multi-tier system that distinguishes between a
basic (quasi-universal and not totally guaranteed) non-
contributory and a contributory pension, to be in force
from January 2015
Shrinking pensionable income & very drastic cuts in
replacements rates
Increase of pensionable age (from January 2013)
Blurry messages of policy in respect to early retirement
Successive rounds of drastic cuts in current
pensioners’ income (up to 40%- 50% of incomes for
certain categories of pensioners)
Late 2010 (special levy, threshold revised
downwards in August 2011, abolishment of
Christmas, Easter and holidays bonus, replacement
by a flat benefit depending on pension earnings)
November 2011, 30% cuts in auxiliary pensions
over 150 Euros, introduction of an upper ceiling for
total gross pension income
February 2012, further cuts in basic pensions over
1,300 Euros and in auxiliary pensions
November 2012, a further cut ranging from 5% to
20% of total gross monthly pension incomes over
1,000 Euros / abolishment of the above flat benefit
Notably
Adequacy
concerns are missing in
the “rescue plans” (as are
also any projections of the
effects of the reform
measures on poverty)
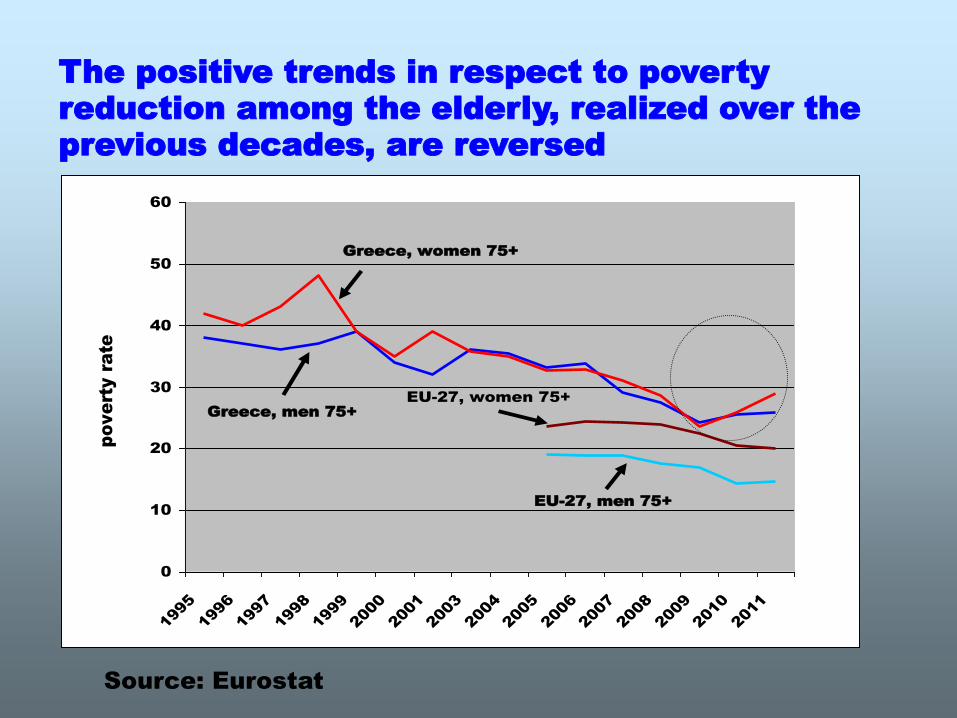
The positive trends in respect to poverty
reduction among the elderly, realized over the
previous decades, are reversed
Source: Eurostat
0
10
20
30
40
50
60
1995
1996
1997
1998
1999
2000
2001
2003
2004
2005
2006
2007
2008
2009
2010
2011
pove
rty ra
te
Greece, women 75+
Greece, men 75+
EU-27, men 75+
EU-27, women 75+
A highly unrealistic target set by the
“Memorandum” runs counter to adequacy
concerns
public pension expenditure should not
surpass an increase by 2.0 to 2.5
percentage points of GDP through 2060 (it
stood roughly at around 13% in 2009).
This target can hardly be achieved, as the
baby-boomers generation reaches
retirement, unless steep decreases of
pension income will take place (further to
the cuts already imposed)
Sustainability is questioned too
Most importantly, the social funds’
revenues are severely strained by:
steep decrease of wages,
galloping unemployment,
over 12bn losses due to the inclusion
of the social funds’ bond holdings in the
“haircut” implemented in 2012.
(B) Health care: The magnitude of fiscal
constraint and the policy tools deployed
Three strands of (on-going) reforms:
1. Health insurance and primary care (amalgamation of
health insurance funds through the creation of EOPYY –
The National Organization for Health Care Provision - a
hybrid organization that provides primary care, partly
funds the NHS, and is also partly a purchaser of services
from the private sector) – EOPYY pools contributions
from its constituent health insurance funds and receives
also state subsidy
2. Changes in the network of hospitals (in parallel with
changes in cost-accounting and procurement)
3. Changes in the public-private mix, cost control for
pharmaceuticals, use of e-prescription and e-referral
2
6,55,7
4,1
2,11,3
7,1
1,8
3,4
4,9
2,7
-7,9
-6,7
-0,9
0,8 1 0,5 0,51,2
-0,5
-10
-8
-6
-4
-2
0
2
4
6
8
10
Germ
any
Ireland
Greece
Spain
France
ItalyPoland
Portugal
Sweden
UK
an
nu
al avera
ge g
row
th r
ate
(5)
2000-09
2009-10
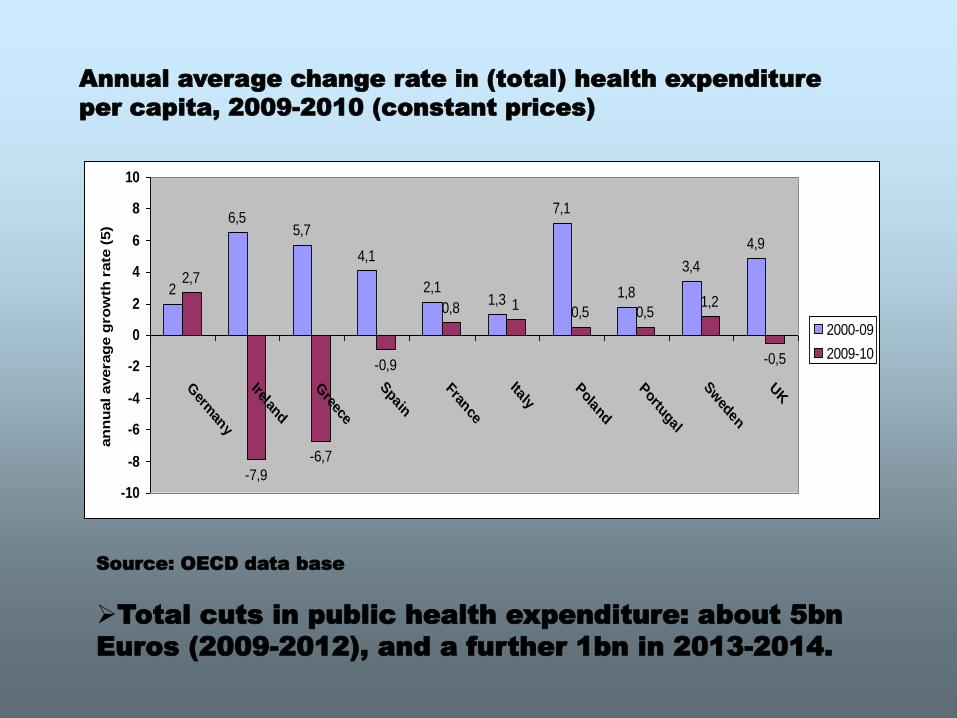
Annual average change rate in (total) health expenditure
per capita, 2009-2010 (constant prices)
Source: OECD data base
Total cuts in public health expenditure: about 5bn
Euros (2009-2012), and a further 1bn in 2013-2014.
Policy tools deployed
Financing (increase of user charges,
shift of the financial burden to the
patient……Outstanding debts to
suppliers causing severe disruptions of
service delivery…)
Affecting the cost of publicly provided
services
• Higher control over medical prescriptions (e-
prescribing and e-diagnosis systems), in
parallel with the development of clinical
protocols;
• New pricing rules for pharmaceuticals and new
procurement processes, matched by a greater
penetration of generics;
• Cuts in health personnel salaries and overtime
payments, freeze of appointments, increase of
workload
Affecting volume and quality of
publicly financed care
Cuts in the range of services provided
Rationing through increasing waiting times, or
other blockage mechanisms that may imply non-
transparent rationing processes.
System administration / regulation
Redeployment of health units through merging
and closures, reduction of acute care capacity
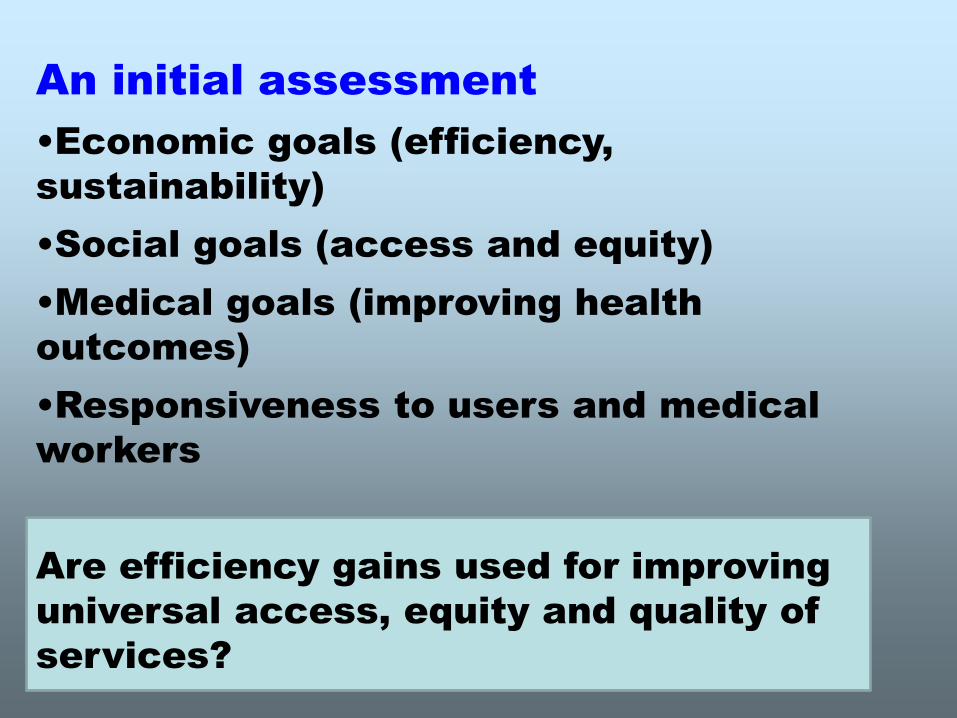
An initial assessment
•Economic goals (efficiency,
sustainability)
•Social goals (access and equity)
•Medical goals (improving health
outcomes)
•Responsiveness to users and medical
workers
Are efficiency gains used for improving
universal access, equity and quality of
services?
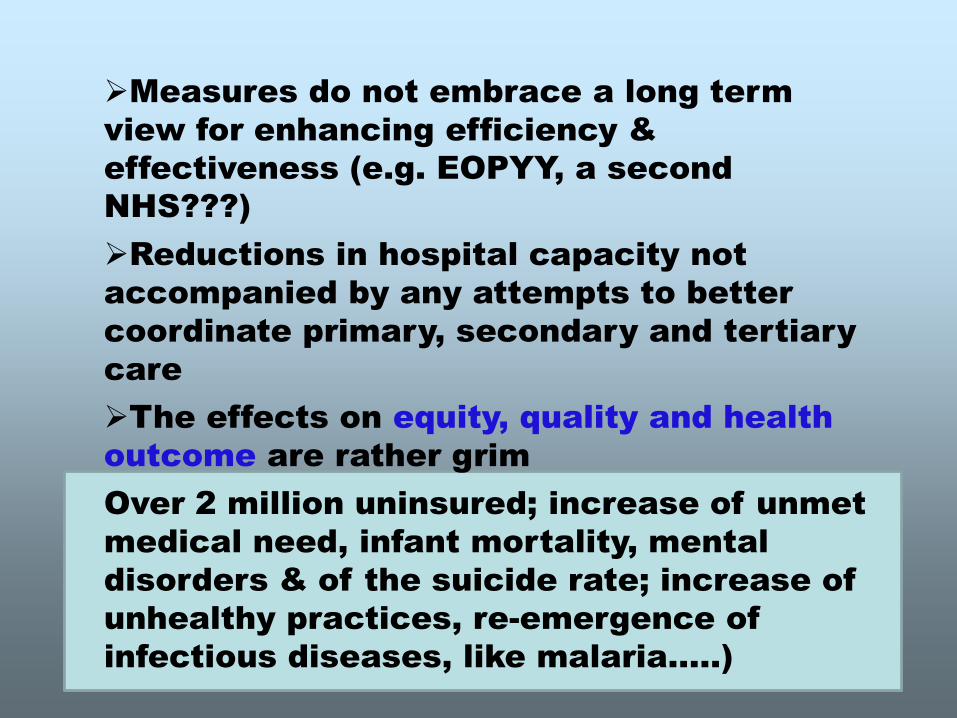
Measures do not embrace a long term
view for enhancing efficiency &
effectiveness (e.g. EOPYY, a second
NHS???)
Reductions in hospital capacity not
accompanied by any attempts to better
coordinate primary, secondary and tertiary
care
The effects on equity, quality and health
outcome are rather grim
Over 2 million uninsured; increase of unmet
medical need, infant mortality, mental
disorders & of the suicide rate; increase of
unhealthy practices, re-emergence of
infectious diseases, like malaria…..)
0
500
1000
1500
2000
2500
3000
3500
4000
1st quin
tile
2nd quin
tile
3rd q
uintil
e
4rth q
uintil
e
5th q
uintil
e
2008
2009
2010
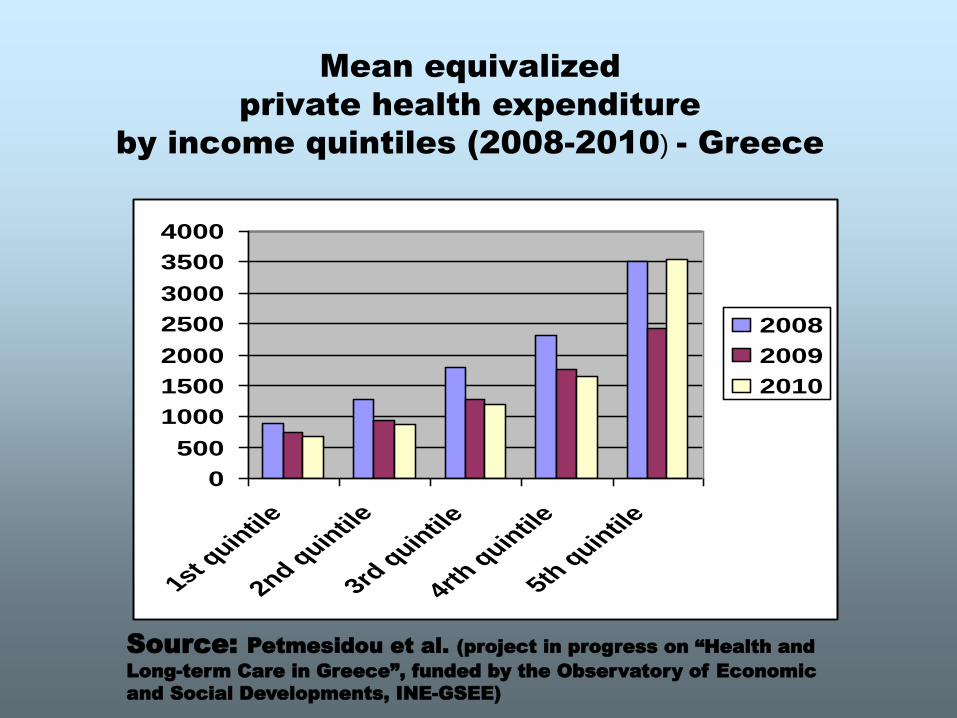
Mean equivalized
private health expenditure
by income quintiles (2008-2010) - Greece
Source: Petmesidou et al. (project in progress on “Health and
Long-term Care in Greece”, funded by the Observatory of Economic
and Social Developments, INE-GSEE)
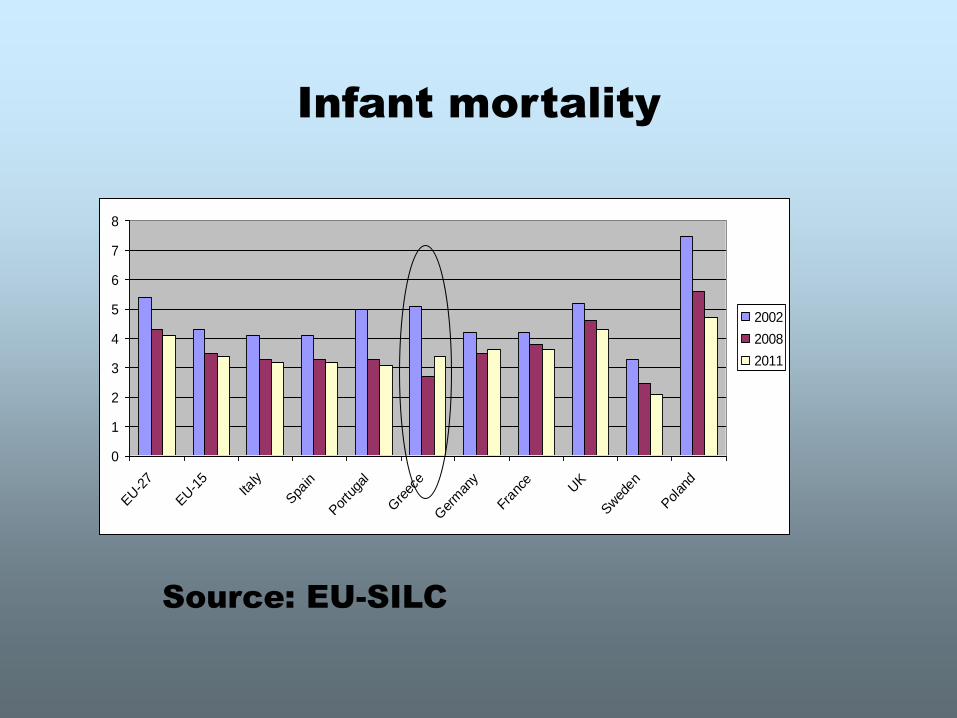
Infant mortality
0
1
2
3
4
5
6
7
8
EU-2
7
EU-1
5Ita
ly
Spa
in
Por
tuga
l
Gre
ece
Ger
man
y
Fran
ce UK
Swed
en
Polan
d
2002
2008
2011
Source: EU-SILC
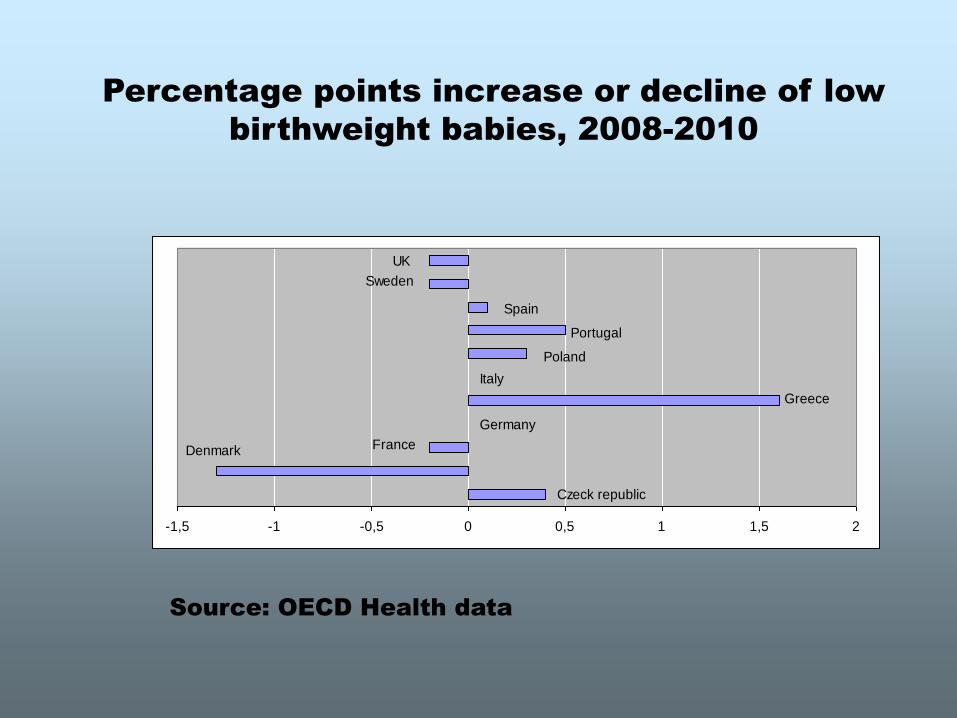
Percentage points increase or decline of low
birthweight babies, 2008-2010
-1,5 -1 -0,5 0 0,5 1 1,5 2
UK
Sweden
Spain
Portugal
Poland
Greece
Italy
Germany
FranceDenmark
Czeck republic
Source: OECD Health data
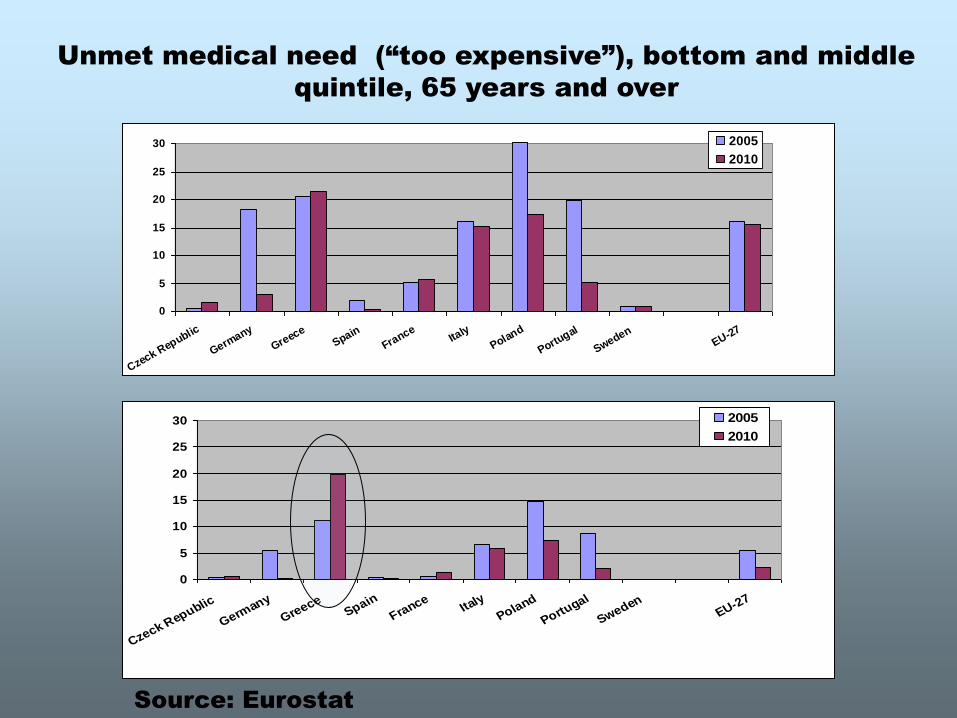
Unmet medical need (“too expensive”), bottom and middle
quintile, 65 years and over
0
5
10
15
20
25
30
Czeck Republic
Germany
Greece
Spain
France
Italy
Poland
Portugal
SwedenEU-27
2005
2010
0
5
10
15
20
25
30
Czeck Republic
Germany
GreeceSpain
FranceIta
ly
Poland
Portugal
SwedenEU-27
2005
2010
Source: Eurostat
Source: Eurostat
0
10
20
30
40
50
60
70
80
90
100
2007, 1st quin
tile2007, 2n
d q
uin
tile2007, 3rd
quin
tile2011, 1st q
uin
tile2001, 2n
d q
uin
tile2001, 3rd
quin
tile
perc
en
tan
ge p
oin
ts
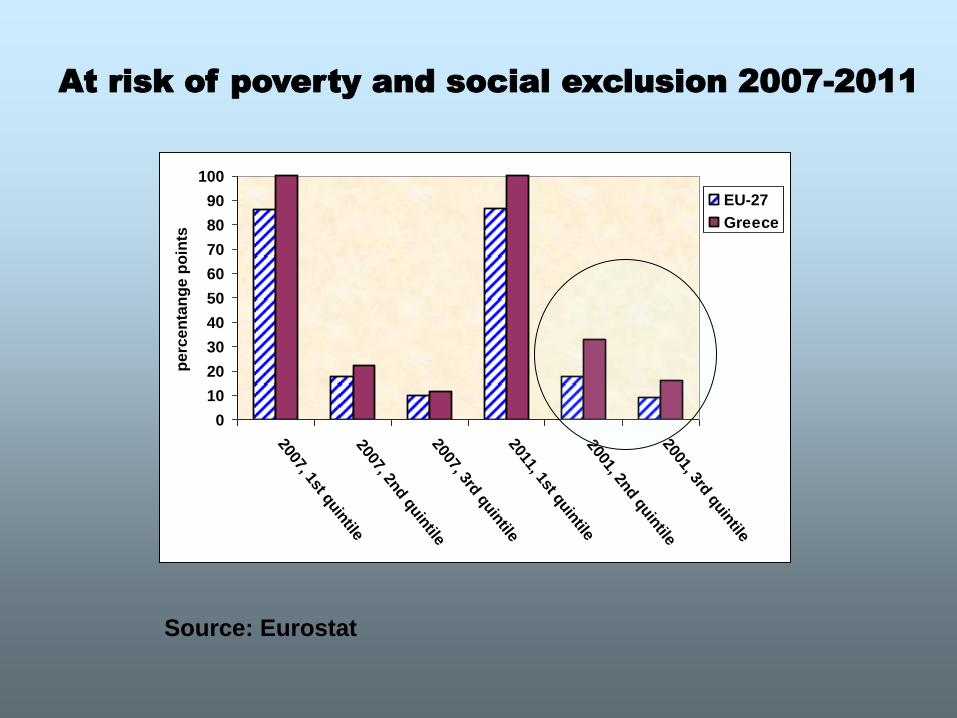
EU-27
Greece
At risk of poverty and social exclusion 2007-2011
•Fiscal sustainability overrides any
other goal, and health outcome
indicators already manifest a
deteriorating trend
•Concern for health inequalities is
absent from the policy context shaped
by austerity measures and by the more
specific bailout stipulations
•The human cost of austerity is still not
highly visible and a perilous future of a
“humanitarian crisis” is highly likely.
(C) Where is structural adjustment
heading?
•Is destructive austerity in the crisis-ridden
countries testing the limits to social
sustainability in Europe?
•Does this indicate a “game-changing” turn
in Europe prioritizing the dismantling of the
European Social Model?
•What can we infer from the way normative
tools (like the BEPG and the social OMCs)
are used by the EU Commission - particularly
in the context of the country specific
recommendations issued in the end of the
European Semester 2013?
The verdict may be still out .......
Available data show, however, that:
over a quarter of all EU population live in
conditions of poverty and social exclusion
(including close to one third of children)
a third of EU citizens find it difficult to afford
general health; 40% cannot afford long-term care
(Social Protection Committee Report, 2012)
and “de facto” privatization is expanding in
Europe (through increasing fees for health and
social care services, co-payments and private
insurance)
•The rolling back of social rights has
already occurred in Eastern Europe (as an
effect of structural adjustment)
•It is spreading in the southern periphery
under the current crisis (and the perilous
“re-enactment” of structural adjustment
in this region).
•Whether it “is a matter of time for this
move to affect core countries, strip the
European Social Model from its
universalism and turn individuals into
consumers in a totally new way”, is an
open question