
PET Technical aspects - fmed.edu.uy 2009/Diapositivas/Technical aspects PET.pdfAlthough the most...
70
PET Technical aspects
Transcript of PET Technical aspects - fmed.edu.uy 2009/Diapositivas/Technical aspects PET.pdfAlthough the most...

PET
Technical aspects
15ODetector 1 Detector 2
15N
e-β+
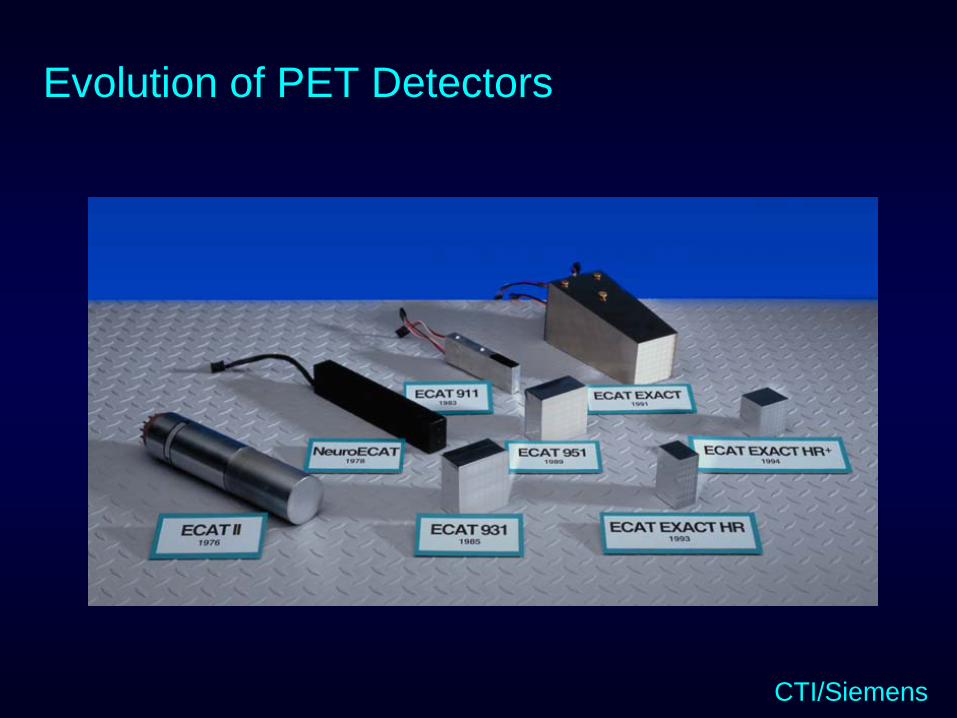
Evolution of PET Detectors
CTI/Siemens
15O
Constantfraction
discriminator
Constantfraction
discriminator
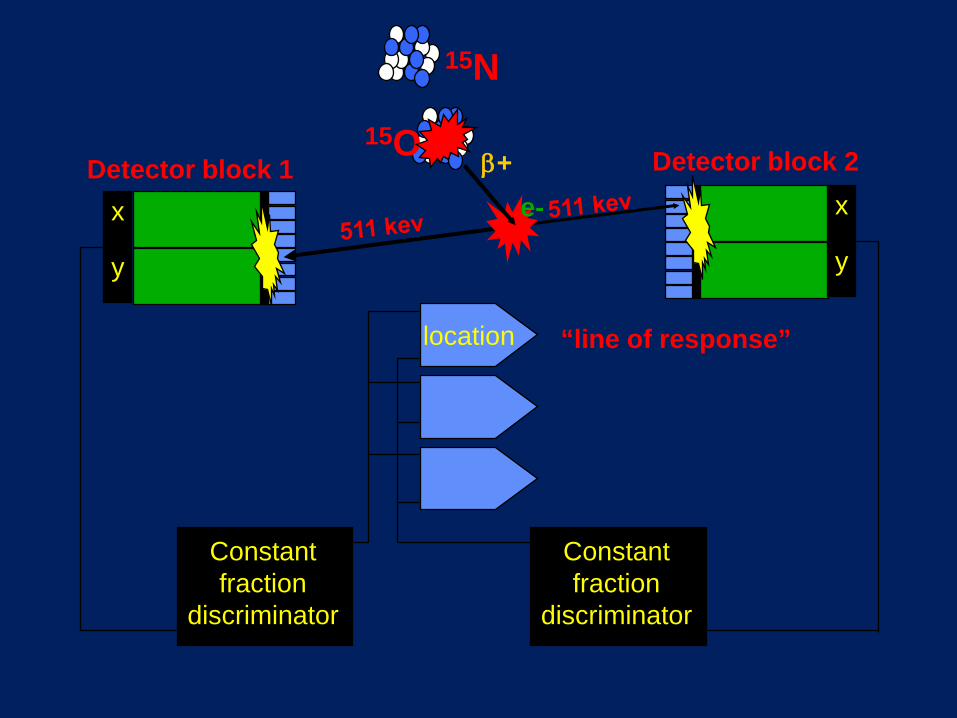
location “line of response”
x
y
x
y
Detector block 1 Detector block 2
15N
e-β+
PET Detectors
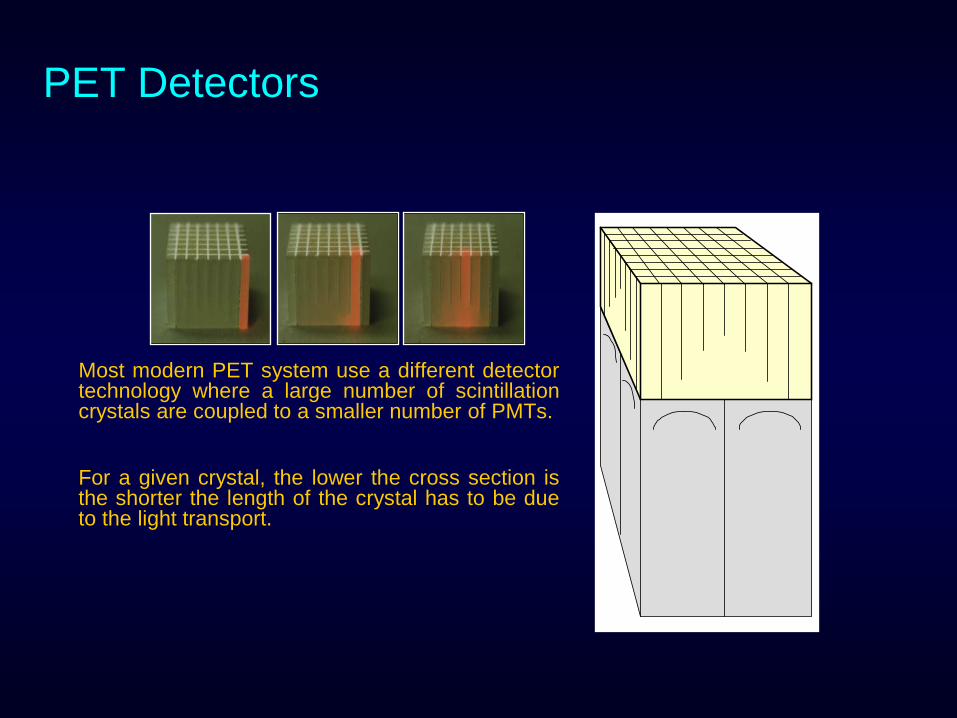
Most modern PET system use a different detectortechnology where a large number of scintillationcrystals are coupled to a smaller number of PMTs.
For a given crystal, the lower the cross section isthe shorter the length of the crystal has to be dueto the light transport.

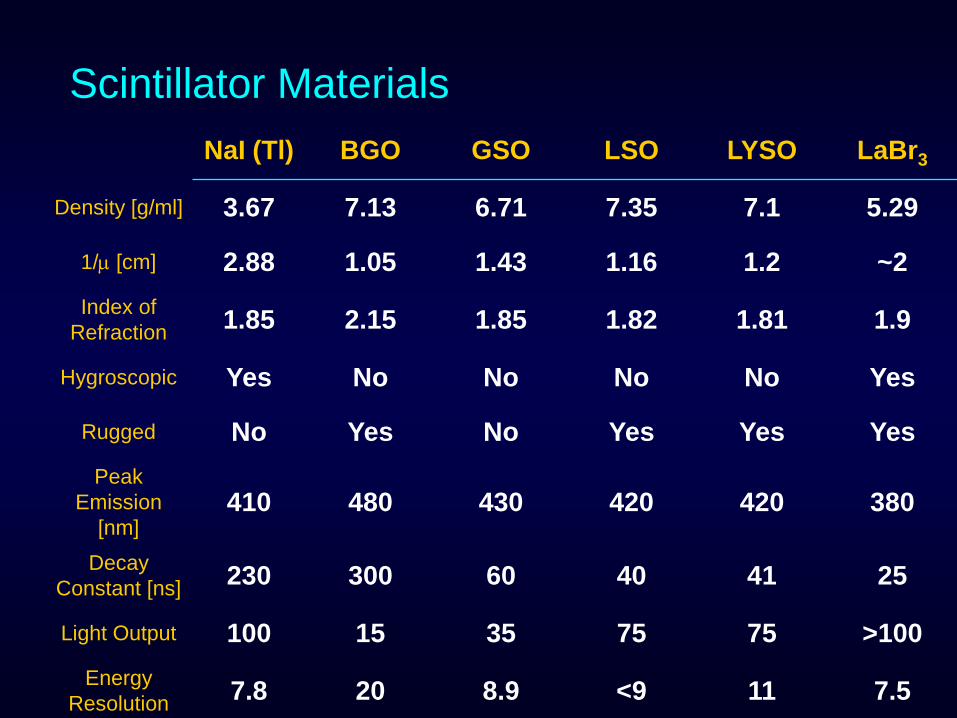
NaI (Tl) BGO GSO LSO LYSO LaBr3
Density [g/ml] 3.67 7.13 6.71 7.35 7.1 5.29
1/µ [cm] 2.88 1.05 1.43 1.16 1.2 ~2Index of
Refraction 1.85 2.15 1.85 1.82 1.81 1.9
Hygroscopic Yes No No No No Yes
Rugged No Yes No Yes Yes YesPeak
Emission [nm]
410 480 430 420 420 380
Decay Constant [ns] 230 300 60 40 41 25
Light Output 100 15 35 75 75 >100Energy
Resolution 7.8 20 8.9 <9 11 7.5
Scintillator Materials
PET Detectors
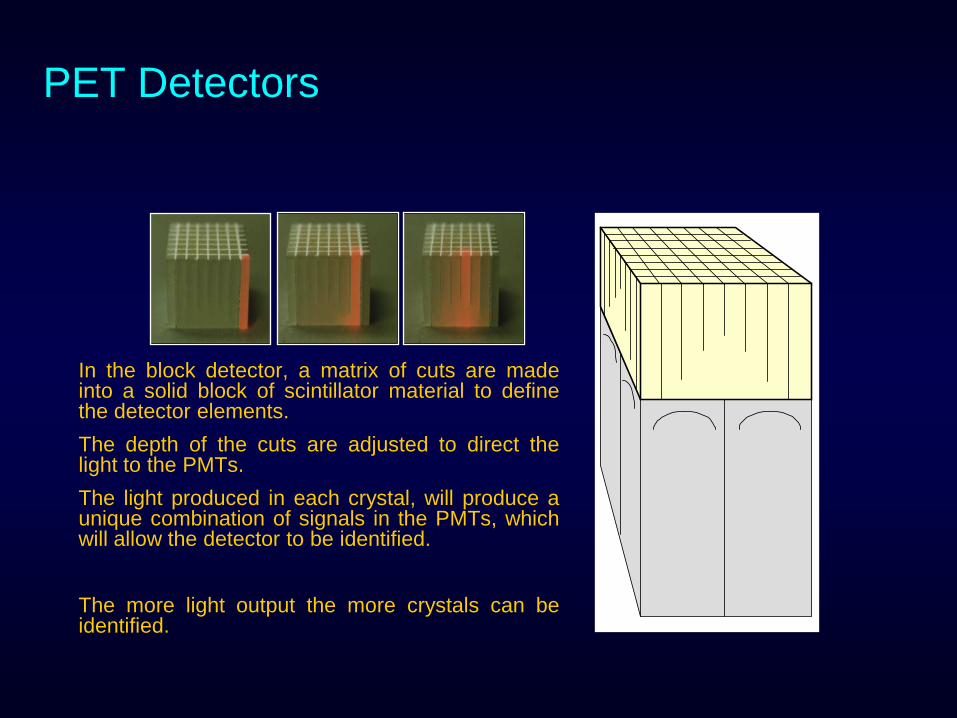
In the block detector, a matrix of cuts are madeinto a solid block of scintillator material to definethe detector elements.The depth of the cuts are adjusted to direct thelight to the PMTs.The light produced in each crystal, will produce aunique combination of signals in the PMTs, whichwill allow the detector to be identified.
The more light output the more crystals can beidentified.
PET Detectors
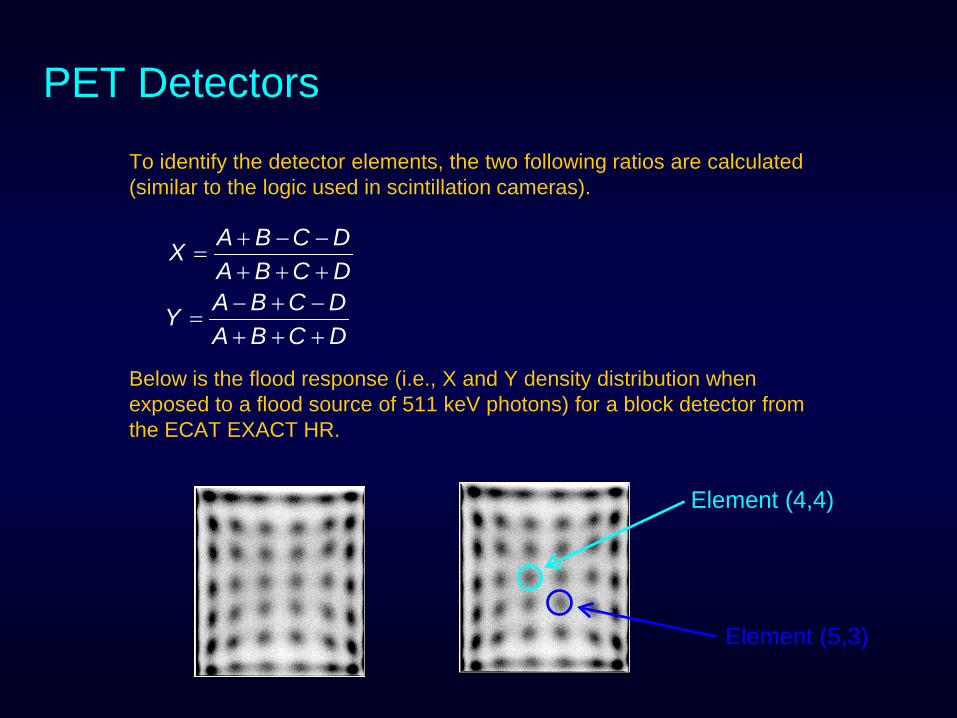
To identify the detector elements, the two following ratios are calculated (similar to the logic used in scintillation cameras).
Below is the flood response (i.e., X and Y density distribution when exposed to a flood source of 511 keV photons) for a block detector from the ECAT EXACT HR.
Element (4,4)
Element (5,3)
A B C DXA B C DA B C DYA B C D
+ − −=
+ + +− + −
=+ + +
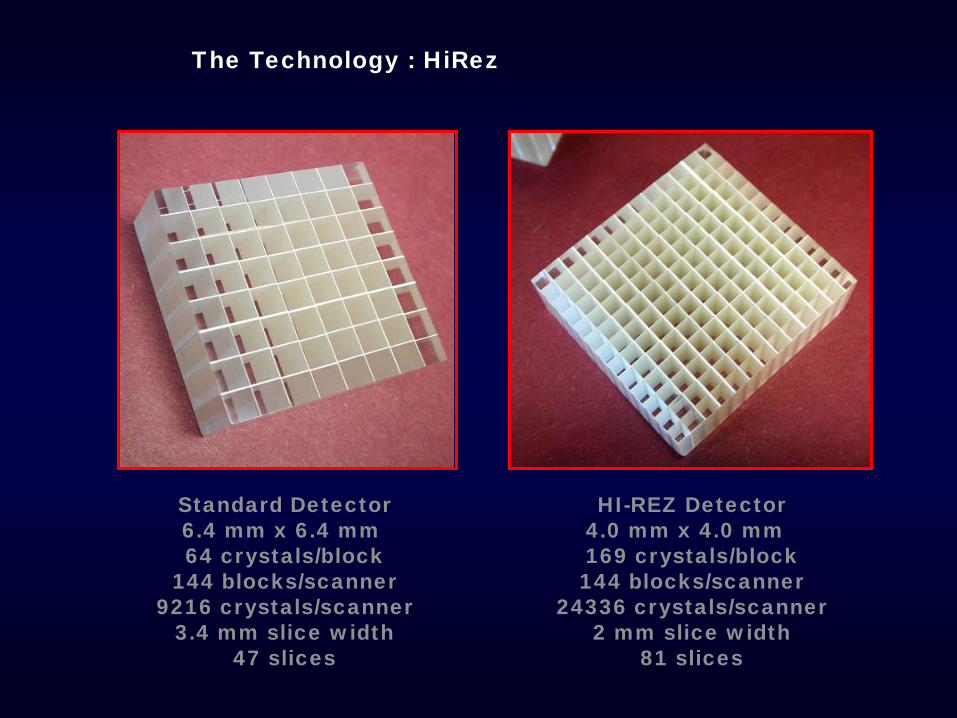
Standard Detector6.4 mm x 6.4 mm 64 crystals/block
144 blocks/scanner9216 crystals/scanner
3.4 mm slice width47 slices
HI-REZ Detector4.0 mm x 4.0 mm 169 crystals/block144 blocks/scanner
24336 crystals/scanner2 mm slice width
81 slices
The Technology : HiRez
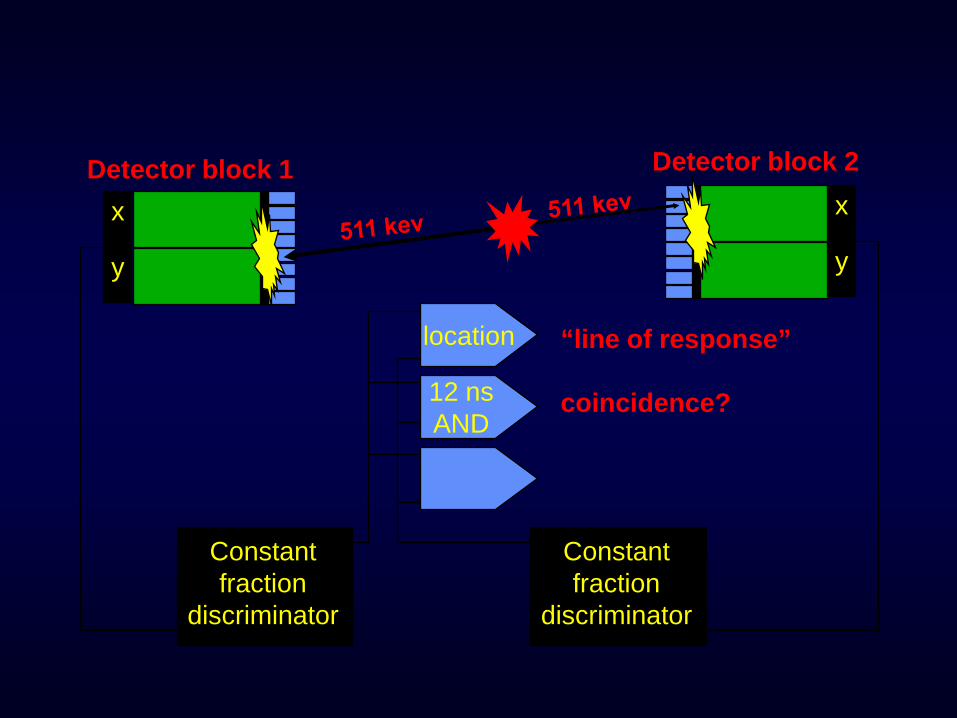
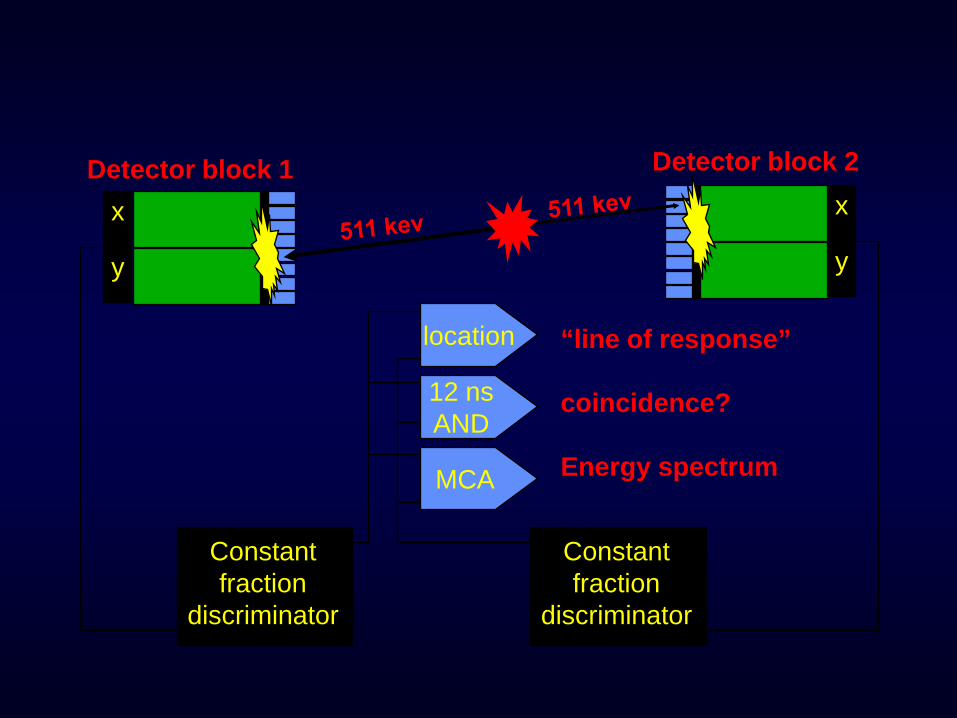
Constantfraction
discriminator
Constantfraction
discriminator
12 nsAND
location
coincidence?
“line of response”
x
y
x
y
Detector block 1 Detector block 2

NaI (Tl) BGO GSO LSO LYSO LaBr3
Density [g/ml] 3.67 7.13 6.71 7.35 7.1 5.29
1/µ [cm] 2.88 1.05 1.43 1.16 1.2 ~2Index of
Refraction 1.85 2.15 1.85 1.82 1.81 1.9
Hygroscopic Yes No No No No Yes
Rugged No Yes No Yes Yes YesPeak
Emission [nm]
410 480 430 420 420 380
Decay Constant [ns] 230 300 60 40 41 25
Light Output 100 15 35 75 75 >100Energy
Resolution 7.8 20 8.9 <9 11 7.5
Scintillator Materials
Constantfraction
discriminator
Constantfraction
discriminator
12 nsAND
MCA
location
Energy spectrum
coincidence?
“line of response”
x
y
x
y
Detector block 1 Detector block 2
NaI (Tl) BGO GSO LSO LYSO LaBr3
Density [g/ml] 3.67 7.13 6.71 7.35 7.1 5.29
1/µ [cm] 2.88 1.05 1.43 1.16 1.2 ~2Index of
Refraction 1.85 2.15 1.85 1.82 1.81 1.9
Hygroscopic Yes No No No No Yes
Rugged No Yes No Yes Yes YesPeak
Emission [nm]
410 480 430 420 420 380
Decay Constant [ns] 230 300 60 40 41 25
Light Output 100 15 35 75 75 >100Energy
Resolution 7.8 20 8.9 <9 11 7.5
Scintillator Materials
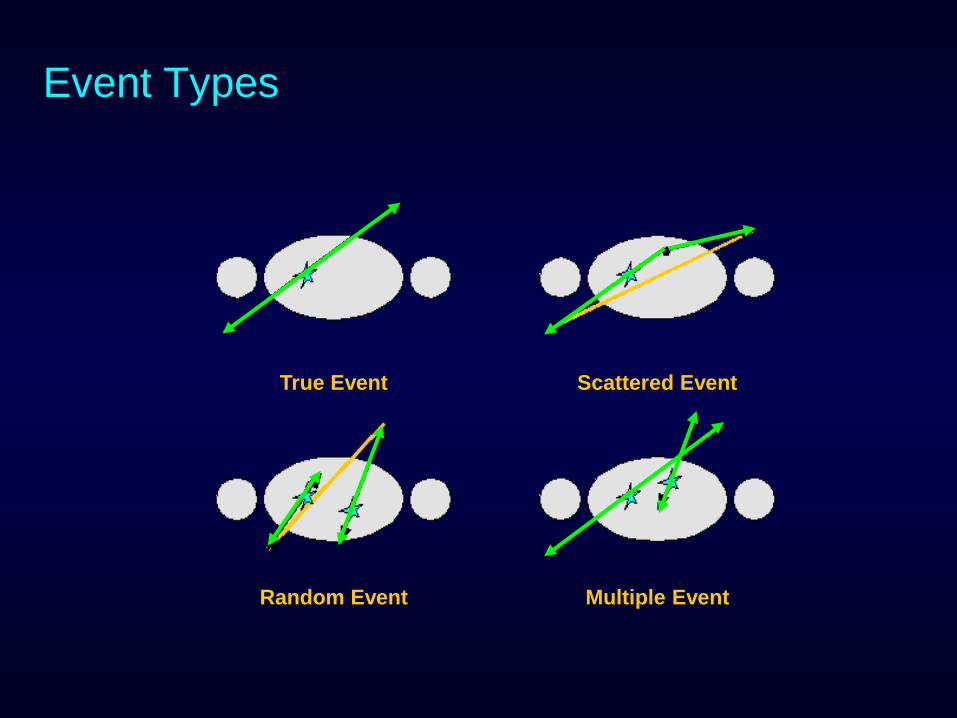
Event Types
True Event Scattered Event
Random Event Multiple Event
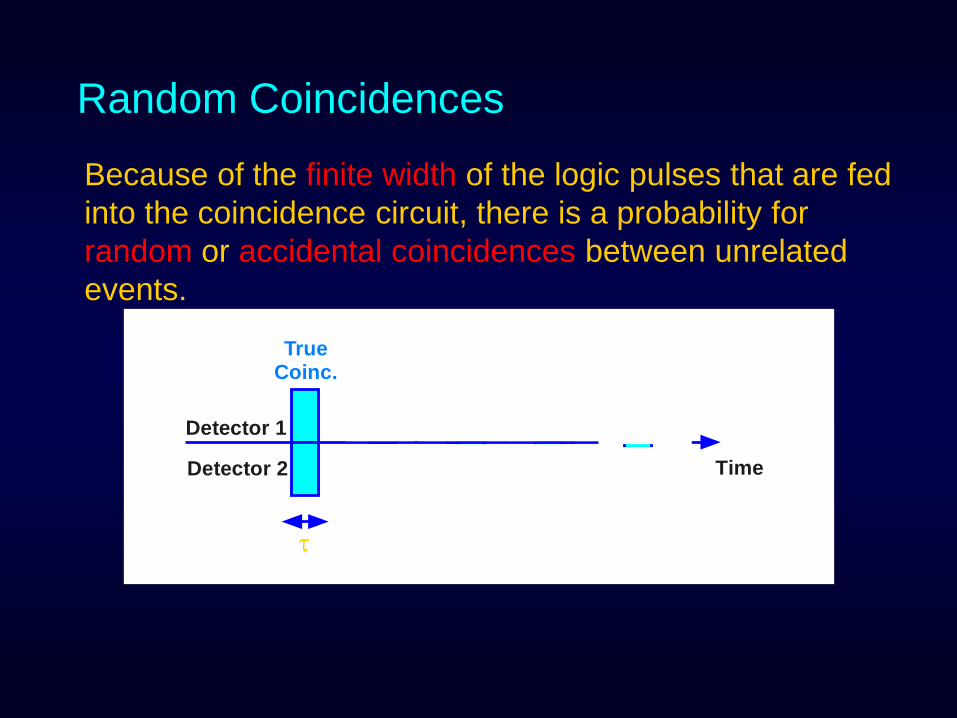
Random Coincidences
Because of the finite width of the logic pulses that are fed into the coincidence circuit, there is a probability forrandom or accidental coincidences between unrelated events.
TrueCoinc.
Detector 1
Detector 2 Time
TrueCoinc.
SingleEvent
RandomCoinc.
SingleEventτ
Random Coincidences
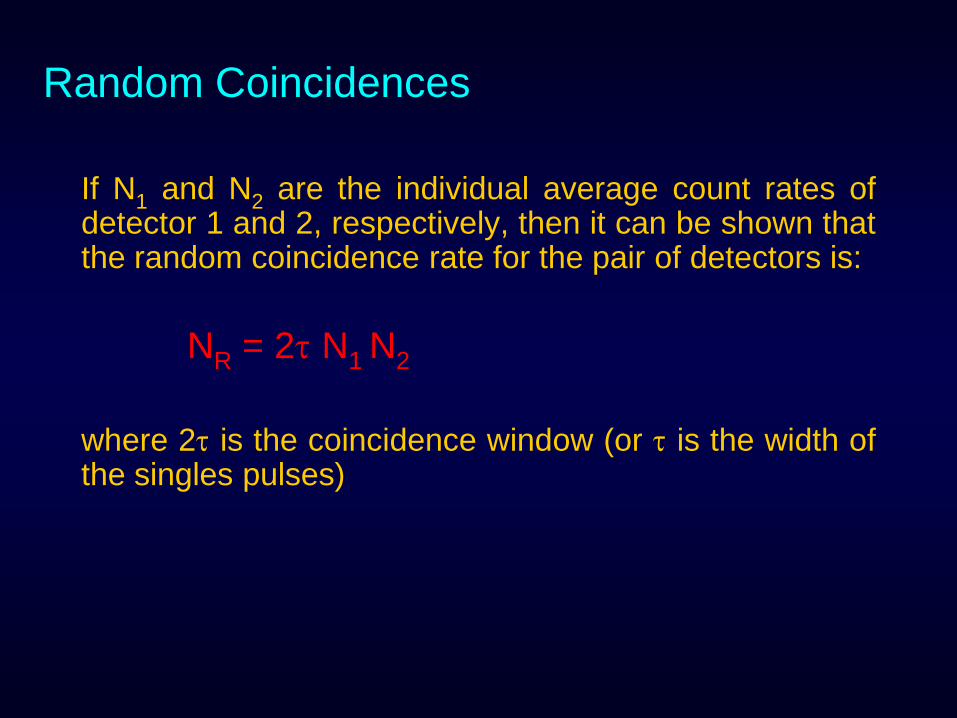
If N1 and N2 are the individual average count rates ofdetector 1 and 2, respectively, then it can be shown thatthe random coincidence rate for the pair of detectors is:
NR = 2τ N1 N2
where 2τ is the coincidence window (or τ is the width ofthe singles pulses)
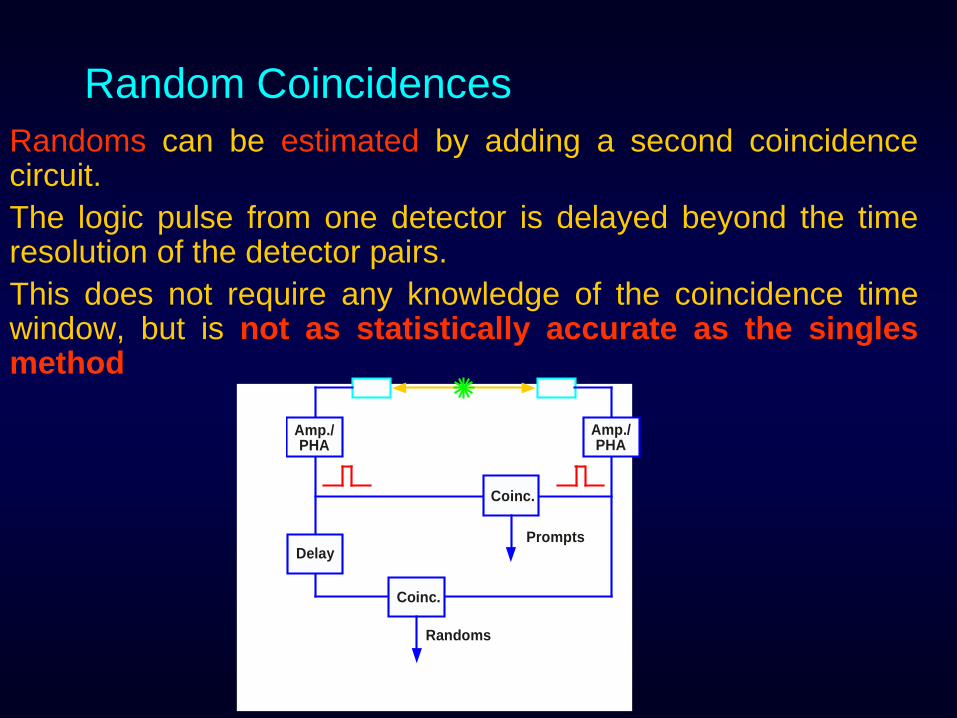
Random CoincidencesRandoms can be estimated by adding a second coincidencecircuit.The logic pulse from one detector is delayed beyond the timeresolution of the detector pairs.This does not require any knowledge of the coincidence timewindow, but is not as statistically accurate as the singlesmethod
Coinc.
Delay
Coinc.
Amp./PHA
Amp./PHA
Prompts
Randoms
Estimation of Random Coincidences
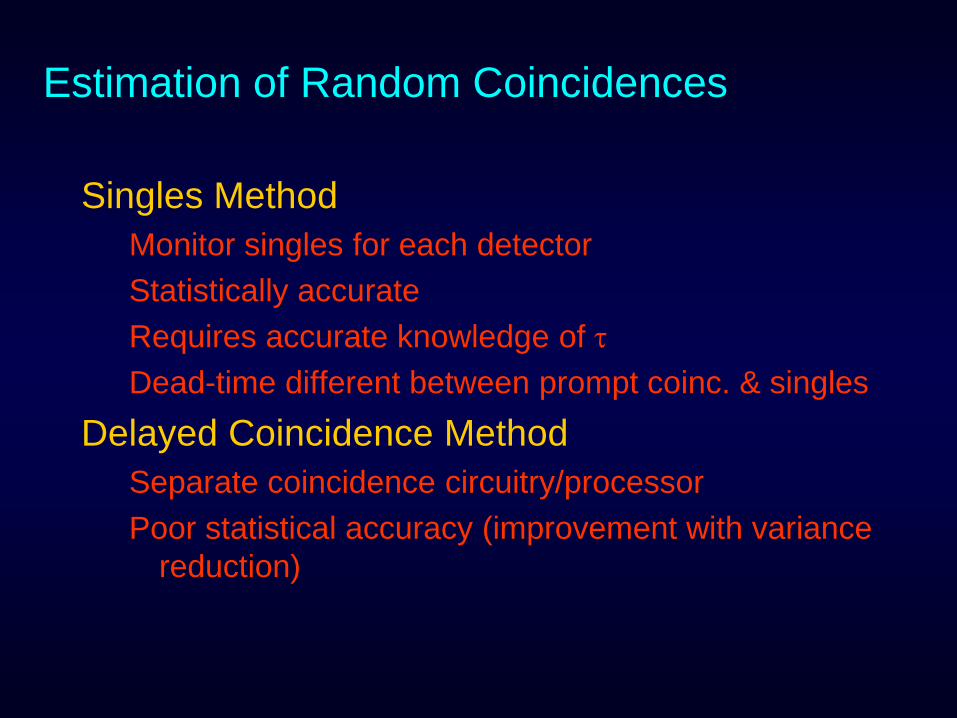
Singles MethodMonitor singles for each detectorStatistically accurateRequires accurate knowledge of τDead-time different between prompt coinc. & singles
Delayed Coincidence MethodSeparate coincidence circuitry/processorPoor statistical accuracy (improvement with variance
reduction)

ScatterScatter can be reduced by
better energy resolution
more collimation (2D)
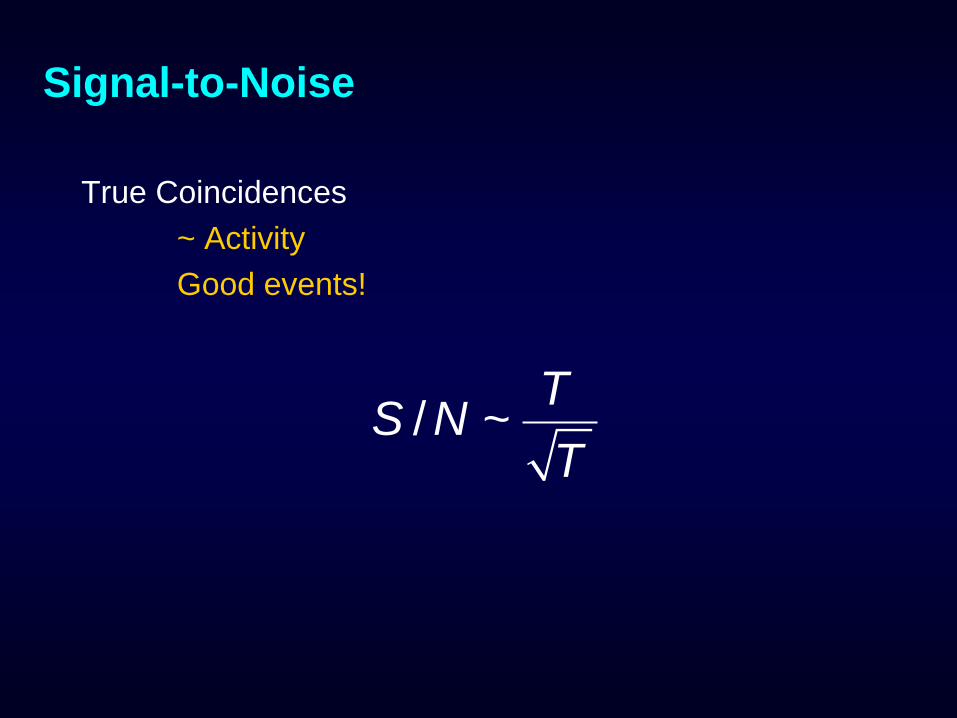
True Coincidences~ ActivityGood events!
Signal-to-Noise
/ ~ TS NT
Signal-to-Noise
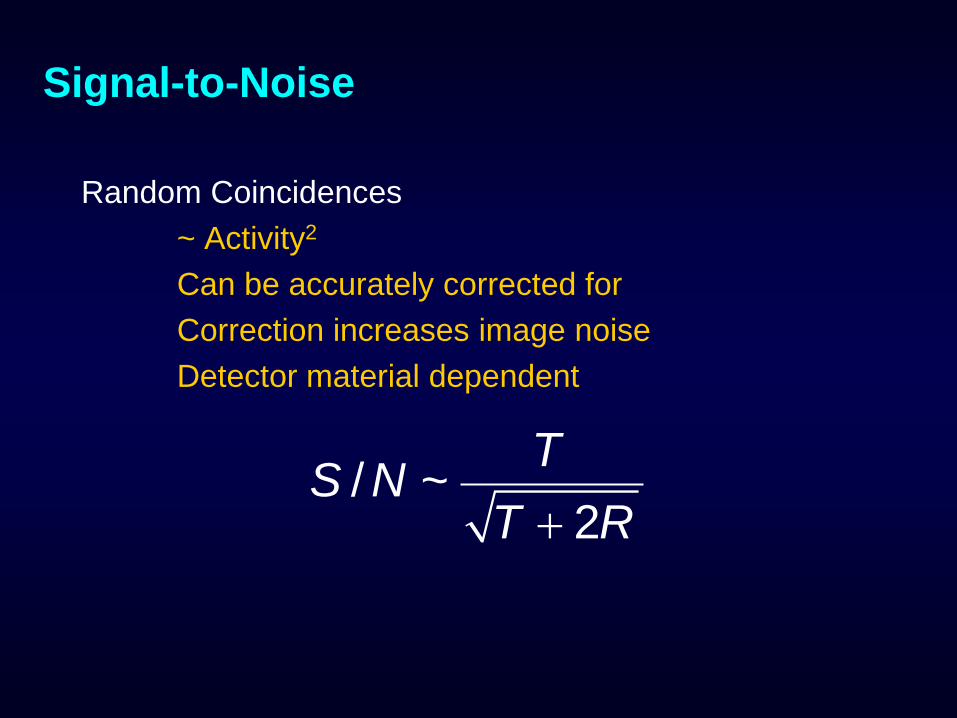
Random Coincidences~ Activity2
Can be accurately corrected forCorrection increases image noiseDetector material dependent
/ ~2
TS NT R+
Signal-to-Noise
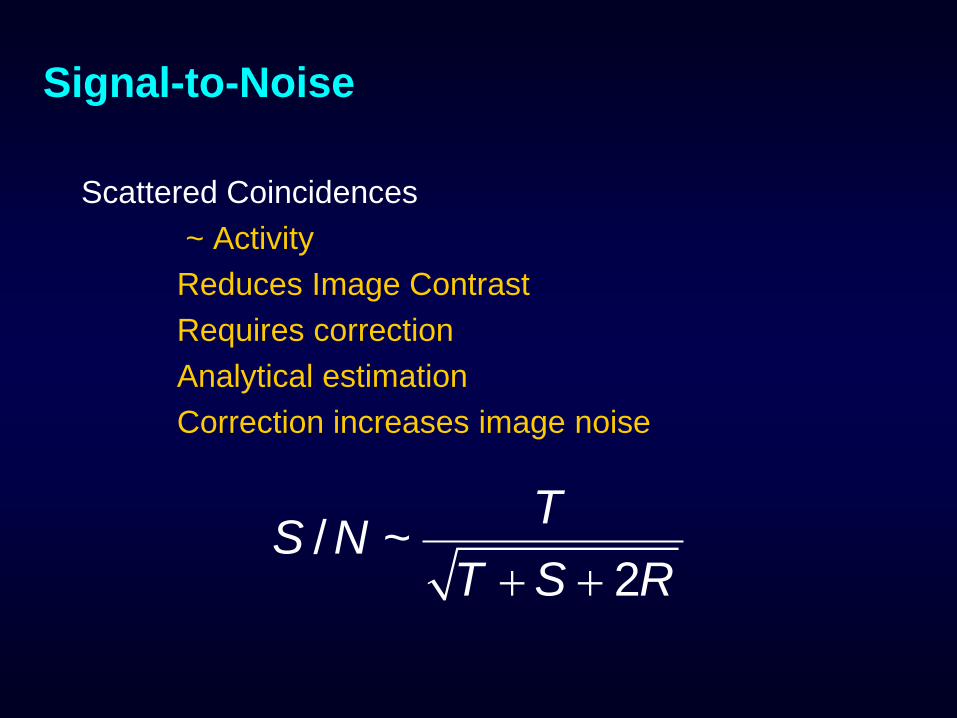
Scattered Coincidences~ ActivityReduces Image ContrastRequires correctionAnalytical estimationCorrection increases image noise
/ ~2
TS NT S R+ +

Signal-to-Noise
Multiple Coincidences:~ Activity3
Never savedSource of Dead time
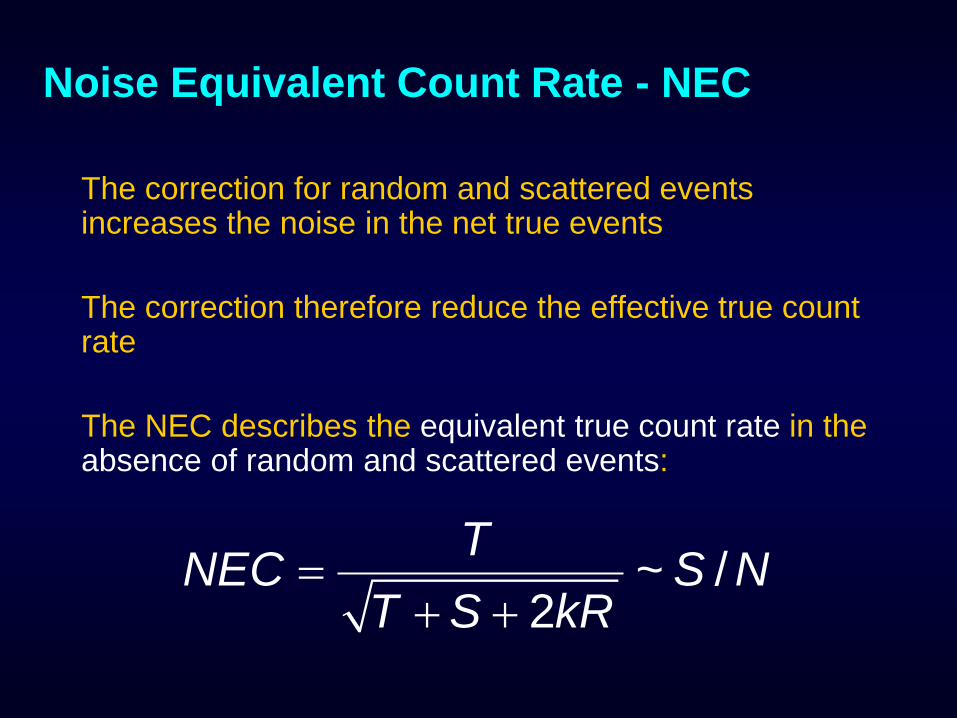
Noise Equivalent Count Rate - NEC
The correction for random and scattered events increases the noise in the net true events
The correction therefore reduce the effective true count rate
The NEC describes the equivalent true count rate in the absence of random and scattered events:
~ /2
TNEC S NT S kR
=+ +
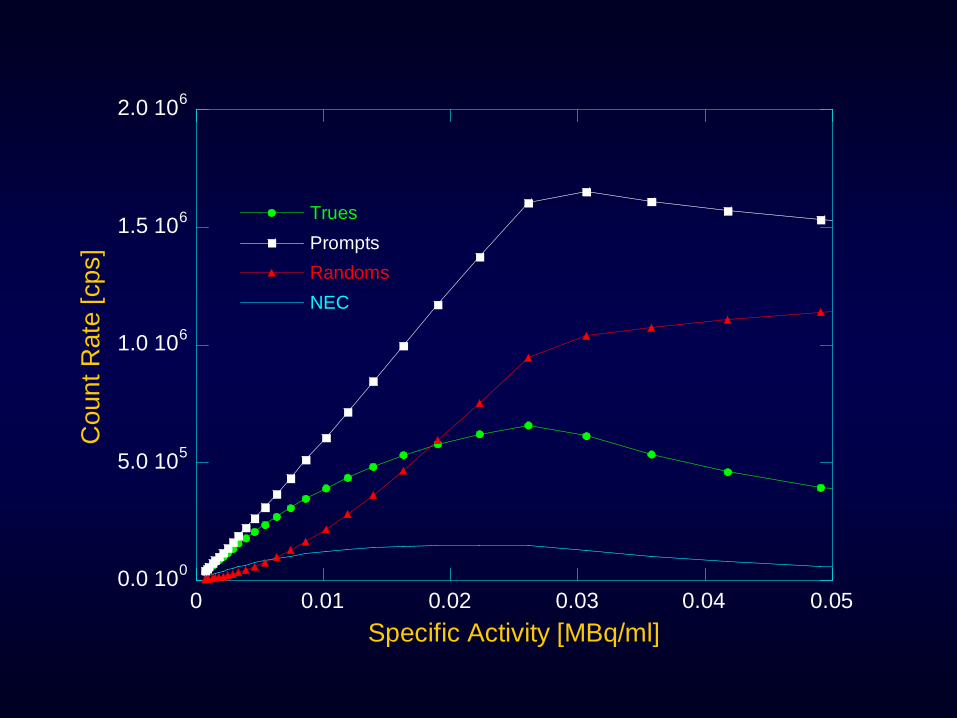
0.0 100
5.0 105
1.0 106
1.5 106
2.0 106
0 0.01 0.02 0.03 0.04 0.05
TruesPromptsRandomsNEC
Cou
nt R
ate
[cps
]
Specific Activity [MBq/ml]
Spatial Resolution
The spatial resolution in PET is primarily determined by:
Detector size
Physics of positron decay
System geometry
Detector material
Spatial Resolution
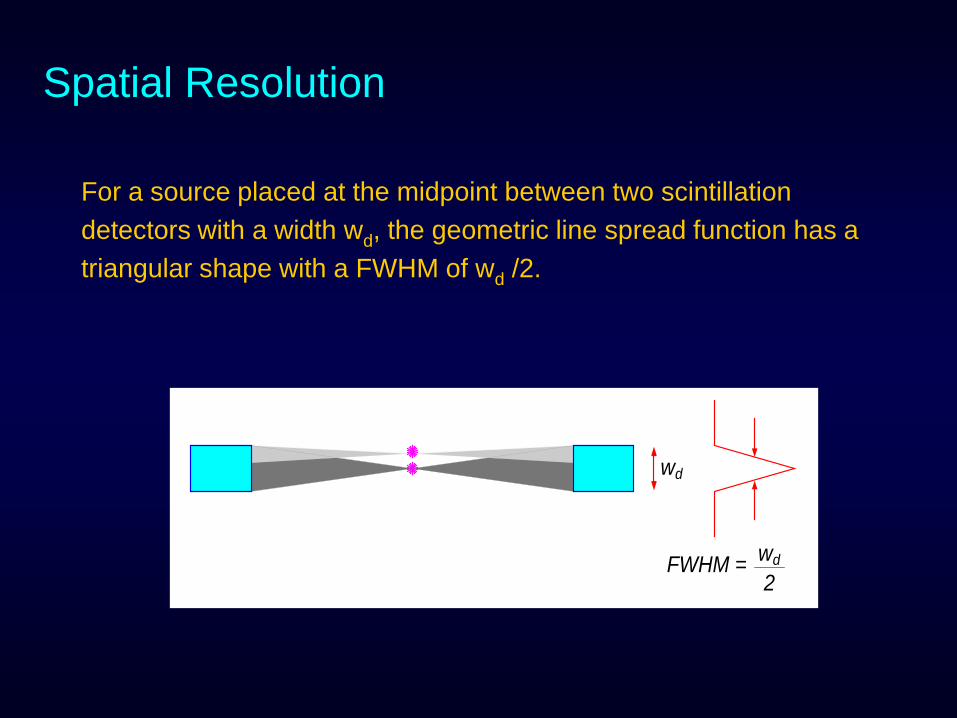
For a source placed at the midpoint between two scintillation detectors with a width wd, the geometric line spread function has a triangular shape with a FWHM of wd /2.
wd
2FWHM =
wd
Spatial Resolution -Tangential
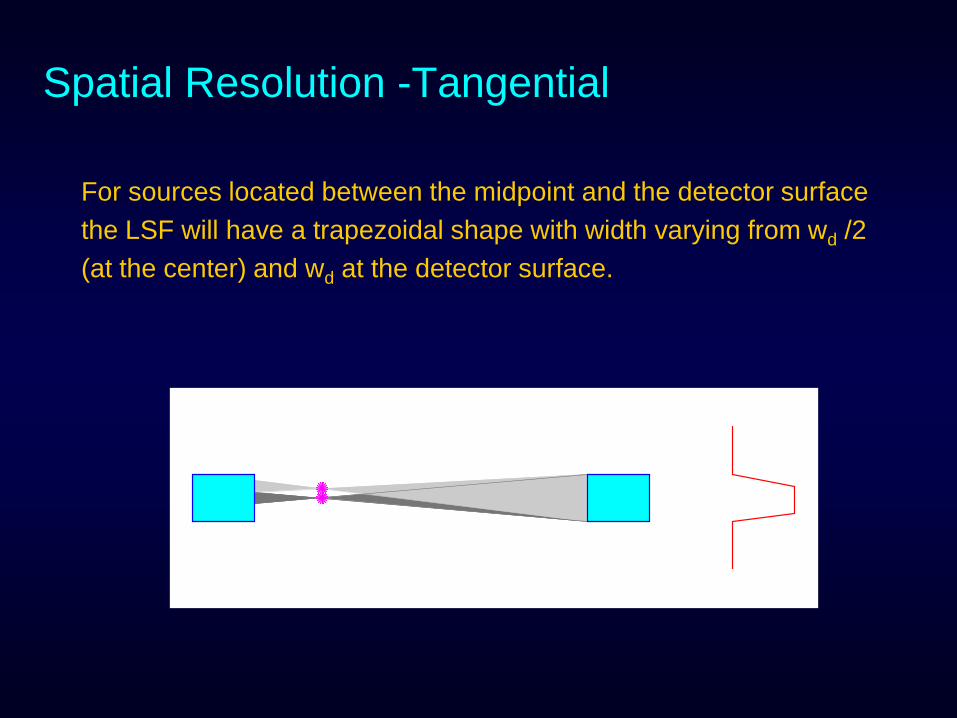
For sources located between the midpoint and the detector surface the LSF will have a trapezoidal shape with width varying from wd /2 (at the center) and wd at the detector surface.
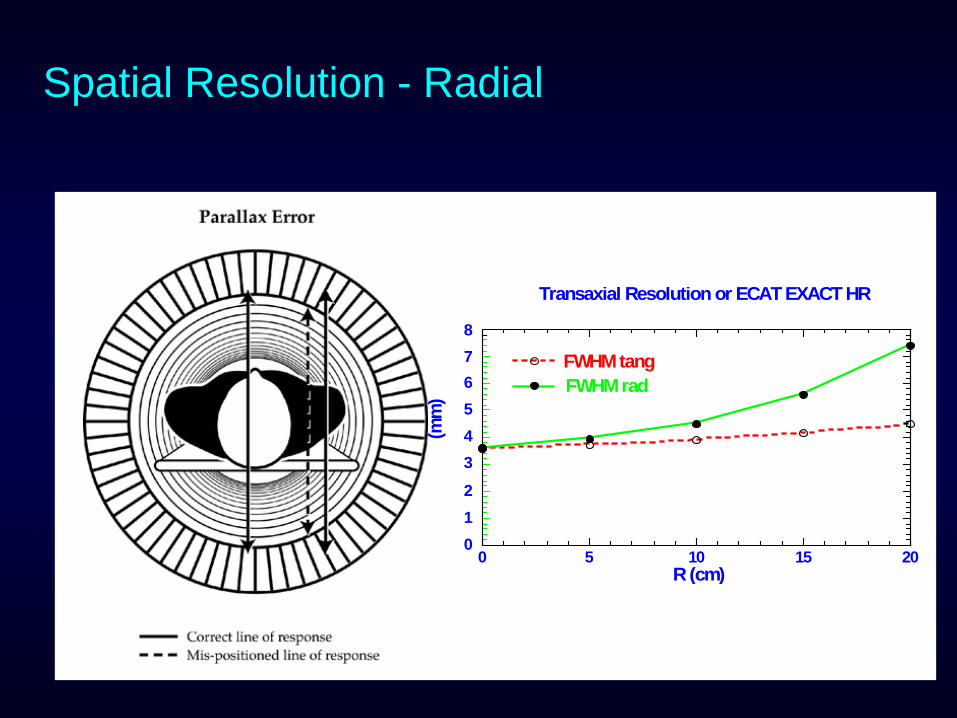
Spatial Resolution - Radial
Radial
R=0
Axial section Tangential
012
345678
0 5 10 15 20
FWHMtangFWHMrad
FWHM
(mm
)
R (cm)
Transaxial Resolution or ECAT EXACT HR
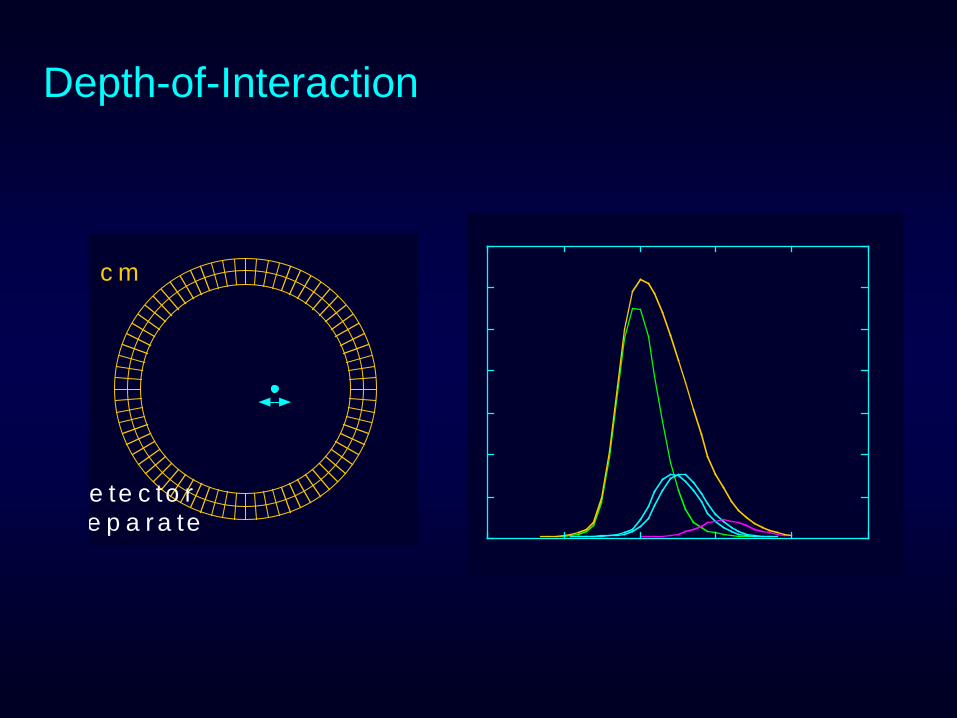
Depth-of-Interaction
c m
e te c to r e p a r a te
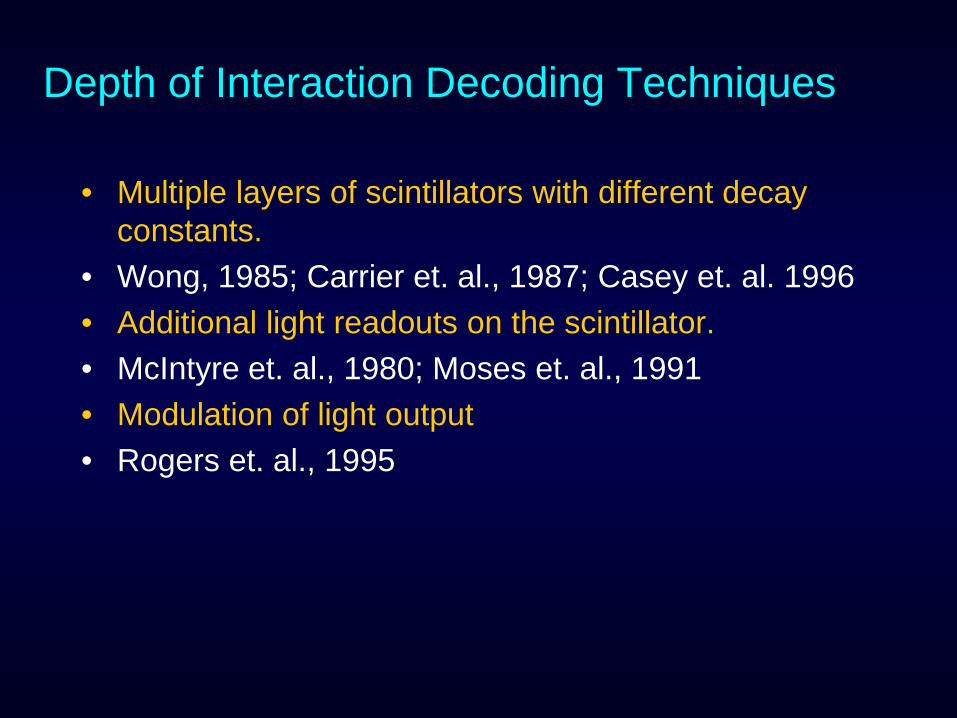
Depth of Interaction Decoding Techniques
• Multiple layers of scintillators with different decay constants.
• Wong, 1985; Carrier et. al., 1987; Casey et. al. 1996• Additional light readouts on the scintillator.• McIntyre et. al., 1980; Moses et. al., 1991• Modulation of light output• Rogers et. al., 1995
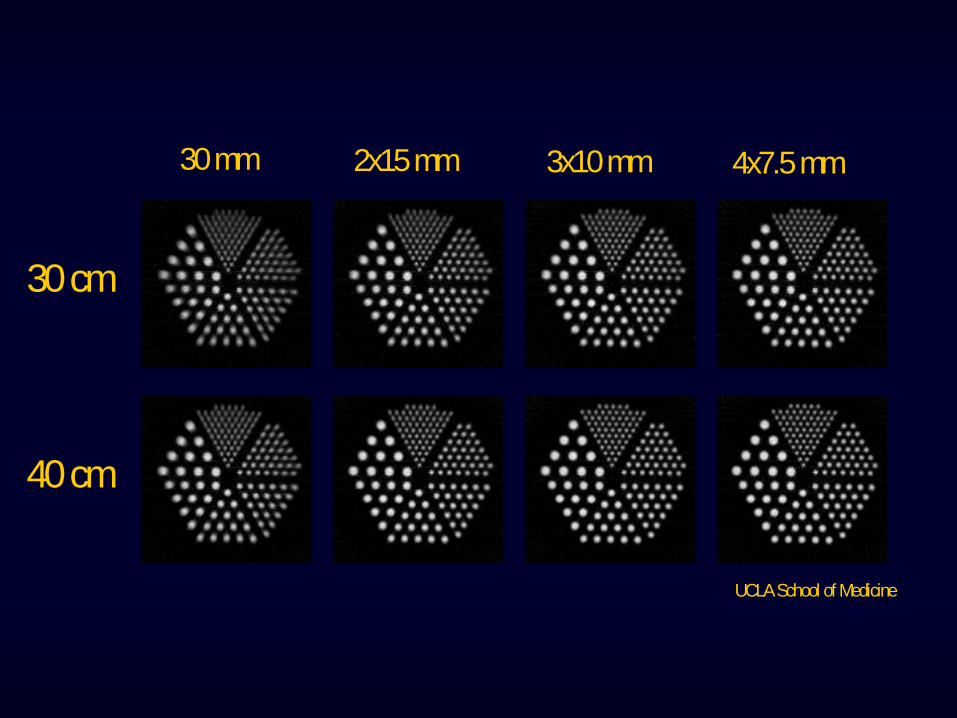
UCLA School of Medicine
30 cm
40 cm
30 mm 2x15 mm 3x10 mm 4x7.5 mm
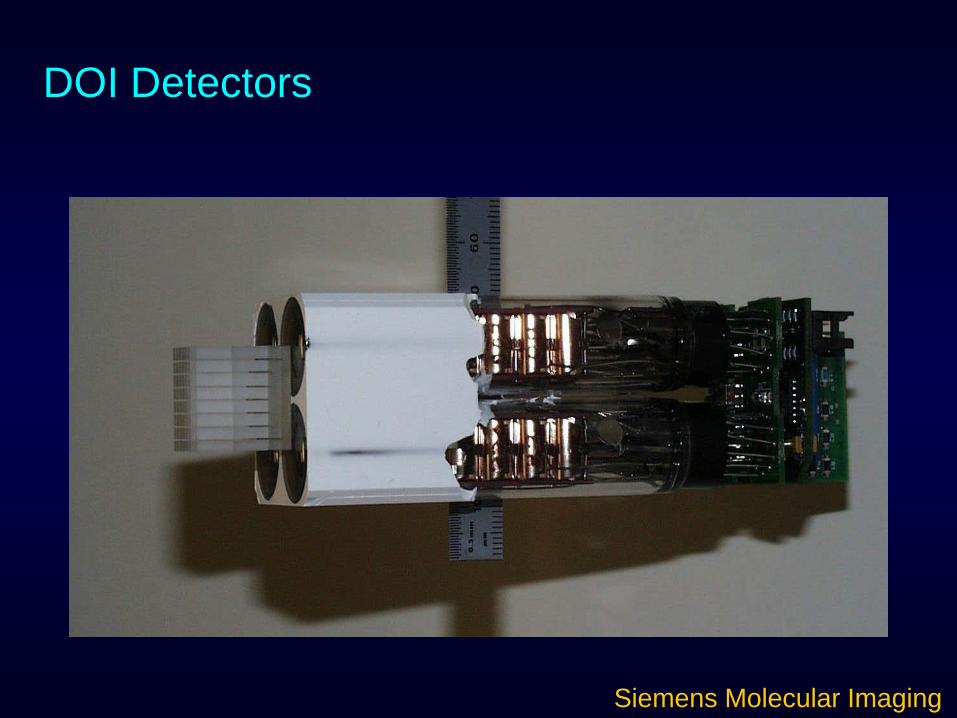
DOI Detectors
Siemens Molecular Imaging
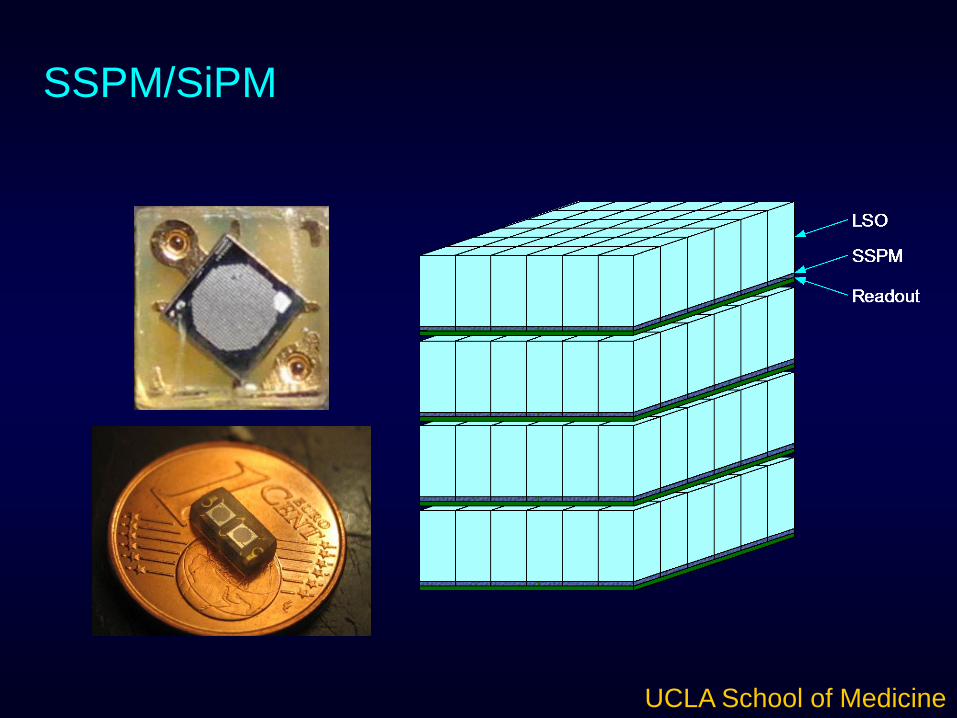
SSPM/SiPM
UCLA School of Medicine
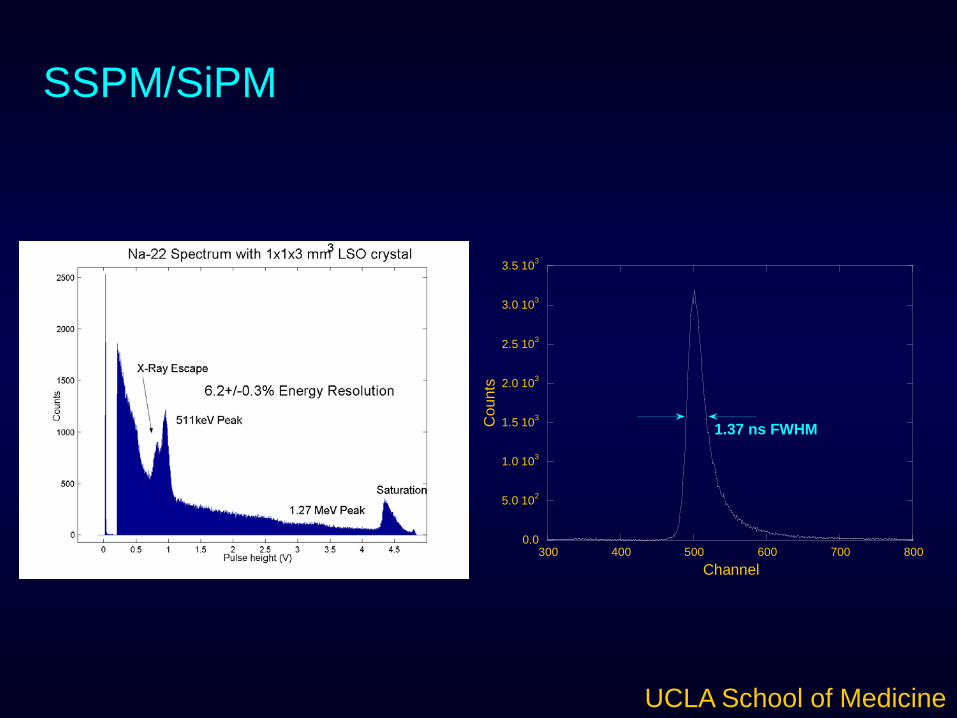
SSPM/SiPM
0.0
5.0 102
1.0 103
1.5 103
2.0 103
2.5 103
3.0 103
3.5 103
300 400 500 600 700 800
Cou
nts
Channel
1.37 ns FWHM
UCLA School of Medicine
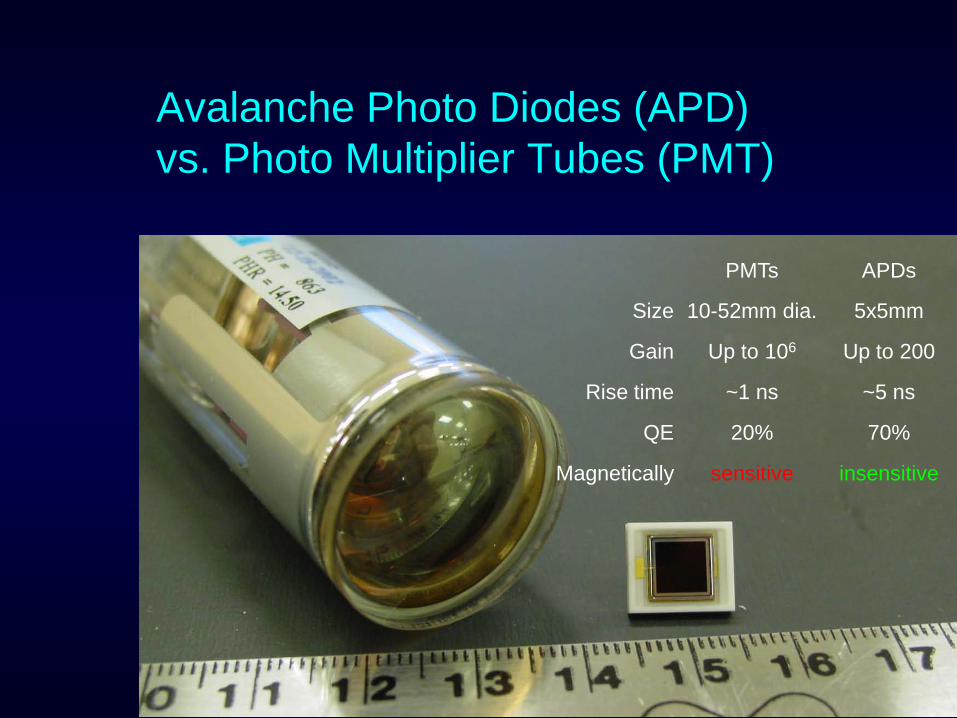
Avalanche Photo Diodes (APD) vs. Photo Multiplier Tubes (PMT)
PMTs APDs
Size 10-52mm dia. 5x5mm
Gain Up to 106 Up to 200
Rise time ~1 ns ~5 ns
QE 20% 70%
Magnetically sensitive insensitive
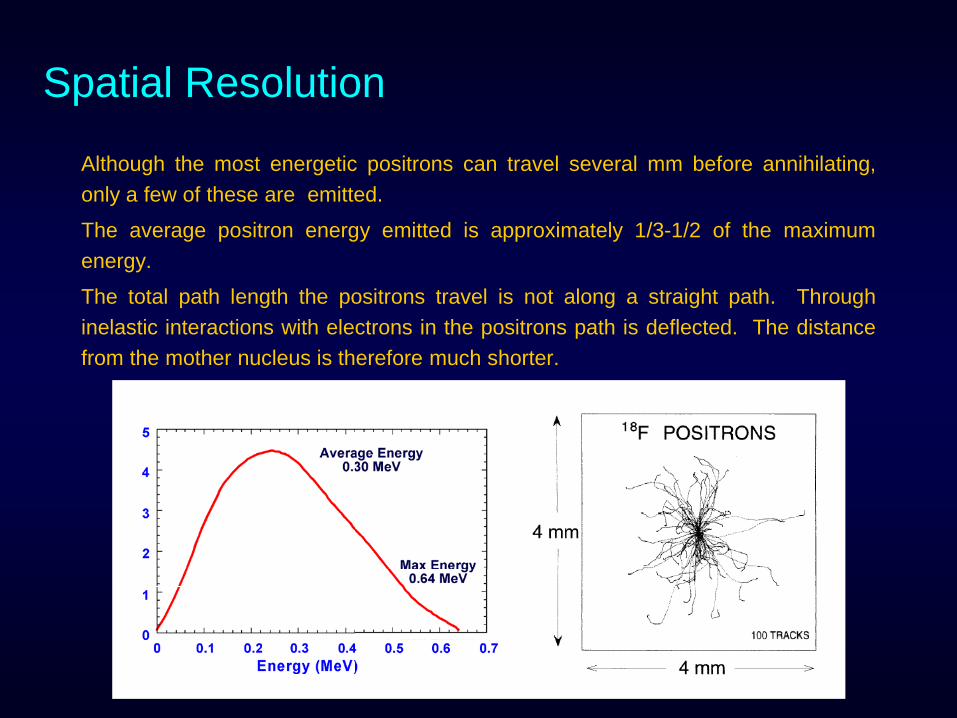
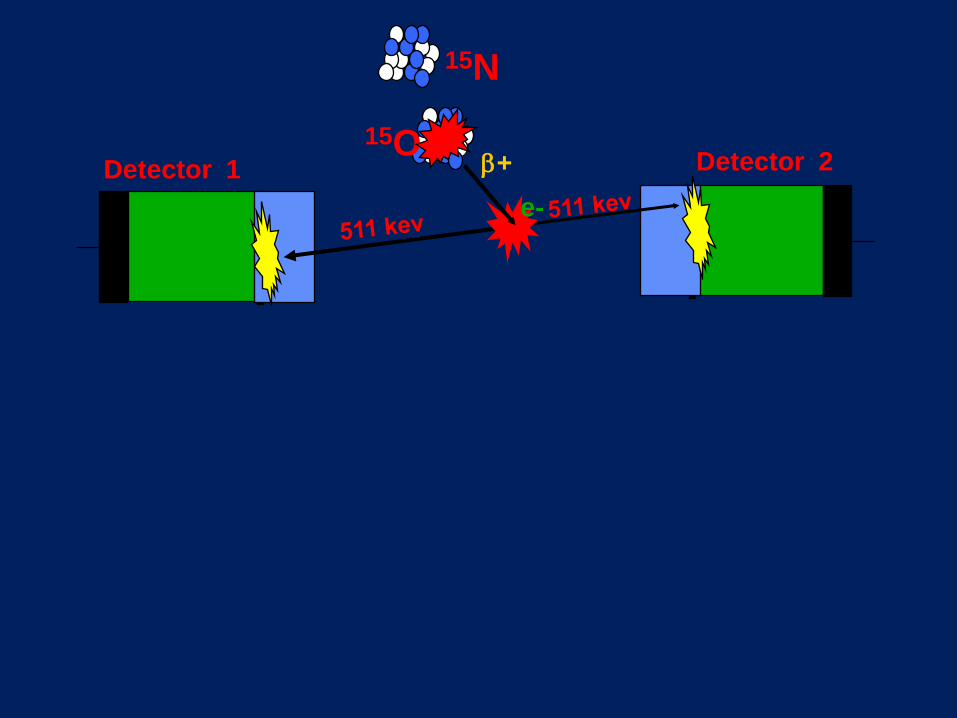
Although the most energetic positrons can travel several mm before annihilating,only a few of these are emitted.
The average positron energy emitted is approximately 1/3-1/2 of the maximumenergy.
The total path length the positrons travel is not along a straight path. Throughinelastic interactions with electrons in the positrons path is deflected. The distancefrom the mother nucleus is therefore much shorter.
Spatial Resolution
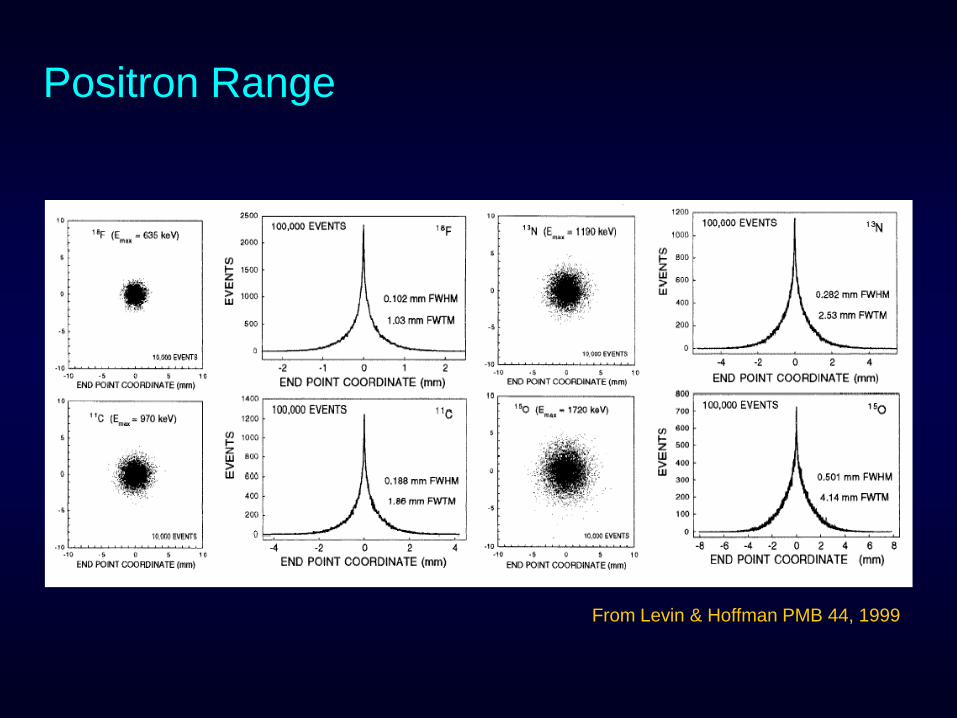
Positron Range
From Levin & Hoffman PMB 44, 1999
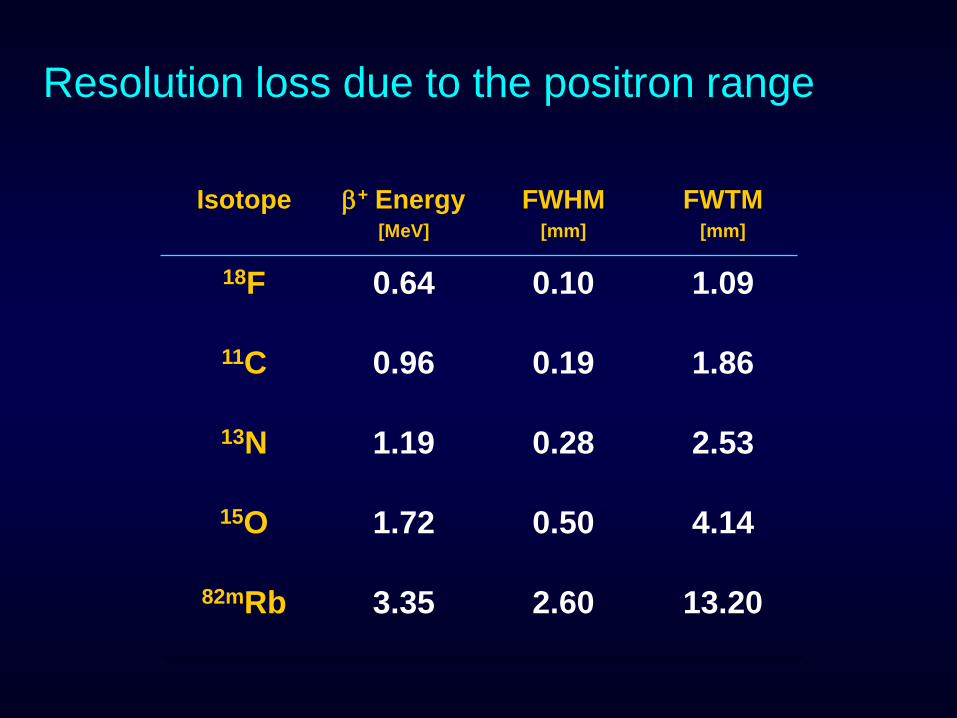
Resolution loss due to the positron range
Isotope β+ Energy[MeV]
FWHM[mm]
FWTM[mm]
18F 0.64 0.10 1.09
11C 0.96 0.19 1.86
13N 1.19 0.28 2.53
15O 1.72 0.50 4.14
82mRb 3.35 2.60 13.20

Positron Range
18F635 keV
124I1.53 & 2.14 MeV
~65% ~50%
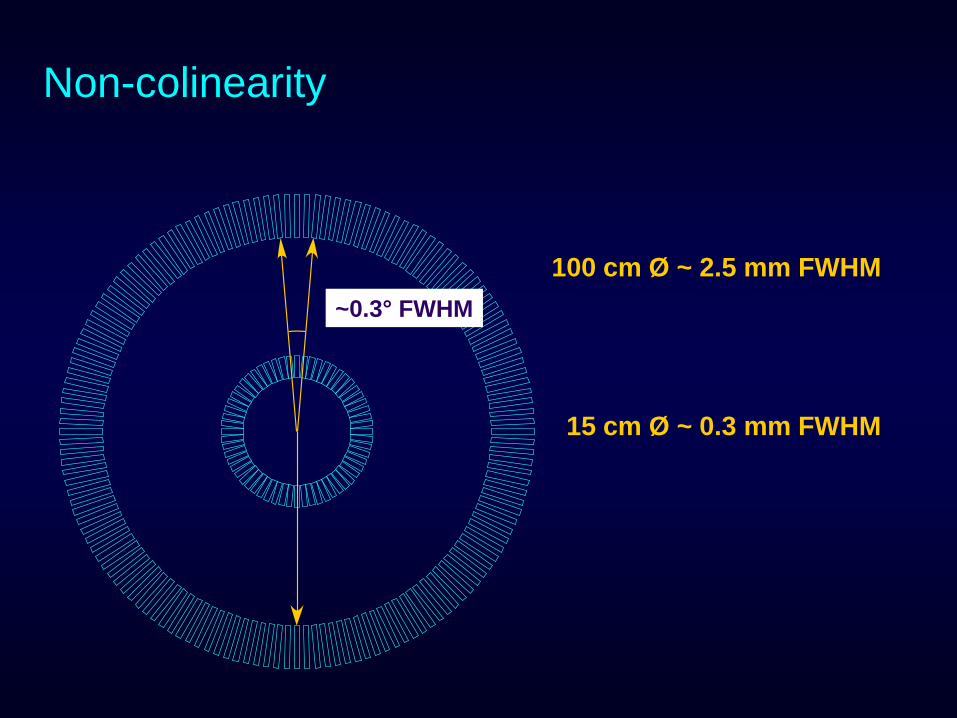
~0.3° FWHM100 cm Ø ~ 2.5 mm FWHM
15 cm Ø ~ 0.3 mm FWHM
Non-colinearity
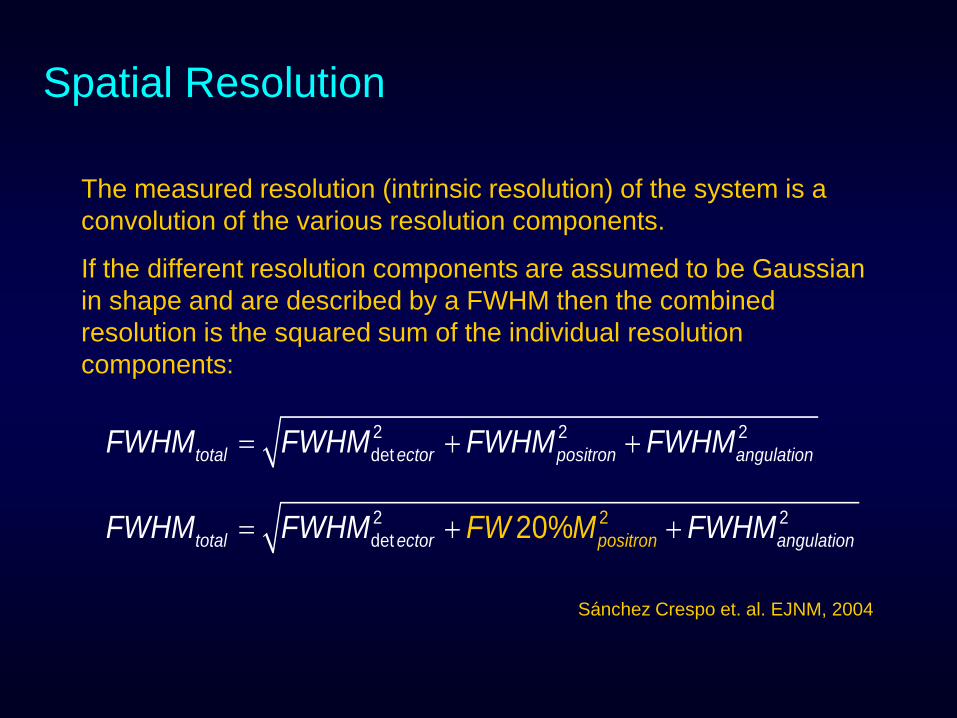
Spatial Resolution
The measured resolution (intrinsic resolution) of the system is a convolution of the various resolution components.
If the different resolution components are assumed to be Gaussian in shape and are described by a FWHM then the combined resolution is the squared sum of the individual resolution components:
2 2 2dettotal ector positron angulationFWHM FWHM FWHM FWHM= + +
2d
22et 20% posittotal ector angulatin onroFWHM FWHM W FWHF MM= + +
Sánchez Crespo et. al. EJNM, 2004
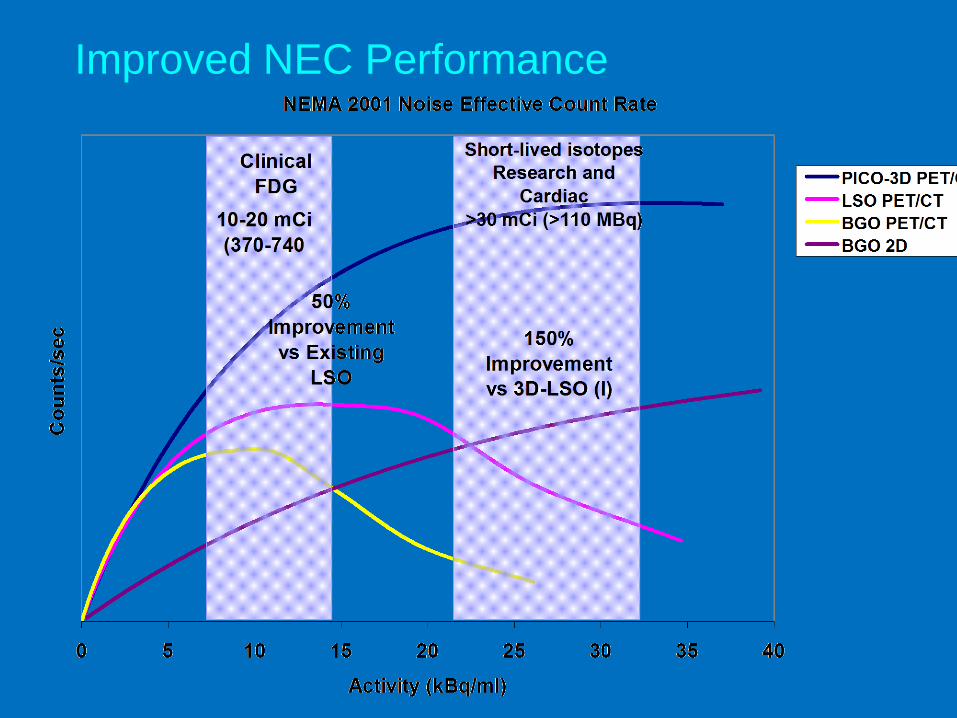
Improved NEC Performance
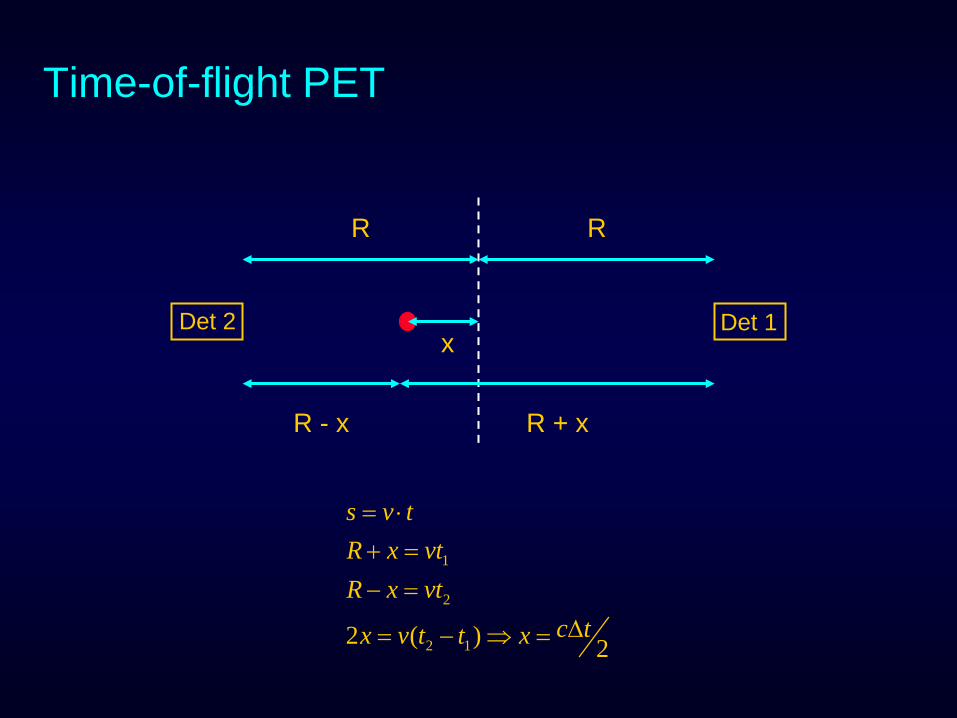
Time-of-flight PET
x
R R
R - x R + x
1
2
2 12 ( ) 2
s v tR x vtR x vt
c tx v t t x
= ⋅+ =− =
∆= − ⇒ =
Det 2 Det 1
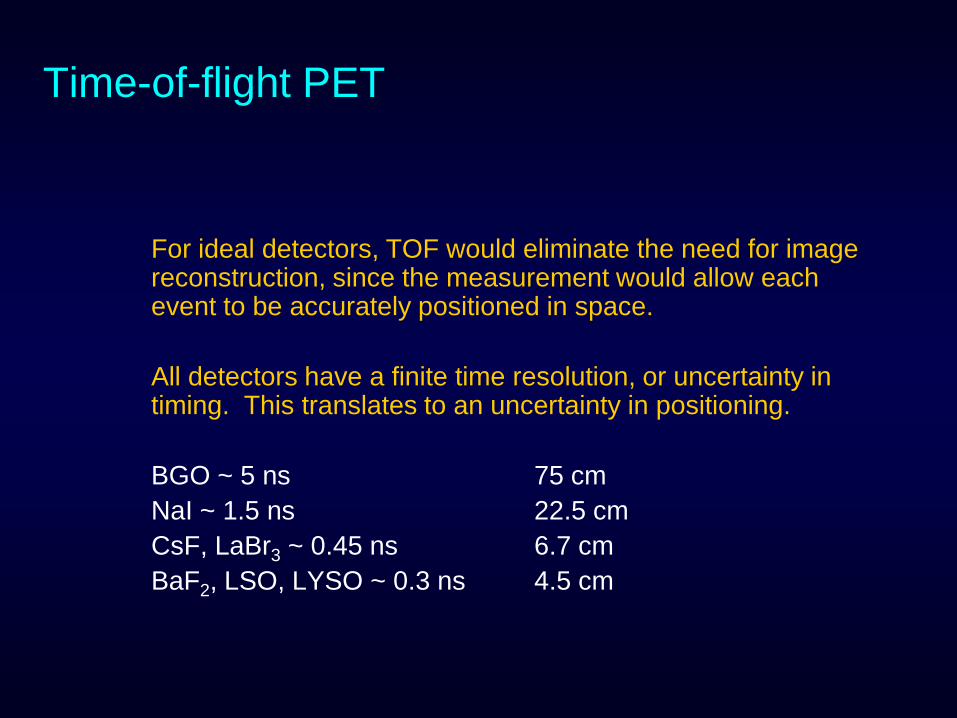
Time-of-flight PET
For ideal detectors, TOF would eliminate the need for image reconstruction, since the measurement would allow each event to be accurately positioned in space.
All detectors have a finite time resolution, or uncertainty in timing. This translates to an uncertainty in positioning.
BGO ~ 5 ns 75 cmNaI ~ 1.5 ns 22.5 cmCsF, LaBr3 ~ 0.45 ns 6.7 cmBaF2, LSO, LYSO ~ 0.3 ns 4.5 cm
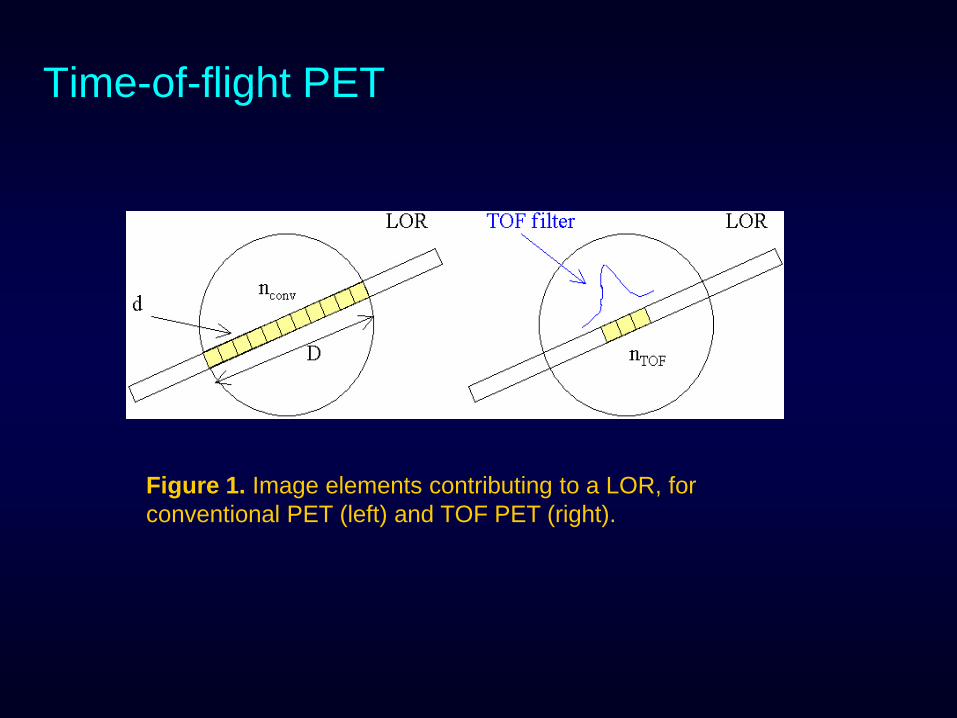
Time-of-flight PET
Figure 1. Image elements contributing to a LOR, for conventional PET (left) and TOF PET (right).
Time-of-flight PET
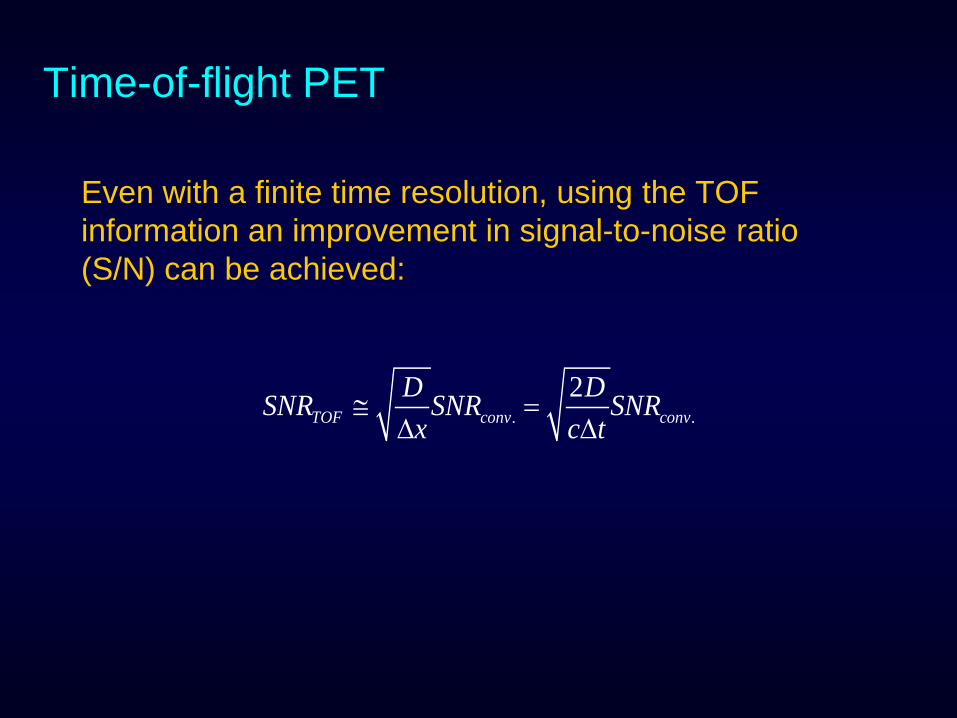
Even with a finite time resolution, using the TOF information an improvement in signal-to-noise ratio (S/N) can be achieved:
. .2
≅ =∆ ∆TOF conv convD DSNR SNR SNRx c t
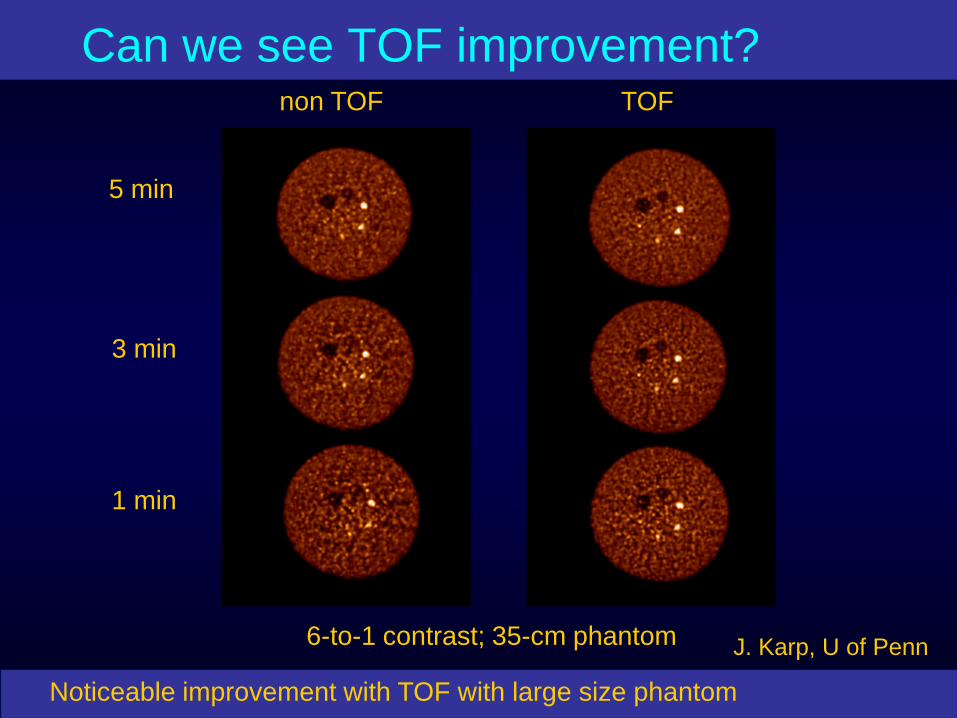
Can we see TOF improvement?
Noticeable improvement with TOF with large size phantom
1 min
non TOF TOF
3 min
6-to-1 contrast; 35-cm phantom
5 min
J. Karp, U of Penn
QUALITY CONTROL (QC)
Quality Control
Ensure operational integrity of the systemMaintain consistent and high image qualityMinimize chance for artifactsCatch potential problems earlyMaintain quantitative accuracy

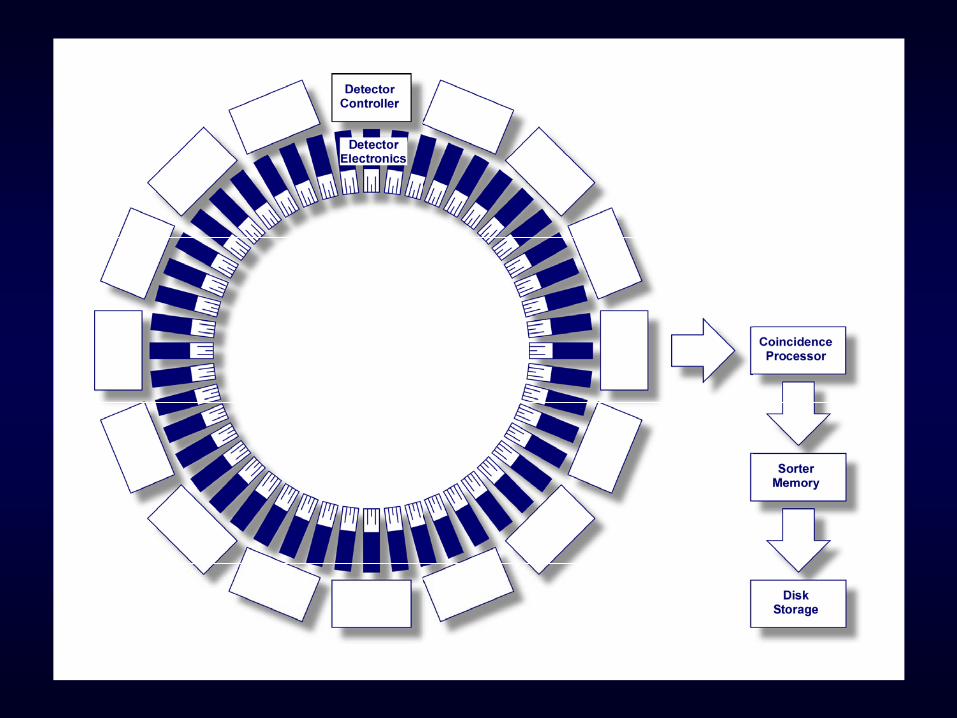
PET System, storage of data
Each detector is in coincidence with a sector of opposite detectors.
The angle of the section defines the Field of View (FOV)
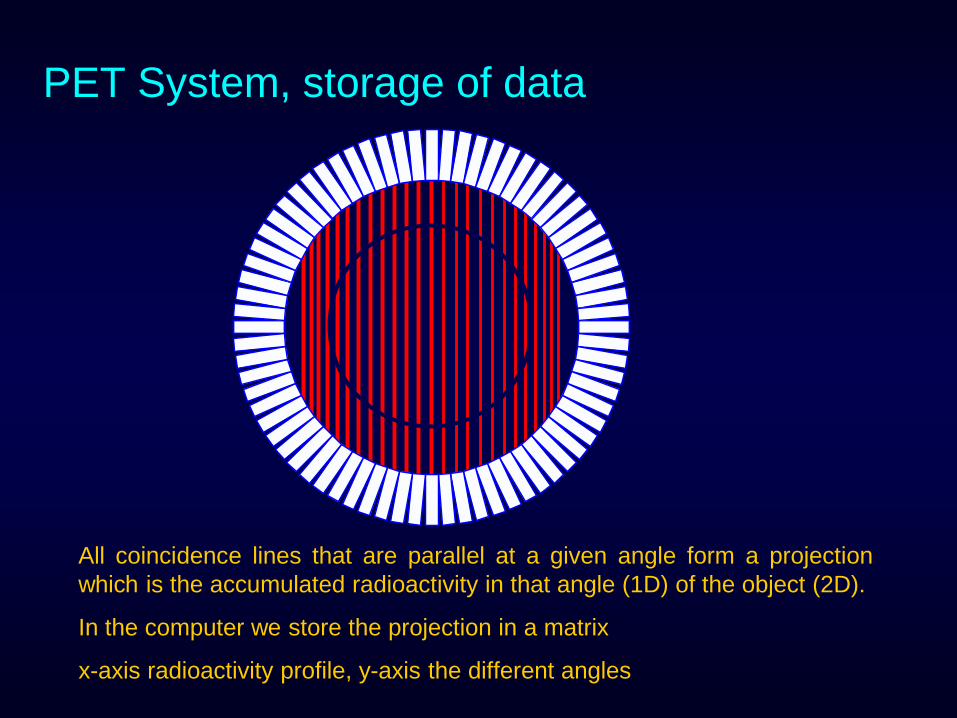
PET System, storage of data
All coincidence lines that are parallel at a given angle form a projectionwhich is the accumulated radioactivity in that angle (1D) of the object (2D).
In the computer we store the projection in a matrix
x-axis radioactivity profile, y-axis the different angles
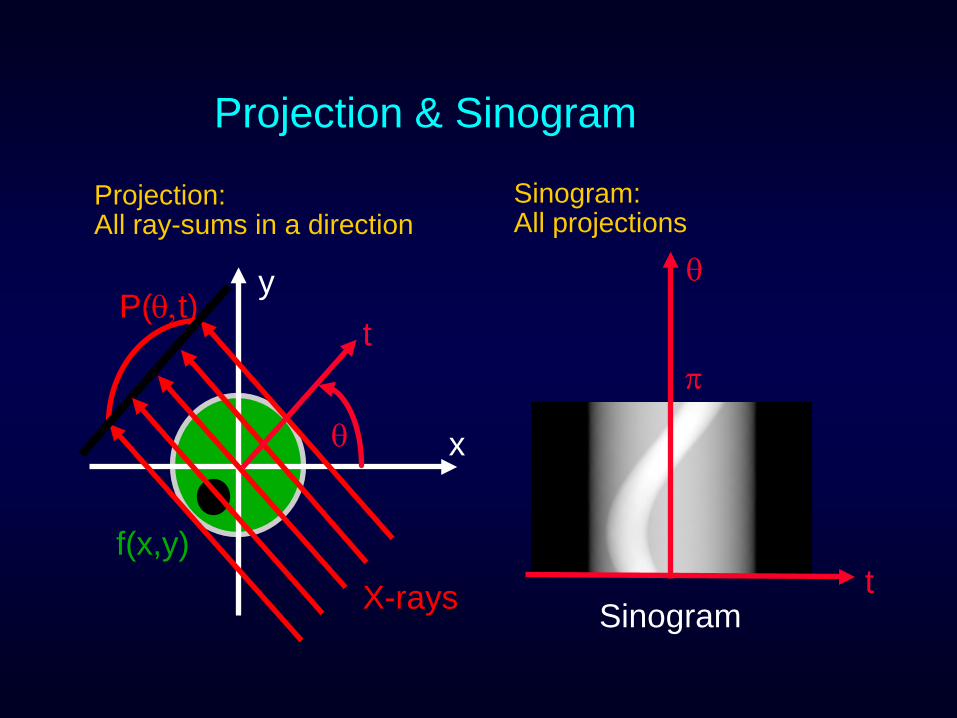
Projection & Sinogram
Sinogramt
θ
Sinogram:All projections
P(θ,t)
f(x,y)
t
θ
y
x
X-rays
Projection:All ray-sums in a direction
π
PET System
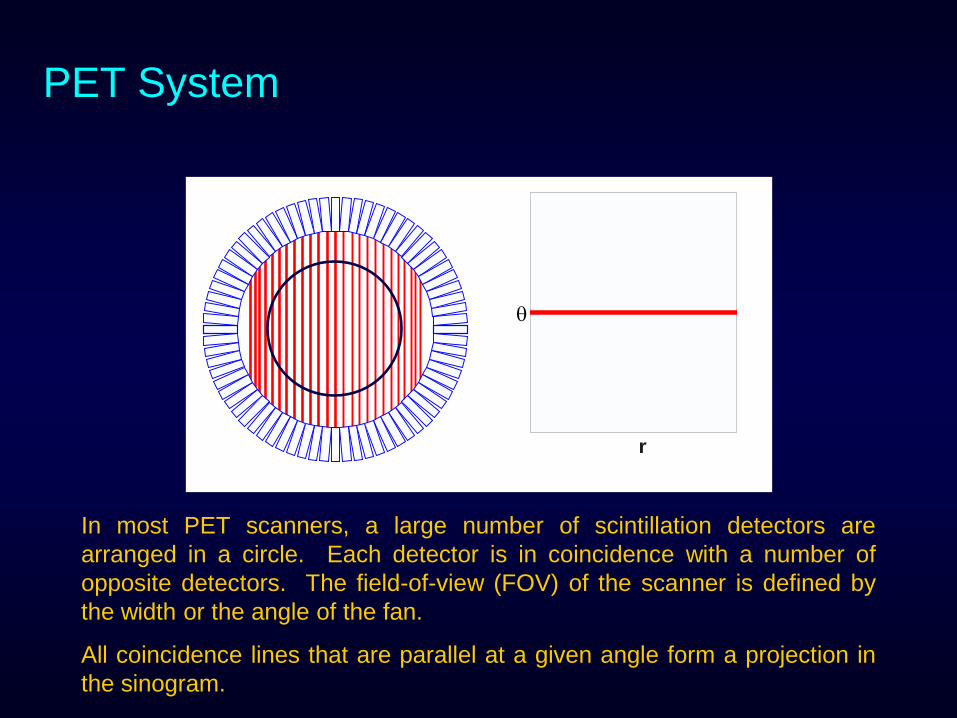
In most PET scanners, a large number of scintillation detectors arearranged in a circle. Each detector is in coincidence with a number ofopposite detectors. The field-of-view (FOV) of the scanner is defined bythe width or the angle of the fan.
All coincidence lines that are parallel at a given angle form a projection inthe sinogram.
r
θ
PET System
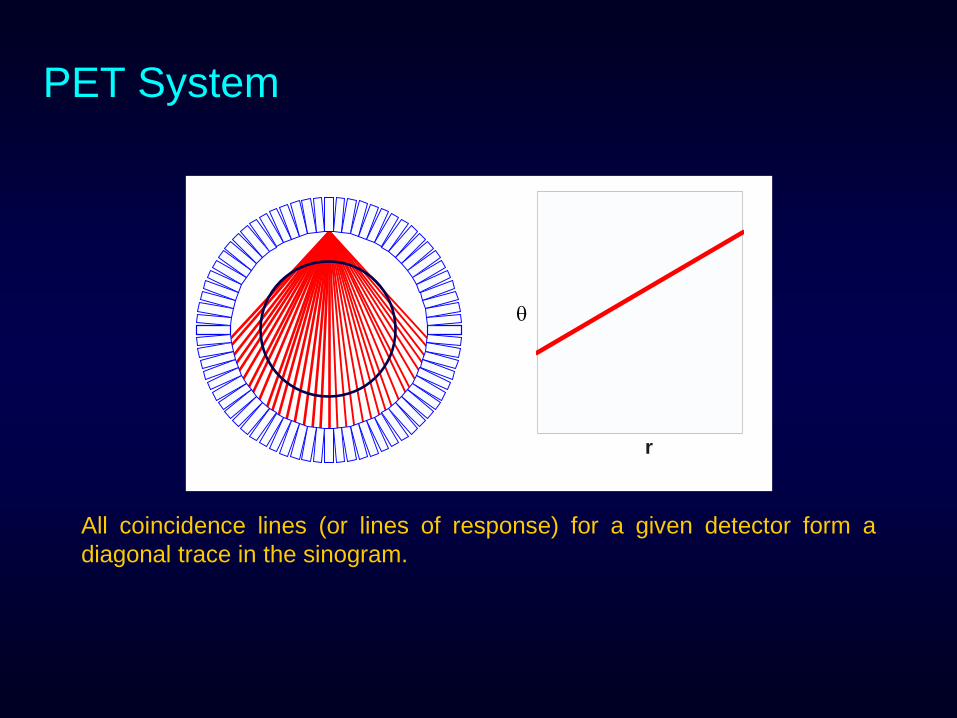
All coincidence lines (or lines of response) for a given detector form adiagonal trace in the sinogram.
r
θ
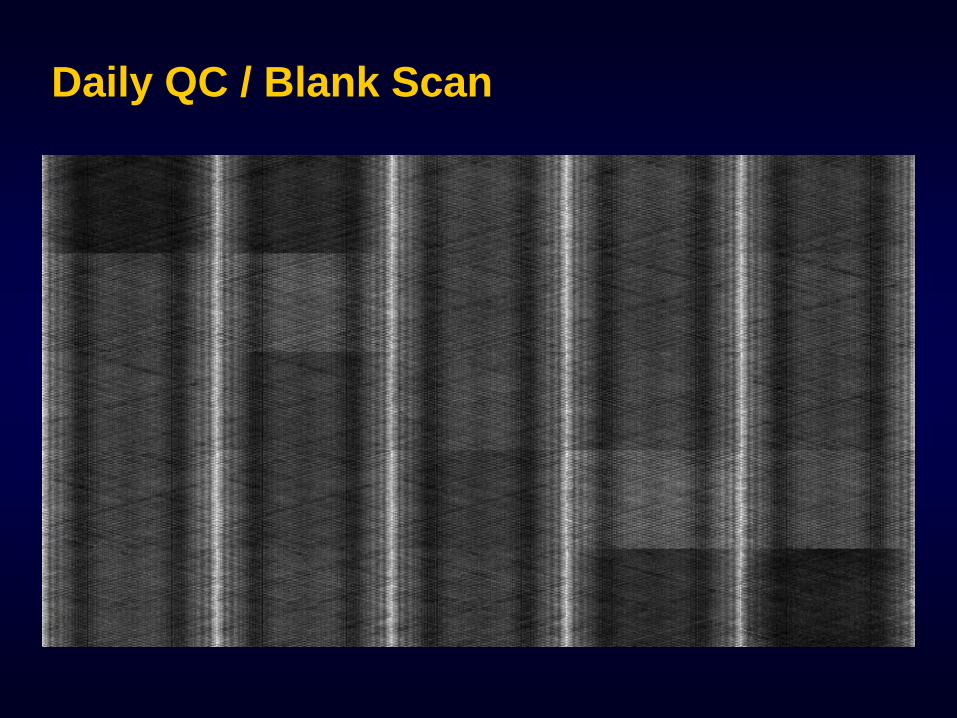
Daily QC / Blank Scan
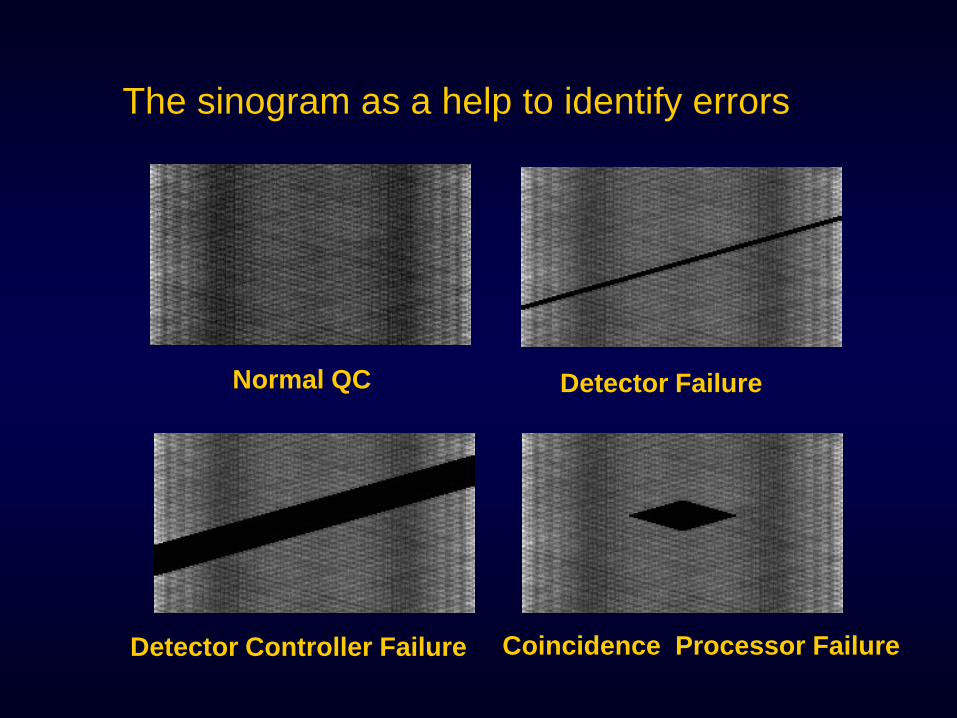
Normal QC Detector Failure
Detector Controller Failure Coincidence Processor Failure
The sinogram as a help to identify errors
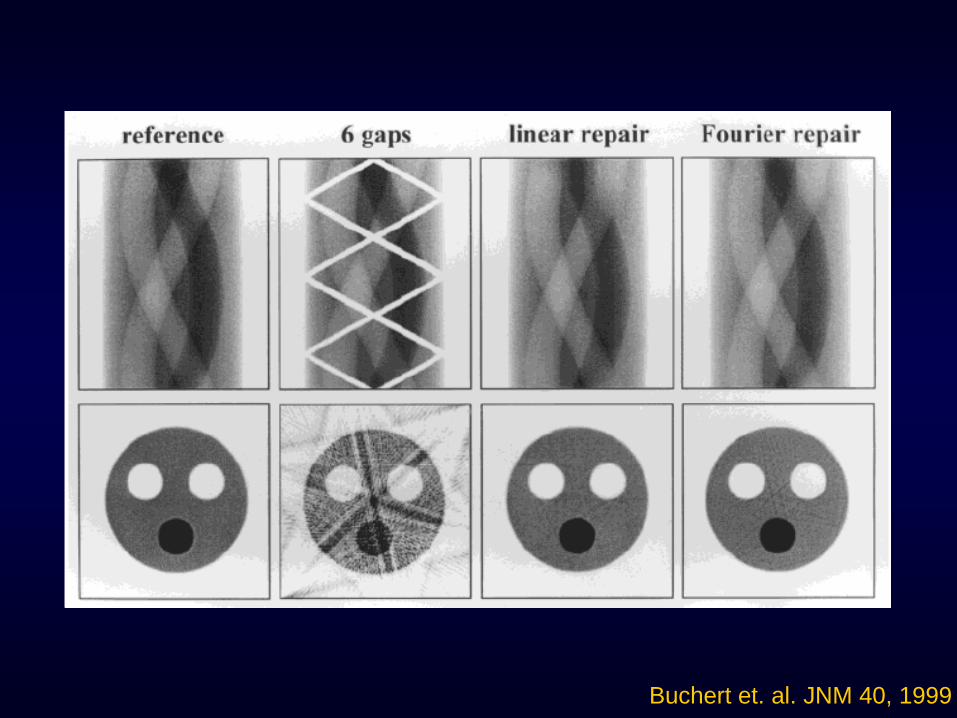
Buchert et. al. JNM 40, 1999
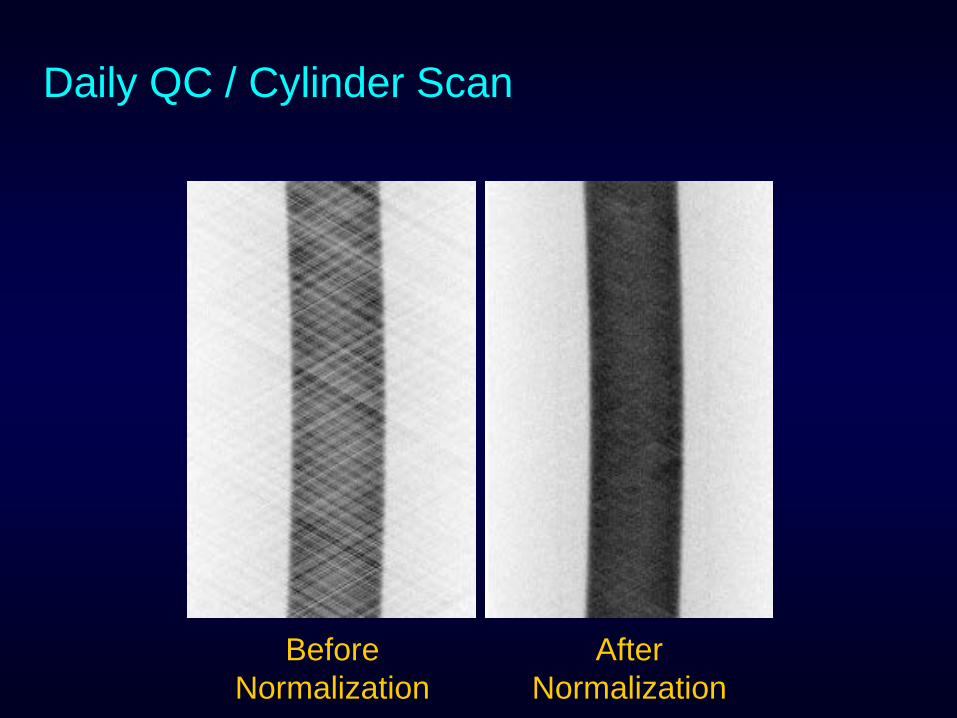
Daily QC / Cylinder Scan
BeforeNormalization
AfterNormalization
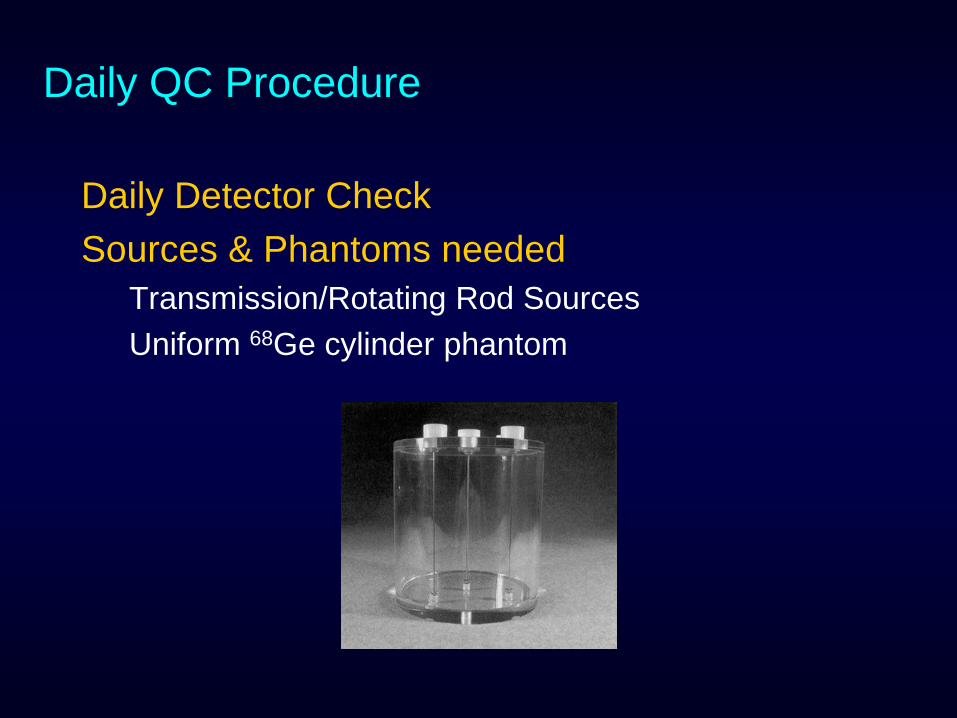
Daily QC Procedure
Daily Detector CheckSources & Phantoms needed
Transmission/Rotating Rod SourcesUniform 68Ge cylinder phantom
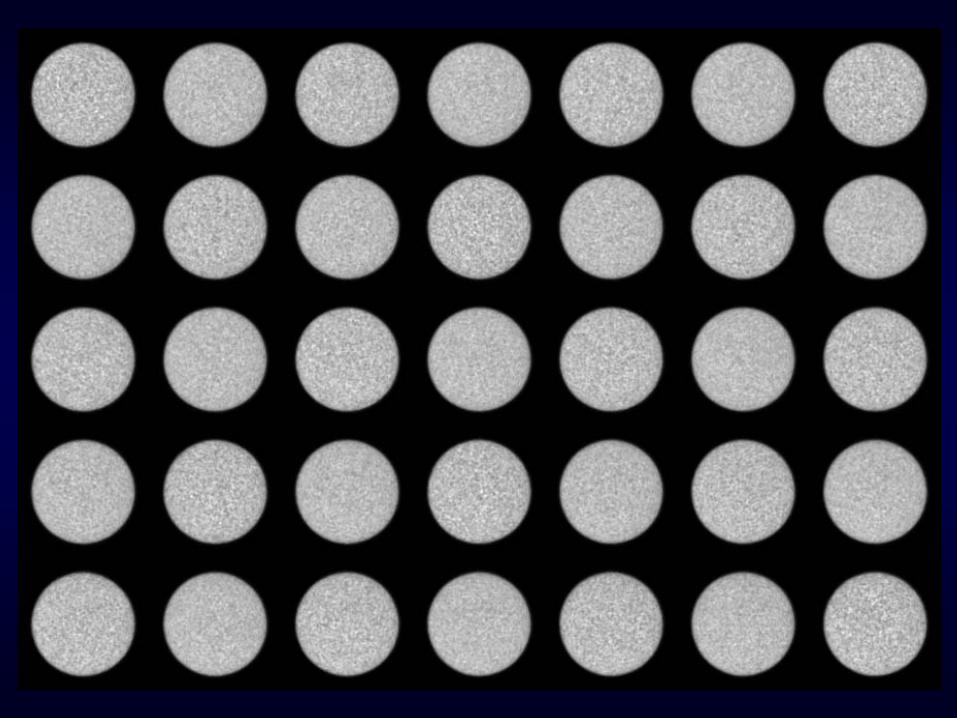
Daily / Weekly Quantitation Scan
Scan uniform 20 cm Ø 68Ge or 18F Cylinder
Reconstruct:
All corrections applied
Standard reconstruction parameters
Visual inspection
Compare image ROI activity to calibrated activity
Always perform after:
Service
Re-tuning
Re-normalization
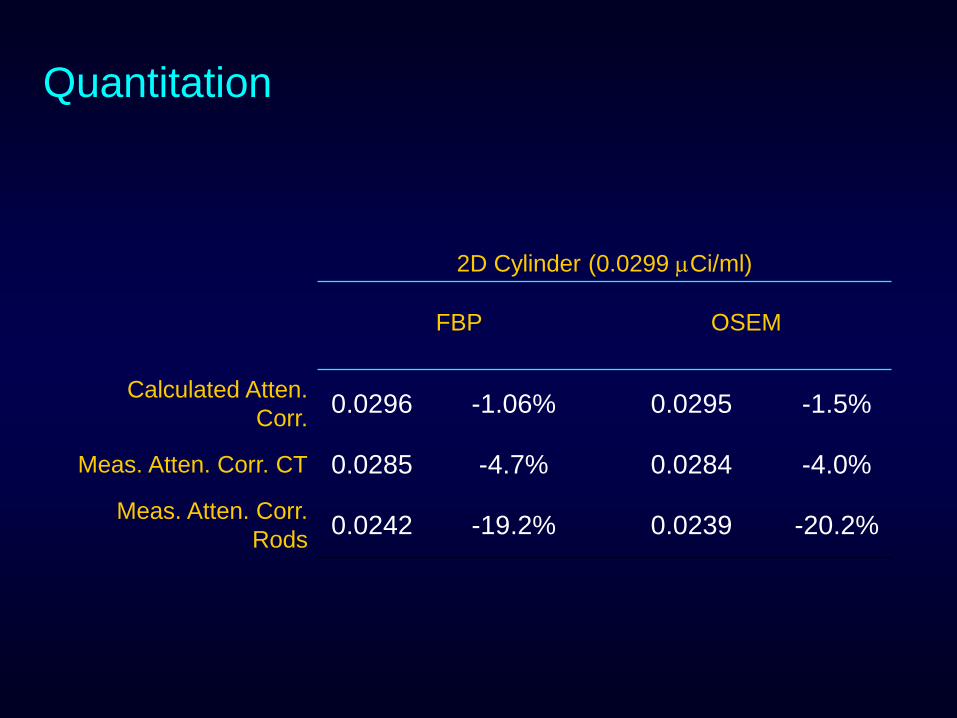
Quantitation
2D Cylinder (0.0299 µCi/ml)
FBP OSEM
Calculated Atten. Corr. 0.0296 -1.06% 0.0295 -1.5%
Meas. Atten. Corr. CT 0.0285 -4.7% 0.0284 -4.0%
Meas. Atten. Corr. Rods 0.0242 -19.2% 0.0239 -20.2%
Quarterly QC Procedures
Detector setup (if needed)PMT tuning
Detector setup
Coincidence timing
Normalization
Gantry alignment (for PET/CT)Always after Service
Software upgrades
Other calibrations (well counter, etc)
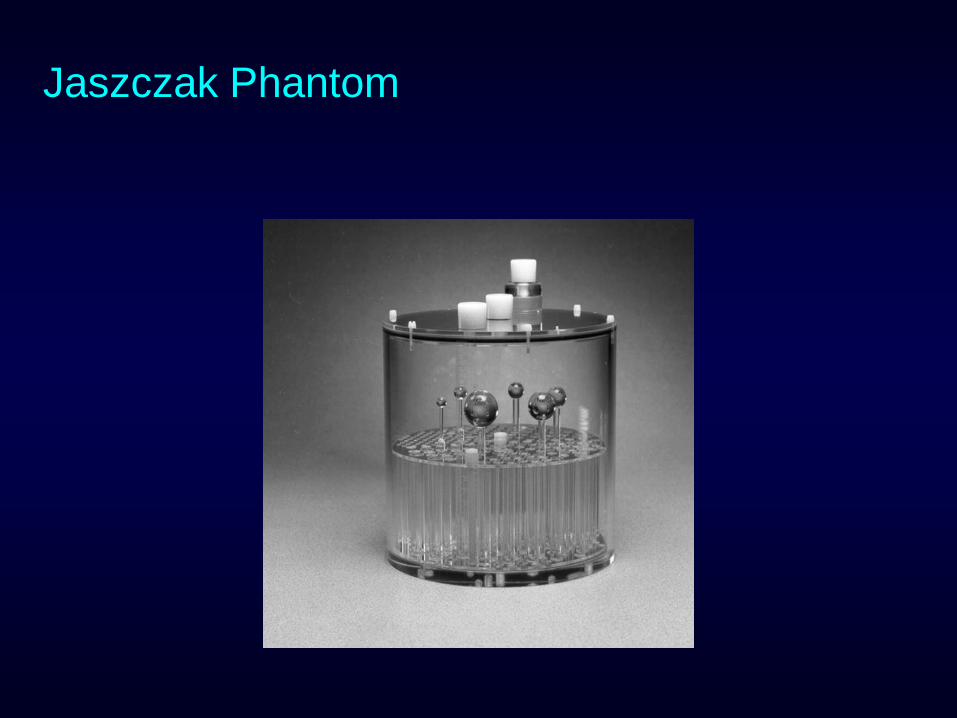
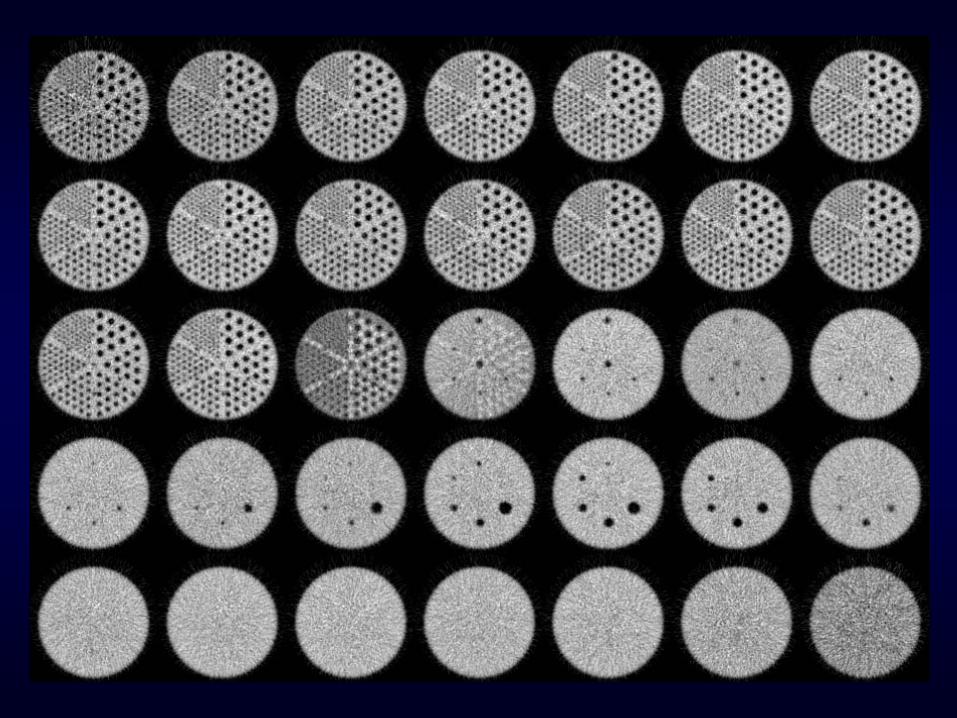
Jaszczak Phantom
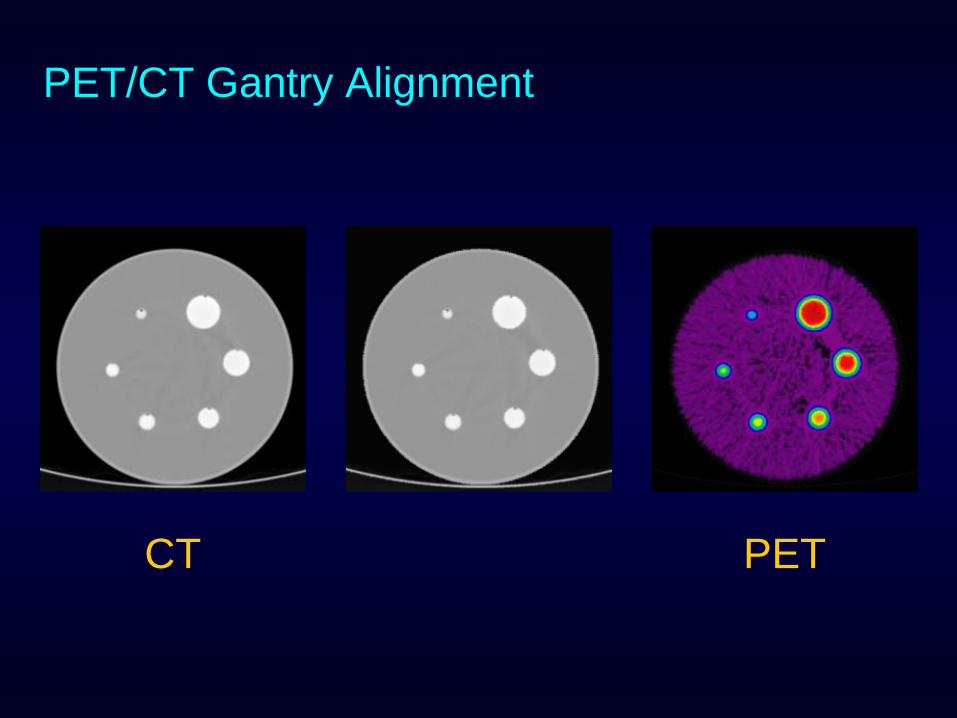
CT PET
PET/CT Gantry Alignment
Annual QC Procedures
Perform a sub-set of the acceptance test:UniformityResolutionCount Rate TestDead Time correction
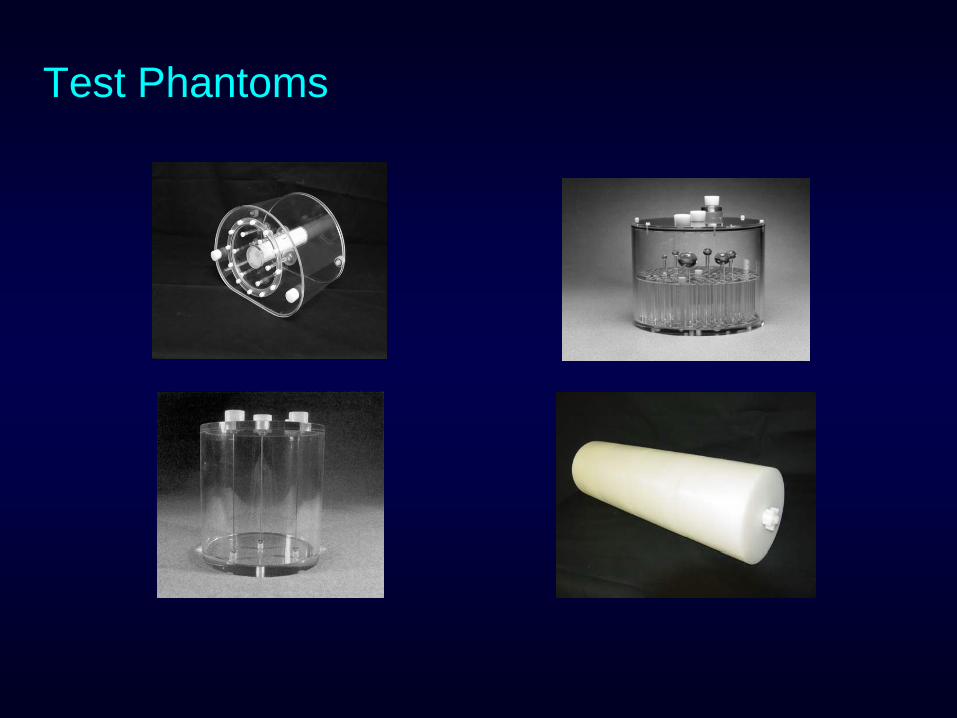
Test Phantoms