Perthometer. Surface Texture Parameters
19
MAHR GMBH, Germany - EDITION 09/01/99 Perthometer. Surface Texture Parameters New Standards DIN EN ISO / ASME
Transcript of Perthometer. Surface Texture Parameters
MAHR GMBH, Germany - EDITION 09/01/99
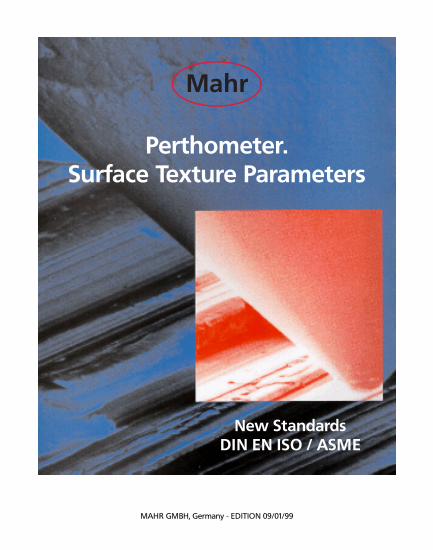
Perthometer.Surface Texture Parameters
New StandardsDIN EN ISO / ASME
MAHR GMBH, Germany - EDITION 1/09/99
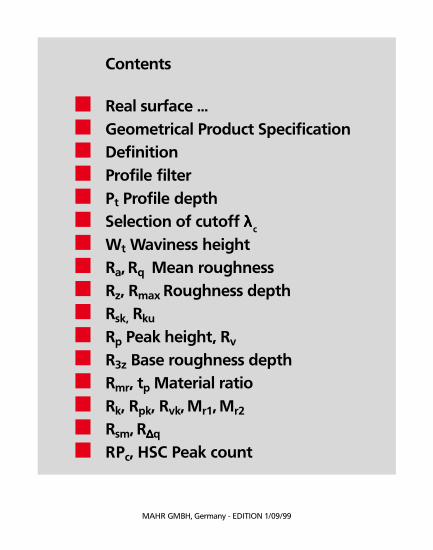
Contents
Real surface ...Geometrical Product Specification DefinitionProfile filterPt Profile depthSelection of cutoff λλλλλc
Wt Waviness heightRa, Rq Mean roughnessRz, Rmax Roughness depthRsk, Rku
Rp Peak height, Rv
R3z Base roughness depthRmr, tp Material ratioRk, Rpk, Rvk, Mr1, Mr2
Rsm, R∆∆∆∆∆q
RPc, HSC Peak count
MAHR GMBH, Germany - EDITION 1/09/99
BACK NEXT
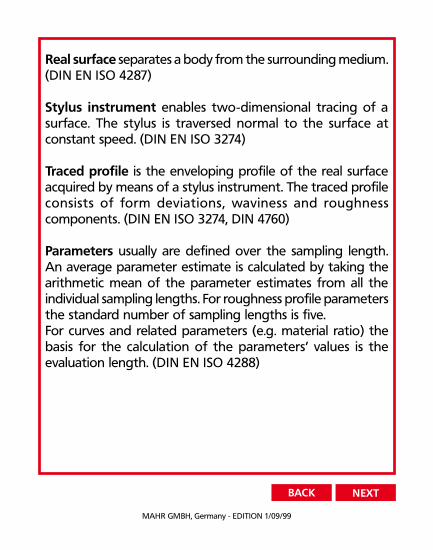
Real surface separates a body from the surrounding medium.(DIN EN ISO 4287)
Stylus instrument enables two-dimensional tracing of asurface. The stylus is traversed normal to the surface atconstant speed. (DIN EN ISO 3274)
Traced profile is the enveloping profile of the real surfaceacquired by means of a stylus instrument. The traced profileconsists of form deviations, waviness and roughnesscomponents. (DIN EN ISO 3274, DIN 4760)
Parameters usually are defined over the sampling length.An average parameter estimate is calculated by taking thearithmetic mean of the parameter estimates from all theindividual sampling lengths. For roughness profile parametersthe standard number of sampling lengths is five.For curves and related parameters (e.g. material ratio) thebasis for the calculation of the parameters’ values is theevaluation length. (DIN EN ISO 4288)
MAHR GMBH, Germany - EDITION 1/09/99
BACK NEXT
Geometrical Product Specification (GPS)
ISO/TR 14638, DIN V 32950Geometrical Product Specification (GPS) implies differentkinds of standards dealing with the geometric characteristicsof products during product design, manufacture, inspection,quality assurance, etc.
In the GPS matrix model, the lines comprise chains ofstandards dealing with one and the same characteristic suchas e.g. size, distance, form features, roughness, waviness, etc.The columns (i.e. the links of the chains) then are:1. Drawing specifications (DIN EN ISO 1302)2. Theoretical definitions (DIN EN ISO 4287, 11562, 12085, and
13565)3. Parameter definitions (DIN EN ISO 4288, 11562, 12085, and
13565)4. Assessment of deviations (DIN EN ISO 4288 and 12085)5. Measurement equipment requirements (DIN EN ISO 3274
and 11562)6. Calibration requirements (DIN EN ISO 5436 and 12179)
The most important standards in the field of surfacetexture are detailed in parentheses ().
MAHR GMBH, Germany - EDITION 1/09/99
BACK NEXT
Traversing length lt is the overall length traveled by the styluswhen acquiring the traced profile. It is the sum of pre-travel,evaluation length ln, and post-travel.
Cutoff λλλλλc of a profile filter determines which wavelengthsbelong to roughness and which ones to waviness.
Sampling length lr is the reference for roughness evaluation.Its length is equal to the cutoff wavelength λc.The sampling lengths lp and lw, respectively, are the referencelengths for the P-profile and the W-profile evaluation.
Evaluation length ln is that part of the traversing length ltover which the values of surface parameters are determined.The standard roughness evaluation length comprises fiveconsecutive sampling lengths.
Pre-travel is the first part of the traversing length lt.
Post-travel is the last part of the traversing length lt. Pre-travel and post-travel are required for phase correct filtering.
MAHR GMBH, Germany - EDITION 1/09/99
BACK NEXT
Profile filter
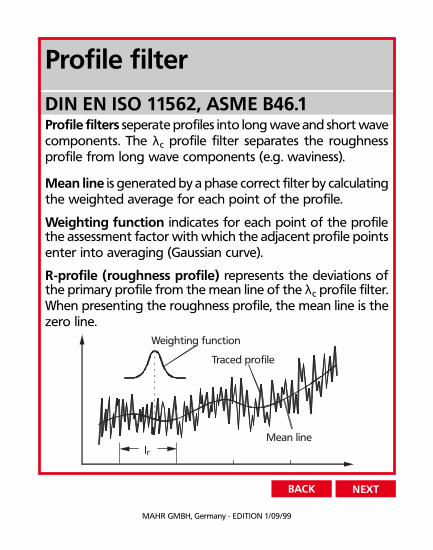
DIN EN ISO 11562, ASME B46.1Profile filters seperate profiles into long wave and short wavecomponents. The λc profile filter separates the roughnessprofile from long wave components (e.g. waviness).
Mean line is generated by a phase correct filter by calculatingthe weighted average for each point of the profile.
Weighting function indicates for each point of the profilethe assessment factor with which the adjacent profile pointsenter into averaging (Gaussian curve).
R-profile (roughness profile) represents the deviations ofthe primary profile from the mean line of the λc profile filter.When presenting the roughness profile, the mean line is thezero line.
Mean line
Traced profile
Weighting function
lr
MAHR GMBH, Germany - EDITION 1/09/99
BACK NEXT
Pt Profile depth
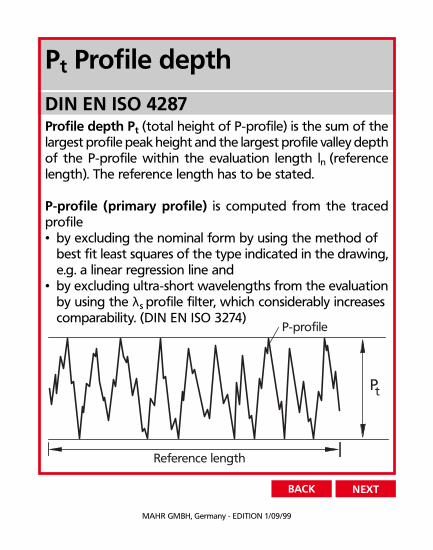
DIN EN ISO 4287Profile depth Pt (total height of P-profile) is the sum of thelargest profile peak height and the largest profile valley depthof the P-profile within the evaluation length ln (referencelength). The reference length has to be stated.
P-profile (primary profile) is computed from the tracedprofile• by excluding the nominal form by using the method of
best fit least squares of the type indicated in the drawing,e.g. a linear regression line and
• by excluding ultra-short wavelengths from the evaluationby using the λs profile filter, which considerably increasescomparability. (DIN EN ISO 3274)
Pt
P-profile
Reference length
MAHR GMBH, Germany - EDITION 1/09/99
BACK NEXT
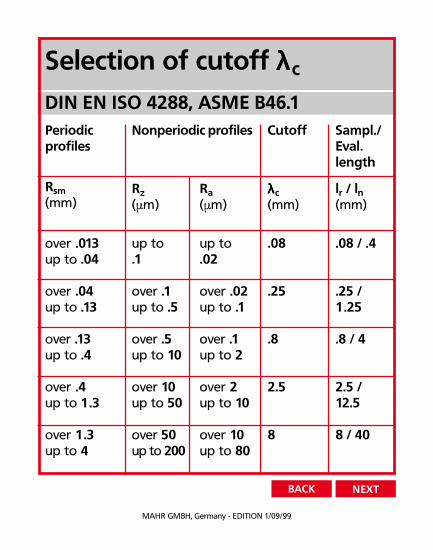
over .013up to .04
over .04up to .13
over .13up to .4
over .4up to 1.3
over 1.3up to 4
Selection of cutoff λλλλλc
DIN EN ISO 4288, ASME B46.1Nonperiodic profiles Cutoff Sampl./
Eval.length
Periodicprofiles
Rsm(mm)
Rz(µm)
Ra(µm)
λλλλλc(mm)
lr / ln(mm)
up to.02
over .02up to .1
over .1up to 2
over 2up to 10
over 10up to 80
.08
.25
.8
2.5
8
.08 / .4
.25 /1.25
.8 / 4
2.5 /12.5
8 / 40
up to.1
over .1up to .5
over .5up to 10
over 10up to 50
over 50up to 200
MAHR GMBH, Germany - EDITION 1/09/99
BACK NEXT
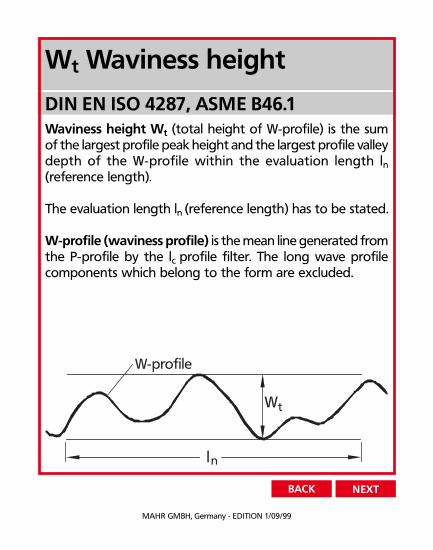
Wt Waviness height
DIN EN ISO 4287, ASME B46.1Waviness height Wt (total height of W-profile) is the sumof the largest profile peak height and the largest profile valleydepth of the W-profile within the evaluation length ln(reference length).
The evaluation length ln (reference length) has to be stated.
W-profile (waviness profile) is the mean line generated fromthe P-profile by the lc profile filter. The long wave profilecomponents which belong to the form are excluded.
W-profile
ln
Wt
MAHR GMBH, Germany - EDITION 1/09/99
BACK NEXT
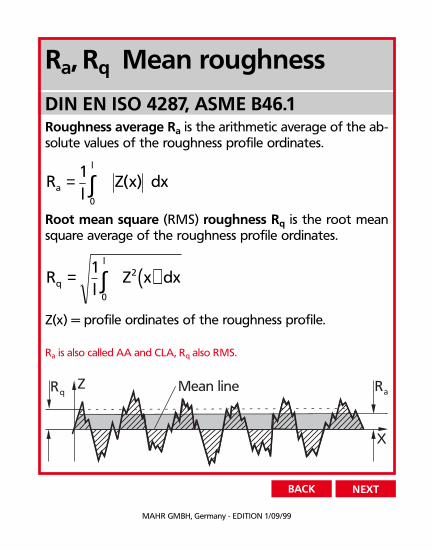
Ra, Rq Mean roughness
DIN EN ISO 4287, ASME B46.1Roughness average Ra is the arithmetic average of the ab-solute values of the roughness profile ordinates.
Rl
Z x dxa
l
= ∫1
0
( )
Root mean square (RMS) roughness Rq is the root meansquare average of the roughness profile ordinates.
( )Rl
Z x dxq
l
= ∫1
0
2
Z(x) = profile ordinates of the roughness profile.
Ra is also called AA and CLA, Rq also RMS.
RqZ Ra
X
Mean line
MAHR GMBH, Germany - EDITION 1/09/99
BACK NEXT
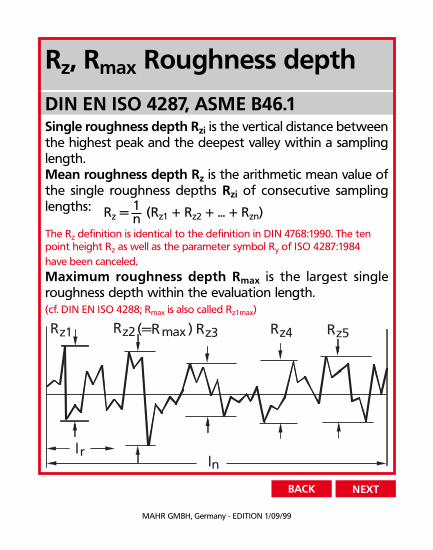
Rz, Rmax Roughness depth
DIN EN ISO 4287, ASME B46.1Single roughness depth Rzi is the vertical distance betweenthe highest peak and the deepest valley within a samplinglength.Mean roughness depth Rz is the arithmetic mean value ofthe single roughness depths Rzi of consecutive samplinglengths:
The Rz definition is identical to the definition in DIN 4768:1990. The tenpoint height Rz as well as the parameter symbol Ry of ISO 4287:1984have been canceled.
Maximum roughness depth Rmax is the largest singleroughness depth within the evaluation length.(cf. DIN EN ISO 4288; Rmax is also called Rz1max)
1nRz = (Rz1 + Rz2 + ... + Rzn)
lnl r
(=Rmax ) Rz5Rz4Rz3Rz2Rz1
MAHR GMBH, Germany - EDITION 1/09/99
Rsk < 0
Rsk = 0
Rsk > 0
Rku < 3
Rku = 3
Rku > 3
BACK NEXT
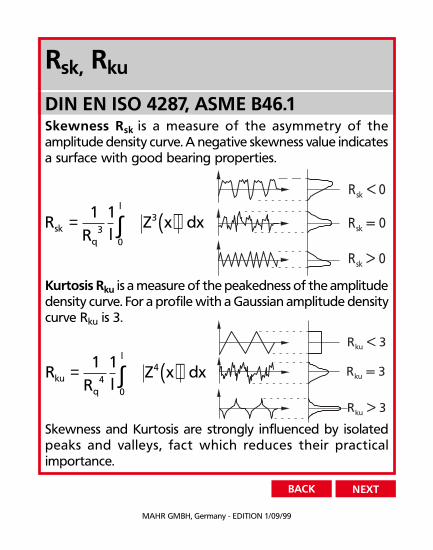
Rsk, Rku
DIN EN ISO 4287, ASME B46.1Skewness Rsk is a measure of the asymmetry of theamplitude density curve. A negative skewness value indicatesa surface with good bearing properties.
Kurtosis Rku is a measure of the peakedness of the amplitudedensity curve. For a profile with a Gaussian amplitude densitycurve Rku is 3.
Skewness and Kurtosis are strongly influenced by isolatedpeaks and valleys, fact which reduces their practicalimportance.
( )RR l
Z x dxskq
l
= ∫1 1
30
3
( )RR l
Z x dxkuq
l
= ∫1 1
40
4
MAHR GMBH, Germany - EDITION 1/09/99
R
R
R
p
zi
v
lr
BACK NEXT
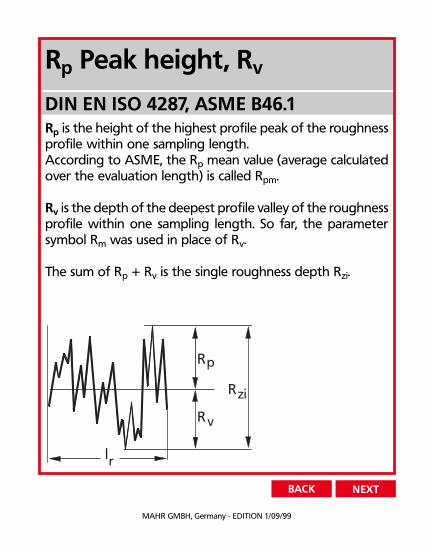
Rp Peak height, Rv
DIN EN ISO 4287, ASME B46.1Rp is the height of the highest profile peak of the roughnessprofile within one sampling length.According to ASME, the Rp mean value (average calculatedover the evaluation length) is called Rpm.
Rv is the depth of the deepest profile valley of the roughnessprofile within one sampling length. So far, the parametersymbol Rm was used in place of Rv.
The sum of Rp + Rv is the single roughness depth Rzi.
MAHR GMBH, Germany - EDITION 1/09/99
ln
lr
R3z1 R3z2 R3z3 R3z4 R3z5
BACK NEXT
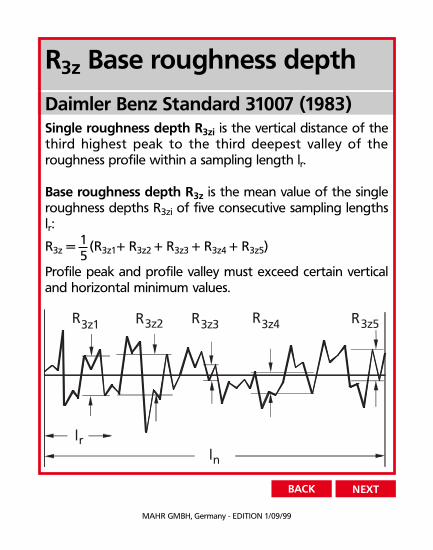
R3z Base roughness depth
Daimler Benz Standard 31007 (1983)Single roughness depth R3zi is the vertical distance of thethird highest peak to the third deepest valley of theroughness profile within a sampling length lr.
Base roughness depth R3z is the mean value of the singleroughness depths R3zi of five consecutive sampling lengthslr:
Profile peak and profile valley must exceed certain verticaland horizontal minimum values.
R3z = (R3z1+ R3z2 + R3z3 + R3z4 + R3z5)15
MAHR GMBH, Germany - EDITION 1/09/99
BACK NEXT
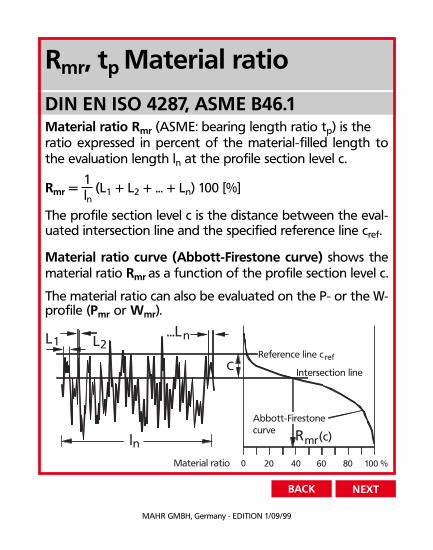
Rmr, tp Material ratio
DIN EN ISO 4287, ASME B46.1Material ratio Rmr (ASME: bearing length ratio tp) is theratio expressed in percent of the material-filled length tothe evaluation length ln at the profile section level c.
Rmr = (L1 + L2 + ... + Ln) 100 [%]
The profile section level c is the distance between the eval-uated intersection line and the specified reference line cref.
Material ratio curve (Abbott-Firestone curve) shows thematerial ratio Rmr as a function of the profile section level c.
The material ratio can also be evaluated on the P- or the W-profile (Pmr or Wmr).
ln0 20 40 60 80 100 %
Abbott-Firestone curve
...Ln
Cref
Intersection line
mrR
Material ratio
Reference line cL1 L2
(c)
1ln
MAHR GMBH, Germany - EDITION 1/09/99
Rk, Rpk, Rvk, Mr1, Mr2
DIN EN ISO 13565-1 and -2
BACK NEXT
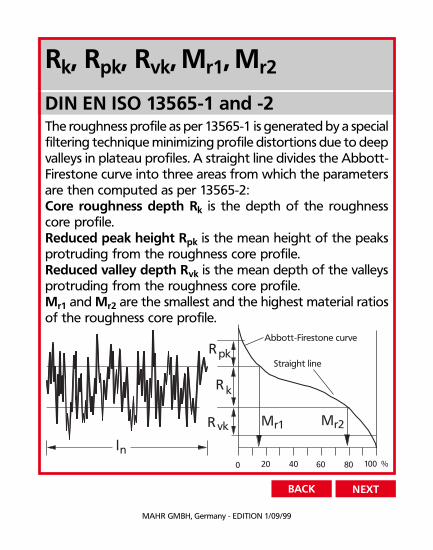
The roughness profile as per 13565-1 is generated by a specialfiltering technique minimizing profile distortions due to deepvalleys in plateau profiles. A straight line divides the Abbott-Firestone curve into three areas from which the parametersare then computed as per 13565-2:Core roughness depth Rk is the depth of the roughnesscore profile.Reduced peak height Rpk is the mean height of the peaksprotruding from the roughness core profile.Reduced valley depth Rvk is the mean depth of the valleysprotruding from the roughness core profile.Mr1 and Mr2 are the smallest and the highest material ratiosof the roughness core profile.
ln
R
R
R
pk
k
vk
0 20 40 60 80 100 %
Abbott-Firestone curve
Straight line
Mr1 Mr2
MAHR GMBH, Germany - EDITION 1/09/99
l
Sm1Z Sm2 Smn
n
BACK NEXT
Rsm, R∆∆∆∆∆q
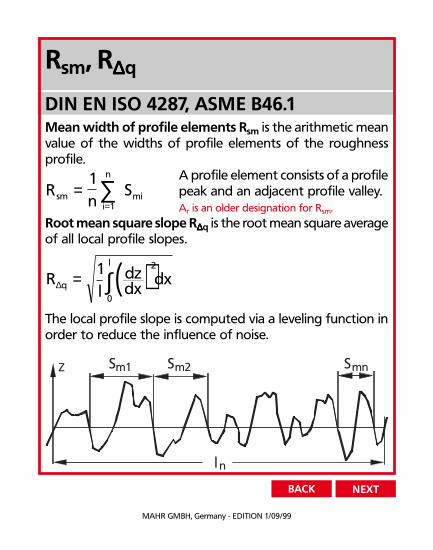
DIN EN ISO 4287, ASME B46.1Mean width of profile elements Rsm is the arithmetic meanvalue of the widths of profile elements of the roughnessprofile.
A profile element consists of a profilepeak and an adjacent profile valley.Ar is an older designation for Rsm.
Root mean square slope R∆∆∆∆∆q is the root mean square averageof all local profile slopes.
The local profile slope is computed via a leveling function inorder to reduce the influence of noise.
Rn
Ssmi
n
mi==∑1
1
( )Rl
dzdx
dxq
l
∆ = ∫1 2
0
MAHR GMBH, Germany - EDITION 1/09/99
RPc
HSC
2c
**
**
**
*** *
1c
BACK NEXT
RPc, HSC Peak count
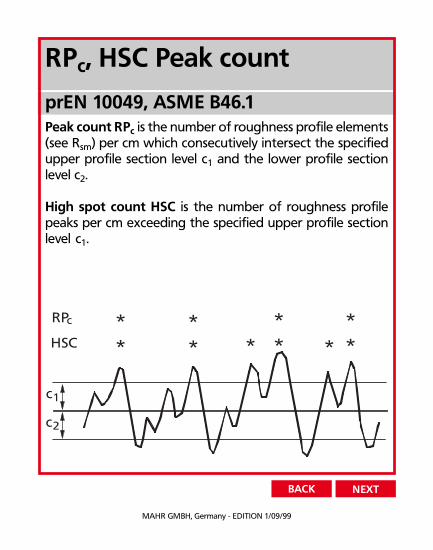
prEN 10049, ASME B46.1Peak count RPc is the number of roughness profile elements(see Rsm) per cm which consecutively intersect the specifiedupper profile section level c1 and the lower profile sectionlevel c2.
High spot count HSC is the number of roughness profilepeaks per cm exceeding the specified upper profile sectionlevel c1.
MAHR GMBH, Germany - EDITION 1/09/99
http://www.mahr.com
Mahr GmbHGöttingen
Postfach 1853D-37008 GöttingenBrauweg 38D-37073 GöttingenPhone + 551-70730Fax + 551-71021e-mail: [email protected]
Hand measuring instruments, lengthmeasuring and controllinginstruments, gage calibration systems& software, form and gear measuringinstruments, 3D multisensortechnology, surface texture andcontour measuring instruments,,spinning pumps, rotary strokebearings, calibration services (DKD)
© by Mahr GmbH, Göttingen
We reserve the right to make changesto our products, especially due totechnical improvements and furtherdevelopments. All illustrations andtechnical data are therefore withoutguarantee.
Reproduced with the permission of theDIN Deutsches Institut für Normunge.V. (German Institute for Standard-ization). When applying the standard,the latest version available from BeuthVerlag GmbH, Burggrafenstraße 6,10787 Berlin, Germany, will be rele-vant.
http://www.din.de
http://www.beuth.de