Performance of the BG1Luc and ER β-Lactamase Estrogen ... · Manual Performance Standards...
1
Table 4. BG1Luc HTS and ER-Bla HTS Agonist Results Compared to BG1 Manual Performance Standards Abbreviations: CAS RN = Chemical Abstracts Service Registry Number®; IC = inconclusive; NEG = negative; POS = positive. Table 5. Agonist Sensitivity and Specificity for the BG1Luc and ER-Bla Assays a Of the 34 agonist substances in the performance standards, two were omitted in BG1Luc HTS and four were omitted in ER-Bla HTS because the results were inconclusive. • Data quality was evaluated in several ways: Computation of metrics including signal-to-background detection ratio, coefficient of variation, and Z’ factor (Zhang 1999) Comparison to reference standard values Comparison of 88 chemicals duplicated on every test plate (intra-assay) Comparison of outcome matches across three runs (inter-assay) Table 2. Agonist Data Quality a All values are reported as mean values. Standard deviation is reported where applicable. b EC 50 is the half-maximal effective concentration. c Intra-assay R 2 values were calculated for all positive test substances. d AC 50 is the half-maximal activity concentration (Inglese 2006). Table 3. Antagonist Data Quality a All values are reported as mean values. Standard deviation is reported where applicable. b IC 50 is the half-maximal inhibitory concentration. c Intra-assay R 2 values were calculated for all positive test substances. d AC 50 is the half-maximal activity concentration (Inglese 2006). Two estrogen receptor (ER) transactivation (TA) assays, the BG1Luc and HEK293 ER β-lactamase (ER-Bla) methods, were adapted for use in the U.S. Tox21 high-throughput screening program. Both in vitro assays detect substances with ER agonist or antagonist activity. BG1Luc endogenously expresses full-length ER (α and β) and is stably transfected with a plasmid containing four estrogen responsive elements (ERE) upstream of a luciferase reporter gene. ER-Bla is a mammalian one-hybrid system stably expressing a β-lactamase reporter gene under the control of the GAL4 DNA-binding site and a fusion protein consisting of the human ERα ligand-binding domain and the GAL4 DNA-binding domain. Approximately 10,000 chemicals were tested three times in both assays in agonist and antagonist modes. To differentiate true ER antagonists from cytotoxic substances, cell viability was determined. Concentration-response data (N=15) were analyzed to evaluate the performance of the two assays. The assay data quality was high in both agonist and antagonist modes as indicated by acceptable signal to background ratio (2.5 to 8), CV (<10.5%), reproducibility (outcome matches across triplicate runs, ≥87%), and Z’ factor (≥0.4). Sensitivity and specificity of the assays were compared to ER TA performance standards that were developed with the OECD for the BG1 manual method. Sensitivity was 100% for BG1 agonist, 85% for ER-Bla agonist, and 100% for both antagonist assays. Agonist and antagonist specificity were 100% for BG1 and ER-Bla. Reference standard values were: estradiol EC50 30 pM for BG1 and 275 pM for ER-Bla, and hydroxytamoxifen IC50 71 nM for BG1 and 6 nM for ER-Bla. Understanding the differences behind the performance of these assays is critical to their acceptance and utilization by both regulators and industry. Abstract Performance of the BG1Luc and ER β-Lactamase Estrogen Receptor Transactivation Assays in Tox21 L Rinckel 1 , W Casey 2 , R Huang 3 , J-H Hsieh 4 , K Shockley 5 , S Sakamuru 3 , M Xia 3 , R Tice 4 , P Ceger 1 1 ILS, RTP, NC, USA; 2 NICEATM/DNTP/NIEHS/NIH/HHS, RTP, NC, USA; 3 NCGC/NCATS/NIH/HHS, Rockville, MD, USA; 4 DNTP/NIEHS/NIH/HHS, RTP, NC, USA; 5 DIR/NIEHS/NIH/HHS, RTP, NC, USA • In 2007, the National Research Council released the report Toxicity Testing in the 21 st Century: A Vision and a Strategy (National Research Council 2007). In that report, the authors envisioned toxicity testing as a holistic process that considers risk context, population and exposure data, chemical characterization, and targeted toxicity testing based on knowledge of toxicity pathways, dose–response, and extrapolation modeling. • In response to this report, the U.S. Tox21 consortium was formed. Tox21 integrates Federal resources and expertise from the following offices: – Environmental Protection Agency – National Institutes of Environmental Health Sciences/National Toxicology Program – National Institutes of Health (NIH)/NIH Center for Advancing Translational Sciences – Food and Drug Administration • The mission of Tox21 is to research, develop, validate, and translate innovative chemical testing methods for the characterization of toxicity pathways. The use of robotics platforms to screen thousands of chemicals provides a cost-effective approach to prioritize further testing of potentially toxic chemicals. • One area of particular interest for Tox21 is toxicity associated with the endocrine system, since exposure to “endocrine active chemicals” (EACs) may result in developmental or reproductive problems. • EACs may affect growth and development through a variety of mechanisms. One such mechanism is estrogenic signaling. • Estrogenic signaling pathways are well-characterized, and a number of test methods that target them have been developed. Two estrogen receptor (ER) transactivation assays, the BG1Luc4E2 (BG1Luc) and the HEK293 ER β-lactamase (ER-Bla), have been adapted to a high-throughput screening (HTS) platform and incorporated into the Tox21 program. Introduction Substances With Discordant Results in Agonist Assays Data Quality • BG1Luc HTS and ER-Bla HTS are used in the Tox21 screening program to detect substances that cause ER transactivation. While both are ER transactivation assays, they use different cell types, receptors, and reporters. • Data quality was acceptable in both assays (Tables 2 and 3). • When used to test ICCVAM ER agonist performance standards chemicals, BG1 HTS misidentified only one chemical when a conclusive result was obtained, but results of tests of two chemicals were inconclusive. All of the ER antagonist performance standards chemicals were correctly identified. • ER-Bla HTS misidentified three of the ICCVAM ER agonist performance standards chemicals, but results of tests of four chemicals were inconclusive. The assay correctly identified all of the ER antagonist performance standards chemicals when a conclusive result was obtained, but result of tests of four chemicals were inconclusive. • Results of tests of one positive agonist performance standards chemical, fenarimol, were inconclusive in both BG1Luc and ER-Bla HTS. • These differences may be due to differences in sensitivity in the two assays. Understanding the factors contributing to these differences is critical to their regulatory acceptance and utilization. Conclusions The Intramural Research Program of the National Institute of Environmental Health Sciences (NIEHS) supported this poster. Technical support was provided by ILS under NIEHS contracts N01-ES 35504 and HHSN27320140003C. The views expressed above do not necessarily represent the official positions of any Federal agency. Since the poster was written as part of the official duties of the authors, it can be freely copied. A summary of NICEATM and ICCVAM activities at SOT 2014 is available on the National Toxicology Program website at http://ntp.niehs.nih.gov/go/41297. Acknowledgements ICCVAM. 2011. ICCVAM Test Method Evaluation Report. The LUMI-CELL® ER (BG1Luc ER TA) Test Method: An In Vitro Assay for Identifying Human Estrogen Receptor Agonist and Antagonist Activity of Chemicals. Research Triangle Park, NC:National Institute of Environmental Health Sciences. Inglese J, Auld DS, et al. 2006. Quantitative high-throughput screening: a titration-based approach that efficiently identifies biological activities in large chemical libraries. Proc Natl Acad Sci U S A 103(31): 11473–11478. National Research Council. 2007. Toxicity Testing in the 21st Century: A Vision and a Strategy. Washington, DC:National Academies Press. Zhang JH, Chung TD, et al. 1999. A simple statistical parameter for use in evaluation and validation of high throughput screening assays. J Biomol Screen 4(2): 6773. References BG1Luc HTS a ER-Bla HTS a Signal-to-background and Z’ factor Signal-to-background ratio 2.5 ± 0.3 4.6 ± 0.6 Coefficient of variation (%) 10.3 ± 5.9 4.7 ± 3.7 Z’ factor 0.5 ± 0.25 0.53 ± 0.09 Reference Standard Values Estradiol EC 50 (pM) b 30 ± 70 275 ± 80 Intra-assay EC 50 correlations (R 2 ) c 0.80 0.83 Inter-assay Active match (%) 16 7 Inactive match (%) 87 71 Fold difference in AC 50 among three experiments d 1.5 1.4 BG1Luc HTS a ER-Bla HTS a Signal-to-background and Z’ factor Signal-to-background ratio 8.0 ± 0.9 3.3 ± 0.8 Coefficient of variation (%) 6.5 ± 2.8 5.1 ± 2.8 Z’ factor 0.8 ± 0.07 0.4 ± 0.1 Reference Standard Values 4-Hydroxytamoxifen IC 50 (nM) b 70.8 ± 12.4 5.8 ± 3.8 Intra-assay IC 50 correlations (R 2 ) c 0.76 0.47 Inter-assay Active match (%) 12 10 Inactive match (%) 80 78 Fold difference in AC 50 among three experiments d 1.5 1.5 • The U.S. National Toxicology Program Interagency Center for the Evaluation of Alternative Toxicological Methods coordinated an international validation study of the BG1Luc assay for the Interagency Coordinating Committee on the Validation of Alternative Methods (ICCVAM). The validation was completed in 2010. • A test method evaluation report (ICCVAM 2011) summarizing the study contained performance standards for developing functionally and mechanistically similar test methods as well as for demonstrating proficiency in the BG1Luc assay. • The ICCVAM performance standards describe: The principles and expected performance of the BG1Luc manual assay Criteria for data interpretation Reference substances for both agonist and antagonist mode, with expected positive and negative outcomes for each substance • HTS data for test chemicals were reviewed and classified as positive, negative, or inconclusive. For a test substance to be classified as positive, it needed to have a response greater than or equal to 20% that of the positive control and have a semi-sigmoidal response curve. • Results obtained in the BG1Luc HTS and ER-Bla HTS assays were compared to outcomes specified in the performance standards (Tables 4–7). Comparison to ICCVAM Performance Standards Table 1. Overview of Differences Between the Methods Agonist Sensitivity and Specificity BG1Luc HTS ER-Bla HTS Sensitivity 96% (24/25) 87% (20/23) Specificity 100% (7/7) 100% (7/7) Accuracy 97% (31/32) a 90% (27/30) a Response is percent of estradiol control activity. Red = BG1Luc HTS data. Each line represents a single replicate concentration–response curve. Blue = ER-Bla HTS data. Each line represents a single replicate concentration–response curve. Antagonist Sensitivity and Specificity • Expected positive and negative outcomes from the ICCVAM performance standards are compared to observed outcomes in the BG1Luc HTS and ER-Bla HTS assays in Tables 6 and 7. • None of the outcomes for either the BG1Luc HTS or the ER-Bla HTS assay was discordant with the performance standards or with the other assay, although four substances yielded inconclusive results with the ER-Bla HTS. Table 6. BG1Luc HTS and ER-Bla HTS Antagonist Results Compared to BG1 Manual Performance Standards Abbreviations: CAS RN = Chemical Abstracts Service Registry Number®; IC = inconclusive; NEG = negative; POS = positive. Table 7. Antagonist Sensitivity and Specificity for the BG1Luc HTS and ER-Bla HTS Assays a Of the 10 agonist substances in the performance standards, four were omitted in ER-Bla HTS because the results were inconclusive. BG1Luc HTS ER-Bla HTS Sensitivity 100% (3/3) 100% (3/3) Specificity 100% (7/7) 100% (3/3) Accuracy 100% (10/10) 100% (6/6) a Figure 1. Methoxychlor Figure 2. p-n-Nonylphenol Figure 3. Butylbenzyl Phthalate Figure 4. Coumestrol Figure 6. Ethyl Paraben • Methoxychlor and p-n-nonylphenol were positive in the performance standards and weakly positive in BG1Luc HTS, but negative in ER-Bla HTS (Figures 1 and 2). • Butylbenzyl phthalate and coumestrol were positive in the performance standards and in BG1Luc HTS, but were inconclusive in ER-Bla HTS (Figures 3 and 4). – Although there was an increase in response for both substances, neither substance produced a sigmoidal concentration–response curve when tested in ER-Bla HTS. – BG1Luc HTS is more sensitive than ER-Bla HTS. BG1Luc HTS has a reference standard EC 50 of 30 pM, compared to 275 pM for the ER-Bla HTS. • Dicofol was positive in the performance standards, negative in BG1Luc HTS, and inconclusive in ER-Bla HTS (Figure 5). – There was a slight increase in response in ER-Bla HTS, but dicofol did not produce a sigmoidal concentration–response curve. • Ethyl paraben was positive in the performance standards, inconclusive in BG1Luc HTS, and negative in ER-Bla HTS (Figure 6). – Although there was an increase in response for ethyl paraben in the BG1Luc HTS, the concentration–response curve was not sigmoidal in shape. – When tested in ER-Bla HTS, ethyl paraben showed a slight increase in response at the highest concentration tested, but the response did not reach a minimum threshold of 20%. • Fenarimol was positive in the performance standards but inconclusive in both HTS assays (Figure 7). – There was a slight increase in response in ER-Bla HTS, but dicofol did not produce a sigmoidal concentration–response curve. • Both assays have agonist and antagonist modes. • The complete set of 10,000 Tox21 chemicals was screened using both assays in agonist and antagonist modes. The 10,000 chemicals were divided among nine master plates, with one test chemical per well. Eighty-eight chemicals were duplicated on all nine master plates. Each master plate was serially diluted 15 times so that each chemical was tested in 15-point serial dilution (5pM–92nM), one plate per dilution. Each experiment consisted of testing 153 plates (9 sets of 15 test plates plus DMSO blanks). Each experiment was repeated three times. • Cell viability was simultaneously evaluated in each assay to distinguish antagonism from cytotoxicity. Use of the Assays to Screen the Tox21 Chemicals Performance Standards Substances CAS RN Performance Standards Classification BG1 HTS Classification ER-Bla HTS Classification 17- Estradiol 57-91-0 POS POS POS 17- Ethinyl estradiol 57-63-6 POS POS POS 17- Estradiol 50-28-2 POS POS POS 19-Nortestosterone 434-22-0 POS POS POS 4-Cumylphenol 599-64-4 POS POS POS 4-tert-Octylphenol 140-66-9 POS POS POS Apigenin 520-36-5 POS POS POS Bisphenol A 80-05-7 POS POS POS Bisphenol B 77-40-7 POS POS POS Butylbenzyl phthalate 85-68-7 POS POS IC Chrysin 480-40-0 POS POS POS Coumestrol 479-13-0 POS POS IC Daidzein 486-66-8 POS POS POS Dicofol 115-32-2 POS NEG IC Diethylstilbestrol 56-53-1 POS POS POS Estrone 53-16-7 POS POS POS Ethyl paraben 120-47-8 POS IC NEG Fenarimol 60168-88-9 POS IC IC Genistein 446-72-0 POS POS POS Kaempferol 520-18-3 POS POS POS Kepone 143-50-0 POS POS POS meso-Hexestrol 84-16-2 POS POS POS Methyl testosterone 58-18-4 POS POS POS Norethynodrel 68-23-5 POS POS POS o.p’-DDT 789-02-6 POS POS POS p-n-Nonylphenol 104-40-5 POS POS NEG p.p’-Methoxychlor 72-43-5 POS POS NEG Atrazine 1912-24-9 NEG NEG NEG Bicalutamide 90357-06-5 NEG NEG NEG Corticosterone 50-22-6 NEG NEG NEG Hydroxyflutamide 52806-53-8 NEG NEG NEG Linuron 330-55-2 NEG NEG NEG Phenobarbital 50-06-6 NEG NEG NEG Performance Standards Substances CAS RN Performance Standards Classification BG1 HTS Classification ER-Bla HTS Classification 4-Hydroxytamoxifen 68047-06-3 POS POS POS Raloxifene HCl 82640-04-8 POS POS POS Tamoxifen 10540-29-1 POS POS POS 17- Ethinyl estradiol 57-63-6 NEG NEG NEG Apigenin 520-36-5 NEG NEG IC Chrysin 480-40-0 NEG NEG NEG Coumestrol 479-13-0 NEG NEG NEG Genistein 446-72-0 NEG NEG IC Kaempferol 520-18-3 NEG NEG IC Resveratrol 501-36-0 NEG NEG IC BG1Luc HTS ER-Bla HTS Cell Line BG-1Luc4E2 HEK293 Tissue of Origin Ovary Kidney Receptor Expression Native Stably transfected Receptors ER-α and ER-β ER-α ligand binding domain Response Element Estrogen-response element Upstream β-lactamase reporter gene activator sequence Reporter Luciferase β-Lactamase Viability Detection Fluorescent Luminescent Figure 5. Dicofol Figure 7. Fenarimol
Transcript of Performance of the BG1Luc and ER β-Lactamase Estrogen ... · Manual Performance Standards...
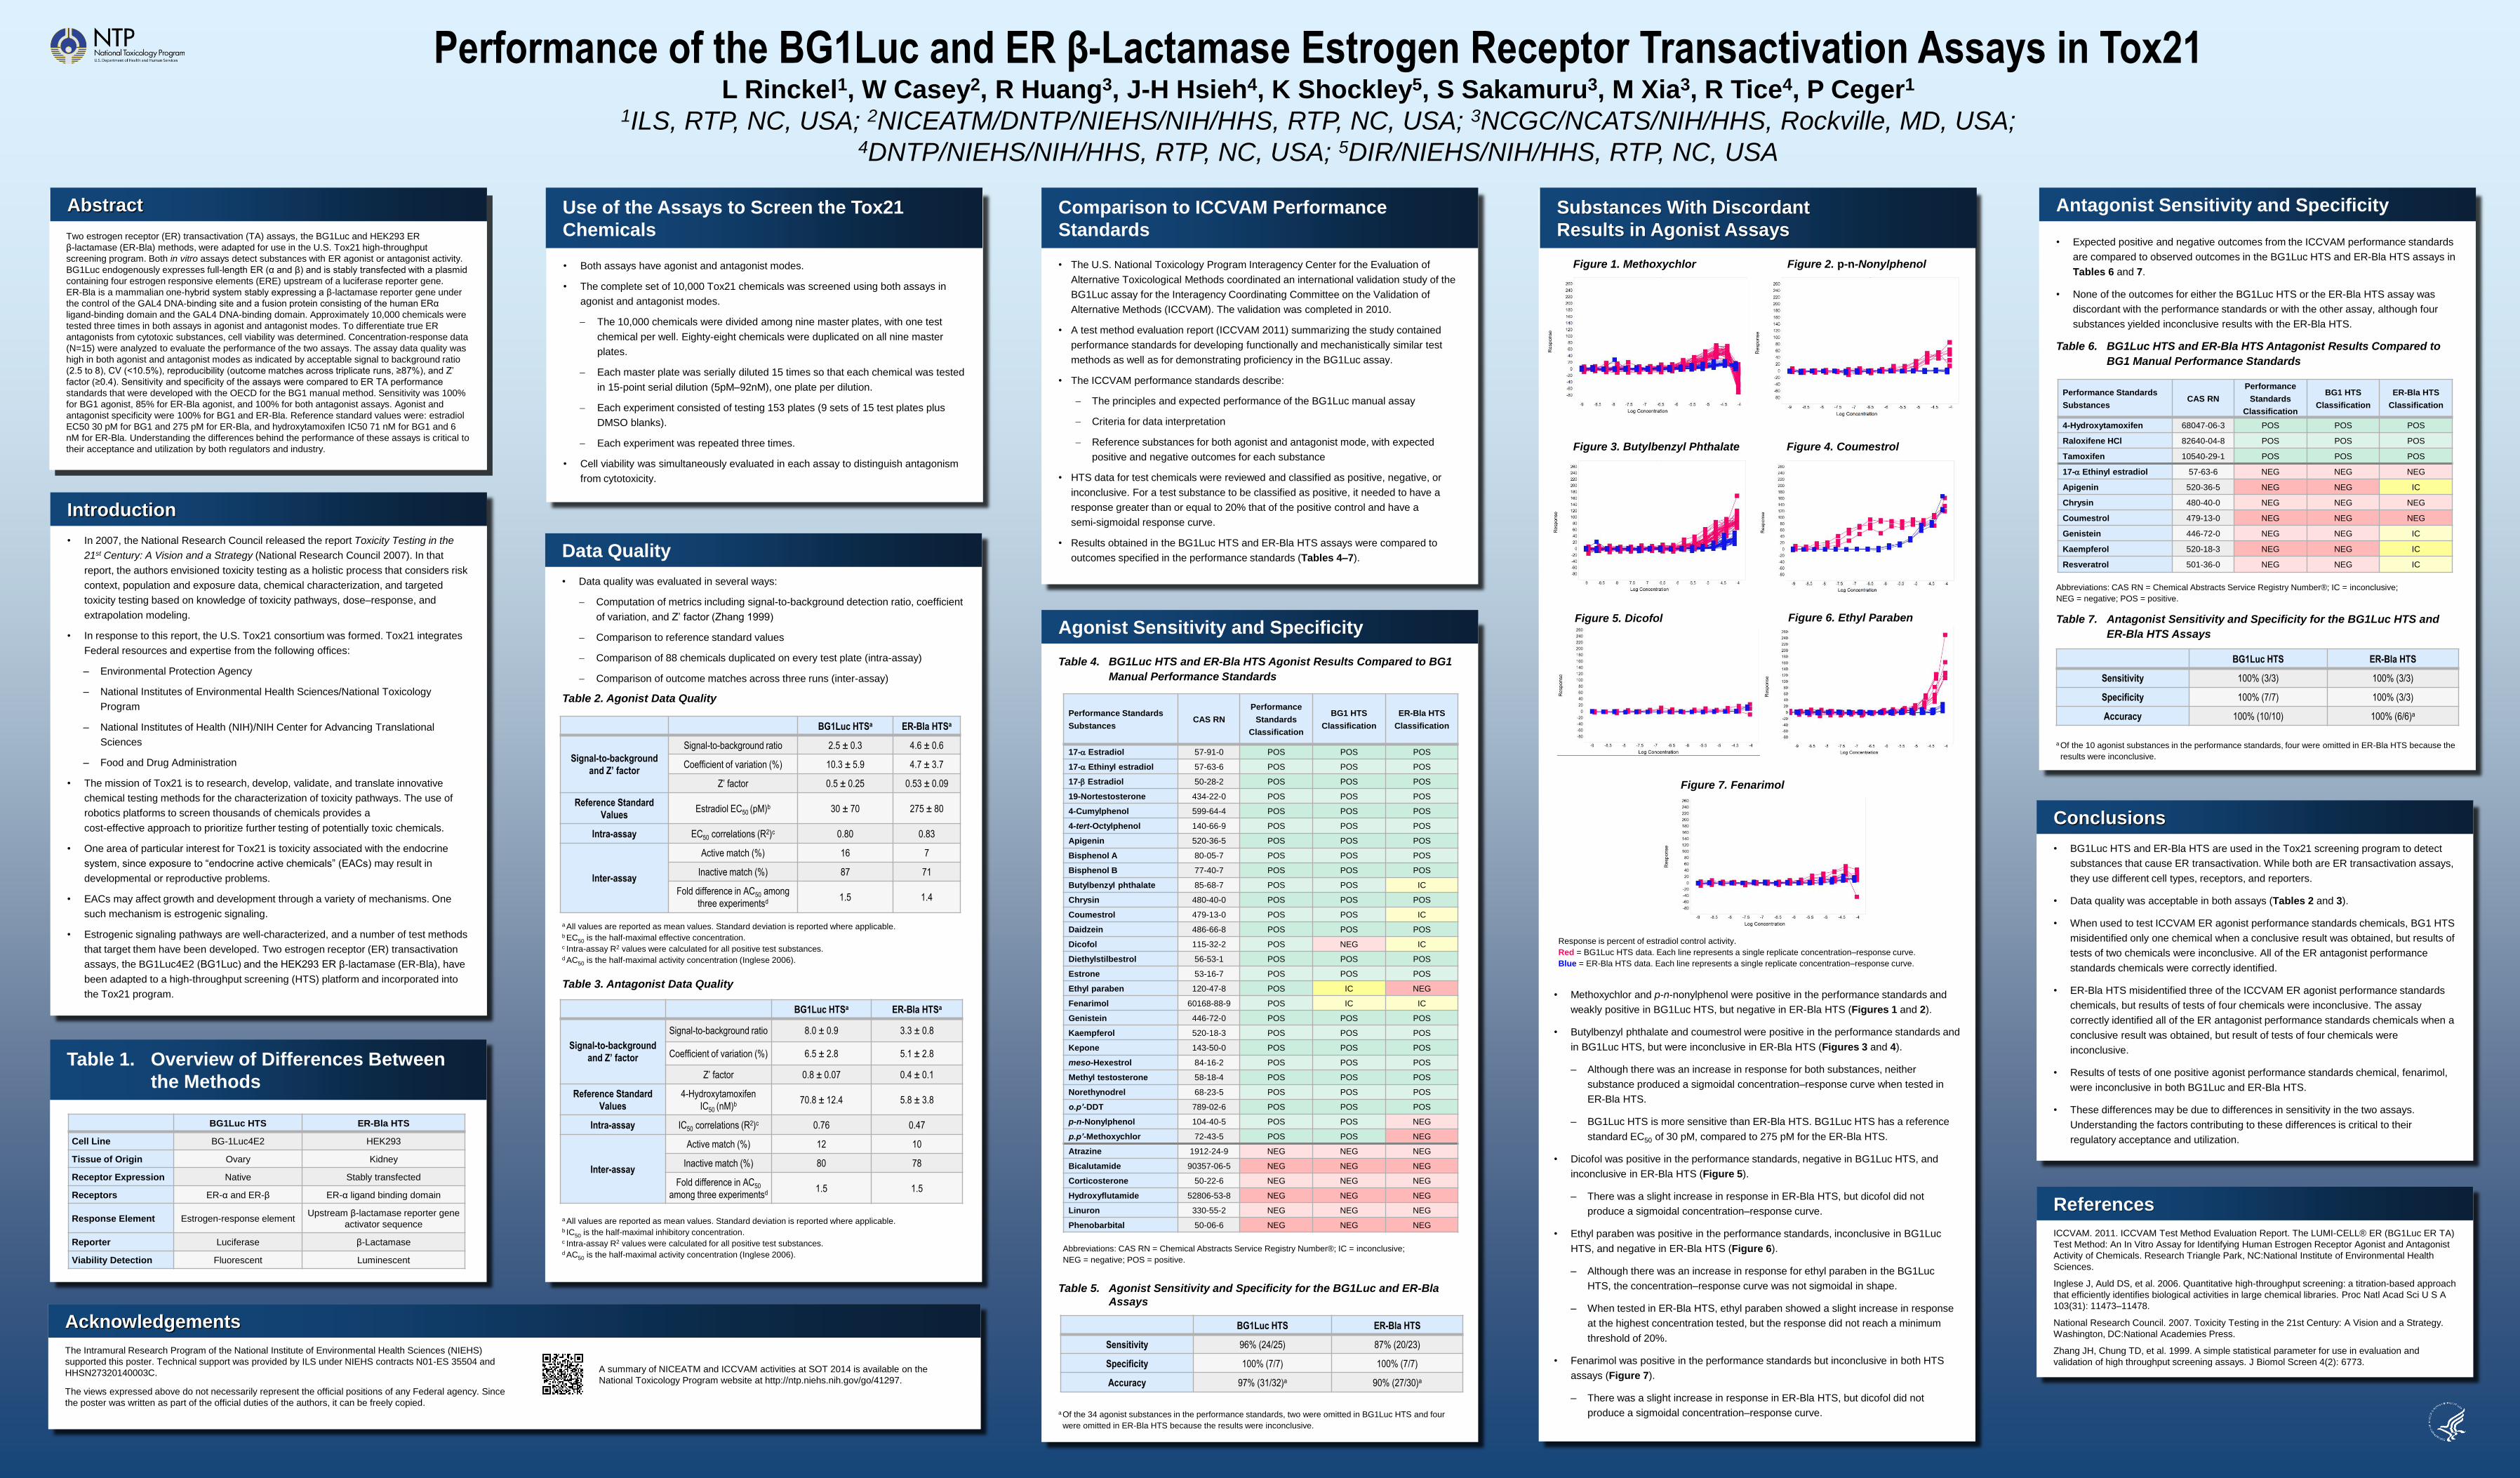
Table 4. BG1Luc HTS and ER-Bla HTS Agonist Results Compared to BG1
Manual Performance Standards
Abbreviations: CAS RN = Chemical Abstracts Service Registry Number®; IC = inconclusive;
NEG = negative; POS = positive.
Table 5. Agonist Sensitivity and Specificity for the BG1Luc and ER-Bla
Assays
a Of the 34 agonist substances in the performance standards, two were omitted in BG1Luc HTS and four
were omitted in ER-Bla HTS because the results were inconclusive.
• Data quality was evaluated in several ways:
Computation of metrics including signal-to-background detection ratio, coefficient
of variation, and Z’ factor (Zhang 1999)
Comparison to reference standard values
Comparison of 88 chemicals duplicated on every test plate (intra-assay)
Comparison of outcome matches across three runs (inter-assay)
Table 2. Agonist Data Quality
a All values are reported as mean values. Standard deviation is reported where applicable. b EC50 is the half-maximal effective concentration. c Intra-assay R2 values were calculated for all positive test substances. d AC50 is the half-maximal activity concentration (Inglese 2006).
Table 3. Antagonist Data Quality
a All values are reported as mean values. Standard deviation is reported where applicable. b IC50 is the half-maximal inhibitory concentration. c Intra-assay R2 values were calculated for all positive test substances. d AC50 is the half-maximal activity concentration (Inglese 2006).
Two estrogen receptor (ER) transactivation (TA) assays, the BG1Luc and HEK293 ER
β-lactamase (ER-Bla) methods, were adapted for use in the U.S. Tox21 high-throughput
screening program. Both in vitro assays detect substances with ER agonist or antagonist activity.
BG1Luc endogenously expresses full-length ER (α and β) and is stably transfected with a plasmid
containing four estrogen responsive elements (ERE) upstream of a luciferase reporter gene.
ER-Bla is a mammalian one-hybrid system stably expressing a β-lactamase reporter gene under
the control of the GAL4 DNA-binding site and a fusion protein consisting of the human ERα
ligand-binding domain and the GAL4 DNA-binding domain. Approximately 10,000 chemicals were
tested three times in both assays in agonist and antagonist modes. To differentiate true ER
antagonists from cytotoxic substances, cell viability was determined. Concentration-response data
(N=15) were analyzed to evaluate the performance of the two assays. The assay data quality was
high in both agonist and antagonist modes as indicated by acceptable signal to background ratio
(2.5 to 8), CV (<10.5%), reproducibility (outcome matches across triplicate runs, ≥87%), and Z’
factor (≥0.4). Sensitivity and specificity of the assays were compared to ER TA performance
standards that were developed with the OECD for the BG1 manual method. Sensitivity was 100%
for BG1 agonist, 85% for ER-Bla agonist, and 100% for both antagonist assays. Agonist and
antagonist specificity were 100% for BG1 and ER-Bla. Reference standard values were: estradiol
EC50 30 pM for BG1 and 275 pM for ER-Bla, and hydroxytamoxifen IC50 71 nM for BG1 and 6
nM for ER-Bla. Understanding the differences behind the performance of these assays is critical to
their acceptance and utilization by both regulators and industry.
Abstract
Performance of the BG1Luc and ER β-Lactamase Estrogen Receptor Transactivation Assays in Tox21 L Rinckel1, W Casey2, R Huang3, J-H Hsieh4, K Shockley5, S Sakamuru3, M Xia3, R Tice4, P Ceger1
1ILS, RTP, NC, USA; 2NICEATM/DNTP/NIEHS/NIH/HHS, RTP, NC, USA; 3NCGC/NCATS/NIH/HHS, Rockville, MD, USA; 4DNTP/NIEHS/NIH/HHS, RTP, NC, USA; 5DIR/NIEHS/NIH/HHS, RTP, NC, USA
• In 2007, the National Research Council released the report Toxicity Testing in the
21st Century: A Vision and a Strategy (National Research Council 2007). In that
report, the authors envisioned toxicity testing as a holistic process that considers risk
context, population and exposure data, chemical characterization, and targeted
toxicity testing based on knowledge of toxicity pathways, dose–response, and
extrapolation modeling.
• In response to this report, the U.S. Tox21 consortium was formed. Tox21 integrates
Federal resources and expertise from the following offices:
– Environmental Protection Agency
– National Institutes of Environmental Health Sciences/National Toxicology
Program
– National Institutes of Health (NIH)/NIH Center for Advancing Translational
Sciences
– Food and Drug Administration
• The mission of Tox21 is to research, develop, validate, and translate innovative
chemical testing methods for the characterization of toxicity pathways. The use of
robotics platforms to screen thousands of chemicals provides a
cost-effective approach to prioritize further testing of potentially toxic chemicals.
• One area of particular interest for Tox21 is toxicity associated with the endocrine
system, since exposure to “endocrine active chemicals” (EACs) may result in
developmental or reproductive problems.
• EACs may affect growth and development through a variety of mechanisms. One
such mechanism is estrogenic signaling.
• Estrogenic signaling pathways are well-characterized, and a number of test methods
that target them have been developed. Two estrogen receptor (ER) transactivation
assays, the BG1Luc4E2 (BG1Luc) and the HEK293 ER β-lactamase (ER-Bla), have
been adapted to a high-throughput screening (HTS) platform and incorporated into
the Tox21 program.
Introduction
Substances With Discordant
Results in Agonist Assays
Data Quality
• BG1Luc HTS and ER-Bla HTS are used in the Tox21 screening program to detect
substances that cause ER transactivation. While both are ER transactivation assays,
they use different cell types, receptors, and reporters.
• Data quality was acceptable in both assays (Tables 2 and 3).
• When used to test ICCVAM ER agonist performance standards chemicals, BG1 HTS
misidentified only one chemical when a conclusive result was obtained, but results of
tests of two chemicals were inconclusive. All of the ER antagonist performance
standards chemicals were correctly identified.
• ER-Bla HTS misidentified three of the ICCVAM ER agonist performance standards
chemicals, but results of tests of four chemicals were inconclusive. The assay
correctly identified all of the ER antagonist performance standards chemicals when a
conclusive result was obtained, but result of tests of four chemicals were
inconclusive.
• Results of tests of one positive agonist performance standards chemical, fenarimol,
were inconclusive in both BG1Luc and ER-Bla HTS.
• These differences may be due to differences in sensitivity in the two assays.
Understanding the factors contributing to these differences is critical to their
regulatory acceptance and utilization.
Conclusions
The Intramural Research Program of the National Institute of Environmental Health Sciences (NIEHS)
supported this poster. Technical support was provided by ILS under NIEHS contracts N01-ES 35504 and
HHSN27320140003C.
The views expressed above do not necessarily represent the official positions of any Federal agency. Since
the poster was written as part of the official duties of the authors, it can be freely copied.
A summary of NICEATM and ICCVAM activities at SOT 2014 is available on the
National Toxicology Program website at http://ntp.niehs.nih.gov/go/41297.
Acknowledgements
ICCVAM. 2011. ICCVAM Test Method Evaluation Report. The LUMI-CELL® ER (BG1Luc ER TA)
Test Method: An In Vitro Assay for Identifying Human Estrogen Receptor Agonist and Antagonist
Activity of Chemicals. Research Triangle Park, NC:National Institute of Environmental Health
Sciences.
Inglese J, Auld DS, et al. 2006. Quantitative high-throughput screening: a titration-based approach
that efficiently identifies biological activities in large chemical libraries. Proc Natl Acad Sci U S A
103(31): 11473–11478.
National Research Council. 2007. Toxicity Testing in the 21st Century: A Vision and a Strategy.
Washington, DC:National Academies Press.
Zhang JH, Chung TD, et al. 1999. A simple statistical parameter for use in evaluation and
validation of high throughput screening assays. J Biomol Screen 4(2): 6773.
References
BG1Luc HTSa ER-Bla HTSa
Signal-to-background
and Z’ factor
Signal-to-background ratio 2.5 ± 0.3 4.6 ± 0.6
Coefficient of variation (%) 10.3 ± 5.9 4.7 ± 3.7
Z’ factor 0.5 ± 0.25 0.53 ± 0.09
Reference Standard
Values Estradiol EC50 (pM)b 30 ± 70 275 ± 80
Intra-assay EC50 correlations (R2)c 0.80 0.83
Inter-assay
Active match (%) 16 7
Inactive match (%) 87 71
Fold difference in AC50 among
three experimentsd 1.5 1.4
BG1Luc HTSa ER-Bla HTSa
Signal-to-background
and Z’ factor
Signal-to-background ratio 8.0 ± 0.9 3.3 ± 0.8
Coefficient of variation (%) 6.5 ± 2.8 5.1 ± 2.8
Z’ factor 0.8 ± 0.07 0.4 ± 0.1
Reference Standard
Values
4-Hydroxytamoxifen
IC50 (nM)b 70.8 ± 12.4 5.8 ± 3.8
Intra-assay IC50 correlations (R2)c 0.76 0.47
Inter-assay
Active match (%) 12 10
Inactive match (%) 80 78
Fold difference in AC50
among three experimentsd 1.5 1.5
• The U.S. National Toxicology Program Interagency Center for the Evaluation of
Alternative Toxicological Methods coordinated an international validation study of the
BG1Luc assay for the Interagency Coordinating Committee on the Validation of
Alternative Methods (ICCVAM). The validation was completed in 2010.
• A test method evaluation report (ICCVAM 2011) summarizing the study contained
performance standards for developing functionally and mechanistically similar test
methods as well as for demonstrating proficiency in the BG1Luc assay.
• The ICCVAM performance standards describe:
The principles and expected performance of the BG1Luc manual assay
Criteria for data interpretation
Reference substances for both agonist and antagonist mode, with expected
positive and negative outcomes for each substance
• HTS data for test chemicals were reviewed and classified as positive, negative, or
inconclusive. For a test substance to be classified as positive, it needed to have a
response greater than or equal to 20% that of the positive control and have a
semi-sigmoidal response curve.
• Results obtained in the BG1Luc HTS and ER-Bla HTS assays were compared to
outcomes specified in the performance standards (Tables 4–7).
Comparison to ICCVAM Performance
Standards
Table 1. Overview of Differences Between
the Methods
Agonist Sensitivity and Specificity
BG1Luc HTS ER-Bla HTS
Sensitivity 96% (24/25) 87% (20/23)
Specificity 100% (7/7) 100% (7/7)
Accuracy 97% (31/32)a 90% (27/30)a
Response is percent of estradiol control activity.
Red = BG1Luc HTS data. Each line represents a single replicate concentration–response curve.
Blue = ER-Bla HTS data. Each line represents a single replicate concentration–response curve.
Antagonist Sensitivity and Specificity
• Expected positive and negative outcomes from the ICCVAM performance standards
are compared to observed outcomes in the BG1Luc HTS and ER-Bla HTS assays in
Tables 6 and 7.
• None of the outcomes for either the BG1Luc HTS or the ER-Bla HTS assay was
discordant with the performance standards or with the other assay, although four
substances yielded inconclusive results with the ER-Bla HTS.
Table 6. BG1Luc HTS and ER-Bla HTS Antagonist Results Compared to
BG1 Manual Performance Standards
Abbreviations: CAS RN = Chemical Abstracts Service Registry Number®; IC = inconclusive;
NEG = negative; POS = positive.
Table 7. Antagonist Sensitivity and Specificity for the BG1Luc HTS and
ER-Bla HTS Assays
a Of the 10 agonist substances in the performance standards, four were omitted in ER-Bla HTS because the
results were inconclusive.
BG1Luc HTS ER-Bla HTS
Sensitivity 100% (3/3) 100% (3/3)
Specificity 100% (7/7) 100% (3/3)
Accuracy 100% (10/10) 100% (6/6)a
Figure 1. Methoxychlor Figure 2. p-n-Nonylphenol
Figure 3. Butylbenzyl Phthalate Figure 4. Coumestrol
Figure 6. Ethyl Paraben
• Methoxychlor and p-n-nonylphenol were positive in the performance standards and
weakly positive in BG1Luc HTS, but negative in ER-Bla HTS (Figures 1 and 2).
• Butylbenzyl phthalate and coumestrol were positive in the performance standards and
in BG1Luc HTS, but were inconclusive in ER-Bla HTS (Figures 3 and 4).
– Although there was an increase in response for both substances, neither
substance produced a sigmoidal concentration–response curve when tested in
ER-Bla HTS.
– BG1Luc HTS is more sensitive than ER-Bla HTS. BG1Luc HTS has a reference
standard EC50 of 30 pM, compared to 275 pM for the ER-Bla HTS.
• Dicofol was positive in the performance standards, negative in BG1Luc HTS, and
inconclusive in ER-Bla HTS (Figure 5).
– There was a slight increase in response in ER-Bla HTS, but dicofol did not
produce a sigmoidal concentration–response curve.
• Ethyl paraben was positive in the performance standards, inconclusive in BG1Luc
HTS, and negative in ER-Bla HTS (Figure 6).
– Although there was an increase in response for ethyl paraben in the BG1Luc
HTS, the concentration–response curve was not sigmoidal in shape.
– When tested in ER-Bla HTS, ethyl paraben showed a slight increase in response
at the highest concentration tested, but the response did not reach a minimum
threshold of 20%.
• Fenarimol was positive in the performance standards but inconclusive in both HTS
assays (Figure 7).
– There was a slight increase in response in ER-Bla HTS, but dicofol did not
produce a sigmoidal concentration–response curve.
• Both assays have agonist and antagonist modes.
• The complete set of 10,000 Tox21 chemicals was screened using both assays in
agonist and antagonist modes.
The 10,000 chemicals were divided among nine master plates, with one test
chemical per well. Eighty-eight chemicals were duplicated on all nine master
plates.
Each master plate was serially diluted 15 times so that each chemical was tested
in 15-point serial dilution (5pM–92nM), one plate per dilution.
Each experiment consisted of testing 153 plates (9 sets of 15 test plates plus
DMSO blanks).
Each experiment was repeated three times.
• Cell viability was simultaneously evaluated in each assay to distinguish antagonism
from cytotoxicity.
Use of the Assays to Screen the Tox21
Chemicals
Performance Standards
Substances CAS RN
Performance
Standards
Classification
BG1 HTS
Classification
ER-Bla HTS
Classification
17- Estradiol 57-91-0 POS POS POS
17- Ethinyl estradiol 57-63-6 POS POS POS
17- Estradiol 50-28-2 POS POS POS
19-Nortestosterone 434-22-0 POS POS POS
4-Cumylphenol 599-64-4 POS POS POS
4-tert-Octylphenol 140-66-9 POS POS POS
Apigenin 520-36-5 POS POS POS
Bisphenol A 80-05-7 POS POS POS
Bisphenol B 77-40-7 POS POS POS
Butylbenzyl phthalate 85-68-7 POS POS IC
Chrysin 480-40-0 POS POS POS
Coumestrol 479-13-0 POS POS IC
Daidzein 486-66-8 POS POS POS
Dicofol 115-32-2 POS NEG IC
Diethylstilbestrol 56-53-1 POS POS POS
Estrone 53-16-7 POS POS POS
Ethyl paraben 120-47-8 POS IC NEG
Fenarimol 60168-88-9 POS IC IC
Genistein 446-72-0 POS POS POS
Kaempferol 520-18-3 POS POS POS
Kepone 143-50-0 POS POS POS
meso-Hexestrol 84-16-2 POS POS POS
Methyl testosterone 58-18-4 POS POS POS
Norethynodrel 68-23-5 POS POS POS
o.p’-DDT 789-02-6 POS POS POS
p-n-Nonylphenol 104-40-5 POS POS NEG
p.p’-Methoxychlor 72-43-5 POS POS NEG
Atrazine 1912-24-9 NEG NEG NEG
Bicalutamide 90357-06-5 NEG NEG NEG
Corticosterone 50-22-6 NEG NEG NEG
Hydroxyflutamide 52806-53-8 NEG NEG NEG
Linuron 330-55-2 NEG NEG NEG
Phenobarbital 50-06-6 NEG NEG NEG
Performance Standards
Substances CAS RN
Performance
Standards
Classification
BG1 HTS
Classification
ER-Bla HTS
Classification
4-Hydroxytamoxifen 68047-06-3 POS POS POS
Raloxifene HCl 82640-04-8 POS POS POS
Tamoxifen 10540-29-1 POS POS POS
17- Ethinyl estradiol 57-63-6 NEG NEG NEG
Apigenin 520-36-5 NEG NEG IC
Chrysin 480-40-0 NEG NEG NEG
Coumestrol 479-13-0 NEG NEG NEG
Genistein 446-72-0 NEG NEG IC
Kaempferol 520-18-3 NEG NEG IC
Resveratrol 501-36-0 NEG NEG IC
BG1Luc HTS ER-Bla HTS
Cell Line BG-1Luc4E2 HEK293
Tissue of Origin Ovary Kidney
Receptor Expression Native Stably transfected
Receptors ER-α and ER-β ER-α ligand binding domain
Response Element Estrogen-response element Upstream β-lactamase reporter gene
activator sequence
Reporter Luciferase β-Lactamase
Viability Detection Fluorescent Luminescent
Figure 5. Dicofol
Figure 7. Fenarimol