
PE-1600 Iodine Molecular Spectroscopy · PE-1600 Iodine Molecular Spectroscopy Iodine Diatomic...
2
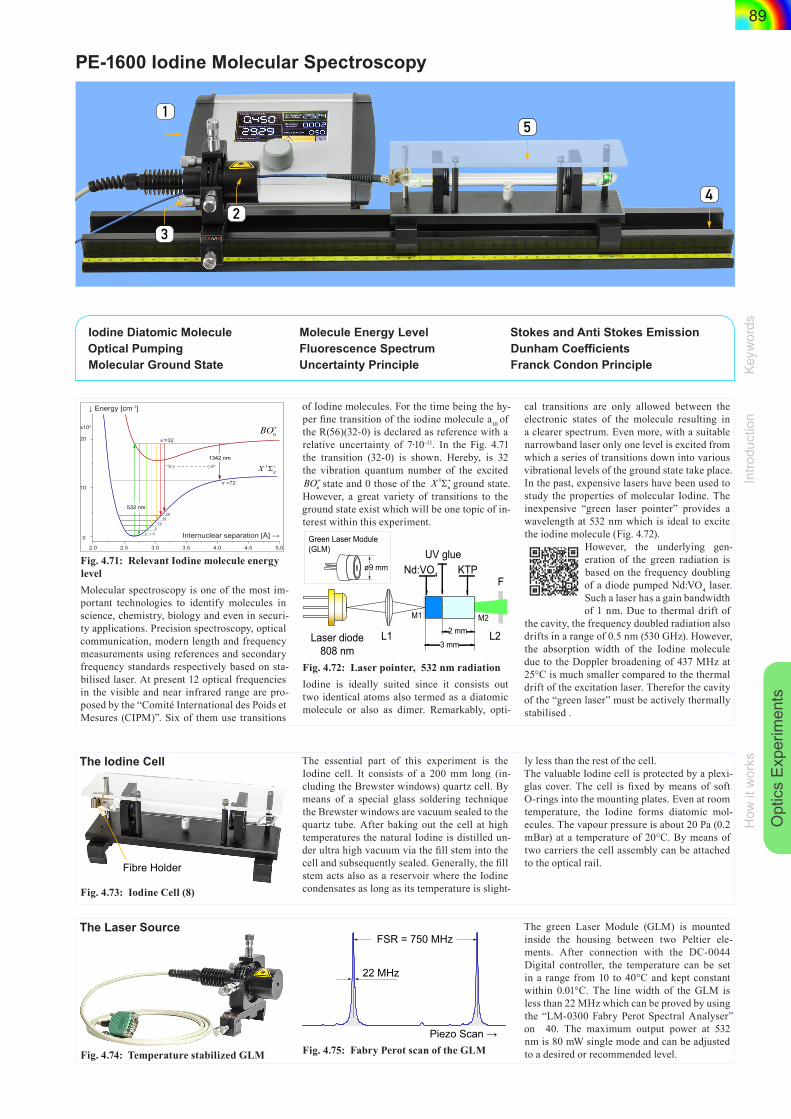
Optics Experiments 0 2.5 3.0 3.5 4.0 4.5 5.0 2.0 10 20 x10 3 v’=32 v =72 Internuclear separation [Å] → 20 v’’ = 0 10 15 5 ↓ Energy [cm -1 ] BO u + X g 1 Σ + 532 nm 1342 nm Fig. 4.71: Relevant Iodine molecule energy level Molecular spectroscopy is one of the most im- portant technologies to identify molecules in science, chemistry, biology and even in securi- ty applications. Precision spectroscopy, optical communication, modern length and frequency measurements using references and secondary frequency standards respectively based on sta- bilised laser. At present 12 optical frequencies in the visible and near infrared range are pro- posed by the “Comité International des Poids et Mesures (CIPM)”. Six of them use transitions of Iodine molecules. For the time being the hy- per fine transition of the iodine molecule a 10 of the R(56)(32-0) is declared as reference with a relative uncertainty of 7∙ 10 -11 . In the Fig. 4.71 the transition (32-0) is shown. Hereby, is 32 the vibration quantum number of the excited BO u + state and 0 those of the X u 1 ground state. However, a great variety of transitions to the ground state exist which will be one topic of in- terest within this experiment. 3 mm Nd:VO 4 KTP UV glue L1 M1 M2 L2 F Laser diode 808 nm Green Laser Module (GLM) 2 mm ø9 mm Fig. 4.72: Laser pointer, 532 nm radiation Iodine is ideally suited since it consists out two identical atoms also termed as a diatomic molecule or also as dimer. Remarkably, opti- cal transitions are only allowed between the electronic states of the molecule resulting in a clearer spectrum. Even more, with a suitable narrowband laser only one level is excited from which a series of transitions down into various vibrational levels of the ground state take place. In the past, expensive lasers have been used to study the properties of molecular Iodine. The inexpensive “green laser pointer” provides a wavelength at 532 nm which is ideal to excite the iodine molecule (Fig. 4.72). However, the underlying gen- eration of the green radiation is based on the frequency doubling of a diode pumped Nd:VO 4 laser. Such a laser has a gain bandwidth of 1 nm. Due to thermal drift of the cavity, the frequency doubled radiation also drifts in a range of 0.5 nm (530 GHz). However, the absorption width of the Iodine molecule due to the Doppler broadening of 437 MHz at 25°C is much smaller compared to the thermal drift of the excitation laser. Therefor the cavity of the “green laser” must be actively thermally stabilised . 1 4 5 2 3 PE-1600 Iodine Molecular Spectroscopy Iodine Diatomic Molecule Molecule Energy Level Stokes and Anti Stokes Emission Optical Pumping Fluorescence Spectrum Dunham Coefficients Molecular Ground State Uncertainty Principle Franck Condon Principle The Iodine Cell Fibre Holder Fig. 4.73: Iodine Cell (8) The essential part of this experiment is the Iodine cell. It consists of a 200 mm long (in- cluding the Brewster windows) quartz cell. By means of a special glass soldering technique the Brewster windows are vacuum sealed to the quartz tube. After baking out the cell at high temperatures the natural Iodine is distilled un- der ultra high vacuum via the fill stem into the cell and subsequently sealed. Generally, the fill stem acts also as a reservoir where the Iodine condensates as long as its temperature is slight- ly less than the rest of the cell. The valuable Iodine cell is protected by a plexi- glas cover. The cell is fixed by means of soft O-rings into the mounting plates. Even at room temperature, the Iodine forms diatomic mol- ecules. The vapour pressure is about 20 Pa (0.2 mBar) at a temperature of 20°C. By means of two carriers the cell assembly can be attached to the optical rail. The Laser Source Fig. 4.74: Temperature stabilized GLM FSR = 750 MHz 22 MHz Piezo Scan → Fig. 4.75: Fabry Perot scan of the GLM The green Laser Module (GLM) is mounted inside the housing between two Peltier ele- ments. After connection with the DC-0044 Digital controller, the temperature can be set in a range from 10 to 40°C and kept constant within 0.01°C. The line width of the GLM is less than 22 MHz which can be proved by using the “LM-0300 Fabry Perot Spectral Analyser” on 40. The maximum output power at 532 nm is 80 mW single mode and can be adjusted to a desired or recommended level. Introduction Keywords How it works 89
Transcript of PE-1600 Iodine Molecular Spectroscopy · PE-1600 Iodine Molecular Spectroscopy Iodine Diatomic...
Opt
ics
Expe
rimen
ts
0
2.5 3.0 3.5 4.0 4.5 5.02.0
10
20
x103
v’=32
v =72
Internuclear separation [Å] →
20
v’’ = 0
1015
5
↓ Energy [cm-1]
BOu+
X g1Σ+
532 nm
1342 nm
Fig. 4.71: Relevant Iodine molecule energy levelMolecular spectroscopy is one of the most im-portant technologies to identify molecules in science, chemistry, biology and even in securi-ty applications. Precision spectroscopy, optical communication, modern length and frequency measurements using references and secondary frequency standards respectively based on sta-bilised laser. At present 12 optical frequencies in the visible and near infrared range are pro-posed by the “Comité International des Poids et Mesures (CIPM)”. Six of them use transitions
of Iodine molecules. For the time being the hy-per fine transition of the iodine molecule a10 of the R(56)(32-0) is declared as reference with a relative uncertainty of 7∙10-11. In the Fig. 4.71 the transition (32-0) is shown. Hereby, is 32 the vibration quantum number of the excited BOu
+ state and 0 those of the X u1�� ground state.
However, a great variety of transitions to the ground state exist which will be one topic of in-terest within this experiment.
3 mm
Nd:VO4 KTPUV glue
L1
M1 M2
L2
F
Laser diode808 nm
Green Laser Module(GLM)
2 mm
ø9 mm
Fig. 4.72: Laser pointer, 532 nm radiationIodine is ideally suited since it consists out two identical atoms also termed as a diatomic molecule or also as dimer. Remarkably, opti-
cal transitions are only allowed between the electronic states of the molecule resulting in a clearer spectrum. Even more, with a suitable narrowband laser only one level is excited from which a series of transitions down into various vibrational levels of the ground state take place. In the past, expensive lasers have been used to study the properties of molecular Iodine. The inexpensive “green laser pointer” provides a wavelength at 532 nm which is ideal to excite the iodine molecule (Fig. 4.72).
However, the underlying gen-eration of the green radiation is based on the frequency doubling of a diode pumped Nd:VO4 laser. Such a laser has a gain bandwidth of 1 nm. Due to thermal drift of
the cavity, the frequency doubled radiation also drifts in a range of 0.5 nm (530 GHz). However, the absorption width of the Iodine molecule due to the Doppler broadening of 437 MHz at 25°C is much smaller compared to the thermal drift of the excitation laser. Therefor the cavity of the “green laser” must be actively thermally stabilised .
1
4
5
23
PE-1600 Iodine Molecular Spectroscopy
Iodine Diatomic Molecule Molecule Energy Level Stokes and Anti Stokes EmissionOptical Pumping Fluorescence Spectrum Dunham CoefficientsMolecular Ground State Uncertainty Principle Franck Condon Principle
The Iodine Cell
Fibre Holder
Fig. 4.73: Iodine Cell (8)
The essential part of this experiment is the Iodine cell. It consists of a 200 mm long (in-cluding the Brewster windows) quartz cell. By means of a special glass soldering technique the Brewster windows are vacuum sealed to the quartz tube. After baking out the cell at high temperatures the natural Iodine is distilled un-der ultra high vacuum via the fill stem into the cell and subsequently sealed. Generally, the fill stem acts also as a reservoir where the Iodine condensates as long as its temperature is slight-
ly less than the rest of the cell. The valuable Iodine cell is protected by a plexi-glas cover. The cell is fixed by means of soft O-rings into the mounting plates. Even at room temperature, the Iodine forms diatomic mol-ecules. The vapour pressure is about 20 Pa (0.2 mBar) at a temperature of 20°C. By means of two carriers the cell assembly can be attached to the optical rail.
The Laser Source
Fig. 4.74: Temperature stabilized GLM
FSR = 750 MHz
22 MHz
Piezo Scan → Fig. 4.75: Fabry Perot scan of the GLM
The green Laser Module (GLM) is mounted inside the housing between two Peltier ele-ments. After connection with the DC-0044 Digital controller, the temperature can be set in a range from 10 to 40°C and kept constant within 0.01°C. The line width of the GLM is less than 22 MHz which can be proved by using the “LM-0300 Fabry Perot Spectral Analyser” on 40. The maximum output power at 532 nm is 80 mW single mode and can be adjusted to a desired or recommended level.
Intro
duct
ion
Keyw
ords
How
it w
orks
89
90
Optics Experim
ents
Measurement example
532.6 nm
500 600 700 Wavelength → 800
v’’=0
5
10 1520
25
[nm] 900
Picture taken looking through the grating
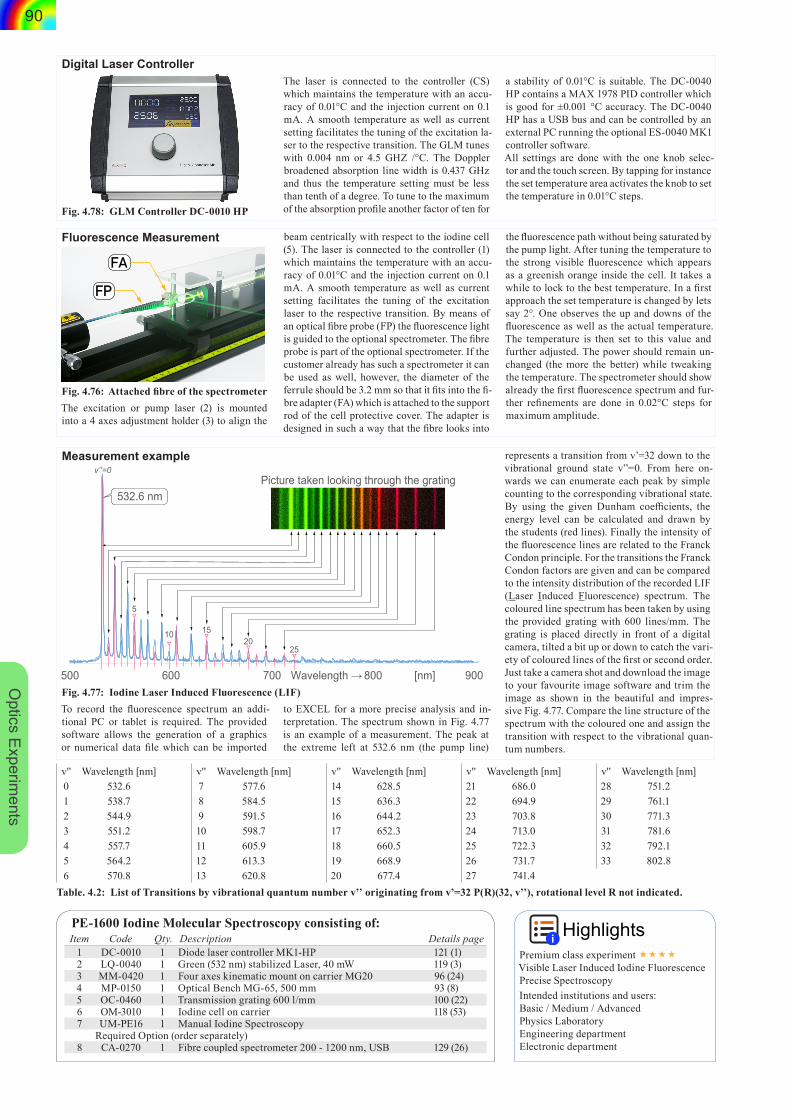
Fig. 4.77: Iodine Laser Induced Fluorescence (LIF)To record the fluorescence spectrum an addi-tional PC or tablet is required. The provided software allows the generation of a graphics or numerical data file which can be imported
to EXCEL for a more precise analysis and in-terpretation. The spectrum shown in Fig. 4.77 is an example of a measurement. The peak at the extreme left at 532.6 nm (the pump line)
represents a transition from v’=32 down to the vibrational ground state v”=0. From here on-wards we can enumerate each peak by simple counting to the corresponding vibrational state. By using the given Dunham coefficients, the energy level can be calculated and drawn by the students (red lines). Finally the intensity of the fluorescence lines are related to the Franck Condon principle. For the transitions the Franck Condon factors are given and can be compared to the intensity distribution of the recorded LIF (Laser Induced Fluorescence) spectrum. The coloured line spectrum has been taken by using the provided grating with 600 lines/mm. The grating is placed directly in front of a digital camera, tilted a bit up or down to catch the vari-ety of coloured lines of the first or second order. Just take a camera shot and download the image to your favourite image software and trim the image as shown in the beautiful and impres-sive Fig. 4.77. Compare the line structure of the spectrum with the coloured one and assign the transition with respect to the vibrational quan-tum numbers.
Fluorescence Measurement
FP
FA
Fig. 4.76: Attached fibre of the spectrometerThe excitation or pump laser (2) is mounted into a 4 axes adjustment holder (3) to align the
beam centrically with respect to the iodine cell (5). The laser is connected to the controller (1) which maintains the temperature with an accu-racy of 0.01°C and the injection current on 0.1 mA. A smooth temperature as well as current setting facilitates the tuning of the excitation laser to the respective transition. By means of an optical fibre probe (FP) the fluorescence light is guided to the optional spectrometer. The fibre probe is part of the optional spectrometer. If the customer already has such a spectrometer it can be used as well, however, the diameter of the ferrule should be 3.2 mm so that it fits into the fi-bre adapter (FA) which is attached to the support rod of the cell protective cover. The adapter is designed in such a way that the fibre looks into
the fluorescence path without being saturated by the pump light. After tuning the temperature to the strong visible fluorescence which appears as a greenish orange inside the cell. It takes a while to lock to the best temperature. In a first approach the set temperature is changed by lets say 2°. One observes the up and downs of the fluorescence as well as the actual temperature. The temperature is then set to this value and further adjusted. The power should remain un-changed (the more the better) while tweaking the temperature. The spectrometer should show already the first fluorescence spectrum and fur-ther refinements are done in 0.02°C steps for maximum amplitude.
Digital Laser Controller
Fig. 4.78: GLM Controller DC-0010 HP
The laser is connected to the controller (CS) which maintains the temperature with an accu-racy of 0.01°C and the injection current on 0.1 mA. A smooth temperature as well as current setting facilitates the tuning of the excitation la-ser to the respective transition. The GLM tunes with 0.004 nm or 4.5 GHZ /°C. The Doppler broadened absorption line width is 0.437 GHz and thus the temperature setting must be less than tenth of a degree. To tune to the maximum of the absorption profile another factor of ten for
a stability of 0.01°C is suitable. The DC-0040 HP contains a MAX 1978 PID controller which is good for ±0.001 °C accuracy. The DC-0040 HP has a USB bus and can be controlled by an external PC running the optional ES-0040 MK1 controller software.All settings are done with the one knob selec-tor and the touch screen. By tapping for instance the set temperature area activates the knob to set the temperature in 0.01°C steps.
v'' Wavelength [nm]0 532.61 538.72 544.93 551.24 557.75 564.26 570.8
v'' Wavelength [nm]7 577.68 584.59 591.510 598.711 605.912 613.313 620.8
v'' Wavelength [nm]14 628.515 636.316 644.217 652.318 660.519 668.920 677.4
v'' Wavelength [nm]21 686.022 694.923 703.824 713.025 722.326 731.727 741.4
v'' Wavelength [nm]28 751.229 761.130 771.331 781.632 792.133 802.8
Table. 4.2: List of Transitions by vibrational quantum number v’’ originating from v’=32 P(R)(32, v’’), rotational level R not indicated.
HighlightsPremium class experiment Visible Laser Induced Iodine FluorescencePrecise SpectroscopyIntended institutions and users:Basic / Medium / Advanced Physics LaboratoryEngineering departmentElectronic department
PE-1600 Iodine Molecular Spectroscopy consisting of:Item Code Qty. Description Details page
1 DC-0010 1 Diode laser controller MK1-HP 121 (1)2 LQ-0040 1 Green (532 nm) stabilized Laser, 40 mW 119 (3)3 MM-0420 1 Four axes kinematic mount on carrier MG20 96 (24)4 MP-0150 1 Optical Bench MG-65, 500 mm 93 (8)5 OC-0460 1 Transmission grating 600 l/mm 100 (22)6 OM-3010 1 Iodine cell on carrier 118 (53)7 UM-PE16 1 Manual Iodine Spectroscopy
Required Option (order separately)8 CA-0270 1 Fibre coupled spectrometer 200 - 1200 nm, USB 129 (26)


![H -calculus for the Stokes operator on L -spacesreh.math.uni-duesseldorf.de/~internet/ANGEWANDTE...[Sol77]. More recently, Fr¨ohlich proved maximal regularity of the Stokes op-erator](https://static.fdocument.org/doc/165x107/5fe6d8ac747c1e21f663f04a/h-calculus-for-the-stokes-operator-on-l-internetangewandte-sol77-more.jpg)