Abendroth Wolfgang-Κονωνική Ιστορία του Ευρωπαϊκού Εργατικού Κινήματος.pdf
Upload
winfred-carrCategory
view
218download
0
Paul Raston, Donald Kelloway, and Wolfgang Jäger Department of Chemistry, University of Alberta, Canada
the OSU symposium, 2012
Infrared spectroscopy of HOCl embedded in Infrared spectroscopy of HOCl embedded in helium nanodropletshelium nanodroplets
1
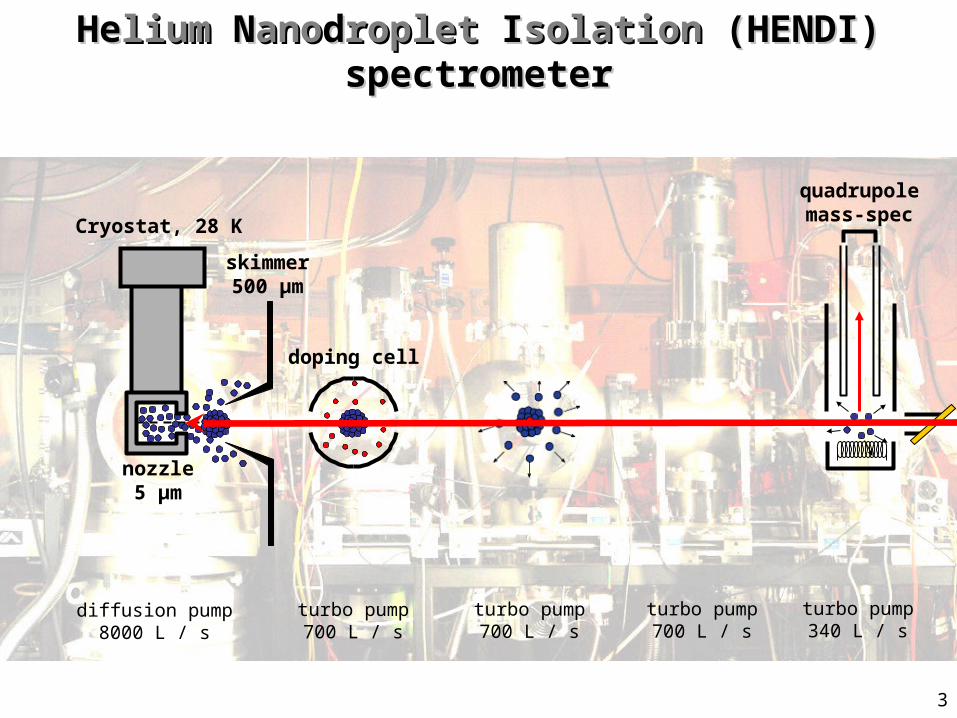
diffusion pump8000 L / s
turbo pump700 L / s
turbo pump700 L / s
turbo pump700 L / s
turbo pump340 L / s
Cryostat, 28 K
skimmer500 μm
doping cell
quadrupolemass-spec
nozzle5 μm
2
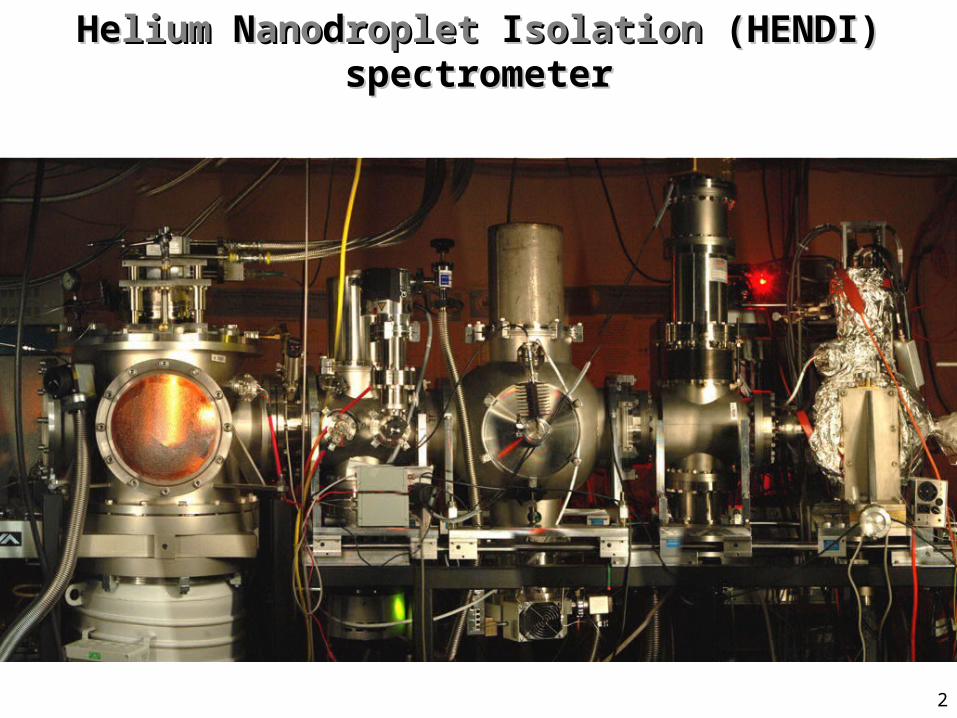
HeHeliumlium N Nanoanoddropletroplet I Isolationsolation (HENDI) spectrometer (HENDI) spectrometer
diffusion pump8000 L / s
turbo pump700 L / s
turbo pump700 L / s
turbo pump700 L / s
turbo pump340 L / s
Cryostat, 28 K
skimmer500 μm
doping cell
quadrupolemass-spec
nozzle5 μm
3
HeHeliumlium N Nanoanoddropletroplet I Isolationsolation (HENDI) spectrometer (HENDI) spectrometer
10 20 30 40 50 60 70 80 90
counts
m/z
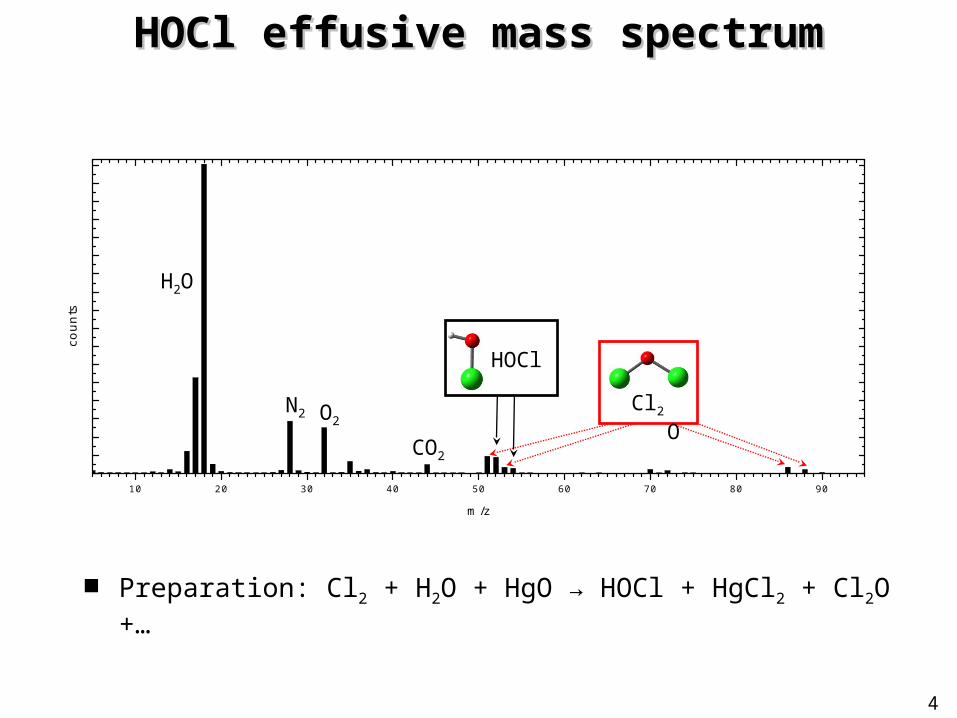
HOCl effusive mass spectrumHOCl effusive mass spectrum
Preparation: Cl2 + H2O + HgO → HOCl + HgCl2 + Cl2O +…
H2O
N2 O2
CO2
Cl2O
HOCl
4
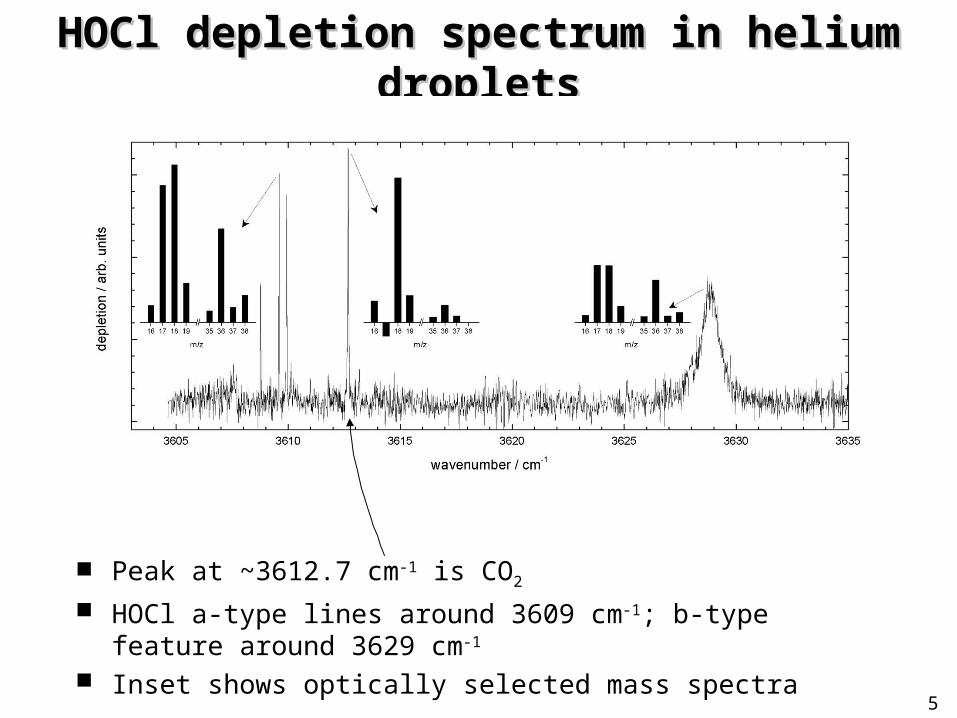
HOCl depletion spectrum in helium dropletsHOCl depletion spectrum in helium droplets
Peak at ~3612.7 cm-1 is CO2
HOCl a-type lines around 3609 cm-1; b-type feature around 3629 cm-1 Inset shows optically selected mass spectra
5
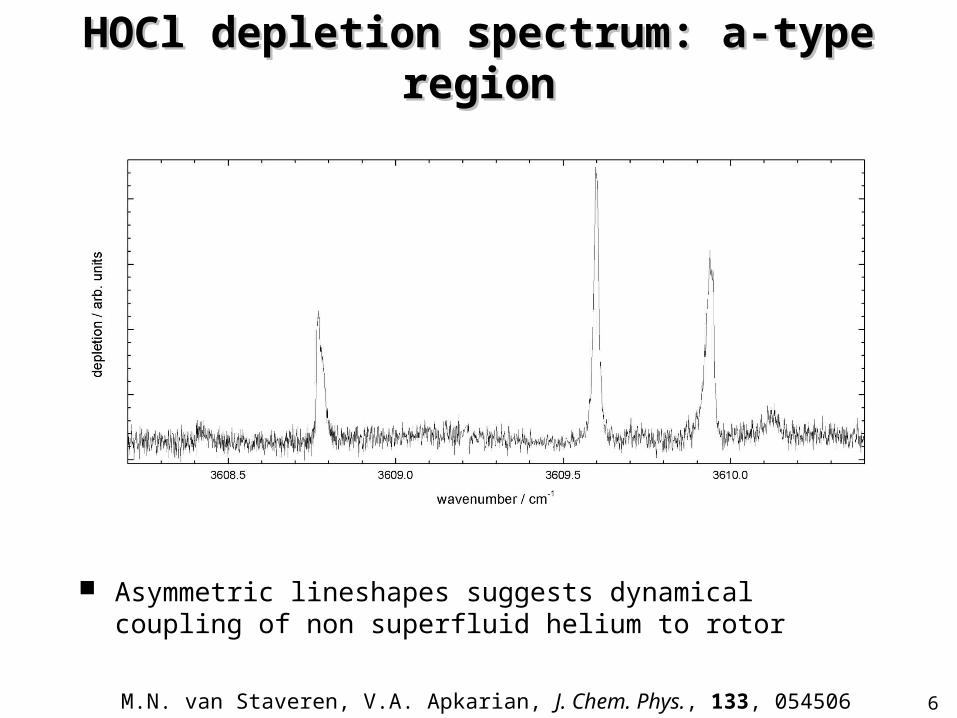
HOCl depletion spectrum: a-type regionHOCl depletion spectrum: a-type region
Asymmetric lineshapes suggests dynamical coupling of non superfluid helium to rotor
6M.N. van Staveren, V.A. Apkarian, J. Chem. Phys., 133, 054506 (2010)
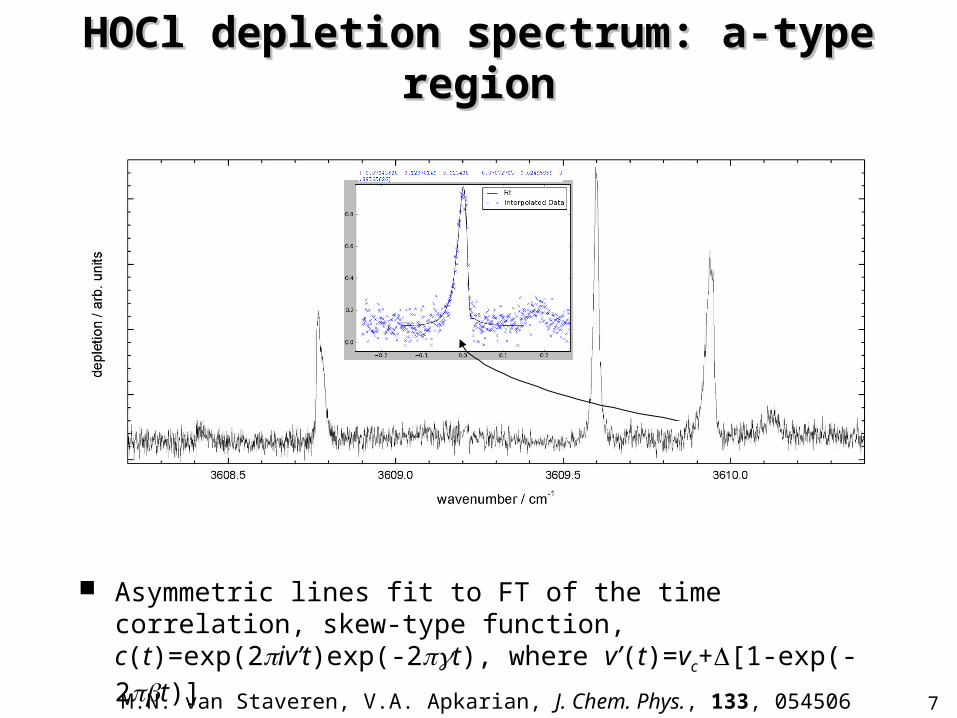
HOCl depletion spectrum: a-type regionHOCl depletion spectrum: a-type region
Asymmetric lines fit to FT of the time correlation, skew-type function, c(t)=exp(2iv’t)exp(-2t), where v’(t)=vc+[1-exp(-2t)]
7M.N. van Staveren, V.A. Apkarian, J. Chem. Phys., 133, 054506 (2010)
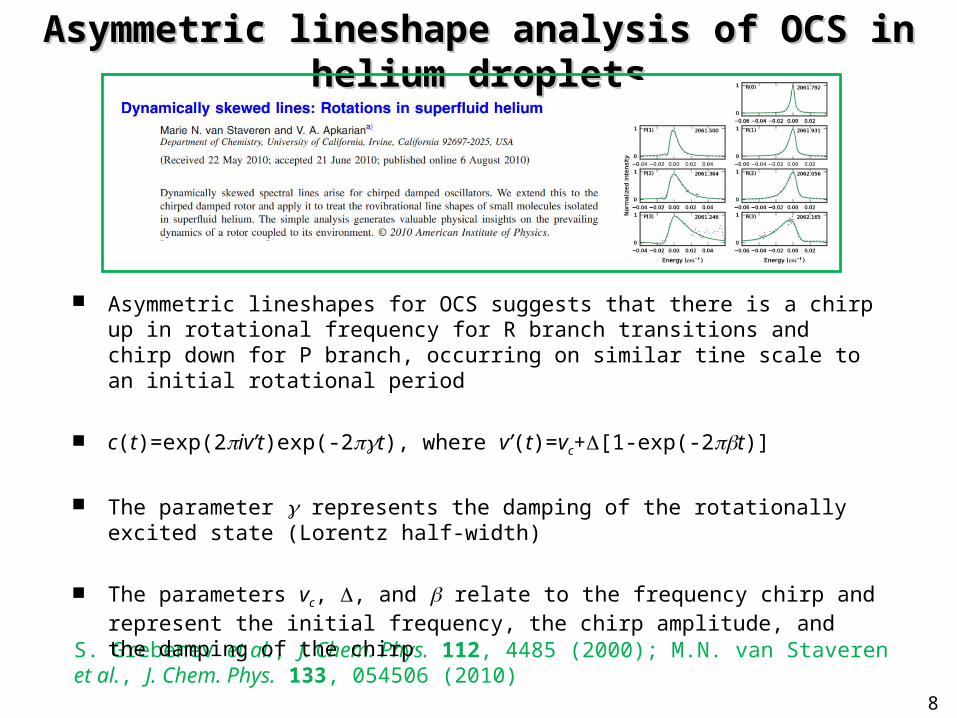
Asymmetric lineshape analysis of OCS in helium dropletsAsymmetric lineshape analysis of OCS in helium droplets
8
S. Grebenev et al., J. Chem. Phys. 112, 4485 (2000); M.N. van Staveren et al., J. Chem. Phys. 133, 054506 (2010)
Asymmetric lineshapes for OCS suggests that there is a chirp up in rotational frequency for R branch transitions and chirp down for P branch, occurring on similar tine scale to an initial rotational period
c(t)=exp(2iv’t)exp(-2t), where v’(t)=vc+[1-exp(-2t)]
The parameter represents the damping of the rotationally excited state (Lorentz half-width)
The parameters vc, , and relate to the frequency chirp and represent the initial frequency, the chirp amplitude, and the damping of the chirp
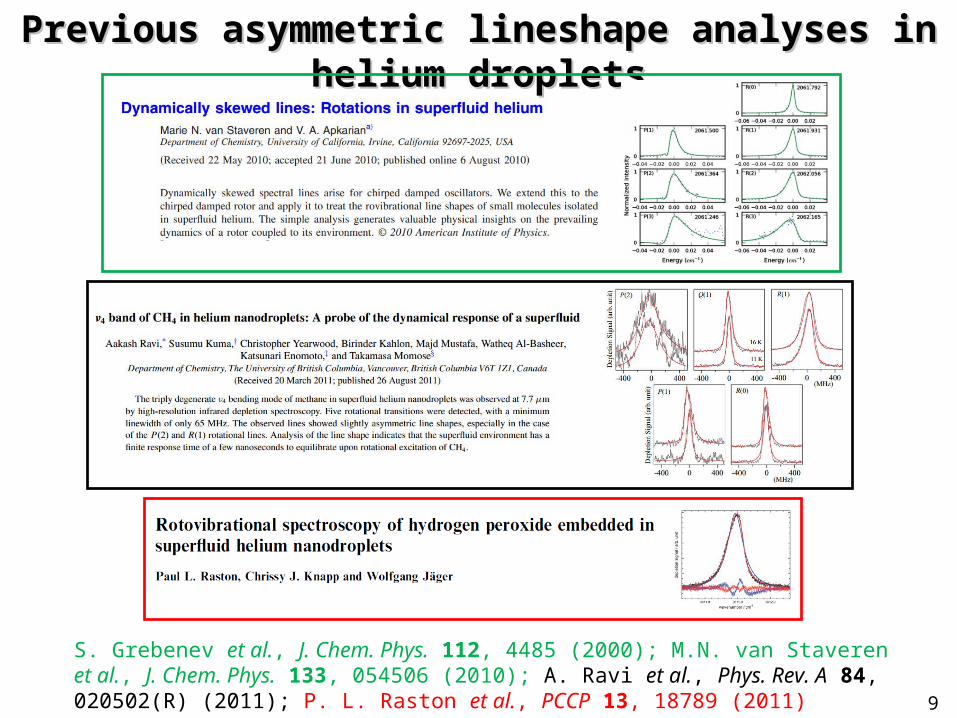
Previous asymmetric lineshape analyses in helium dropletsPrevious asymmetric lineshape analyses in helium droplets
9
S. Grebenev et al., J. Chem. Phys. 112, 4485 (2000); M.N. van Staveren et al., J. Chem. Phys. 133, 054506 (2010); A. Ravi et al., Phys. Rev. A 84, 020502(R) (2011); P. L. Raston et al., PCCP 13, 18789 (2011)
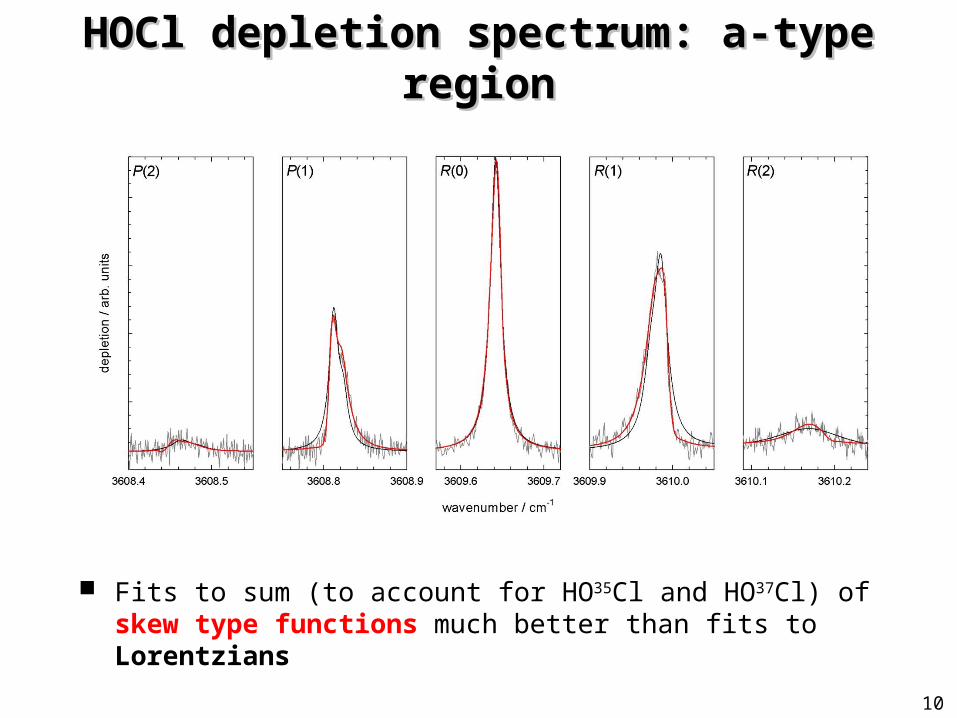
HOCl depletion spectrum: a-type regionHOCl depletion spectrum: a-type region
Fits to sum (to account for HO35Cl and HO37Cl) of skew type functions much better than fits to Lorentzians
10
moment of inertia of helium, IHe / amu*Å2
0 20 40 60 80 100 120 140
me
an r
esp
onse
tim
e,
R /
ns
0
1
2
3
4
5
CH4
H2O2
HOCl
OCS
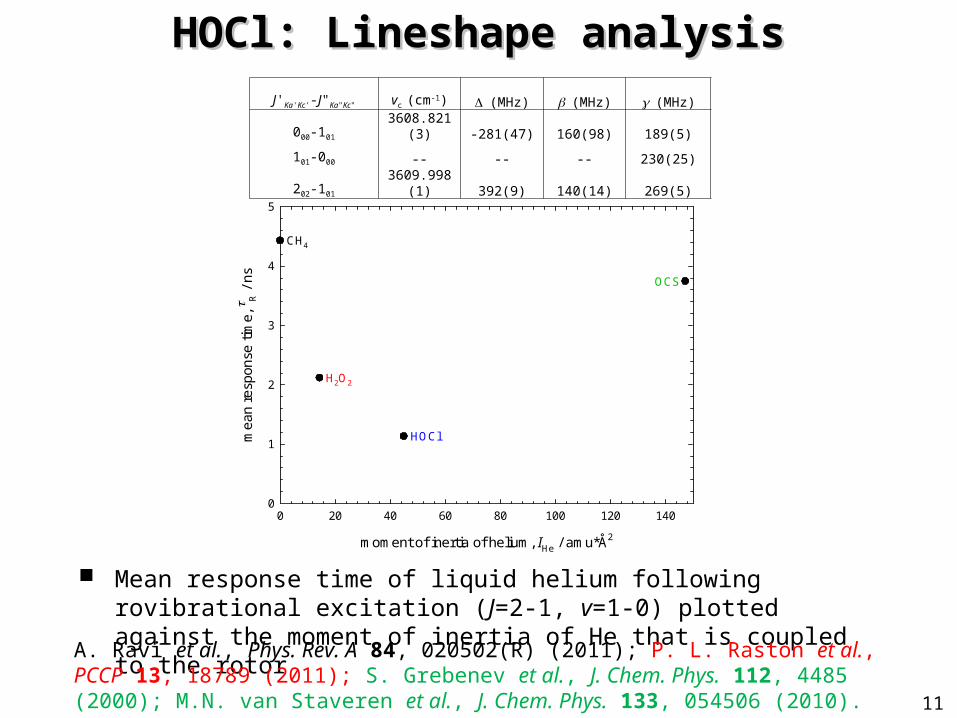
HOCl: Lineshape analysisHOCl: Lineshape analysis
11
Mean response time of liquid helium following rovibrational excitation (J=2-1, v=1-0) plotted against the moment of inertia of He that is coupled to the rotor
J'Ka'Kc'-J"Ka"Kc" vc (cm-1) (MHz) (MHz) (MHz)
000-101 3608.821(3) -281(47) 160(98) 189(5)
101-000 -- -- -- 230(25)
202-101 3609.998(1) 392(9) 140(14) 269(5)
A. Ravi et al., Phys. Rev. A 84, 020502(R) (2011); P. L. Raston et al., PCCP 13, 18789 (2011); S. Grebenev et al., J. Chem. Phys. 112, 4485 (2000); M.N. van Staveren et al., J. Chem. Phys. 133, 054506 (2010).
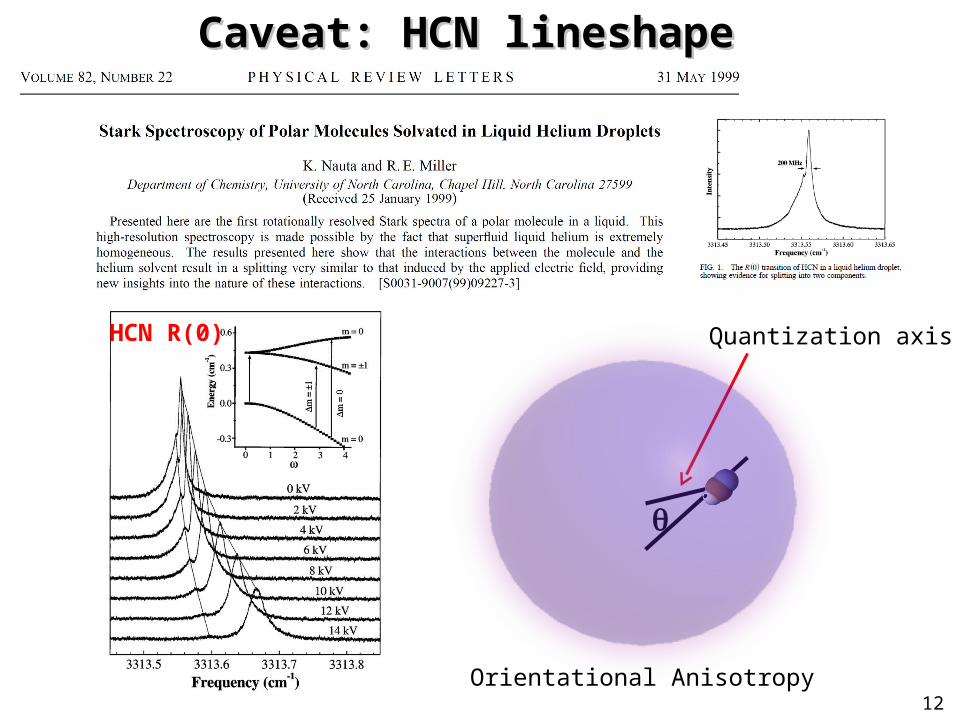
Caveat: HCN lineshape Caveat: HCN lineshape
12
HCN R(0)
Quantization axis
Orientational Anisotropy
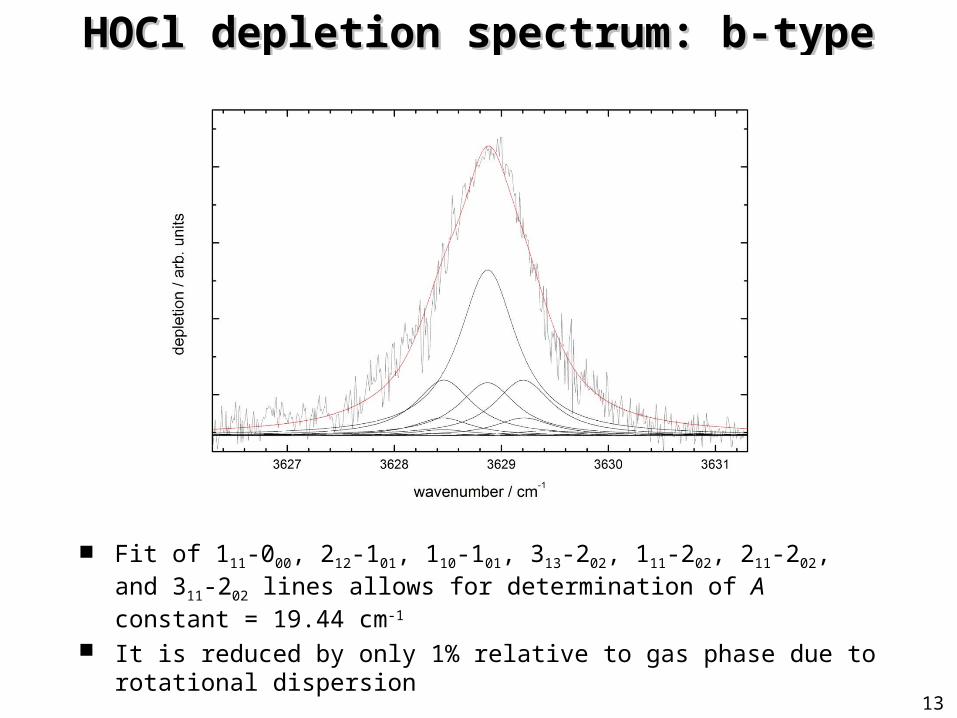
HOCl depletion spectrum: b-type regionHOCl depletion spectrum: b-type region
13
Fit of 111-000, 212-101, 110-101, 313-202, 111-202, 211-202, and 311-202 lines allows for determination of A constant = 19.44 cm-1
It is reduced by only 1% relative to gas phase due to rotational dispersion

3626 3627 3628 3629 3630 3631
0.0 0.5 1.0 1.5 2.0
Pin / W
0
deple
tion /
arb
. units
wavenumber / cm-1
HOCl depletion spectrum: b-type regionHOCl depletion spectrum: b-type region
14
b-type lines are much broader than a-type lines due to the greater density of droplet states available for relaxation of the excited rotational states.
M. Hartmann, F. Mielke, J. P. Toennies, A. F. Vilesov, G. Benedek, Phys. Rev. Lett., 76, 4560 (1996)
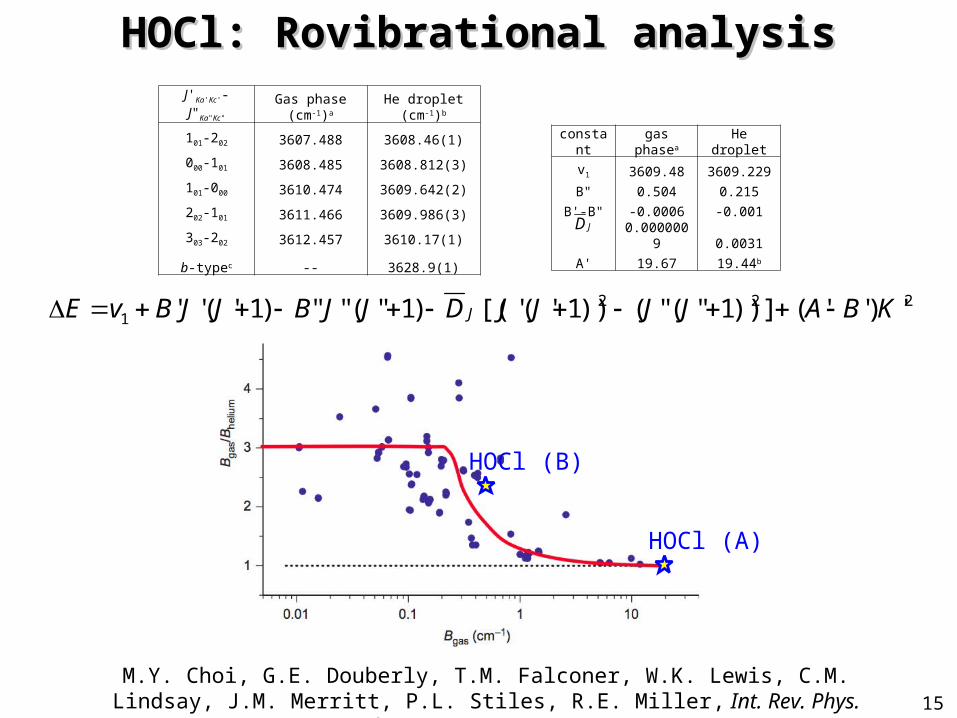
HOCl (A)
HOCl (B)
HOCl: Rovibrational analysisHOCl: Rovibrational analysis
15
2221 ')''(]))1"("())1'('[()1"("")1'('' KBAJJJJDJJBJJBvE J
constant gas phasea He droplet
v1 3609.48 3609.229
B" 0.504 0.215
B'-B" -0.0006 -0.001
0.0000009 0.0031
A' 19.67 19.44b
JD
J'Ka'Kc'-J"Ka"Kc" Gas phase (cm-1)a He droplet (cm-1)b
101-202 3607.488 3608.46(1)
000-101 3608.485 3608.812(3)
101-000 3610.474 3609.642(2)
202-101 3611.466 3609.986(3)
303-202 3612.457 3610.17(1)
b-typec -- 3628.9(1)
M.Y. Choi, G.E. Douberly, T.M. Falconer, W.K. Lewis, C.M. Lindsay, J.M. Merritt, P.L. Stiles, R.E. Miller, Int. Rev. Phys. Chem., 25, 15 (2006)
Summary and outlookSummary and outlook
Single HOCl molecules have been picked-up by superfluid helium nanodroplets with an efficiency of ~1%
Rovibrational spectrum exhibits sharp, asymmetric peaks, which are accurately reproduced from fits to a chirped-damped oscillator function.
From the fits, we have determined that the mean response time of liquid helium upon excitation of the R(1) transition for HOCl is 1 ns, which is 3-4x faster than for the analogous transitions of OCS and CH4
Rotational dispersion results in a relatively small renormalization of the A rotational constant, whereas this effect is not evident for rotations about the b- or c-axes (B constant is renormalized to 43% of its gas phase value).
HOBr?16

AcknowledgementsAcknowledgements
Jäger group (UA)
Xu group (UA)
Marie van Staveren and Prof. V.A. Apkarian (UCI)
Funding: Natural Science and Engineering Research Council of Canada Canada Foundation for Innovation Alberta Science and Research Investments Program
17